Embed Size (px)
Citation preview
ibm.com/redbooks Redpaper
IBM Tivoli Monitoring V5.1.1 ImplementationCertification Study Guide
Budi Darmawan
Explains how to prepare for, install, configure and operate IBM Tivoli Monitoring V5.1.1
Prepares you to take Certification Test 593
Includes sample test questions and answers
Front cover

IBM Tivoli Monitoring V5.1.1 Implementation Certification Study Guide
December 2004
International Technical Support Organization
© Copyright International Business Machines Corporation 2004. All rights reserved.Note to U.S. Government Users Restricted Rights -- Use, duplication or disclosure restricted by GSA ADPSchedule Contract with IBM Corp.
First Edition (December 2004)
This edition applies to Version 5, Release 1, Modification 1 of IBM Tivoli Monitoring (product number 5698-EMN).
Note: Before using this information and the product it supports, read the information in “Notices” on page vii.
Contents
Notices . . . . . . . . . . . . . . . . . . . . . . . . . . . . . . . . . . . . . . . . . . . . . . . . . . . . . . viiTrademarks . . . . . . . . . . . . . . . . . . . . . . . . . . . . . . . . . . . . . . . . . . . . . . . . . . . viii
Preface . . . . . . . . . . . . . . . . . . . . . . . . . . . . . . . . . . . . . . . . . . . . . . . . . . . . . . . ixThe team that wrote this Redpaper . . . . . . . . . . . . . . . . . . . . . . . . . . . . . . . . . . ixBecome a published author . . . . . . . . . . . . . . . . . . . . . . . . . . . . . . . . . . . . . . . . xComments welcome. . . . . . . . . . . . . . . . . . . . . . . . . . . . . . . . . . . . . . . . . . . . . . x
Chapter 1. Familiarizing yourself with this guide . . . . . . . . . . . . . . . . . . . . . 11.1 Certification . . . . . . . . . . . . . . . . . . . . . . . . . . . . . . . . . . . . . . . . . . . . . . . . . 2
1.1.1 Tivoli Enterprise Management Solution: Advanced deployment. . . . . 21.1.2 IBM Tivoli Monitoring 5.1.1: Deployment . . . . . . . . . . . . . . . . . . . . . . 2
1.2 Test objectives . . . . . . . . . . . . . . . . . . . . . . . . . . . . . . . . . . . . . . . . . . . . . . 31.2.1 Prerequisite knowledge for IBM Tivoli Monitoring V5.1.1 . . . . . . . . . . 31.2.2 Planning the implementation of IBM Tivoli Monitoring V5.1.1. . . . . . . 41.2.3 Installation prerequisites of IBM Tivoli Monitoring V5.1.1 . . . . . . . . . . 51.2.4 Installation of IBM Tivoli Monitoring V5.1.1 . . . . . . . . . . . . . . . . . . . . . 61.2.5 Configuration of the IBM Tivoli Monitoring server . . . . . . . . . . . . . . . . 61.2.6 Problem determination for IBM Tivoli Monitoring V5.1.1. . . . . . . . . . . 81.2.7 Operations of IBM Tivoli Monitoring V5.1.1. . . . . . . . . . . . . . . . . . . . . 91.2.8 IBM Tivoli Monitoring Workbench . . . . . . . . . . . . . . . . . . . . . . . . . . . 10
1.3 Resources for preparation. . . . . . . . . . . . . . . . . . . . . . . . . . . . . . . . . . . . . 101.3.1 Courses. . . . . . . . . . . . . . . . . . . . . . . . . . . . . . . . . . . . . . . . . . . . . . . 111.3.2 Publications. . . . . . . . . . . . . . . . . . . . . . . . . . . . . . . . . . . . . . . . . . . . 12
Chapter 2. Basic concepts for IBM Tivoli Monitoring V5.1.1 . . . . . . . . . . . 152.1 Desktop Management Task Force . . . . . . . . . . . . . . . . . . . . . . . . . . . . . . 16
2.1.1 Common Information Model standards . . . . . . . . . . . . . . . . . . . . . . . 162.1.2 Managed Object Format . . . . . . . . . . . . . . . . . . . . . . . . . . . . . . . . . . 162.1.3 Web-Based Enterprise Management initiative . . . . . . . . . . . . . . . . . 16
2.2 Windows Management Instrumentation . . . . . . . . . . . . . . . . . . . . . . . . . . 172.3 Java and JavaBeans . . . . . . . . . . . . . . . . . . . . . . . . . . . . . . . . . . . . . . . . . 172.4 WebSphere Application Server . . . . . . . . . . . . . . . . . . . . . . . . . . . . . . . . . 182.5 Visual Basic and JavaScript . . . . . . . . . . . . . . . . . . . . . . . . . . . . . . . . . . . 19
2.5.1 Visual Basic. . . . . . . . . . . . . . . . . . . . . . . . . . . . . . . . . . . . . . . . . . . . 192.5.2 JavaScript . . . . . . . . . . . . . . . . . . . . . . . . . . . . . . . . . . . . . . . . . . . . . 19
2.6 Database concepts . . . . . . . . . . . . . . . . . . . . . . . . . . . . . . . . . . . . . . . . . . 192.7 IBM Tivoli Management Framework . . . . . . . . . . . . . . . . . . . . . . . . . . . . . 20
2.7.1 Tivoli Management Environment. . . . . . . . . . . . . . . . . . . . . . . . . . . . 20
© Copyright IBM Corp. 2004. All rights reserved. iii
2.7.2 Tivoli desktop . . . . . . . . . . . . . . . . . . . . . . . . . . . . . . . . . . . . . . . . . . 232.7.3 Resources . . . . . . . . . . . . . . . . . . . . . . . . . . . . . . . . . . . . . . . . . . . . . 242.7.4 Policy and policy regions. . . . . . . . . . . . . . . . . . . . . . . . . . . . . . . . . . 252.7.5 Administrator and roles . . . . . . . . . . . . . . . . . . . . . . . . . . . . . . . . . . . 262.7.6 Profiles and profile managers . . . . . . . . . . . . . . . . . . . . . . . . . . . . . . 272.7.7 RDBMS interface module . . . . . . . . . . . . . . . . . . . . . . . . . . . . . . . . . 302.7.8 MDist 2 distribution . . . . . . . . . . . . . . . . . . . . . . . . . . . . . . . . . . . . . . 312.7.9 Command line interface . . . . . . . . . . . . . . . . . . . . . . . . . . . . . . . . . . 33
2.8 IBM Tivoli Monitoring concepts . . . . . . . . . . . . . . . . . . . . . . . . . . . . . . . . . 342.8.1 Integration with the Common Information Model . . . . . . . . . . . . . . . 352.8.2 Resource model . . . . . . . . . . . . . . . . . . . . . . . . . . . . . . . . . . . . . . . . 37
Chapter 3. Planning for IBM Tivoli Monitoring V5.1.1 deployment . . . . . . 393.1 Environment and topology. . . . . . . . . . . . . . . . . . . . . . . . . . . . . . . . . . . . . 403.2 Existing management environment . . . . . . . . . . . . . . . . . . . . . . . . . . . . . . 42
3.2.1 Tivoli Management Framework requirement. . . . . . . . . . . . . . . . . . . 423.2.2 Available installation methods. . . . . . . . . . . . . . . . . . . . . . . . . . . . . . 433.2.3 Hardware requirements. . . . . . . . . . . . . . . . . . . . . . . . . . . . . . . . . . . 44
3.3 Endpoint software verification . . . . . . . . . . . . . . . . . . . . . . . . . . . . . . . . . . 443.4 Health Console planning . . . . . . . . . . . . . . . . . . . . . . . . . . . . . . . . . . . . . . 453.5 Data Warehouse planning. . . . . . . . . . . . . . . . . . . . . . . . . . . . . . . . . . . . . 463.6 Workbench development requirements. . . . . . . . . . . . . . . . . . . . . . . . . . . 46
Chapter 4. Installing IBM Tivoli Monitoring V5.1.1 . . . . . . . . . . . . . . . . . . . 494.1 Migrating from Tivoli Distributed Monitoring V4.1 . . . . . . . . . . . . . . . . . . . 504.2 Installing on an existing Tivoli environment . . . . . . . . . . . . . . . . . . . . . . . . 504.3 Configuring IBM Tivoli Monitoring endpoints. . . . . . . . . . . . . . . . . . . . . . . 54
4.3.1 Java Runtime Environment . . . . . . . . . . . . . . . . . . . . . . . . . . . . . . . . 544.3.2 Windows-based endpoint setup . . . . . . . . . . . . . . . . . . . . . . . . . . . . 54
4.4 Installing the Web Health Console . . . . . . . . . . . . . . . . . . . . . . . . . . . . . . 554.4.1 Installing on a Windows environment . . . . . . . . . . . . . . . . . . . . . . . . 554.4.2 Installing on a UNIX environment . . . . . . . . . . . . . . . . . . . . . . . . . . . 564.4.3 Installing the monitoring modules . . . . . . . . . . . . . . . . . . . . . . . . . . . 57
4.5 Installing IBM Tivoli Monitoring Workbench . . . . . . . . . . . . . . . . . . . . . . . 57
Chapter 5. Configuring IBM Tivoli Monitoring V5.1.1 server. . . . . . . . . . . 595.1 Configuring the Tivoli environment . . . . . . . . . . . . . . . . . . . . . . . . . . . . . . 605.2 Configuring the IBM Tivoli Monitoring profiles. . . . . . . . . . . . . . . . . . . . . . 63
5.2.1 Customizing the cycle time and thresholds. . . . . . . . . . . . . . . . . . . . 655.2.2 Customizing the indications . . . . . . . . . . . . . . . . . . . . . . . . . . . . . . . 655.2.3 Customizing the scheduler . . . . . . . . . . . . . . . . . . . . . . . . . . . . . . . . 675.2.4 Customizing data logging . . . . . . . . . . . . . . . . . . . . . . . . . . . . . . . . . 675.2.5 Customizing parameters . . . . . . . . . . . . . . . . . . . . . . . . . . . . . . . . . . 685.2.6 Customizing a profile. . . . . . . . . . . . . . . . . . . . . . . . . . . . . . . . . . . . . 68
iv IBM Tivoli Monitoring V5.1.1 Implementation Certification Study Guide
5.3 Resource models . . . . . . . . . . . . . . . . . . . . . . . . . . . . . . . . . . . . . . . . . . . 705.4 Historical data collection . . . . . . . . . . . . . . . . . . . . . . . . . . . . . . . . . . . . . . 715.5 Heartbeat function . . . . . . . . . . . . . . . . . . . . . . . . . . . . . . . . . . . . . . . . . . . 73
5.5.1 Endpoint registration . . . . . . . . . . . . . . . . . . . . . . . . . . . . . . . . . . . . . 745.5.2 Heartbeat monitoring. . . . . . . . . . . . . . . . . . . . . . . . . . . . . . . . . . . . . 755.5.3 Viewing the endpoint cache . . . . . . . . . . . . . . . . . . . . . . . . . . . . . . . 765.5.4 Useful commands . . . . . . . . . . . . . . . . . . . . . . . . . . . . . . . . . . . . . . . 77
5.6 TBSM common listener . . . . . . . . . . . . . . . . . . . . . . . . . . . . . . . . . . . . . . . 785.7 Event forwarding to TEC . . . . . . . . . . . . . . . . . . . . . . . . . . . . . . . . . . . . . . 81
5.7.1 Setting up the IBM Tivoli Monitoring V5.1.1 profile . . . . . . . . . . . . . . 815.7.2 Enabling IBM Tivoli Enterprise Console . . . . . . . . . . . . . . . . . . . . . . 82
Chapter 6. Problem determination for IBM Tivoli Monitoring V5.1.1 . . . . 836.1 TMR server logs and traces . . . . . . . . . . . . . . . . . . . . . . . . . . . . . . . . . . . 84
6.1.1 Profile distribution process . . . . . . . . . . . . . . . . . . . . . . . . . . . . . . . . 846.2 Gateway logs and traces. . . . . . . . . . . . . . . . . . . . . . . . . . . . . . . . . . . . . . 84
6.2.1 Heartbeat engine traces . . . . . . . . . . . . . . . . . . . . . . . . . . . . . . . . . . 856.2.2 Task engine trace . . . . . . . . . . . . . . . . . . . . . . . . . . . . . . . . . . . . . . . 866.2.3 Endpoint upcall traces. . . . . . . . . . . . . . . . . . . . . . . . . . . . . . . . . . . . 866.2.4 Request manager trace. . . . . . . . . . . . . . . . . . . . . . . . . . . . . . . . . . . 876.2.5 Profile core trace . . . . . . . . . . . . . . . . . . . . . . . . . . . . . . . . . . . . . . . . 88
6.3 Endpoint logs. . . . . . . . . . . . . . . . . . . . . . . . . . . . . . . . . . . . . . . . . . . . . . . 886.3.1 Common endpoint logs . . . . . . . . . . . . . . . . . . . . . . . . . . . . . . . . . . . 886.3.2 Windows endpoint logs . . . . . . . . . . . . . . . . . . . . . . . . . . . . . . . . . . . 896.3.3 Non-Windows endpoint logs . . . . . . . . . . . . . . . . . . . . . . . . . . . . . . . 91
6.4 Web Health Console logs and traces . . . . . . . . . . . . . . . . . . . . . . . . . . . . 946.4.1 Modifying Web Health Console tracing parameters . . . . . . . . . . . . . 946.4.2 WebSphere tracing . . . . . . . . . . . . . . . . . . . . . . . . . . . . . . . . . . . . . . 95
6.5 Tools . . . . . . . . . . . . . . . . . . . . . . . . . . . . . . . . . . . . . . . . . . . . . . . . . . . . . 966.5.1 Tool to generate XML file . . . . . . . . . . . . . . . . . . . . . . . . . . . . . . . . . 966.5.2 Serviceability tasks . . . . . . . . . . . . . . . . . . . . . . . . . . . . . . . . . . . . . . 96
6.6 Helpful troubleshooting procedures. . . . . . . . . . . . . . . . . . . . . . . . . . . . . . 986.6.1 Profile distribution problems . . . . . . . . . . . . . . . . . . . . . . . . . . . . . . . 986.6.2 IBM Tivoli Monitoring engine troubleshooting . . . . . . . . . . . . . . . . . . 996.6.3 Resolving resource model problems. . . . . . . . . . . . . . . . . . . . . . . . . 99
Chapter 7. Operating IBM Tivoli Monitoring V5.1.1 . . . . . . . . . . . . . . . . . 1017.1 MDist profile distribution . . . . . . . . . . . . . . . . . . . . . . . . . . . . . . . . . . . . . 102
7.1.1 MDist2 support . . . . . . . . . . . . . . . . . . . . . . . . . . . . . . . . . . . . . . . . 1027.1.2 Profile distribution using MDist2 . . . . . . . . . . . . . . . . . . . . . . . . . . . 1027.1.3 TMF MDist2 commands . . . . . . . . . . . . . . . . . . . . . . . . . . . . . . . . . 104
7.2 Maintaining the Tivoli environment . . . . . . . . . . . . . . . . . . . . . . . . . . . . . 1057.2.1 IBM Tivoli Monitoring V5.1.1 command line . . . . . . . . . . . . . . . . . . 105
Contents v
7.2.2 Heartbeat maintenance. . . . . . . . . . . . . . . . . . . . . . . . . . . . . . . . . . 1067.2.3 Managing profiles . . . . . . . . . . . . . . . . . . . . . . . . . . . . . . . . . . . . . . 1077.2.4 Managing resource models. . . . . . . . . . . . . . . . . . . . . . . . . . . . . . . 107
7.3 Web Health Console usage. . . . . . . . . . . . . . . . . . . . . . . . . . . . . . . . . . . 1087.3.1 Logging on to the Web Health Console . . . . . . . . . . . . . . . . . . . . . 1087.3.2 The Web Health Console main view . . . . . . . . . . . . . . . . . . . . . . . . 1127.3.3 The Endpoint List View . . . . . . . . . . . . . . . . . . . . . . . . . . . . . . . . . . 1137.3.4 The Resource Model List View . . . . . . . . . . . . . . . . . . . . . . . . . . . . 116
Chapter 8. IBM Tivoli Monitoring Workbench . . . . . . . . . . . . . . . . . . . . . . 1258.1 Using the Workbench . . . . . . . . . . . . . . . . . . . . . . . . . . . . . . . . . . . . . . . 1268.2 Elements of a resource model. . . . . . . . . . . . . . . . . . . . . . . . . . . . . . . . . 1288.3 Looking at PhysicalDiskModel. . . . . . . . . . . . . . . . . . . . . . . . . . . . . . . . . 131
8.3.1 Properties of PhysicalDiskModel. . . . . . . . . . . . . . . . . . . . . . . . . . . 1318.3.2 Dynamic model element of PhysicalDiskModel . . . . . . . . . . . . . . . 1348.3.3 Event element of PhysicalDiskModel . . . . . . . . . . . . . . . . . . . . . . . 1378.3.4 Threshold element of PhysicalDiskModel . . . . . . . . . . . . . . . . . . . . 1408.3.5 Logging element of PhysicalDiskModel . . . . . . . . . . . . . . . . . . . . . 1428.3.6 Decision tree script of PhysicalDiskModel . . . . . . . . . . . . . . . . . . . 144
8.4 Working with a resource model in Workbench . . . . . . . . . . . . . . . . . . . . 149
Appendix A. Sample test questions . . . . . . . . . . . . . . . . . . . . . . . . . . . . . 151Sample test questions . . . . . . . . . . . . . . . . . . . . . . . . . . . . . . . . . . . . . . . . . . 152Answers to sample test questions . . . . . . . . . . . . . . . . . . . . . . . . . . . . . . . . . 156
Related publications . . . . . . . . . . . . . . . . . . . . . . . . . . . . . . . . . . . . . . . . . . 161IBM Redbooks . . . . . . . . . . . . . . . . . . . . . . . . . . . . . . . . . . . . . . . . . . . . . . . . 161Other publications . . . . . . . . . . . . . . . . . . . . . . . . . . . . . . . . . . . . . . . . . . . . . 161Online resources . . . . . . . . . . . . . . . . . . . . . . . . . . . . . . . . . . . . . . . . . . . . . . 162How to get IBM Redbooks . . . . . . . . . . . . . . . . . . . . . . . . . . . . . . . . . . . . . . . 162Help from IBM . . . . . . . . . . . . . . . . . . . . . . . . . . . . . . . . . . . . . . . . . . . . . . . . 162
Index . . . . . . . . . . . . . . . . . . . . . . . . . . . . . . . . . . . . . . . . . . . . . . . . . . . . . . . 163
vi IBM Tivoli Monitoring V5.1.1 Implementation Certification Study Guide
Notices
This information was developed for products and services offered in the U.S.A.
IBM may not offer the products, services, or features discussed in this document in other countries. Consult your local IBM representative for information on the products and services currently available in your area. Any reference to an IBM product, program, or service is not intended to state or imply that only that IBM product, program, or service may be used. Any functionally equivalent product, program, or service that does not infringe any IBM intellectual property right may be used instead. However, it is the user's responsibility to evaluate and verify the operation of any non-IBM product, program, or service.
IBM may have patents or pending patent applications covering subject matter described in this document. The furnishing of this document does not give you any license to these patents. You can send license inquiries, in writing, to: IBM Director of Licensing, IBM Corporation, North Castle Drive Armonk, NY 10504-1785 U.S.A.
The following paragraph does not apply to the United Kingdom or any other country where such provisions are inconsistent with local law: INTERNATIONAL BUSINESS MACHINES CORPORATION PROVIDES THIS PUBLICATION "AS IS" WITHOUT WARRANTY OF ANY KIND, EITHER EXPRESS OR IMPLIED, INCLUDING, BUT NOT LIMITED TO, THE IMPLIED WARRANTIES OF NON-INFRINGEMENT, MERCHANTABILITY OR FITNESS FOR A PARTICULAR PURPOSE. Some states do not allow disclaimer of express or implied warranties in certain transactions, therefore, this statement may not apply to you.
This information could include technical inaccuracies or typographical errors. Changes are periodically made to the information herein; these changes will be incorporated in new editions of the publication. IBM may make improvements and/or changes in the product(s) and/or the program(s) described in this publication at any time without notice.
Any references in this information to non-IBM Web sites are provided for convenience only and do not in any manner serve as an endorsement of those Web sites. The materials at those Web sites are not part of the materials for this IBM product and use of those Web sites is at your own risk.
IBM may use or distribute any of the information you supply in any way it believes appropriate without incurring any obligation to you.
Information concerning non-IBM products was obtained from the suppliers of those products, their published announcements or other publicly available sources. IBM has not tested those products and cannot confirm the accuracy of performance, compatibility or any other claims related to non-IBM products. Questions on the capabilities of non-IBM products should be addressed to the suppliers of those products.
This information contains examples of data and reports used in daily business operations. To illustrate them as completely as possible, the examples include the names of individuals, companies, brands, and products. All of these names are fictitious and any similarity to the names and addresses used by an actual business enterprise is entirely coincidental.
COPYRIGHT LICENSE: This information contains sample application programs in source language, which illustrates programming techniques on various operating platforms. You may copy, modify, and distribute these sample programs in any form without payment to IBM, for the purposes of developing, using, marketing or distributing application programs conforming to the application programming interface for the operating platform for which the sample programs are written. These examples have not been thoroughly tested under all conditions. IBM, therefore, cannot guarantee or imply reliability, serviceability, or function of these programs. You may copy, modify, and distribute these sample programs in any form without payment to IBM for the purposes of developing, using, marketing, or distributing application programs conforming to IBM's application programming interfaces.
© Copyright IBM Corp. 2004. All rights reserved. vii
TrademarksThe following terms are trademarks of the International Business Machines Corporation in the United States, other countries, or both:
Eserver®ibm.com®iSeries™i5/OS™pSeries®z/OS®zSeries®AIX®DB2®
Informix®IBM®OS/2®OS/390®OS/400®PartnerWorld®PowerPC®Redbooks™Redbooks (logo) ™
S/390®Tivoli Enterprise™Tivoli Enterprise Console®Tivoli Management Environment®Tivoli®TME®WebSphere®
The following terms are trademarks of other companies:
Java and all Java-based trademarks and logos are trademarks or registered trademarks of Sun Microsystems, Inc. in the United States, other countries, or both.
Microsoft, Windows, Windows NT, and the Windows logo are trademarks of Microsoft Corporation in the United States, other countries, or both.
Intel, Intel Inside (logos), MMX, and Pentium are trademarks of Intel Corporation in the United States, other countries, or both.
UNIX is a registered trademark of The Open Group in the United States and other countries.
Linux is a trademark of Linus Torvalds in the United States, other countries, or both.
Other company, product, and service names may be trademarks or service marks of others.
viii IBM Tivoli Monitoring V5.1.1 Implementation Certification Study Guide
Preface
This IBM® Redpaper prepares you with the necessary knowledge to help you complete Certification Test 593: IBM Tivoli Monitoring V5.1.1 Implementation. This test leads to certification for Tivoli® Certified Deployment Professional for IBM Tivoli Monitoring.
The scope of the certification tests your ability to demonstrate the following areas of expertise required for IBM Tivoli Monitoring V5.1.1:
� Prerequisite knowledge for IBM Tivoli Monitoring� Planning the implementation� Installation prerequisites � The installation process� Configuration of the IBM Tivoli Monitoring server� Problem determination� General operations � IBM Tivoli Monitoring Workbench
You can find the information that you need about these topics all in this IBM Redpaper. Plus, you have a chance to test your knowledge using the sample test questions at the back of the paper.
The team that wrote this RedpaperThis Redpaper was produced by a team of specialists from around the world working at the International Technical Support Organization (ITSO), Austin Center.
Budi Darmawan is a Tivoli Project Leader at the ITSO, Austin Center. He writes extensively and teaches IBM classes worldwide on all areas of systems management. Before joining the ITSO six years ago, Budi worked in Integrated Technology Services, IBM Indonesia as lead implementer and solution architect. He currently specializes in general systems management area, especially in availability and operation management and business service management.
Thanks to the following people for their contributions to this project:
� Authors of IBM Tivoli Monitoring Version 5.1: Advanced Resource Monitoring, SG24-5519
– Murilo Goncalves Aguiar– Jamie Carl
© Copyright IBM Corp. 2004. All rights reserved. ix
– Stephen Hochstetler– Ghufran Shah– Jason Shamroski– John Willis
� IBM Software, Tivoli Systems
– Benjamin Briggs– Elizabeth Purzer
Become a published authorJoin us for a two- to six-week residency program! Help write an IBM Redbook dealing with specific products or solutions, while getting hands-on experience with leading-edge technologies. You'll team with IBM technical professionals, Business Partners and/or customers.
Your efforts will help increase product acceptance and customer satisfaction. As a bonus, you'll develop a network of contacts in IBM development labs, and increase your productivity and marketability.
Find out more about the residency program, browse the residency index, and apply online at:
ibm.com/redbooks/residencies.html
Comments welcomeYour comments are important to us!
We want our papers to be as helpful as possible. Send us your comments about this Redpaper or other Redbooks™ in one of the following ways:
� Use the online Contact us review redbook form found at:
ibm.com/redbooks
� Send your comments in an email to:
� Mail your comments to:
IBM Corporation, International Technical Support OrganizationDept. 0SJB Building 003 Internal Zip 283411400 Burnet RoadAustin, Texas 78758-3493
x IBM Tivoli Monitoring V5.1.1 Implementation Certification Study Guide
Chapter 1. Familiarizing yourself with this guide
This IBM Redpaper serves as a guide to prepare you for Certification Test 593: IBM Tivoli Monitoring V5.1.1 Implementation. This chapter explains what the test covers and its objectives. It also points you to other resources to help you prepare for the test.
1
© Copyright IBM Corp. 2004. All rights reserved. 1
1.1 Certification This test is part of the certification for:
� IBM Certified Advanced Deployment Professional –Tivoli Enterprise™ Management Solution 2004
� IBM Certified Deployment Professional – IBM Tivoli Monitoring 5.1.1
The following sections describe these certifications.
1.1.1 Tivoli Enterprise Management Solution: Advanced deploymentA person who has earned IBM Certified Advanced Deployment Professional – Tivoli Enterprise Management Solutions 2004 certification has demonstrated a higher level of implementation knowledge and skill both in breadth and in depth in the IBM Tivoli Enterprise Management solutions area. To attain the IBM Certified Advanced Deployment Professional – Tivoli Enterprise Management Solutions 2004 certification, candidates must pass five required tests.
The core requirements for certification include the following three tests:
� Test 593: IBM Tivoli Monitoring 5.1.1 Implementation� Test 594: IBM Tivoli Enterprise Console® V3.9 Implementation � Test 786: IBM Tivoli Configuration Manager V4.2 Implementation
This certification also requires two of the following tests:
� Test 340: WebSphere® Application Server V5.0, Basic Administration
� Test 701: DB2® UDB V8.1 for Linux®, UNIX®, and Windows® Database Administration
� Test 773: IBM Tivoli Data Warehouse V1.2 Implementation
� Test 778: IBM Tivoli License Manager V2.1 Implementation
� Test 779: IBM Tivoli Workload Scheduler V8.2 Implementation
� Test 798: IBM Tivoli Monitoring for Transaction Performance V5.2 Implementation
1.1.2 IBM Tivoli Monitoring 5.1.1: DeploymentAn IBM Certified Deployment Professional – Tivoli Monitoring V5.1.1 is a technical professional who is responsible for planning, installation, configuration, operations, administration, and maintenance of an IBM Tivoli Monitoring V5.1.1 solution. This individual is expected to perform these tasks with limited assistance from peers, product documentation, and support resources.
2 IBM Tivoli Monitoring V5.1.1 Implementation Certification Study Guide
To attain the IBM Certified Deployment Professional – Tivoli Monitoring V5.1.1 certification, candidates must pass one test.
The required prerequisites for the test are that you must have:
� A strong working knowledge of Tivoli Framework V3.7x or higher � A basic understanding of the operating system and networking concepts � A working knowledge of TCP/IP � A basic understanding of JavaScript
Additional recommended prerequisites for the test include having:
� A working knowledge of Java™ Runtime Environment (JRE), JavaServer Pages (JSP), and Extensible Markup Language (XML)
� A basic understanding of Common Information Model (CIM) and Microsoft® Windows Management Instrumentation (WMI)
� A working knowledge of shell and Perl scripting
� A basic understanding of Web servers
� A basic understanding of Java scripting and Visual Basic or equivalent programming experience
� A basic understanding of database concepts
1.2 Test objectivesThis section explains the objectives of the tests as well as the required knowledge that you need to pass the test questions. Each objective is discussed in more detail in the subsequent chapters of this paper.
1.2.1 Prerequisite knowledge for IBM Tivoli Monitoring V5.1.1Given a client requirement to install IBM Tivoli Monitoring V5.1.1, you must demonstrate your knowledge and understanding of the fundamentals of deploying and maintaining IBM Tivoli Monitoring V5.1.1. This knowledge requires an emphasis on a basic understanding of Distributed Management Task Force (DMTF), CIM, Managed Object Format (MOF), Web-Based Enterprise Management (WBEM), WMI, Java, JavaBeans, WebSphere, Visual Basic, JavaScript, database concepts, and Tivoli Framework 3.7x. Chapter 2, “Basic concepts for IBM Tivoli Monitoring V5.1.1” on page 15, discusses this objective further.
Chapter 1. Familiarizing yourself with this guide 3
1.2.2 Planning the implementation of IBM Tivoli Monitoring V5.1.1This objective relates to items that are needed to help you decide on various configuration options before you actually install and deploy IBM Tivoli Monitoring V5.1.1. Chapter 3, “Planning for IBM Tivoli Monitoring V5.1.1 deployment” on page 39, provides a more detailed discussion about this objective. This objective requires you to know about the following items:
� Given a client’s current server specifications, application environment, and network diagrams, you must be able to determine the client’s topology to identify their requirements, resources to be monitored, and Tivoli integration points such as TEC, Tivoli Business Systems Manager (TBSM), and TEDW. Specifically, you must be able to perform the following steps:
a. Identify machines to be managed. b. Identify business processes. c. Identify applications to be managed. d. Identify Tivoli integration points.
� Given an architected Tivoli solution, you must be able to perform an analysis of the existing environment to determine the necessary IBM Tivoli Monitoring V5.1.1 installation methods and hardware requirements to implement the solution. Specifically, you must be able to analyze the existing environment.
� Given the IBM Tivoli Monitoring V5.1.1 documentation, you must be able to plan the deployment of the Health Console to create a deployment plan and determine the hardware requirements. Specifically, you must be able to:
a. Determine Health Console location and if other Web servers exist. b. Determine ports to use. c. Determine CPU and disk space. d. Define Tivoli Framework managed node.
� Given the network and database environment, you must be able to determine the TEDW data collection requirements to create a deployment plan and determine the database size and hardware requirements. Specifically, you must be able to:
a. Define the RDBMS interface module (RIM) location. b. Determine the amount of data.
� Given a list of resources to be managed, you must be able to determine the IBM Tivoli Monitoring V5.1.1 Workbench development requirements to obtain a list of installation destinations and hardware requirements. Specifically, you must be able to:
a. Determine Workbench workstations. b. List framework requirements. c. Determine software levels.
4 IBM Tivoli Monitoring V5.1.1 Implementation Certification Study Guide
1.2.3 Installation prerequisites of IBM Tivoli Monitoring V5.1.1This objective relates to the prerequisites that must be in place before you install IBM Tivoli Monitoring V5.1.1 and how to check them. Chapter 3, “Planning for IBM Tivoli Monitoring V5.1.1 deployment” on page 39, explains this objective further. This objective requires you to know about the following items:
� Given an existing Tivoli environment and IBM Tivoli Monitoring V5.1.1 requirements, you must be able to validate the managed node prerequisites so that you can determine a list of hardware and software upgrades. Specifically, you must be able to:
a. Compare hardware requirements with existing hardware. b. Compare operating system software requirements with existing software.c. Compare framework software requirements. d. Verify framework roles for IBM Tivoli Monitoring V5.1.1 installation. e. Validate Structured Query Language (SQL) client levels for the data
collection database. f. Validate SQL client access to the data collection database.
� Given an existing Tivoli environment and IBM Tivoli Monitoring V5.1.1 requirements, you must be able to validate the endpoint prerequisites so that you can determine a list of hardware and software upgrades. Specifically, you must be able to:
a. Verify the JRE requirements. b. Verify WMI, Open Database Connectivity (ODBC), and CScript
requirements. c. Verify Simple Network Management Protocol (SNMP) and Diskperf
requirements. d. Verify operating system levels. e. Validate the LCF levels.
� Given IBM Tivoli Monitoring V5.1.1 Health Console requirements, you must be able to validate the Health Console prerequisites so that you can determine a list of hardware and software upgrades. Specifically, you must be able to:
a. Verify that Internet Explorer 6.0 or later is installed on a client. b. Verify the operating system levels. c. Verify network connectivity to the managed node. d. Verify if there are other Web servers. e. If WebSphere Application Server exists, verify the version.
� Given the IBM Tivoli Monitoring V5.1.1 Workbench requirements, you must be able to validate the Workbench prerequisites so that you can determine a list of hardware and software upgrades. Specifically, you must be able to:
a. Verify the operating system levels. b. Verify that WMI is installed.
Chapter 1. Familiarizing yourself with this guide 5
1.2.4 Installation of IBM Tivoli Monitoring V5.1.1This objective relates to installing IBM Tivoli Monitoring V5.1.1. Chapter 4, “Installing IBM Tivoli Monitoring V5.1.1” on page 49, offers a more detailed discussion about this objective.
� Given the IBM Tivoli Monitoring V5.1.1 media and an existing Distributed Monitoring Advanced Edition V4.1 or IBM Tivoli Monitoring V5.1.1 installation, you must be able to upgrade to the IBM Tivoli Monitoring V5.1.1 core components. Specifically, you must be able to:
a. Determine which components to install. b. List all upgrade scenarios. c. Determine the appropriate installation methods (Software Installation
Service (SIS), command line interface (CLI), etc.). d. Perform the upgrade.
� Given the IBM Tivoli Monitoring V5.1.1 media and an existing Tivoli environment, you must be able to install the IBM Tivoli Monitoring V5.1.1 core components. Specifically, you must be able to:
a. Determine which components to install. b. Define the installation method (SIS, CLI, etc.). c. Perform the installation.
� Given a list of software prerequisites for IBM Tivoli Monitoring V5.1.1 endpoints, you must be able to install and configure them to support operation of the IBM Tivoli Monitoring V5.1.1 engine. Specifically, you must be able to:
a. Determine the source for ODBC, WMI, CScript, and JRE installation images.
b. Retrieve ODBC, WMI, and CScript installation images. c. Install the endpoint prerequisites. d. Verify the endpoint prerequisite installation. e. Use DMLinkJRE to define the JRE location.
� Given the IBM Tivoli Monitoring V5.1.1 Web Health Console media, install the Health Console components. Specifically, you must be able to:
a. Determine installation method. b. Install Health Console. c. Verify the installation of Health Console.
� Given the IBM Tivoli Monitoring V5.1.1 Workbench media, you must be able to install Workbench.
1.2.5 Configuration of the IBM Tivoli Monitoring serverThis objective relates to actions to perform so you can configure the IBM Tivoli Monitoring server and enable the interfaces for further monitoring actions.
6 IBM Tivoli Monitoring V5.1.1 Implementation Certification Study Guide
Chapter 5, “Configuring IBM Tivoli Monitoring V5.1.1 server” on page 59, offers a more detailed discussion about this objective.
� Given an existing Tivoli environment, you must be able to assign the appropriate roles and create the policy regions and profile manager to support IBM Tivoli Monitoring V5.1.1. Specifically, you must be able to:
a. Configure the administrator roles. b. Create the policy regions. c. Configure the policy regions (managed resources, “tmw2k”). d. Create the profile managers.
� Given the client’s monitoring and escalation requirements, you must be able to configure IBM Tivoli Monitoring V5.1.1 profiles to support the forwarding of events to enterprise applications. Specifically, you must be able to:
a. Configure the default distribution options. b. Enable TEC forwarding and TBSM.
� Given an IBM Tivoli Monitoring V5.1.1 profile, you must be able to add and configure resource models so that resource models may be distributed. Specifically, you must be able to:
a. Enable Diskperf. b. Install SNMP and Network Monitoring Agent if required. c. Add the required resource models.
� Given a list of gateways and assigned endpoints, you must be able to perform the steps to allow data collection. Specifically, you must be able to:
a. Create IBM Tivoli Monitoring V5.1.1 DB. b. Create and configure RIM. c. Configure the collection interval. d. Define the RIM object to use.
� Given a list of gateways and assigned endpoints, you must be able to configure and start the heartbeat function to monitor IBM Tivoli Monitoring V5.1.1 functionality on the endpoint. Specifically, you must be able to:
a. Configure the heartbeat interval. b. View the heartbeat interval. c. Configure heartbeat TEC forwarding. d. Configure the heartbeat restart.
� Given a list of gateways and assigned endpoints, you must be able to configure the TBSM common listener to send data to TBSM. Specifically, you must be able to define the TBSM server to the gateway.
Chapter 1. Familiarizing yourself with this guide 7
� Given a list of resource models and a working TEC environment, you must be able to configure TEC so that it can receive events from IBM Tivoli Monitoring V5.1.1. Specifically, you must be able to:
a. Load the TEC rules.b. Load the TEC classes. c. Deploy ACF to the gateway. d. Define the clearing event.
1.2.6 Problem determination for IBM Tivoli Monitoring V5.1.1This objective relates to troubleshooting and the problem determination action that you can perform on the server, gateway, and endpoint for IBM Tivoli Monitoring V5.1.1 problems. Refer to Chapter 6, “Problem determination for IBM Tivoli Monitoring V5.1.1” on page 83, for details about this objective.
� Given an IBM Tivoli Monitoring V5.1.1 profile distribution problem, you must be able to analyze the problem to resolve the issue or provide adequate details to Tivoli Support. Specifically, you must be able to:
a. Adjust the tracing or logging levels. b. View the trace or log files. c. Use Mdist2 to track and diagnose the distribution issues. d. Collect the endpoint logs.
� Given an IBM Tivoli Monitoring V5.1.1 engine problem, you must be able to analyze the problem to resolve the issue or provide adequate details to Tivoli Support. Specifically, you must be able to:
a. View the log or trace files. b. Adjust the trace or logging levels. c. Stop, start, clear, or uninstall the IBM Tivoli Monitoring V5.1.1 engine. d. Collect the endpoint logs.
� Given an IBM Tivoli Monitoring V5.1.1 resource model problem, you must be able to analyze the problem to resolve the issue or provide adequate details to Tivoli Support. Specifically, you must be able to:
a. View the log or trace files. b. Adjust the tracing or logging levels. c. Collect the endpoint logs. d. Clear, stop, or start the resource model or profile.
� Given an IBM Tivoli Monitoring V5.1.1 data collection problem, you must be able to analyze the problem to resolve the issue or provide adequate details to Tivoli Support. Specifically, you must be able to:
a. View the log or trace files. b. Adjust the tracing or logging levels. c. Use RIM tracing to diagnose database issues.
8 IBM Tivoli Monitoring V5.1.1 Implementation Certification Study Guide
� Given an IBM Tivoli Monitoring V5.1.1 Health Console problem, you must be able to analyze the problem to resolve the issue or provide adequate details to Tivoli Support. Specifically, you must be able to:
a. View the log or trace files. b. Adjust the tracing or logging levels.
1.2.7 Operations of IBM Tivoli Monitoring V5.1.1This objective relates to profile and monitoring management of IBM Tivoli Monitoring V5.1.1 and its various facilities including using the Web Health Console. Chapter 7, “Operating IBM Tivoli Monitoring V5.1.1” on page 101, provides greater detail about this objective.
� Given an IBM Tivoli Monitoring V5.1.1 profile, you must be able to perform a distribution and monitor its progress. Specifically, you must be able to:
a. Distribute a profile. b. Monitor the distribution using MDist2. c. Manage the distribution using MDist2.
� Given an existing IBM Tivoli Monitoring V5.1.1 environment, you must be able to use the CLI to manage the IBM Tivoli Monitoring V5.1.1 engine. Specifically, you must be able to:
a. Use the wdmlseng command to check the endpoint. b. Use the wdmeng command to start or stop the resource models. c. Use the wdmcmd command to start or stop the engine.
� Given an existing IBM Tivoli Monitoring V5.1.1 environment, you must be able to use the CLI to manage the IBM Tivoli Monitoring V5.1.1 gateway processes. Specifically, you must be able to:
a. Display endpoints uploaded to TBSM. b. Perform the TBSM upload. c. Use the wdmmn command to start or stop the gateway processes. d. Use the wdmmncache command to list or clear the registered endpoints.
� Given a successful implementation of the IBM Tivoli Monitoring V5.1.1 Web Health Console, you must be able to use the Health Console to view historical data, determine endpoint health, and administer resource models. Specifically, you must be able to:
a. Log on to DMWHC from an Internet browser. b. Add or edit the endpoint list. c. Browse by endpoint. d. Browse by resource model. e. Stop or start the resource model. f. View historical date or in real time. g. Change the graph type.
Chapter 1. Familiarizing yourself with this guide 9
� Given an IBM Tivoli Monitoring V5.1.1 profile, you must be able use the CLI to maintain and modify the profile. Specifically, you must be able to:
a. Use the wdmdumpprf and wdmloadprf commands to maintain IBM Tivoli Monitoring V5.1.1 profiles.
b. Use the wdmeditprf command to maintain IBM Tivoli Monitoring V5.1.1 profiles.
� Given an IBM Tivoli Monitoring V5.1.1 resource model, you must be able to use the CLI to add or remove the resource model from the IBM Tivoli Monitoring V5.1.1 environment. Specifically, you must be able to use the wdmrm command to load and manage resource models.
1.2.8 IBM Tivoli Monitoring Workbench This objective relates to the usage of IBM Tivoli Monitoring V5.1.1 Workbench that allows you to create and modify the resource model. Chapter 8, “IBM Tivoli Monitoring Workbench” on page 125, discusses this objective in more detail.
� Given a set of monitoring requirements, you must be able to use the IBM Tivoli Monitoring V5.1.1 Workbench to create or customize a resource model. Specifically, you must be able to:
a. Understand the components of a resource model.b. Build a resource model using Workbench.
� Given an existing DM Classic V3.7 environment, you must be able to perform the steps necessary to migrate the monitors to IBM Tivoli Monitoring V5.1.1 resource models. Specifically, you must be able to:
a. Use SentryAnalyser to create a mapping report.b. Extract the DM Classic V3.7 collection definition. c. Create a resource model to encapsulate the DM Classic V3.7 probe.
1.3 Resources for preparationSeveral courses and publications are offered to help you prepare for the certification tests. Before you take a certification test, we recommend that you take a course, although this is not required. If you want to purchase Web-based training courses or are unable to locate a Web-based course or classroom course at the time and location you desire, contact one of our delivery management teams:
� Americas: [email protected]� EMEA: [email protected]� AP: [email protected]
10 IBM Tivoli Monitoring V5.1.1 Implementation Certification Study Guide
1.3.1 Courses Course names, course numbers, or both vary depending on the education delivery arm used in each geography. Refer to the Tivoli software education Web site to find the appropriate course and education delivery vendor for each geography:
http://www-306.ibm.com/software/tivoli/education/
For general training information, see the IBM IT Training Web site at:
http://ibm.com/training
Course IBM Tivoli Monitoring 5.1 IBM Tivoli Monitoring is an intelligent tool that provides IT administrators the capability to closely monitor the status and performance of mission-critical distributed applications and computing resources. This course provides the knowledge and skills needed to install, configure, operate, customize, and troubleshoot IBM Tivoli Monitoring 5.1.
Course duration 12 hours (self paced)
Course number Course numbers vary depending on the education delivery arm used in each geography.
Geo education page Worldwide schedules available at the Tivoli software education site.
Note: Course offerings are continuously added and updated. If you do not see the course or courses that are listed in the following sections for your geography, contact the delivery management team by e-mail as specified in the previous section.
Note: This course is not approved for IBM PartnerWorld® You-Pass, We-Pay.
Chapter 1. Familiarizing yourself with this guide 11
Course IBM Tivoli Monitoring 5.1 IBM Tivoli Monitoring is an efficient, reliable, automated tool that provides IT administrators the capabilities to closely monitor the status and performance of mission-critical distributed applications and computing resources. Gain the knowledge and skills needed to configure, operate, customize, and troubleshoot IBM Tivoli Monitoring. Included are multiple opportunities for you to practice your skills in a lab environment. A series of carefully constructed hands-on activities allows you to immediately reinforce the important lessons in this course.
Course duration 2 days
Course number (TM230) Course numbers vary depending on the education delivery arm used in each geography.
Geo education page Worldwide schedules are available at the Tivoli software education Web site.
1.3.2 Publications Before you take Certification Test 593: IBM Tivoli Monitoring V5.1.1 Implementation, we recommend that you read the IBM Tivoli Monitoring library manuals and IBM Redbooks listed in the following sections. You may order these publications using any of the following methods:
� Accessing IBM Publications Center on the Web at:
http://www.ibm.com/shop/publications/order
� Calling IBM Direct Publications at 1-800-879-2755 (U.S.) 1-800-426-4968 (Canada)
� Purchasing from any non-IBM bookstore
For additional ordering information, see “Related publications” on page 161.
IBM Tivoli Monitoring product manualsYou may want to refer to the following manuals:
� IBM Tivoli Monitoring Release Notes Version 5.1.1, GI10-5797
� IBM Tivoli Monitoring Resource Model Reference Version 5.1, SH19-4570
� IBM Tivoli Monitoring User’s Guide Version 5.1.1, SH19-4569
� IBM Tivoli Monitoring Workbench User’s Guide Version 5.1.1, SH19-4571
Note: This course is approved for IBM PartnerWorld You-Pass, We-Pay.
12 IBM Tivoli Monitoring V5.1.1 Implementation Certification Study Guide
IBM Tivoli Monitoring RedbooksConsult the following IBM Redbooks regarding IBM Tivoli Monitoring:
� IBM Tivoli Monitoring Version 5.1.1 Creating Resource Models and Providers, SG24-6900 (ISBN 0738453102)
This IBM Redbook focuses on using the IBM Tivoli Monitoring Workbench to build resource models that use existing ILT providers and custom ILT Java providers. You learn how to create a custom Instrumentation Library Type (ILT) provider using the supplied Java templates to examine and provide data to IBM Tivoli Monitoring for analysis within the resource model that you created through the IBM Tivoli Monitoring Workbench.
The IBM Tivoli Monitoring Workbench is used to develop, debug, and package resource models for IBM Tivoli Monitoring. You learn how to use the step-by-step wizards provided by the IBM Tivoli Monitoring Workbench to create resource models to monitor any number of your IT resources, including operating systems, databases, hardware, and networking resources and applications.
In addition, you learn about the CIM used to store metrics and how to collect data stored in a CIM format. Upon completion, you will be able to create, test, and deploy monitoring solutions quickly and efficiently to create an autonomic environment.
� IBM Tivoli Monitoring Version 5.1: Advanced Resource Monitoring, SG24-5519 (ISBN 0738426938)
This redbook updates and unifies both Tivoli Distributed Monitoring (Advanced Edition) 4.1 Redbooks into one redbook. This includes both monitoring and Workbench software. This redbook proves invaluable to Tivoli system administrators who are migrating from earlier releases of Tivoli Distributed Monitoring. Various examples of creating resource models to replace custom monitors are included.
Chapter 1. Familiarizing yourself with this guide 13

14 IBM Tivoli Monitoring V5.1.1 Implementation Certification Study Guide
Chapter 2. Basic concepts for IBM Tivoli Monitoring V5.1.1
This chapter discusses the necessary concepts of IBM Tivoli Monitoring V5.1.1. It provides the prerequisite and fundamental knowledge that you need to deploy and maintain IBM Tivoli Monitoring V5.1.1.
2
© Copyright IBM Corp. 2004. All rights reserved. 15
2.1 Desktop Management Task ForceThe Distributed Management Task Force, Inc. (DMTF) provides systems management specifications for the standardization of managing an IT environment. It provides industry standards for systems management of back-office environments and Web-services based environments.
The standards are platform-independent and not aligned to a specific technology implementation. They include information models, control protocols, and management services specifications.
For more information about DMTF, see their Web site at:
http://www.dmtf.org
The following sections provide some specifications from DMTF that are used by IBM Tivoli Monitoring V5.1.1.
2.1.1 Common Information Model standardsThe Common Information Model (CIM) defines the format of system management information. It includes a specification about how the information should be written. And it includes a base data structure (schema) for what should be defined.
The structure is extensible for any implementation-specific information as indicated in the specification. This CIM-based common definition allows different products and platforms to exchange management information seamlessly.
2.1.2 Managed Object FormatManaged Object Format (MOF) is the format for CIM-based information. It is based on the Interface Definition Language (IDL) from the Object Management Group. This allows for the definition of object classes and instances in plain text format to provide readability for both the human reader and computer parsing. MOF-based files can be edited by any text editor.
2.1.3 Web-Based Enterprise Management initiativeWeb-Based Enterprise Management (WBEM) extends systems management to include Web-based management. Since this is a standard developed by DMTF, it is primarily based on the CIM data model.
The WBEM provides additional specification for XML encoding for CIM, called xmlCIM. And it provides specification for transporting the CIM information over
16 IBM Tivoli Monitoring V5.1.1 Implementation Certification Study Guide
HTTP. The xmlCIM specification defines the XML elements in a standard Document Type Definition (DTD) format. It represents CIM classes and instances, not in MOF format, but XML. The XML format allows easier transport over HTTP because it is a natural extension to the HTML format.
2.2 Windows Management InstrumentationMicrosoft implemented WBEM on Microsoft Windows platform in Windows Management Instrumentation (WMI). As we discuss in 2.1, “Desktop Management Task Force” on page 16, WMI uses CIM as an industry standard for management information. WMI allows the automation of management tasks on a Windows-based platform.
Currently different versions of Windows have different options of WMI installation, such as:
� Windows Server 2003: WMI is preinstalled.
� Windows XP: WMI is preinstalled.
� Windows Me: WMI is preinstalled.
� Windows 2000: WMI is preinstalled.
� Windows NT 4.0 SP4: WMI can be installed using Add/Remove Windows components in Control Panel as a WBEM installation option.
� Windows 95 and 98: WMI Core 1.5 can be downloaded from:
http://download.microsoft.com/download/platformsdk/wmicore/1.5/W9XNT4/EN-US/wmicore.EXE
WMI CORE 1.5 (for Windows 95, 98, and NT 4.0) requires Microsoft Internet Explorer Version 5 or later 2.
2.3 Java and JavaBeansThe Java platform is a software-only platform that masks the differences of hardware-based platforms. It hides the details about hardware-based storage, memory, network connection, and computing power capabilities. Java platforms can be used to develop and deploy applications to various hardware-based platforms.
The differences in application needs also induce the emergence of several types of Java environments, such as:
� Java 2 Platform, Standard Edition (J2SE), provides an environment for the Core Java and Desktop Java applications development. It is the basis for Java
Chapter 2. Basic concepts for IBM Tivoli Monitoring V5.1.1 17
2 Platform, Enterprise Edition (J2EE) and Java Web Services technologies. It has the compiler, tools, runtimes, and Java application programming interfaces (APIs) that let you write, test, deploy, and run applets and applications.
� Java 2 Platform, Enterprise Edition, defines the standard for developing component-based multitier enterprise applications. It is based on J2SE and provides additional services, tools, and APIs to support simplified enterprise applications development.
� Java 2 Platform, Micro Edition (J2ME), is a set of technologies and specifications targeted at consumer and embedded devices, such as mobile phones, personal digital assistants (PDAs), printers, and TV set-top boxes.
� Java Card technology adapts the Java platform to enable smart cards and other intelligent devices with limited memory and processing capabilities to benefit from many of the advantages of Java technology.
The technology that allows component-based development in a Java platform is called JavaBeans. It conforms to the J2SE specification. JavaBeans provide reusable software components that can be assembled to create a complex application. The JavaBeans specification is available from:
http://java.sun.com/products/javabeans/docs/spec.html
2.4 WebSphere Application ServerIBM WebSphere Application Servers are a suite of servers that implement the J2EE specification. This simply means that any Web applications that are written to the J2EE specification can be installed and deployed on any of the servers in the WebSphere Application Server family.
The foundation of the IBM WebSphere brand is the application server. The application server provides the runtime environment and management tools for J2EE and Web Services-based applications.
WebSphere Application Servers are available in multiple configurations to meet specific business needs. They also serve as the base for other WebSphere products, such as WebSphere Commerce, by providing the application server required for running these specialized applications.
WebSphere Application Servers are available on a wide range of platforms, including UNIX-based platforms, Microsoft operating systems, IBM z/OS®, and IBM Eserver iSeries™ servers. Although branded for the iSeries server, WebSphere Application Server products for the iSeries are functionally equivalent to those for the UNIX and Microsoft platforms.
18 IBM Tivoli Monitoring V5.1.1 Implementation Certification Study Guide
2.5 Visual Basic and JavaScriptVisual Basic and JavaScript are widely used scripting languages. IBM Tivoli Monitoring supports Visual Basic and JavaScript for building the logic of the resource models.
2.5.1 Visual BasicVisual Basic is a scripting language developed by Microsoft that is based on the BASIC programming language. With Visual Basic, the BASIC language is extended to support object-oriented programming concepts. Microsoft Visual Basic provides a graphical user interface (GUI) to manipulate and modify parts of the code, typically the object’s methods, which are written in the BASIC language format.
2.5.2 JavaScriptJavaScript is a Web page extension scripting language developed by NetScape Inc. It is typically used inside an HTML file to allow dynamic content and modify viewing behavior on Web pages. JavaScript is independent from the Java programming language by Sun Microsystems.
2.6 Database conceptsIBM Tivoli Monitoring supports collection of historical data into a relational database management system (RDBMS). The relational database is accessed using services provided by Tivoli Framework called RDBMS interface module (RIM). Some important terms related to relational database are:
Database A set of tables that may be interrelated that stores data and information supporting a certain application
Database instance A group of databases that are served by a single database process
Tablespace Physical storage that is reserved for a set of tables, typically implemented as a file system or directory path
Table A collection of records with structured information with predefined fields
Row A single record in a database table
Column A field in a database table
Index Precollected information from a table that assists in searching table rows
Chapter 2. Basic concepts for IBM Tivoli Monitoring V5.1.1 19
Relationship A connection between two or more tables that shows a the inherent dependency between data
Stored procedure A program that runs, when requested, in the database system to perform a canned function
Trigger A program that runs, when there is a change to a table (insert, update or delete of a row), in the database system to perform a canned function
2.7 IBM Tivoli Management Framework The Tivoli Framework provides the basic system management services, such as communications, presentation, security, and so on, that all Tivoli systems management applications use, ensuring consistency and integration. At its core, the Tivoli Framework provides the facilities to transfer files and execute commands on remote systems with security.
These facilities are performed in the context of profiles. A profile is a collection of application-specific information that can be manipulated and distributed to machines in the Tivoli environment. This management model is often cited as management by subscription.
This section explains the general concepts of creating and distributing a profile. These concepts are common across Tivoli applications, such as software distribution, resource monitoring, system configuration, and so on. It also explains the built-in security-based rules, called policies, and authorization roles.
Most Tivoli systems management tasks, regardless of the application or component that is to be managed, may be performed by using the Tivoli desktop, which provides a user interface consistent throughout management applications. However, you are not limited to use the Tivoli desktop because you can run many jobs and tasks using the command line interface (CLI).
2.7.1 Tivoli Management EnvironmentMany components of Tivoli Enterprise software are used to manage an enterprise environment. Although the requirements of a particular enterprise may dictate which components are installed and used, there is still a common infrastructure that is used in all environments. To understand this infrastructure, certain concepts and terminology must be introduced.
20 IBM Tivoli Monitoring V5.1.1 Implementation Certification Study Guide
Tivoli Management RegionThe basic unit of Tivoli functionality is the Tivoli Management Region (TMR). A TMR is a partition of your network. It consists of at least of one TMR server and the clients that the server is managing.
The TMR server provides facilities required to manage the environment. One of its major distinguishing points is that it contains and controls the major portion of a distributed database that contains information regarding the managed resources and objects used to manage the environment.
A TMR can be composed of:
� A TMR server and endpoint manager� Managed nodes and endpoint gateways� Tivoli Management Agent (TMA) endpoints
You may need to split your TMR. The TMRs can then be connected to work together to form a complete management solution. Some reasons for multiple TMRs are to:
� Provide a different security level and policy for administrators� Balance the server load between multiple TMR servers� Provide a different set of resources for each TMR that may or may not be
shared
Common concepts of operationsMost Tivoli products operate under the same set of concepts, as described here.
� The primary communication within the Tivoli environment is performed by the oserv daemon. This daemon runs on the TMR server and all managed nodes. Communications to a TMA endpoint use a subset of the facilities provided by the oserv daemon. The TMA endpoint only communicates directly with its associated endpoint gateway.
� The information relating to all objects in the Tivoli environment, along with application-specific information, is stored in a distributed, object-oriented database. This database is distributed between the TMR server and all managed nodes in the TMR.
� A GUI, called the Tivoli Desktop, enables operators to access all Tivoli management applications.
� Most Tivoli application-specific functions are performed in the context of profiles. A profile is a collection of application-specific information that can be manipulated and distributed to machines in the Tivoli environment. The general concepts of creating and distributing a profile are common across Tivoli applications. This is called management by subscription.
Chapter 2. Basic concepts for IBM Tivoli Monitoring V5.1.1 21
� Management operations in the Tivoli environment are subject to policies or rules. This allows management to define the policies, which provides the parameters under which an administrator may perform management functions.
Now that you understand the Tivoli environment and the common concepts of operations in this environment, you can learn about the role of each system in a Tivoli Management Environment® (TME®) and the benefits of each role.
Tivoli managed objectsTo define your enterprise computing environment on Tivoli, you need to create a TMR server and as many TMR clients as needed.
� Managed nodes
Tivoli clients running the oserv daemon are represented as managed nodes. Managed nodes maintain a local database. Managed nodes have the graphical Tivoli desktop capability. The TMR server itself is configured automatically as the first managed node on the Tivoli desktop. Other managed nodes are defined and appear on the desktop when the Tivoli Management Framework is installed on them. Typically you can find installation failure messages in the installation log $TEMP/tivoli.cinstall or in the $DBDIR/oservlog database log file. Communication is established between the oserv daemons running on each system.
� Endpoints
A machine running a TMA is called a TMA endpoint. Like a managed node, a TMA endpoint can receive distributions, execute tasks, run monitors, and send events. Due to the expected large number (thousands) of TMA endpoints, a TMA endpoint has no icon representation on the desktop. A TMA endpoint is listed in the endpoint manager under an endpoint gateway. A TMA endpoint icon appears if the TMA endpoint is a subscriber of a profile manager. In a single TMR, it is only supported to have at most 20 000 endpoints. However, most installations are defined with fewer endpoints per TMR.
This environment is what conceptually is called the three-tiered architecture. The TMR server runs the Endpoint Manager, and the managed nodes run the Endpoint Gateways and endpoints. When it is started, an endpoint logs into the gateway assigned in its data file (lcf.dat). In turn, the gateway checks the endpoint from its endpoint list cache. The login processing then continues by running several log-in policy scripts in which the endpoint is assigned a gateway. If this gateway does not respond, the endpoint is considered isolated.
The endpoint runs a minimum code for connecting to the gateway. When an action needs to be performed, such as by profile distribution, it downloads the
22 IBM Tivoli Monitoring V5.1.1 Implementation Certification Study Guide
necessary binaries and files from the gateway. The binaries and files are then stored in a method cache on the endpoint until it is restarted.
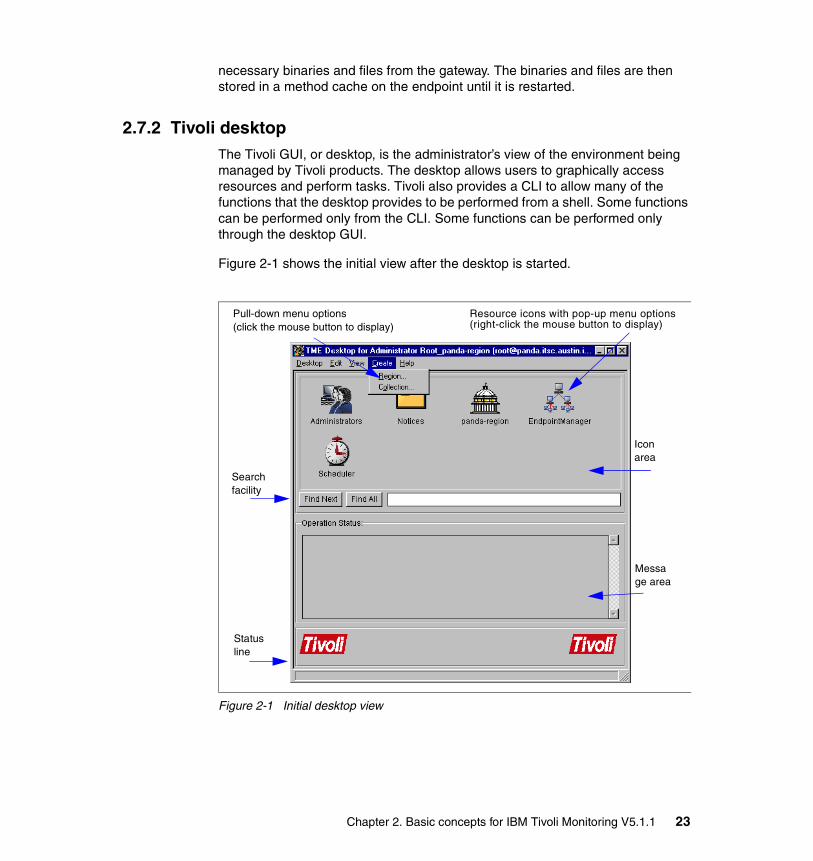
2.7.2 Tivoli desktop The Tivoli GUI, or desktop, is the administrator’s view of the environment being managed by Tivoli products. The desktop allows users to graphically access resources and perform tasks. Tivoli also provides a CLI to allow many of the functions that the desktop provides to be performed from a shell. Some functions can be performed only from the CLI. Some functions can be performed only through the desktop GUI.
Figure 2-1 shows the initial view after the desktop is started.
Figure 2-1 Initial desktop view
Pull-down menu options (click the mouse button to display)
Search facility
Status line
Message area
Icon area
Resource icons with pop-up menu options (right-click the mouse button to display)
Chapter 2. Basic concepts for IBM Tivoli Monitoring V5.1.1 23
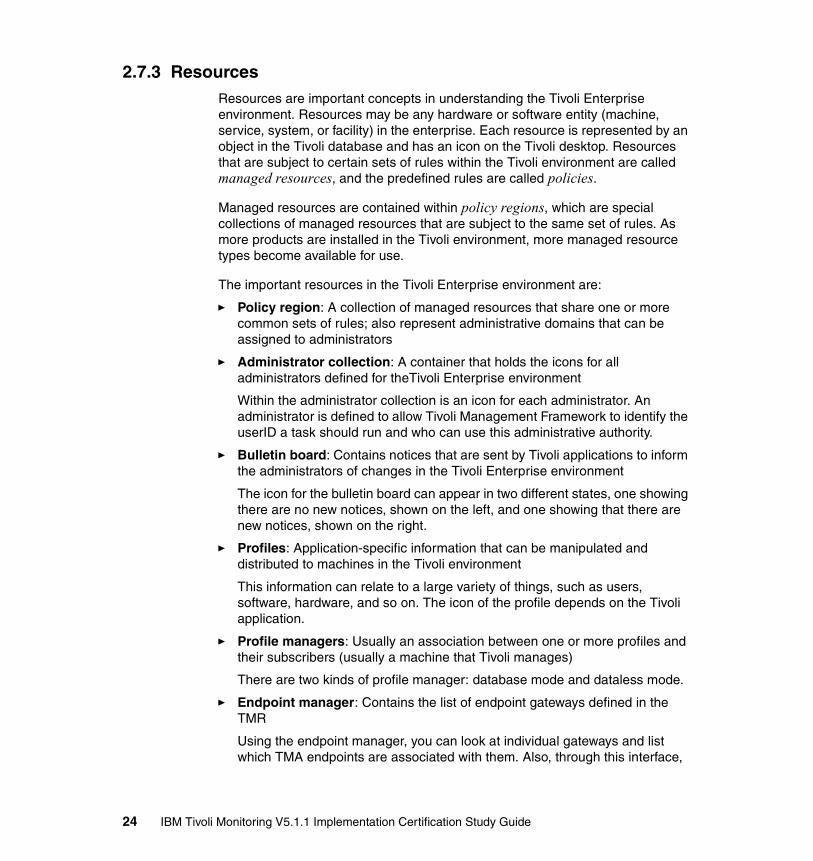
2.7.3 ResourcesResources are important concepts in understanding the Tivoli Enterprise environment. Resources may be any hardware or software entity (machine, service, system, or facility) in the enterprise. Each resource is represented by an object in the Tivoli database and has an icon on the Tivoli desktop. Resources that are subject to certain sets of rules within the Tivoli environment are called managed resources, and the predefined rules are called policies.
Managed resources are contained within policy regions, which are special collections of managed resources that are subject to the same set of rules. As more products are installed in the Tivoli environment, more managed resource types become available for use.
The important resources in the Tivoli Enterprise environment are:
� Policy region: A collection of managed resources that share one or more common sets of rules; also represent administrative domains that can be assigned to administrators
� Administrator collection: A container that holds the icons for all administrators defined for theTivoli Enterprise environment
Within the administrator collection is an icon for each administrator. An administrator is defined to allow Tivoli Management Framework to identify the userID a task should run and who can use this administrative authority.
� Bulletin board: Contains notices that are sent by Tivoli applications to inform the administrators of changes in the Tivoli Enterprise environment
The icon for the bulletin board can appear in two different states, one showing there are no new notices, shown on the left, and one showing that there are new notices, shown on the right.
� Profiles: Application-specific information that can be manipulated and distributed to machines in the Tivoli environment
This information can relate to a large variety of things, such as users, software, hardware, and so on. The icon of the profile depends on the Tivoli application.
� Profile managers: Usually an association between one or more profiles and their subscribers (usually a machine that Tivoli manages)
There are two kinds of profile manager: database mode and dataless mode.
� Endpoint manager: Contains the list of endpoint gateways defined in the TMR
Using the endpoint manager, you can look at individual gateways and list which TMA endpoints are associated with them. Also, through this interface,
24 IBM Tivoli Monitoring V5.1.1 Implementation Certification Study Guide
certain properties of the individual TMA endpoints can be inspected. The icon represents a 3-tier architecture.
� Task library: A managed resource that allows an administrator to create and store tasks and jobs (see the following definitions); icon represents multiple notes
� Task: A resource that represents an action or operation that needs to be performed within the Tivoli environment
Because a task can’t be executed without supplying additional information, the icon uses cleared boxes.
� Job: A resource that represents a task, which is executed on specific managed resources
Check boxes are used for the job icon.
� Scheduler: Allows tasks to be performed within the Tivoli environment
These tasks can be scheduled for any time of the day or night and any day of the week. If you need more scheduling restrictions, use Tivoli Workload Scheduler.
2.7.4 Policy and policy regionsIn the Tivoli Enterprise environment, a policy is a set of rules that are applied to managed resources. A policy enables you to control the default values of newly-created resources (default policy) and to maintain the guidelines when administrators perform management operations on resources (validation policy). A specific rule in a policy is referred to as a policy method. A default policy method can supply a constant value or run a shell script or a program that generates a value. A validation policy method usually runs a program or shell script to verify values supplied by the administrator. Administrators can define and maintain policies.
Policy regions are containers for managed resources that use the same set of policies. As Tivoli applications are added, additional rules and permissions may be installed on the system. Policy regions help to organize the managed resources in the desktop and can be helpful in defining and limiting administrator access to these resources. Only resources assigned to the policy region can be created or stored in the policy region.
Policy regions can be arranged hierarchically by creating policy subregions. Each policy subregion has its own subset of resources. When the subregion is initially defined, it has the same policies and managed resource types as its parent. After the initial definition, these things can be changed and do not depend at all on the parent’s definitions.
Chapter 2. Basic concepts for IBM Tivoli Monitoring V5.1.1 25
As previously mentioned, policy regions and subregions are collections of resources for which the same set of policies apply. Different criteria can be used to build these entities, such as administrator locations, administrator permission hierarchy, geography, departments, machine types, and so on. The policy region architecture is designed to be flexible so that resources can be laid out to reflect each company’s individual structure and policies.
2.7.5 Administrator and rolesAn administrator in Tivoli Framework is an object that:
� Has an assigned login user for executing a task (defined in the Create administrator dialog). The login must be valid on the managed node on which the administrator is defined.
� Maps a logical administrator into an operating system login defined in the Set Logins dialog. This account is mapped from a login request that comes from any managed nodes in the region.
� Assigns roles for resources within the TMR or for a specific policy region.
Sometimes an administrator must be mapped to a different user ID on different platforms. The mapping happens, for example, to execute a certain task. Only one user name can be specified in the Create administrator dialog. The solution is the usage of a user ID map, which allows an association to be made for a different user name on a different platform. A user ID map is specified with a dollar ($) sign.
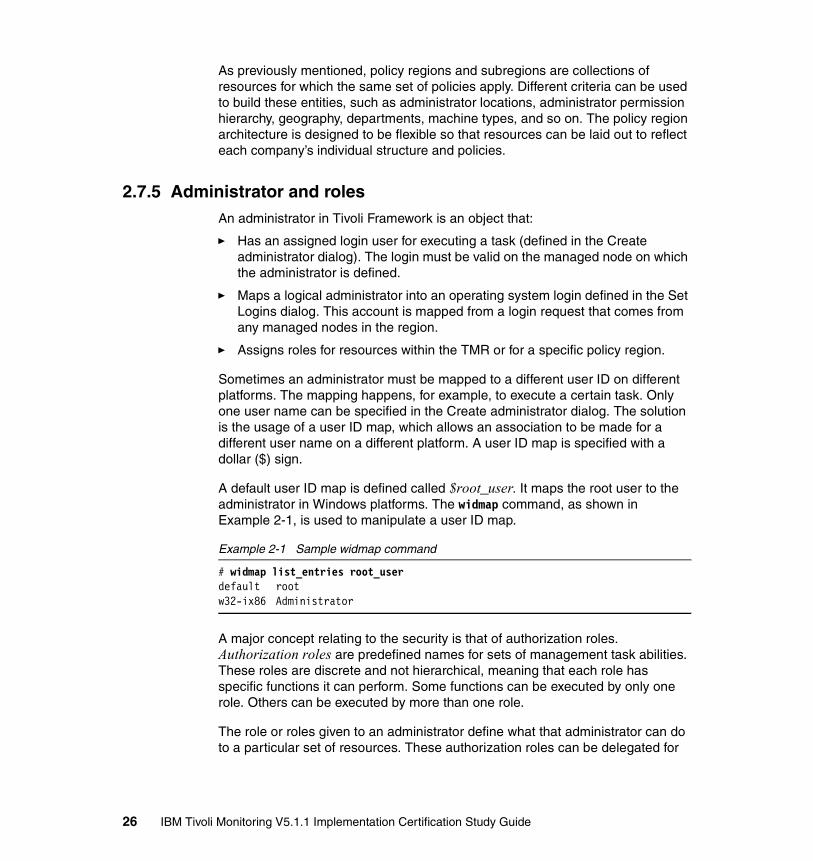
A default user ID map is defined called $root_user. It maps the root user to the administrator in Windows platforms. The widmap command, as shown in Example 2-1, is used to manipulate a user ID map.
Example 2-1 Sample widmap command
# widmap list_entries root_userdefault rootw32-ix86 Administrator
A major concept relating to the security is that of authorization roles. Authorization roles are predefined names for sets of management task abilities. These roles are discrete and not hierarchical, meaning that each role has specific functions it can perform. Some functions can be executed by only one role. Others can be executed by more than one role.
The role or roles given to an administrator define what that administrator can do to a particular set of resources. These authorization roles can be delegated for
26 IBM Tivoli Monitoring V5.1.1 Implementation Certification Study Guide
the entire TMR or for individual policy regions or special resources, such as an administrator or scheduler.
2.7.6 Profiles and profile managersProfiles and profile managers form the configuration management portion of the Tivoli Management Framework. Together, these objects organize, create, and distribute information to remote systems.
Profiles are Tivoli objects that represent a collection of information that corresponds to a system resource. A strong understanding of profile and profile manager concepts is imperative for anyone who will use the Tivoli Management Framework and applications to manage resources.
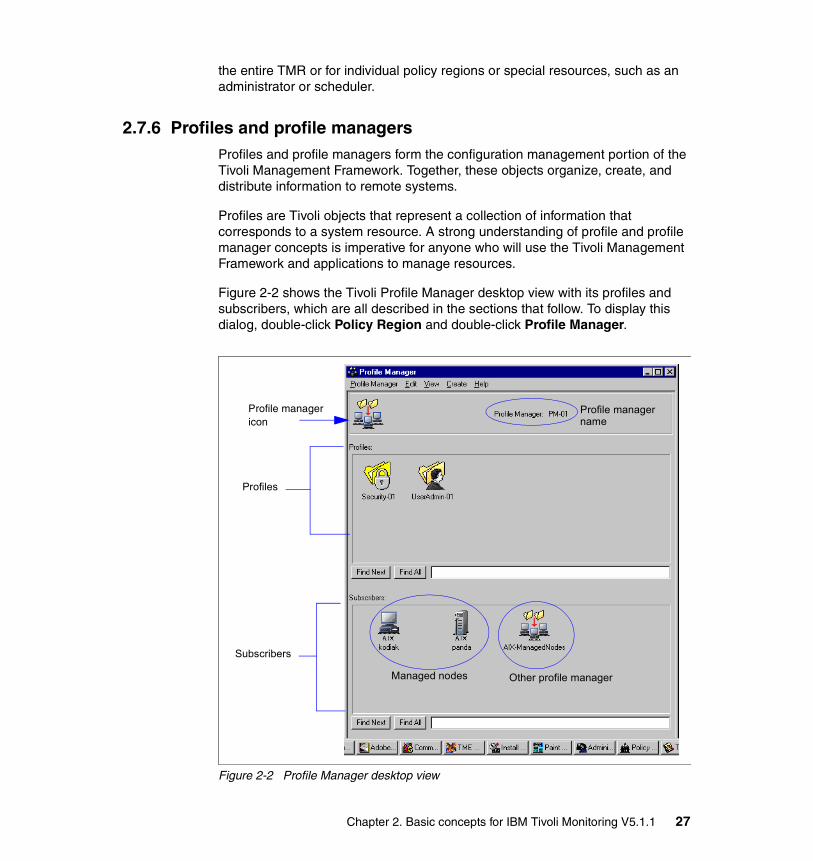
Figure 2-2 shows the Tivoli Profile Manager desktop view with its profiles and subscribers, which are all described in the sections that follow. To display this dialog, double-click Policy Region and double-click Profile Manager.
Figure 2-2 Profile Manager desktop view
Profiles
Profile manager
Subscribers
Managed nodes Other profile manager
Profile manager icon name
Chapter 2. Basic concepts for IBM Tivoli Monitoring V5.1.1 27
Profiles Although profiles are part of the Tivoli Management Framework infrastructure, they are application specific. That is, each Tivoli application defines specialized profile types used by that application. Profiles are created and maintained in profile managers. Profiles can be changed without immediately putting the changes into effect on the managed machines. Editing and distributing the profiles are two separate functions.
Depending on the profile type, when creating a profile, the administrator can enter the data in the dialog boxes that are provided. Or the administrator can extract the information from existing system files or databases to populate the profile.
To continue the previous example using the user profile, you could retrieve the information for your user profile from several remote systems /etc/passwd or NIS files. You can specify the hosts from which to obtain information and whether the information should replace or be appended to an existing profile. The ability to do these types of operations depends on the type of profile you are creating and the information that already exists.
Profile managersA profile manager provides a place to create and organize groups of profiles and link subscribers to them. A profile manager can contain multiple profiles of the same type, or it can contain profiles of more than one type. Profile managers also control the distribution of profiles and help organize resources.
As shown in Figure 2-2, you can logically view a profile manager as having two sections. One section contains profiles, and the other section contains subscribers. A subscriber is a profile endpoint or another profile manager that receives profile records from the profile manager.
A profile endpoint is a system that is the final destination for a profile. Target machine is another term for profile endpoint. Examples of profile endpoints can be managed nodes, PC managed nodes, TMA endpoints, or NIS domains. In the case of PC managed nodes, the profile is distributed to the UNIX or Windows NT system sponsoring the PC running the PC agent software, which is then distributed to that PC. The same situation is true for NetWare Managed Sites. The profile is distributed to the NetWare server, which is then distributed to its set of clients.
28 IBM Tivoli Monitoring V5.1.1 Implementation Certification Study Guide
At the time of distribution, the administrator can choose to select a subset of subscribers for the particular distribution (as well as a subset of the profiles) and can choose various options related to the distribution.
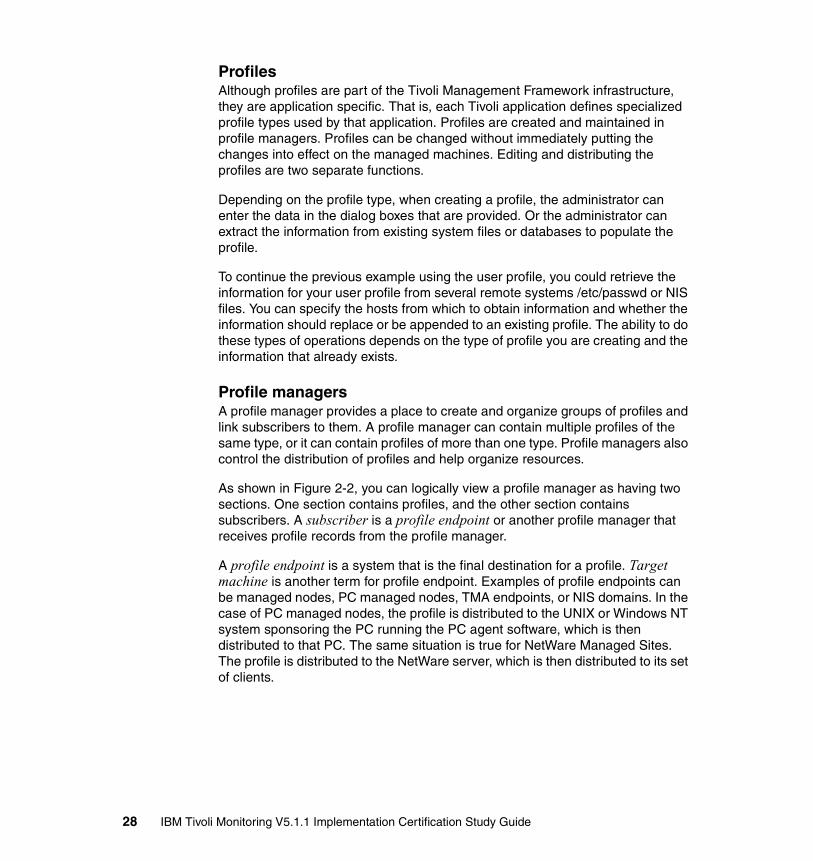
� Profile managers in database mode
When distributing a profile from a profile manager in database mode, the information in the profile is distributed to the Tivoli database of the subscriber or subscribers. It is also possible to subscribe other profile managers to a profile manager in database mode. This scenario provides a mechanism to hierarchically manage the environment. The database profile managers can be deleted only when all subscribers are removed.
� Profile managers in dataless mode
To support dataless TMA endpoints running the Tivoli Management Agent, the Tivoli Management Framework now supports a new type of profile manager. In many ways, it is similar to the original profile manager, but it differs in a few important ways.
Profile managers in dataless mode also contain two logical sections: profiles and subscribers. However, when a profile is distributed, it does not copy the profile to the database at the next level. Rather, it applies the changes contained in the profile to the system.
However, profile managers in dataless mode have been created to support TMA endpoints. You can also subscribe a managed node to a dataless profile manager and distribute a profile to it. In this scenario, the managed node functions more like a TMA endpoint processing the profile data immediately without copying the profile to its own database.
Based on the previous discussion about the two profile manager types, all subscriber types, except TMA endpoints, are supported by profile managers in database mode. All subscriber types, except profile managers, are supported by profile managers in dataless mode. Other than the operational differences of how the data is distributed, the net of this discussion is that you cannot subscribe profile managers and TMA endpoints to the same profile manager.
This leads us to building profile manager hierarchies where the higher level profile managers are running in database mode. Also, only the leaf profile managers (those at the lowest level) have TMA endpoints as subscribers.
It is possible to build a hierarchy where both managed nodes and profile managers are subscribed to higher-level profile managers running in database mode. Figure 2-3 illustrates a standard profile manager hierarchy that makes it much easier to add TMA endpoints to the environment.
Chapter 2. Basic concepts for IBM Tivoli Monitoring V5.1.1 29
Figure 2-3 Standard profile manager hierarchy
2.7.7 RDBMS interface module The RIM is the interface between Tivoli applications that use a relational database and the relational database. The RIM provides a common interface used by Tivoli applications to store and retrieve information from several databases. There is no separate RIM installation. It is installed as a Tivoli Framework component.
The data stored in an RDBMS by a Tivoli application can be shared by any application (Tivoli or non-Tivoli) that can access SQL data. Moreover, the Tivoli applications that use a relational database benefit from the advanced features of a RDBMS, such as scalability, performance, and reliability.
The RIM is composed of a RIM object. Each time you install an application using the RIM, an instance of a RIM object is created and then the Tivoli application can connect to the relational database defined in this instance.
Profile Endpoint
Dataless PM Dataless PM Dataless PM
Profile Endpoint Profile Endpoint Profile Endpoint
Database PM
Database PM
30 IBM Tivoli Monitoring V5.1.1 Implementation Certification Study Guide
The RIM object is divided into three layers:
� The API layer, which provides an interface to the Tivoli applications that want to use the RIM services
� The Translation layer, which translates the API commands to data types and SQL statements that can be specific for each RDBMS vendor
� The Adapter layer, which implements the RDBMS commands for each database vendor
No Tivoli icon is created to represent the RIM object. You create an instance of the RIM object either by using the wcrtrim command or by installing and configuring a Tivoli application that uses the RIM interface. See the appropriate Tivoli application manual for more details about setting the RIM object.
2.7.8 MDist 2 distributionMDist2 is a Tivoli Framework service that provides Tivoli applications with the functionalities required to perform mass data transfers through a hierarchy of repeaters to one or more endpoints. It provides utilities to fully control and automate the application profile distributions. MDist2 enables you to control the total amount of resources used by a repeater. This makes distributing data fast and efficient, improving performance and throughput.
You can set the network load, target network load, number of priority connections, packet size, debug level, maximum memory, and maximum disk space. You also can set intervals for how often the database is updated and the frequency and length of time that a repeater retries unavailable or interrupted targets.
The components of MDist2, as shown in Figure 2-4, are:
� Repeater manager: The Tivoli object that maintains configuration data for all repeaters in the TMR and determines the distribution path. There is one repeater manager per TMR.
� Repeater site: The intermediate client that receives a single copy of data and sends it to another repeater site or target client.
� Repeater depot: The storage site for MDist2 distributions. Every repeater has a depot. Thus, data can be stored on any repeater in the Tivoli environment. This storage mechanism helps reduce network traffic for frequently distributed data sets.
� Repeater queue: The queuing mechanism for MDist2 distributions. Every repeater has a queue. The distribution is queued and its persistent information is kept as a local file. This queuing mechanism includes a retry function that enhances support for unreachable targets.
Chapter 2. Basic concepts for IBM Tivoli Monitoring V5.1.1 31
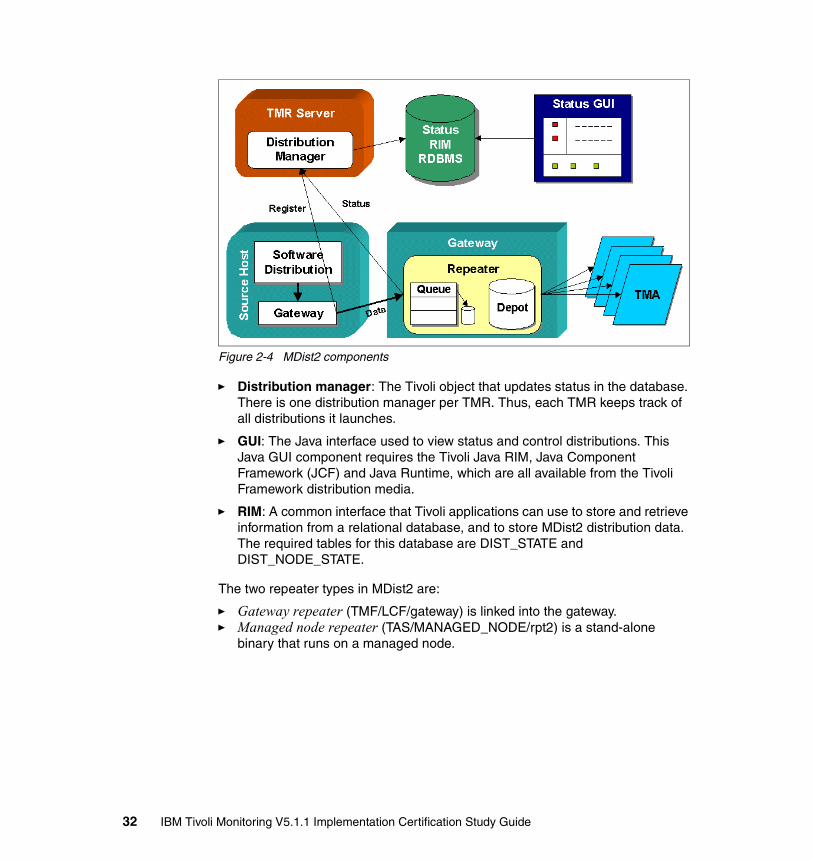
Figure 2-4 MDist2 components
� Distribution manager: The Tivoli object that updates status in the database. There is one distribution manager per TMR. Thus, each TMR keeps track of all distributions it launches.
� GUI: The Java interface used to view status and control distributions. This Java GUI component requires the Tivoli Java RIM, Java Component Framework (JCF) and Java Runtime, which are all available from the Tivoli Framework distribution media.
� RIM: A common interface that Tivoli applications can use to store and retrieve information from a relational database, and to store MDist2 distribution data. The required tables for this database are DIST_STATE and DIST_NODE_STATE.
The two repeater types in MDist2 are:
� Gateway repeater (TMF/LCF/gateway) is linked into the gateway.� Managed node repeater (TAS/MANAGED_NODE/rpt2) is a stand-alone
binary that runs on a managed node.
32 IBM Tivoli Monitoring V5.1.1 Implementation Certification Study Guide
2.7.9 Command line interfaceThis section discusses some commonly used commands within the TMR.
odadminThe odadmin command performs as a generic interface to oserv. Here are some variations of this command:
� Running odadmin without any argument shows the status of oserv and displays basic characteristic of it.
� The odadmin odlist command lists the managed nodes (TMR server and Tivoli clients) within the TMR, their dispatcher number and its status. If the client can be contacted, the letter c is displayed in the status column.
� The odadmin start command starts a non-Windows-based managed node, and the odadmin shutdown command shuts down any managed node.
� A multihome host, which is behind a network address translation (NAT) gateway, needs to be contacted by its name. To enable this facility, you issue the odadmin set_iom_by_name TRUE all command.
� To allow a managed node to have a dynamic IP address using DHCP, you issue the odadmin allow_dynamic_ipaddr TRUE. command.
wlookup The wlookup command allows a lookup to the name registry, which stores all classes and their instances. This is particularly useful for getting a resource name or listing a resource type. Some useful wlookup formats are:
� The wlookup -R command retrieves all resource types.� The wlookup -ar class command retrieves all resource with the type class.
wlsinstThe wlsinst command obtains the product installation status. It retrieves a list of installed products, patches, or both. Some useful wlsinst command formats are to obtain:
� All installed products using the wlsinst -p command� All installed patches using the wlsinst -P command� All installed products and patches using the wlsinst -a command� The installation status by host, for example by adding the -h option to obtain
all installed products by host using the wlsinst -p -h command
Chapter 2. Basic concepts for IBM Tivoli Monitoring V5.1.1 33
wbkupdbThe wbkupdb command allows you to back up and restore the Tivoli object database. For example, consider the default directory $DBDIR/../backups.
� To back up to this directory, use the wbkupdb command.� To restore this directory, use the wbkupdb -r -d filename command.
wchkdbThe wchkdb command allows you to check the integrity of the object database. It also allows recovery and repair of the object database for minor inconsistencies.
� The wchkdb command checks the consistency of the object database.� The wchkdb -u command checks and repairs the object database.� The wchkdb -x command checks across TMR connections.
wmdistThe wmdist command retrieves the status of MDist2 distributions.
� The wmdist -l command lists the currently active distribution and its status.� The wmdist -s command displays the currently used configurations.
2.8 IBM Tivoli Monitoring conceptsFigure 2-5 presents a high-level overview of the interaction between various components of IBM Tivoli Monitoring 5.1. The IBM Tivoli Monitoring 5.1 profile contains, among other information, a resource model. The resource model is a collection of monitors that correlate amongst themselves before attempting to perform a notification action.
The IBM Tivoli Monitoring 5.1 profile is distributed to the endpoints to monitor one or more resources (examples of typical resources are hard disk space, paging space, and process or service). Based on configuration settings in the IBM Tivoli Monitoring 5.1 profile, the engine runs on the endpoint and performs the necessary monitoring on the resources that are specified in the distributed resource model or models. The Web Health Console obtains logged data from selected endpoints and displays the health of the endpoints for their resources.
34 IBM Tivoli Monitoring V5.1.1 Implementation Certification Study Guide
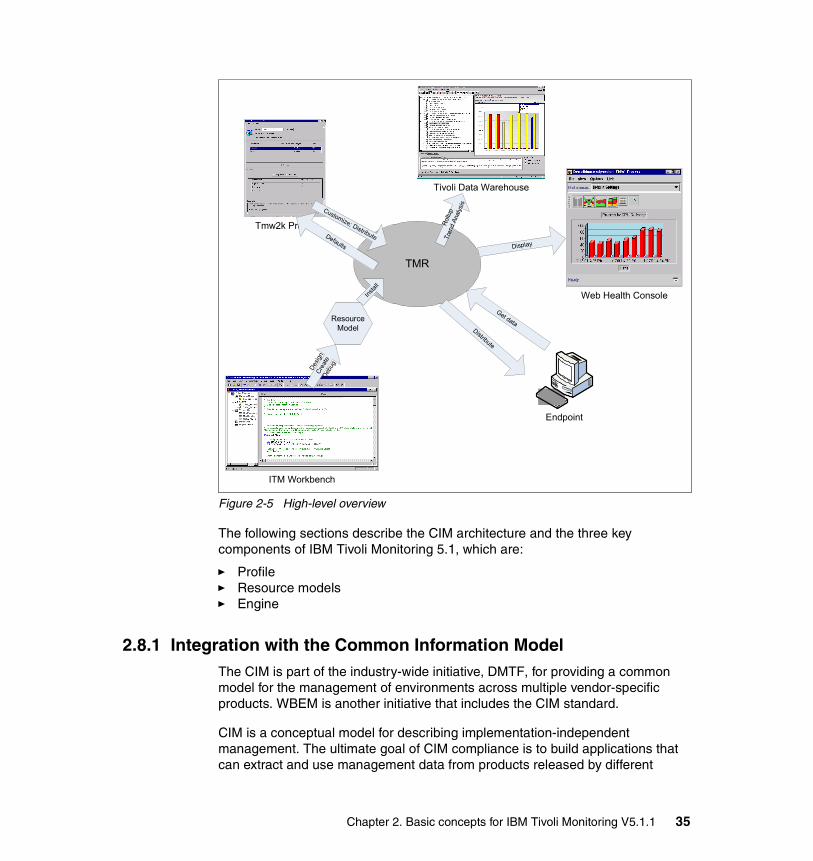
Figure 2-5 High-level overview
The following sections describe the CIM architecture and the three key components of IBM Tivoli Monitoring 5.1, which are:
� Profile� Resource models� Engine
2.8.1 Integration with the Common Information ModelThe CIM is part of the industry-wide initiative, DMTF, for providing a common model for the management of environments across multiple vendor-specific products. WBEM is another initiative that includes the CIM standard.
CIM is a conceptual model for describing implementation-independent management. The ultimate goal of CIM compliance is to build applications that can extract and use management data from products released by different
Tmw2k Profile
Tivoli Data Warehouse
Web Health Console
ITM Workbench
TMR
Resource Model
Desig
nCr
eate
Debu
g
Instal
l
Customize; DistributeDefaults
Rollu
pTr
end
Anal
ysis
Display
Get dataDistribute
`
Endpoint
Chapter 2. Basic concepts for IBM Tivoli Monitoring V5.1.1 35
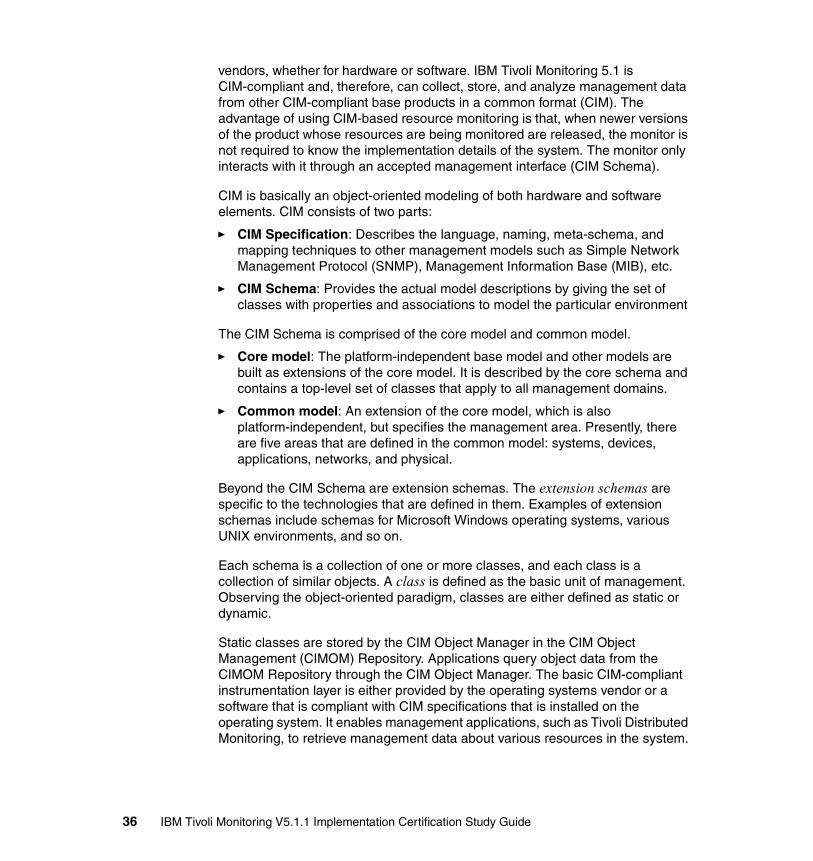
vendors, whether for hardware or software. IBM Tivoli Monitoring 5.1 is CIM-compliant and, therefore, can collect, store, and analyze management data from other CIM-compliant base products in a common format (CIM). The advantage of using CIM-based resource monitoring is that, when newer versions of the product whose resources are being monitored are released, the monitor is not required to know the implementation details of the system. The monitor only interacts with it through an accepted management interface (CIM Schema).
CIM is basically an object-oriented modeling of both hardware and software elements. CIM consists of two parts:
� CIM Specification: Describes the language, naming, meta-schema, and mapping techniques to other management models such as Simple Network Management Protocol (SNMP), Management Information Base (MIB), etc.
� CIM Schema: Provides the actual model descriptions by giving the set of classes with properties and associations to model the particular environment
The CIM Schema is comprised of the core model and common model.
� Core model: The platform-independent base model and other models are built as extensions of the core model. It is described by the core schema and contains a top-level set of classes that apply to all management domains.
� Common model: An extension of the core model, which is also platform-independent, but specifies the management area. Presently, there are five areas that are defined in the common model: systems, devices, applications, networks, and physical.
Beyond the CIM Schema are extension schemas. The extension schemas are specific to the technologies that are defined in them. Examples of extension schemas include schemas for Microsoft Windows operating systems, various UNIX environments, and so on.
Each schema is a collection of one or more classes, and each class is a collection of similar objects. A class is defined as the basic unit of management. Observing the object-oriented paradigm, classes are either defined as static or dynamic.
Static classes are stored by the CIM Object Manager in the CIM Object Management (CIMOM) Repository. Applications query object data from the CIMOM Repository through the CIM Object Manager. The basic CIM-compliant instrumentation layer is either provided by the operating systems vendor or a software that is compliant with CIM specifications that is installed on the operating system. It enables management applications, such as Tivoli Distributed Monitoring, to retrieve management data about various resources in the system.
36 IBM Tivoli Monitoring V5.1.1 Implementation Certification Study Guide
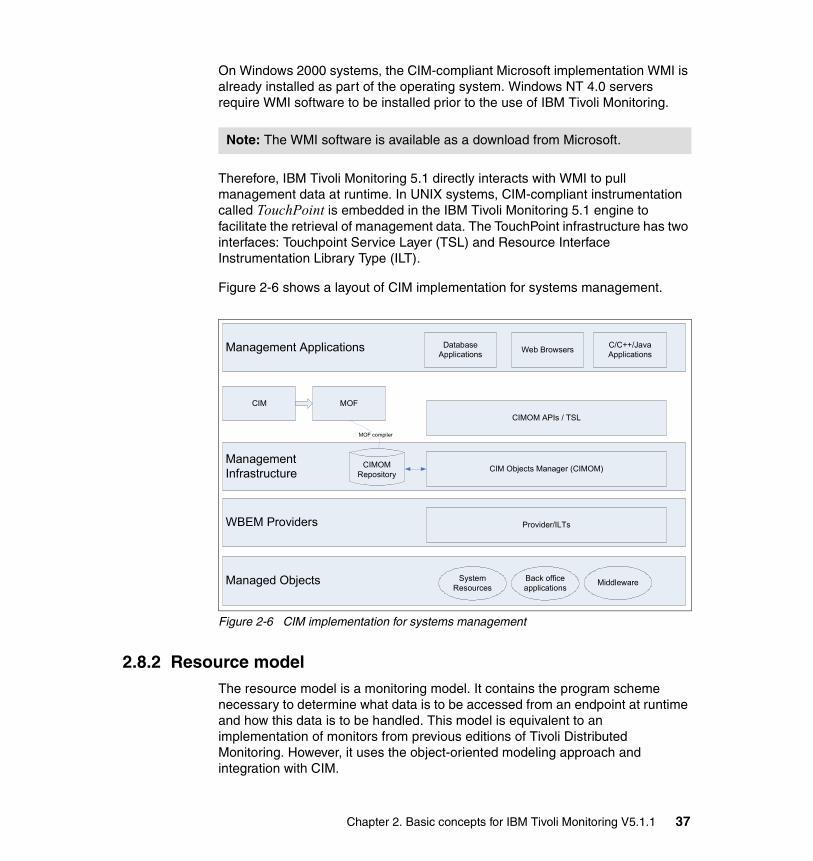
On Windows 2000 systems, the CIM-compliant Microsoft implementation WMI is already installed as part of the operating system. Windows NT 4.0 servers require WMI software to be installed prior to the use of IBM Tivoli Monitoring.
Therefore, IBM Tivoli Monitoring 5.1 directly interacts with WMI to pull management data at runtime. In UNIX systems, CIM-compliant instrumentation called TouchPoint is embedded in the IBM Tivoli Monitoring 5.1 engine to facilitate the retrieval of management data. The TouchPoint infrastructure has two interfaces: Touchpoint Service Layer (TSL) and Resource Interface Instrumentation Library Type (ILT).
Figure 2-6 shows a layout of CIM implementation for systems management.
Figure 2-6 CIM implementation for systems management
2.8.2 Resource modelThe resource model is a monitoring model. It contains the program scheme necessary to determine what data is to be accessed from an endpoint at runtime and how this data is to be handled. This model is equivalent to an implementation of monitors from previous editions of Tivoli Distributed Monitoring. However, it uses the object-oriented modeling approach and integration with CIM.
Note: The WMI software is available as a download from Microsoft.
Management Applications
Management Infrastructure
WBEM Providers
Managed Objects
Database Applications Web Browsers C/C++/Java
Applications
CIMOM APIs / TSL
CIM Objects Manager (CIMOM)
Provider/ILTs
System Resources
Back office applications Middleware
CIM MOF
CIMOM Repository
MOF compiler
Chapter 2. Basic concepts for IBM Tivoli Monitoring V5.1.1 37
Each resource model obtains resource data from the endpoint to which it is distributed, performs root cause analysis using a built-in algorithm, and reacts accordingly in the form of built-in actions or user-defined tasks. An example of a resource model is the TMW_Services resource model, which is used to monitor the Windows Services-like server, browser, event log, and so on.
The major components of a resource model are the configuration file, MOF file, decision tree file, message catalog for building the Tivoli Enterprise Console, and Tivoli Business Systems Manager (TBSM) events, and class files to interface with the native library. The MOF file contains the particular resource model’s class description and event definitions.
The classes are derived from the corresponding base classes of the resources. The base classes for the model-to-resources association, and classes that describe physical resources used in the resource models with respect to the instance providers, are provided in a base MOF file and a resources MOF file, respectively. These additional MOF files are distributed to the endpoint the first time an IBM Tivoli Monitoring 5.1 profile is distributed to it. The configuration details of the resource model are obtained by the engine from the configuration file. These details include the resource model name, platform name, name of the decision tree file, and names of the MOF files.
The decision tree file is in VisualBasic script or JavaScript for Windows platform and JavaScript for UNIX or LINUX platforms. It contains both the initialization settings for the resource model and the algorithm that is used by the IBM Tivoli Monitoring 5.1 analyzer to determine if a problem is encountered in the resources described by the resource model.
When an IBM Tivoli Monitoring 5.1 profile containing a resource model is distributed to the endpoint, the following actions take place:
1. Resource model files are unzipped from the resource model-specific ZIP file.
2. MOF files specific to the resource model are compiled.
3. All components of the IBM Tivoli Monitoring 5.1 engine are created, loaded in memory, and started (logger, analyzer, action manager, event aggregator, and event correlator).
38 IBM Tivoli Monitoring V5.1.1 Implementation Certification Study Guide
Chapter 3. Planning for IBM Tivoli Monitoring V5.1.1 deployment
This chapter discusses the necessary planning stage before you implement IBM Tivoli Monitoring V5.1.1. It examines the client’s IT environment, topology, and the existing management environment. It looks at endpoint software verification, Health Console and data warehouse planning, and the Workbench development requirements.
3
© Copyright IBM Corp. 2004. All rights reserved. 39
3.1 Environment and topologyAt the client’s request to implement IBM Tivoli Monitoring V5.1.1, you must be able to analyze important information from their environment to successfully deploy IBM Tivoli Monitoring V5.1.1. An initial assessment that you must perform is on the client’s IT environment and interconnection topology. The results of this assessment influence the design of the solution, in terms of Tivoli Framework structure.
� The physical network structure defines how profile distribution and data collection will be performed by the Tivoli environment, typically by configuring MDist II repeaters.
� The logical ownership of the network determines how policy region hierarchy will be implemented as the policy region represents an authorization unit in Tivoli.
� The machine architecture, operating system level, and its usage can determine how profile managers will be used and created to achieve maximum flexibility for distributing profiles.
You need to identify the machines that IBM Tivoli Monitoring V5.1.1 will manage. These machines are typically application servers that need to be monitored and managed. You need to check the operating system level of these machines to make sure that IBM Tivoli Monitoring supports these levels as specified in the IBM Tivoli Monitoring V5.1.1 release notes. Later, you need to deploy and install the prerequisite software and Tivoli Management Agent.
From these machines, you may want to determine the resources that will be monitored. This helps you to evaluate the monitoring requirement, such as the number of resource models that can be used and the resource model that needs to be custom created. You can also analyze the monitoring capacity requirement and determine the required database size to hold the monitoring data. In addition, this can help you to determine the additional space required to store the data in central data warehouse in Tivoli Data Warehouse.
IBM Tivoli Monitoring V5.1.1 can forward events to other Tivoli applications, such as IBM Tivoli Enterprise Console and IBM Tivoli Business Systems Manager (TBSM). If the client wants or needs this integration, consider an additional level of information, such as:
� The application to which the monitored resource belongs
� The business system that will be affected with the outage of the resource
� Automation (if any) that needs to be performed whenever a resource is not considered healthy
40 IBM Tivoli Monitoring V5.1.1 Implementation Certification Study Guide
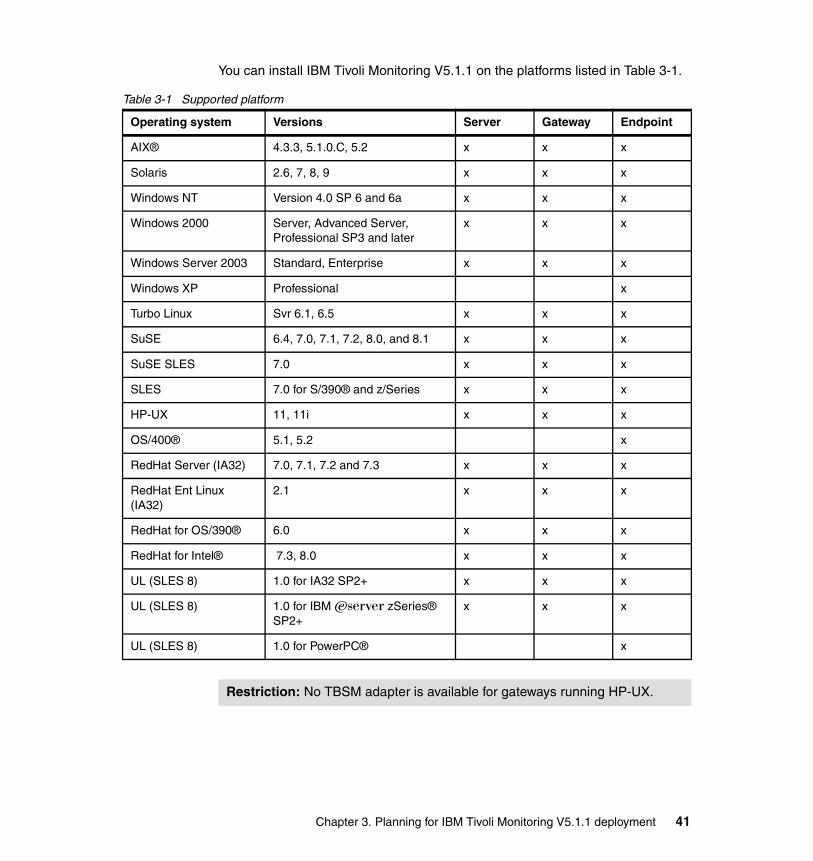
You can install IBM Tivoli Monitoring V5.1.1 on the platforms listed in Table 3-1.
Table 3-1 Supported platform
Operating system Versions Server Gateway Endpoint
AIX® 4.3.3, 5.1.0.C, 5.2 x x x
Solaris 2.6, 7, 8, 9 x x x
Windows NT Version 4.0 SP 6 and 6a x x x
Windows 2000 Server, Advanced Server, Professional SP3 and later
x x x
Windows Server 2003 Standard, Enterprise x x x
Windows XP Professional x
Turbo Linux Svr 6.1, 6.5 x x x
SuSE 6.4, 7.0, 7.1, 7.2, 8.0, and 8.1 x x x
SuSE SLES 7.0 x x x
SLES 7.0 for S/390® and z/Series x x x
HP-UX 11, 11i x x x
OS/400® 5.1, 5.2 x
RedHat Server (IA32) 7.0, 7.1, 7.2 and 7.3 x x x
RedHat Ent Linux (IA32)
2.1 x x x
RedHat for OS/390® 6.0 x x x
RedHat for Intel® 7.3, 8.0 x x x
UL (SLES 8) 1.0 for IA32 SP2+ x x x
UL (SLES 8) 1.0 for IBM Eserver zSeries® SP2+
x x x
UL (SLES 8) 1.0 for PowerPC® x
Restriction: No TBSM adapter is available for gateways running HP-UX.
Chapter 3. Planning for IBM Tivoli Monitoring V5.1.1 deployment 41
3.2 Existing management environmentWhen implementing IBM Tivoli Monitoring V5.1.1, you need to collect information regarding the existing management environment. This is crucial so that you can evaluate the options on implementing the configuration.
You must collect the following information:
� Tivoli Framework structure
IBM Tivoli Monitoring V5.1.1 can be deployed in either a new Tivoli Management Region (TMR), or merged to an existing TMR. For a completely new implementation, decide which installation options to use. For a pre-existing environment, understand how the existing TMRs are structured. Typically you must know how the relationship between multiple regions and the design of the profile managers as the monitoring profiles must be distributed to the endpoints.
� Other existing monitoring infrastructure
The current monitoring practice largely determines how the new implementation can replace the existing one. You must understand which monitors are currently in place. For example, the client may be using Tivoli Distributed Monitoring or a custom program developed by the administrator or involving third-party tools. Regardless of the infrastructure is, they must be integrated to the overall monitoring infrastructure with IBM Tivoli Monitoring V5.1.1.
The Tivoli Distributed Monitoring profile can be migrated to the IBM Tivoli Monitoring V5.1.1 resource model. Custom monitoring scripts can be used in data collection for resource models. Understanding the intervals and threshold used in the monitoring tools is also beneficial because it serves as the basis of the IBM Tivoli Monitoring V5.1.1 implementation.
The following sections explain the prerequisites for installing IBM Tivoli Monitoring V5.1.1.
3.2.1 Tivoli Management Framework requirementYou need to obtain the software levels of the existing Tivoli environment. IBM Tivoli Monitoring V5.1.1 requires, as a minimum, Tivoli Management Framework Version 3.7B, but we recommend Version 3.7.1 or 4.1. If you have Tivoli Management Framework Version 4.1, we recommend that you install patches 4.1-TMF-0013 and 4.1-TMF-0014. If you have Tivoli Management Framework Version 3.7.1, we recommend that you install patches 3.7.1-TMF-0097, 3.7.1-TMF-0098, 3.7.1-TMF-0099, and 3.7.1-TMF-0114.
42 IBM Tivoli Monitoring V5.1.1 Implementation Certification Study Guide
Some platforms have specific patch requirements, as follows:
� Windows 2000 on Tivoli Management Framework, 3.7B, patch 3.7-TMF-0010 is a prerequisite for any version of the Windows 2000 operating system. We recommend that you install it on all other platforms where it is available.
� Windows XP for Windows XP Professional endpoints patch 3.7.1-TMF-0044 is required.
� Linux for iSeries and pSeries® endpoints requires 3.7.1-TMF-107 or 4.1-TMF-0015.
For more information, see the IBM Tivoli Monitoring V5.1.1 User’s Guide, SH19-4569.
3.2.2 Available installation methodsBased on the IBM Tivoli Monitoring V5.1.1 User’s Guide, SH19-4569, there are three ways to install IBM Tivoli Monitoring V5.1.1:
� Using the installation wizard, also called Rapid Deployment
This wizard allows you to install a running environment on a single machine from a plain operating system process.
� Using Tivoli Software Installation Service (SIS)
SIS can install multiple Tivoli products on multiple systems in parallel. This Java-based product can install more products on more systems in much less time than the Framework’s installation facility. SIS performs product prerequisite checks and, if defined, user-specified prerequisite checks, ensuring as few installation failures as possible. In most cases, failures occur only when machines are turned off or removed from the network.
� From the Tivoli desktop, installing individual products within the Tivoli Management Framework environment
You can install the following components individually:
– IBM Tivoli Monitoring Version 5.1.1: This is the server and gateway code that needs to be installed on the TMR server and all gateways.
– Tivoli Monitoring TBSM Adapter, Version 5.1.1: This is the common listener adapter feed to TBSM that must be installed on all gateways that connect to the TBSM common listener.
– Tivoli Monitoring Gathering Historical Data Component, Version 5.1.2: This is the interface to the older Tivoli Decision Support’s Server Performance Prediction.
Chapter 3. Planning for IBM Tivoli Monitoring V5.1.1 deployment 43
– Tivoli Monitoring Tivoli Enterprise Data Warehouse Support Version 5.1.2: This is the interface to Tivoli Data Warehouse and must be installed on one of the managed nodes to access the database.
3.2.3 Hardware requirementsThe hardware requirements are:
� Server: CPU and memory have the same requirements as Framework. The disk space is 85 MB.
� Gateway: CPU and memory have the same requirements as Framework. The disk space is 85 MB. An additional 2 MB is required for the TBSM adapter.
� Windows endpoint: The CPU is 266 MHz, Memory 128 MB, 30 MB of disk space.
� UNIX or Linux endpoint: CPU and memory have the same requirements as Framework. The disk space is 100 MB.
� OS/400 endpoint: CPU and memory have the same requirements as Framework. The disk space is 20 MB.
3.3 Endpoint software verificationTo run IBM Tivoli Monitoring V5.1.1 monitors on the endpoint, several requirements must be fulfilled. This section discusses these requirements.
The endpoint code for IBM Tivoli Monitoring V5.1.1 runs in a Java Virtual Machine (JVM). The endpoint needs to have Java Runtime Environment (JRE) installed in the endpoint. Later we need to tell IBM Tivoli Monitoring V5.1.1 where the JRE is installed. Typically, when JRE is installed, the following happens:
� JAVA_HOME environment variable is set to the installation directory of the JRE.
� The java.exe file represent the JRE executable that should exist.� Checking the JRE version is performed using the java -version command.
The wdmcheckprereq command checks a set of prerequisites on a Windows endpoint and returns the results. The set of prerequisites verified by the command includes:
� Windows Management Instrumentation (WMI) version� Open Database Connectivity (ODBC) driver version� Jet Engine version� JRE version� Windows Script Host (CScript) version
44 IBM Tivoli Monitoring V5.1.1 Implementation Certification Study Guide

You must also verify the level of the endpoint code that runs on each endpoint. To locate the endpoint version, from a managed node, run the following command:
wadminep endpoint view_version
3.4 Health Console planningThe IBM Tivoli Monitoring V5.1.1 Web Health Console is a Web application server that converts Web browser requests into communication with IBM Tivoli Monitoring V5.1.1 server within the TMR. This Web application server does not need to belong to the TMR. A single Web Health Console can serve multiple TMRs. Plus you can have multiple Web Health Consoles accessing a single TMR.
Because the Web Health Console serves as a Web server, by default, it is installed to use TCP/IP port 80. This is the standard port number for Hypertext Transport Protocol (HTTP). The Web Health Console uses IBM HTTP Server. You must check whether other processes in the machine also use the default HTTP port, port 80. This may interfere with the Web Health Console. Typical processes are:
� Apache server� Microsoft Internet Information Server (for a Windows-based machine)
You may need to re-assign the port that is used by the Web server processes or re-assign the Web Health Console port.
The Web Health Console server has the following system requirements:
� The target machine for installing the Web Health Console has minimum memory requirements of 384 MB, but we recommend 512 MB.
� The disk space requirements within the temp directory and the selected install directory for the single computer selected are:
– The install directory during the installation needs 500 MB.– The install directory after the installation needs 230 MB.– The temporary directory needs 100 MB.
You must perform additional actions to verify network connectivity from the Web Health Console server to the managed node to which you will connect.
The Web Health Console user specifies a managed node name when they sign in. This managed node is used to authenticate the user and access the TMR. You may want to specify a managed node to serve Web Health Console requests if you expect a large number of users to use the Web Health Console.
Chapter 3. Planning for IBM Tivoli Monitoring V5.1.1 deployment 45
The Web Health Console runs using a Web browser with either:
� Netscape 6.x or later� Internet Explorer 6.x
The Web Health Console is supported on:
� AIX 5.1� HP-UX 11.0� Red Hat Linux for Intel 7.1� Solaris 2.8, � Windows 2000 Server and Advanced Server SP3� Windows NT Server Version 4.0 SP6
3.5 Data Warehouse planningIBM Tivoli Monitoring V5.1.1 supports collecting data into a database. The data is stored using a facility of TMR called relational database management system (RDBMS) Interface Module (RIM). This RIM object provides a mechanism for the object database to interact with an RDBMS. RIM objects are hosted on a managed node with client-level access to the database. As the RIM database, IBM Tivoli Monitoring V5.1.1 supports DB2, Informix®, Microsoft SQL Server, Oracle, and Sybase.
You need to specify in the IBM Tivoli Monitoring V5.1.1 monitoring profile that you want the data to be stored in the database. This relates to the size of the data that you want to collect. Individual storage of data multiplied by the number of occurrences of the monitor and the number of monitors generally gives the expected growth of data in the database.
Monitoring data collected from IBM Tivoli Monitoring V5.1.1 can then be stored in the Tivoli Data Warehouse for analysis and reporting. IBM Tivoli Monitoring V5.1.1 data further adds to the data requirement for Tivoli Data Warehouse. The data is typically stored in the central data warehouse and the reporting data mart for each of the IBM Tivoli Monitoring V5.1.1 modules.
3.6 Workbench development requirementsThe largest portion of the implementation effort is typically spent on developing monitors that are not readily available or supplied by IBM Tivoli Monitoring V5.1.1. Although IBM Tivoli Monitoring V5.1.1 already has a tremendous amount of canned monitors, and additional monitors are available using the IBM Tivoli Monitoring V5.1.1 monitoring modules, some monitors may still need to be developed or migrated.
46 IBM Tivoli Monitoring V5.1.1 Implementation Certification Study Guide
To do this, IBM Tivoli Monitoring V5.1.1 workbench must be installed. First, identify the number of IBM Tivoli Monitoring V5.1.1 workbench workstations to install. Then install the workbench on one of the following operating systems:
� Windows NT 4.0 Service Pack 5 or higher, plus WMI Version 1.1 or higher (recommended 1.5)
� Windows 2000
� Windows XP Professional Code
To acquire the operating system level from the System property applet that is started, select Start →Settings →Control Panel. To retrieve the WMI level, use the <> command.
To debug JavaScript resource models for Windows on Windows systems, you need a JavaScript debugger. You can download a Microsoft debugger from:
http://msdn.microsoft.com/library/default.asp?url=/library/en-us/dnanchor/html/scriptinga.asp
The minimum hardware requirements for the workbench are:
� Disk space: 10 MB� RAM: 64 MB� Processor: 133 MHz
Chapter 3. Planning for IBM Tivoli Monitoring V5.1.1 deployment 47

48 IBM Tivoli Monitoring V5.1.1 Implementation Certification Study Guide

Chapter 4. Installing IBM Tivoli Monitoring V5.1.1
This chapter explains how to install IBM Tivoli Monitoring V5.1.1. It discusses how to migrate from Tivoli Distributed Monitoring V4.1, installing on an existing Tivoli environment, configuring IBM Tivoli Monitoring endpoints, as well as installing Web Health Console and IBM Tivoli Monitoring Workbench.
4
© Copyright IBM Corp. 2004. All rights reserved. 49
4.1 Migrating from Tivoli Distributed Monitoring V4.1Tivoli Distributed Monitoring V4.1 Advanced Edition cannot coexist with IBM Tivoli Monitoring V5.1.1. You must upgrade Tivoli Distributed Monitoring to IBM Tivoli Monitoring V5.1.1. Because there is no direct migration path from Tivoli Distributed Monitoring V4.1 Advanced Edition to IBM Tivoli Monitoring V5.1.1, you must upgrade first to IBM Tivoli Monitoring V5.1.
Upgrade versions of Tivoli Manager for Windows NT and older versions of Tivoli Distributed Monitoring for Windows in the following sequence:
1. Tivoli Distributed Monitoring for Windows NT 3.72. Tivoli Distributed Monitoring (Advanced Edition) 4.13. Tivoli Monitoring 5.14. Tivoli Monitoring 5.1.15. Tivoli Monitoring 5.1.2
After you install IBM Tivoli Monitoring V5.1, the upgrade to IBM Tivoli Monitoring V5.1.1 is similar to a new installation of IBM Tivoli Monitoring V5.1.1. It supports the Tivoli Software Installation Service or the Tivoli Desktop installation method. Rapid deployment is not applicable since this is an existing environment.
While upgrading IBM Tivoli Monitoring, we recommend that you stop the IBM Tivoli Monitoring engine on all endpoints. To stop these processes, enter:
wdmcmd -stop -m all
After the upgrade processing is completed, wait for at least 15 minutes to allow in the code changes and the endpoint cache status to time out before you restart all IBM Tivoli Monitoring engines. Then, enter:
wdmcmd -restart -m all
4.2 Installing on an existing Tivoli environmentThere are several installation options for installing IBM Tivoli Monitoring V5.1.1 on an existing Tivoli environment, especially for interfaces with other products and environments. It supports the Tivoli Software Installation Service or the Tivoli Desktop installation method. Rapid deployment is not applicable because this is an existing environment.
You can install the following components individually:
� IBM Tivoli Monitoring Version 5.1.1
This is the server and gateway code that needs to be installed on the Tivoli Management Region (TMR) server and all gateways.
50 IBM Tivoli Monitoring V5.1.1 Implementation Certification Study Guide
� Tivoli Monitoring Tivoli Business Systems Manager (TBSM) Adapter, Version 5.1.1
This is the Common listener adapter feed to TBSM. It must be installed on the TMR server and all gateways which connect to the TBSM common listener.
� Tivoli Monitoring Gathering Historical Data Component, Version 5.1.2
This is the interface to the older Tivoli Decision Support’s Server Performance Prediction.
� Tivoli Monitoring Tivoli Enterprise Data Warehouse Support Version 5.1.2
This is the interface to Tivoli Data Warehouse. It must be installed on one of the managed nodes to access the database. This feature also allows the collection of monitoring metrics from resource models into a RDBMS interface module (RIM) database.
To begin the installation, from the Tivoli Desktop, complete these tasks:
1. Select Desktop →Install → Install Product. 2. Select the component that you want to install. 3. Install the IBM Tivoli Monitoring V5.1.1 component first and then install
individually other components.
To perform a command line installation, type:
winstall -c cdrom_dir -i ind_file
Installation using Tivoli Software Installation Service goes through the steps of importing the software media to the Tivoli Software Installation Service (SIS) depot. Then you can select the software to be installed to the target machines.
To install the IBM Tivoli Monitoring V5.1.1.1 product using Tivoli Desktop, follow these steps:
1. Back up the object database and the Tivoli file system using either of the following options:
– From the Tivoli desktop, select Desktop →Backup. – Enter the wbkupdb command.
We recommend that you back up the entire Tivoli file system of the node on which the product will be installed.
2. Install the IBM Tivoli Monitoring V5.1.1 product on the TMR server and gateways.
Tip: If any problems occur during the installation process, they are registered in the /tmp/tivoli.cinstall (UNIX) or %DBDIR%/tmp/tivoli.cinstall (Windows) file.
Chapter 4. Installing IBM Tivoli Monitoring V5.1.1 51
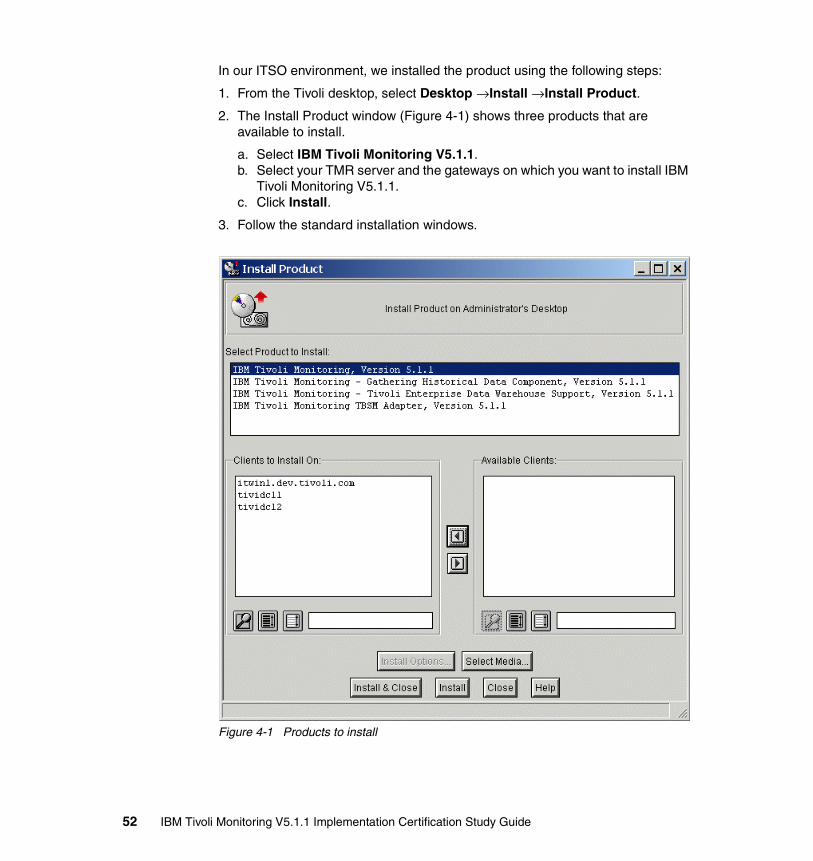
In our ITSO environment, we installed the product using the following steps:
1. From the Tivoli desktop, select Desktop →Install →Install Product.
2. The Install Product window (Figure 4-1) shows three products that are available to install.
a. Select IBM Tivoli Monitoring V5.1.1. b. Select your TMR server and the gateways on which you want to install IBM
Tivoli Monitoring V5.1.1. c. Click Install.
3. Follow the standard installation windows.
Figure 4-1 Products to install
52 IBM Tivoli Monitoring V5.1.1 Implementation Certification Study Guide
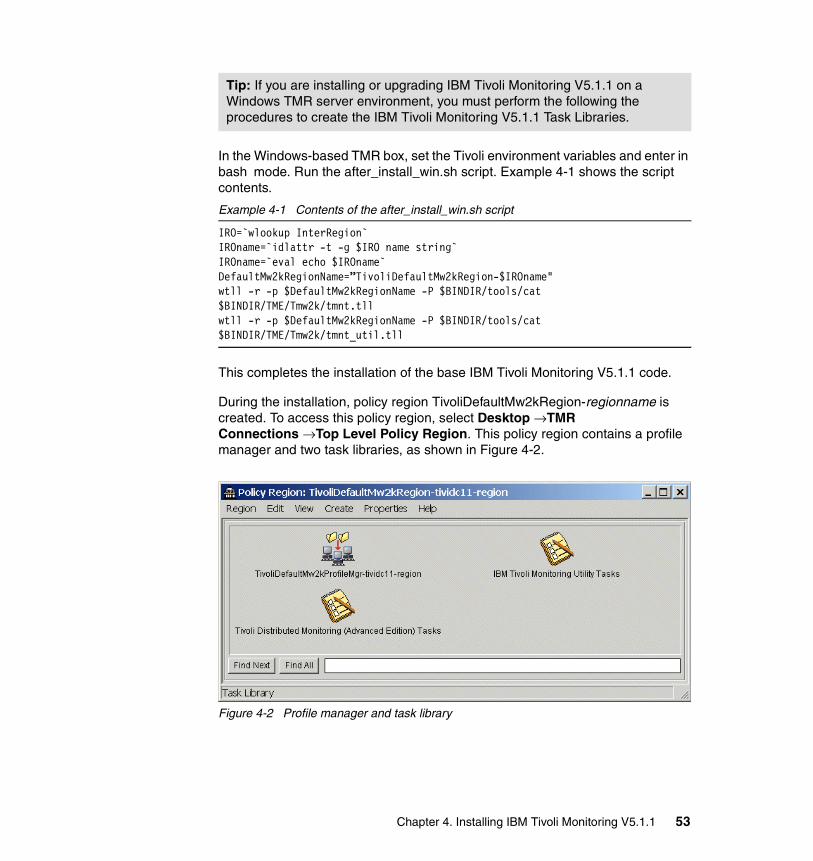
In the Windows-based TMR box, set the Tivoli environment variables and enter in bash mode. Run the after_install_win.sh script. Example 4-1 shows the script contents.
Example 4-1 Contents of the after_install_win.sh script
IRO=`wlookup InterRegion`IROname=`idlattr -t -g $IRO name string`IROname=`eval echo $IROname`DefaultMw2kRegionName=”TivoliDefaultMw2kRegion-$IROname"wtll -r -p $DefaultMw2kRegionName -P $BINDIR/tools/cat $BINDIR/TME/Tmw2k/tmnt.tll wtll -r -p $DefaultMw2kRegionName -P $BINDIR/tools/cat $BINDIR/TME/Tmw2k/tmnt_util.tll
This completes the installation of the base IBM Tivoli Monitoring V5.1.1 code.
During the installation, policy region TivoliDefaultMw2kRegion-regionname is created. To access this policy region, select Desktop →TMR Connections →Top Level Policy Region. This policy region contains a profile manager and two task libraries, as shown in Figure 4-2.
Figure 4-2 Profile manager and task library
Tip: If you are installing or upgrading IBM Tivoli Monitoring V5.1.1 on a Windows TMR server environment, you must perform the following the procedures to create the IBM Tivoli Monitoring V5.1.1 Task Libraries.
Chapter 4. Installing IBM Tivoli Monitoring V5.1.1 53
4.3 Configuring IBM Tivoli Monitoring endpointsThis section discusses the point at which you have all the IBM Tivoli Monitoring V5.1.1 components installed on the TMR server and gateways. You need to install the prerequisite software on the endpoints, such as Java Runtime Environment (JRE), Windows Management Instrumentation (WMI), and disk performance enabled.
4.3.1 Java Runtime Environment You can install the JRE using the following methods:
� From the product CD for installation using the Tivoli SIS� From the product CD in compressed format, for manual installation or
installation using the wdmdistrib –J command
You may already have an appropriate version of JRE installed. Installing the JRE manually is not a supported option. After you install JRE, you need only to link the product component to the existing JRE using a task provided with the product. This creates a symbolic link in the Tivoli directory structure under $BINDIR. The task that does this is called DMLinkJre, which resides within TivoliDefaultMw2kRegion policy region under the Tivoli Monitoring Tasks task library. The base path of the JRE installation is the only argument for the task.
4.3.2 Windows-based endpoint setupFor a Windows-based endpoint, consider the following setup requirements:
� Windows NT, Windows 95 and 98 do not have WMI installed by default. Install WMI from the Microsoft Web site.
� Data logging on a Windows NT-based endpoint requires Microsoft Access 2000 or Microsoft Data Access Components V2.1 or later.
� For Windows 2000, a JavaScript-based resource model requires the usage of Windows Script Host to be installed.
� You need to run the diskperf -y command to enable disk performance data collection resource models. You must also:
a. Determine the source for Open Database Connectivity (ODBC), WMI, CScript, and JRE installation images.
b. Retrieve ODBC, WMI, CScript install images.
54 IBM Tivoli Monitoring V5.1.1 Implementation Certification Study Guide
4.4 Installing the Web Health ConsoleThe Web Health Console is installed on a separate machine that may or may not be part of your TMR. It runs IBM HTTP Server and WebSphere Application Server, Single Server Edition Version 4.0.2. The Web Health Console installation requires at least 450 MB of temporary space.
You can install Web Health Console from the CD-ROM media and run the appropriate setup executables for the platform involved. It launches the installation wizard for you. When completed, you can access the Web Health Console from:
http://whcserver/dmwhc
4.4.1 Installing on a Windows environmentTo install the Web Health Console on Windows, follow these steps:
1. Using Web Health Console disk 2, double-click the setupwin32.exe file. If the temporary directory does not have enough space, you see an error message. To avoid this, enter the following command:
setupwin32 -is:tempdir TMPdir
Here TMPdir is the name of the temporary directory.
2. Follow the instructions presented in the installation windows. In particular, specify the following information:
a. Provide the directory name for the location on which you want to install the Web Health Console Server. The directory name must not contain spaces.
b. Provide the user name under which the Web server will run.
c. Specify Act As Operating System access for this user.
d. Provide the password for the user.
To install in silent mode using the command line, provide the following arguments:
-silent-P base_install.installLocation=DirectoryName-W user_input.user=User Name-W user_input.password=Password
You can also include these arguments in a file and pass the file to the launcher using the switch -options options file.
Chapter 4. Installing IBM Tivoli Monitoring V5.1.1 55
4.4.2 Installing on a UNIX environmentTo install the Web Health Console on UNIX, complete these steps:
1. Using Web Health Console disk 1, run one of the following files depending on the UNIX platform you are using:
– setupaix.bin on AIX– setuphp1020.bin on HP-UX10.2– setuphp11x.bin on HP-UX11.x– setupsolarisSparc.bin on Sun Solaris– setuplinux.bin on Linux
2. Follow the instructions presented in the installation windows. In particular, provide the directory name for the location on which you want to install the Web Health Console Server.
To install in silent mode using the command line, provide the following arguments to the setup command indicated earlier:
-silent-P base_install.installLocation=.Directory Name....
You can also include these arguments in a file and pass the file to the launcher using the switch -options options file.
Note: If the temporary directory does not have enough space, you may see an error message. To avoid this, enter the command (corresponding to your UNIX platform):
setupaix -is:tempdir TMPdir
Here TMPdir is the name of the temporary directory.
Note: The UNIX installation installs the IBM HTTP Server into a standard location regardless of the directory that you specify. The rest of the installation goes to the directory that you have specified. When starting the application server, you must set the DISPLAY environment variable correctly. Otherwise you cannot display any graphs with the AMW4805E message.
The standard locations are:
� AIX: /usr/HTTPServer� Sun Solaris: /opt/IBMHTTPD� Linux: /opt/IBMHTTPServer� HP: /opt/HTTPServer
56 IBM Tivoli Monitoring V5.1.1 Implementation Certification Study Guide
4.4.3 Installing the monitoring modulesFor any additional resource models that are installed, you can add the national language-enabled resources definition to display the resource model and metric names. Simply copy the message class files into the directory path install_dir/installedApps/dm.ear/dm.war/WEB-INF/classes/com/tivoli /DmForNt/resources.
4.5 Installing IBM Tivoli Monitoring WorkbenchBefore you install the workbench, you must install WMI, especially for the Windows NT or Windows 2000 platform. To install IBM Tivoli Monitoring workbench, from the IBM Tivoli Monitoring V5.1.1 Workbench CD, open the ITM5.1WB → Disk1 folder, and run setup. This launches the installation wizard.
Additionally, to debug JavaScript resource models, you need a JavaScript debugger. You can download a Microsoft debugger from:
http://msdn.microsoft.com/library/default.asp?url=/library/en-us/dnanchor/html/scriptinga.asp
Chapter 4. Installing IBM Tivoli Monitoring V5.1.1 57

58 IBM Tivoli Monitoring V5.1.1 Implementation Certification Study Guide
Chapter 5. Configuring IBM Tivoli Monitoring V5.1.1 server
This chapter discusses the configuration process for IBM Tivoli Monitoring V5.1.1. It discusses various way to configure IBM Tivoli Monitoring in the Tivoli environment and its features and interaction with other Tivoli products.
5
© Copyright IBM Corp. 2004. All rights reserved. 59
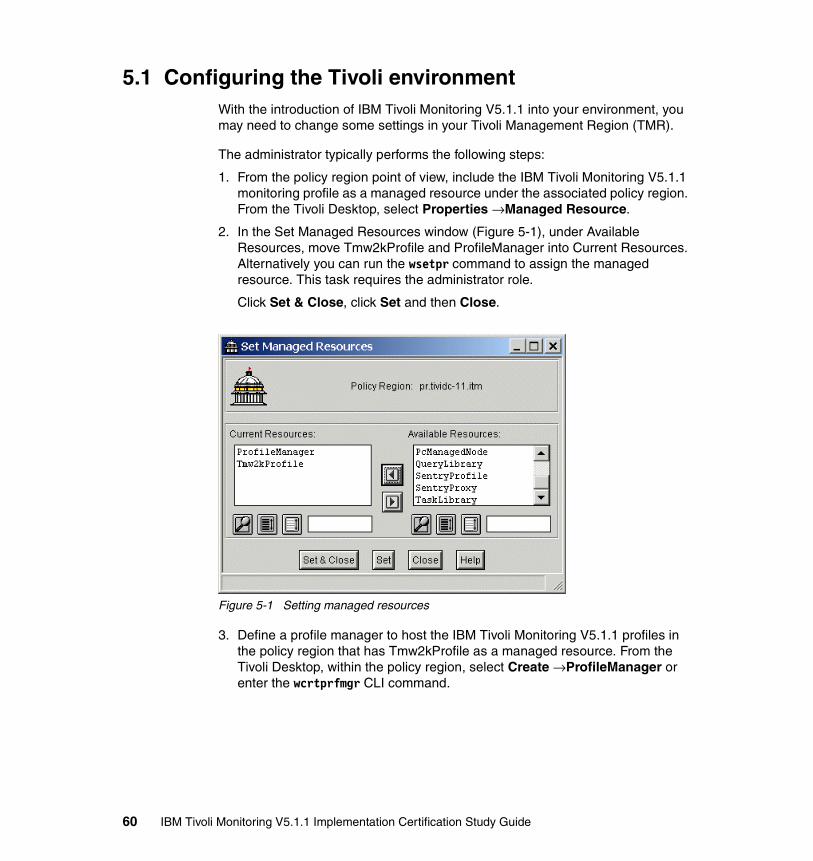
5.1 Configuring the Tivoli environmentWith the introduction of IBM Tivoli Monitoring V5.1.1 into your environment, you may need to change some settings in your Tivoli Management Region (TMR).
The administrator typically performs the following steps:
1. From the policy region point of view, include the IBM Tivoli Monitoring V5.1.1 monitoring profile as a managed resource under the associated policy region. From the Tivoli Desktop, select Properties →Managed Resource.
2. In the Set Managed Resources window (Figure 5-1), under Available Resources, move Tmw2kProfile and ProfileManager into Current Resources. Alternatively you can run the wsetpr command to assign the managed resource. This task requires the administrator role.
Click Set & Close, click Set and then Close.
Figure 5-1 Setting managed resources
3. Define a profile manager to host the IBM Tivoli Monitoring V5.1.1 profiles in the policy region that has Tmw2kProfile as a managed resource. From the Tivoli Desktop, within the policy region, select Create →ProfileManager or enter the wcrtprfmgr CLI command.
60 IBM Tivoli Monitoring V5.1.1 Implementation Certification Study Guide
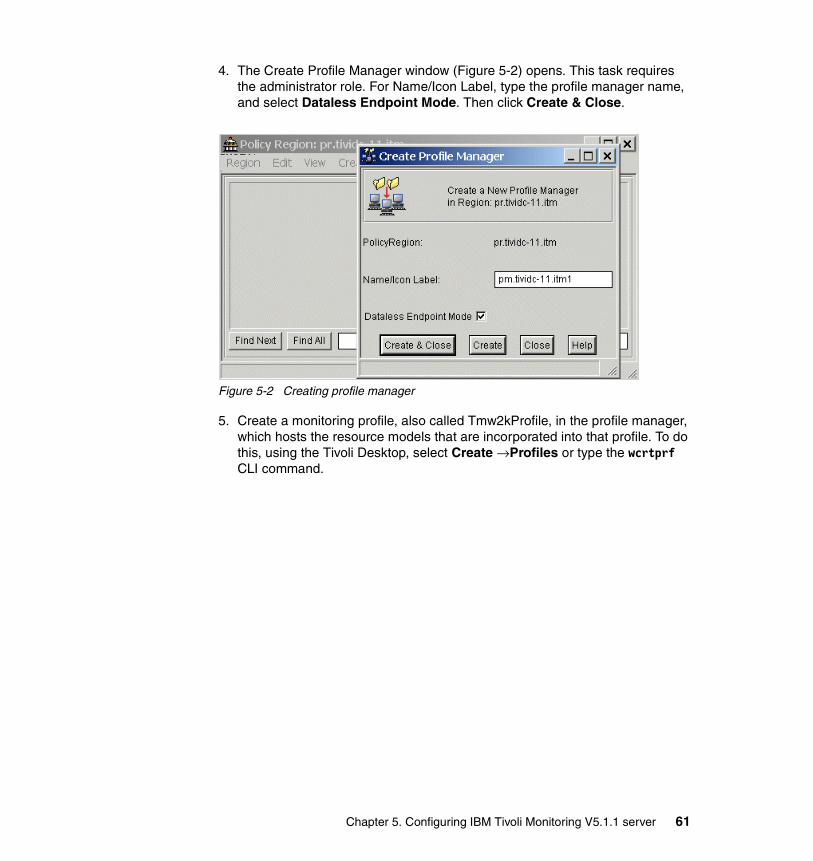
4. The Create Profile Manager window (Figure 5-2) opens. This task requires the administrator role. For Name/Icon Label, type the profile manager name, and select Dataless Endpoint Mode. Then click Create & Close.
Figure 5-2 Creating profile manager
5. Create a monitoring profile, also called Tmw2kProfile, in the profile manager, which hosts the resource models that are incorporated into that profile. To do this, using the Tivoli Desktop, select Create →Profiles or type the wcrtprf CLI command.
Chapter 5. Configuring IBM Tivoli Monitoring V5.1.1 server 61
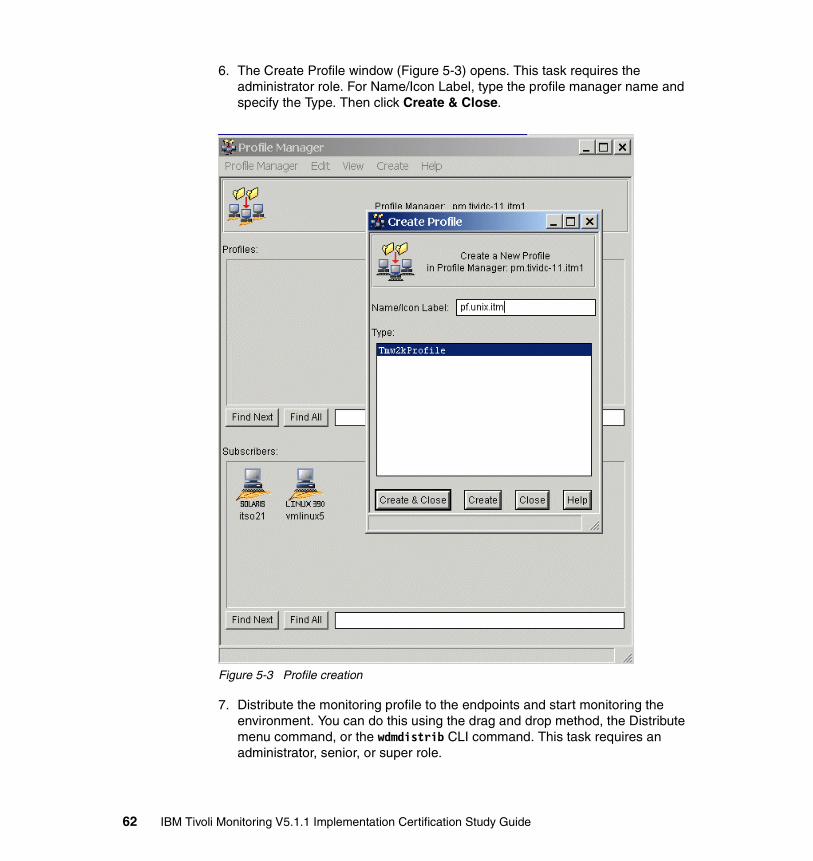
6. The Create Profile window (Figure 5-3) opens. This task requires the administrator role. For Name/Icon Label, type the profile manager name and specify the Type. Then click Create & Close.
Figure 5-3 Profile creation
7. Distribute the monitoring profile to the endpoints and start monitoring the environment. You can do this using the drag and drop method, the Distribute menu command, or the wdmdistrib CLI command. This task requires an administrator, senior, or super role.
62 IBM Tivoli Monitoring V5.1.1 Implementation Certification Study Guide
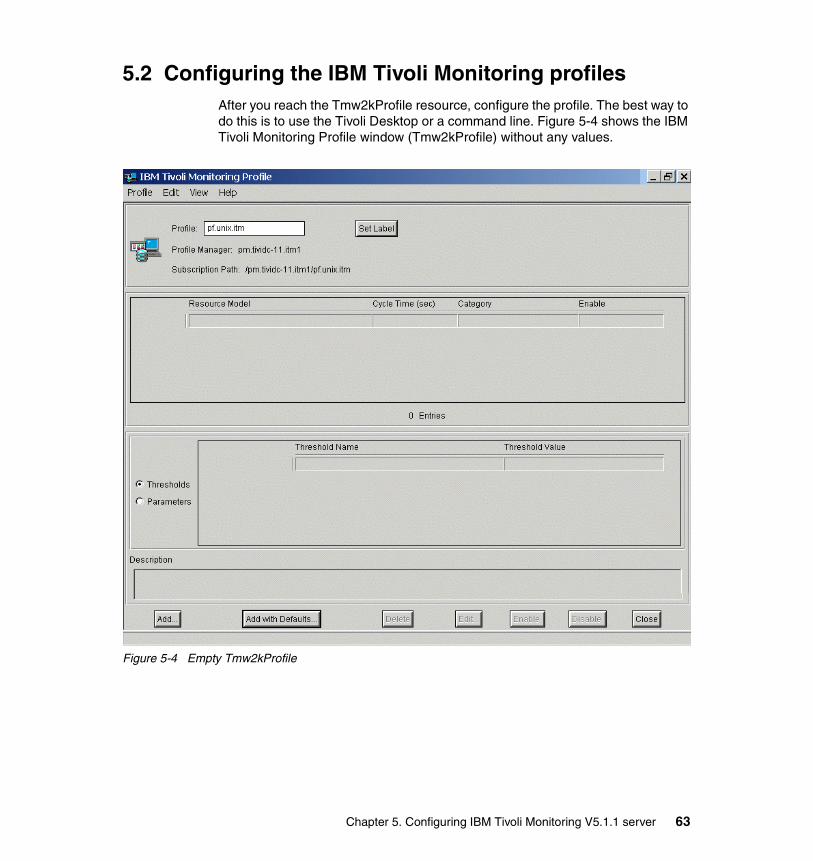
5.2 Configuring the IBM Tivoli Monitoring profilesAfter you reach the Tmw2kProfile resource, configure the profile. The best way to do this is to use the Tivoli Desktop or a command line. Figure 5-4 shows the IBM Tivoli Monitoring Profile window (Tmw2kProfile) without any values.
Figure 5-4 Empty Tmw2kProfile
Chapter 5. Configuring IBM Tivoli Monitoring V5.1.1 server 63
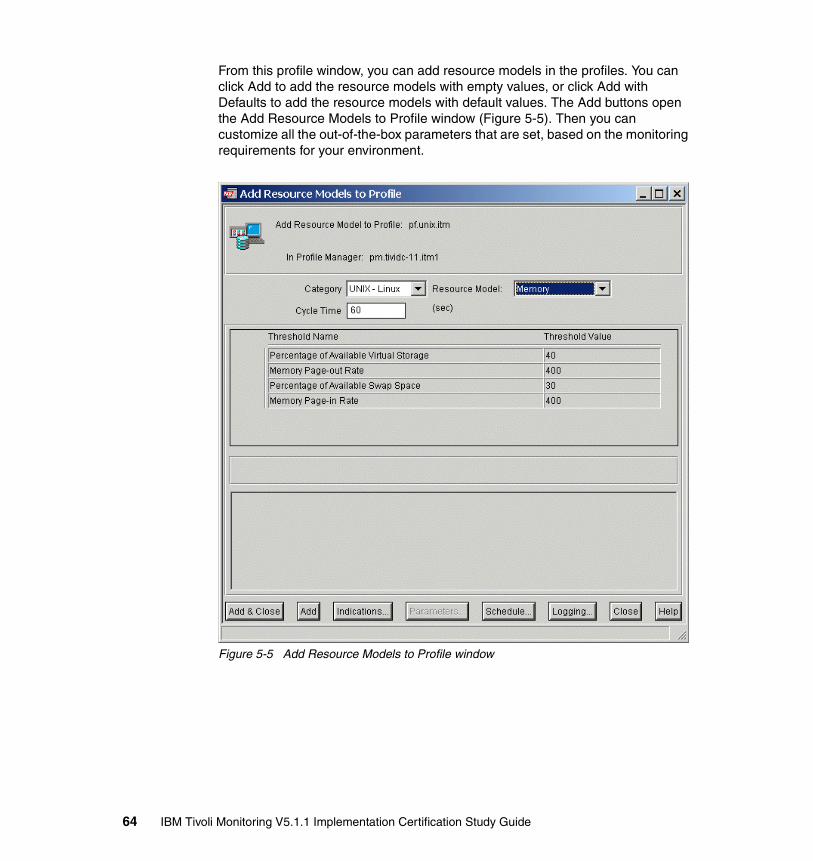
From this profile window, you can add resource models in the profiles. You can click Add to add the resource models with empty values, or click Add with Defaults to add the resource models with default values. The Add buttons open the Add Resource Models to Profile window (Figure 5-5). Then you can customize all the out-of-the-box parameters that are set, based on the monitoring requirements for your environment.
Figure 5-5 Add Resource Models to Profile window
64 IBM Tivoli Monitoring V5.1.1 Implementation Certification Study Guide
5.2.1 Customizing the cycle time and thresholdsWhen you add the resource model, default cycle time, threshold name, and default threshold, values for the resource model are displayed. The cycle time is the regular interval at which a resource model is required to collect data. You can change this value, as well as the threshold and related values. Threshold values are compared to system resource values that are provided by the Common Information Model (CIM)-compliant data providers. The analyzer can use both the cycle time and thresholds to determine how often to run through the decision tree and which values to compare the system resource data with.
� To change the cycle time, type a new value in the Cycle Time box. When you finish the customization, click Add & Close. Then the new cycle time is added to the profile.
� To change the thresholds, select the threshold. Change the value of the threshold and click Apply.
As mentioned earlier, an indication is comprised of several thresholds. Before you modify the default threshold values, you must understand the relationship between the thresholds and the indication.
5.2.2 Customizing the indicationsThe second component that can be modified is the indications. Click the Indications button. Then the Indications and Actions window opens. Configure the following items:
� For each indication, configure the number of occurrences and holes that must be met before an event is generated.
� Configure to where events are to be sent, that is, Tivoli Enterprise Console, Tivoli Business Systems Manager (TBSM), or both. You can also change severity levels of the events.
� Built-in tasks are tasks that the certain resource models are configured to execute when an event is generated. You can enable and disable these tasks from here.
� If you have a requirement to run an external script, you can create a task to run the script and then add it to the resource model to be called when an event is generated.
Built-in tasksIBM Tivoli Monitoring 5.1 provides, in the IBM Tivoli Monitoring Utility Tasks library, two new responses that can be used as actions when configuring the action list.
Chapter 5. Configuring IBM Tivoli Monitoring V5.1.1 server 65
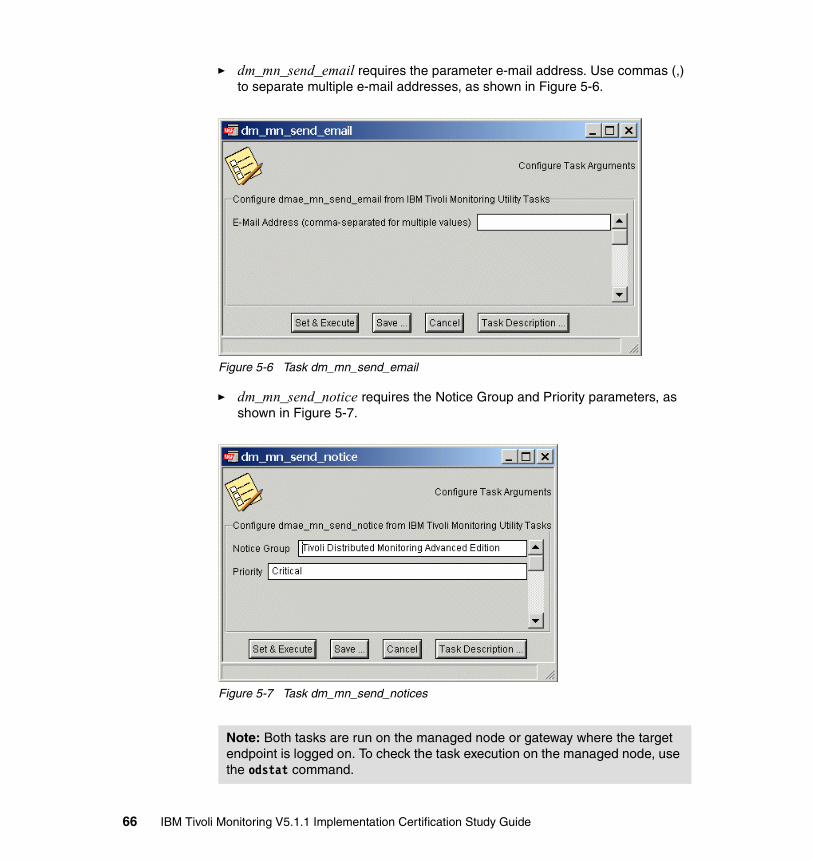
� dm_mn_send_email requires the parameter e-mail address. Use commas (,) to separate multiple e-mail addresses, as shown in Figure 5-6.
Figure 5-6 Task dm_mn_send_email
� dm_mn_send_notice requires the Notice Group and Priority parameters, as shown in Figure 5-7.
Figure 5-7 Task dm_mn_send_notices
Note: Both tasks are run on the managed node or gateway where the target endpoint is logged on. To check the task execution on the managed node, use the odstat command.
66 IBM Tivoli Monitoring V5.1.1 Implementation Certification Study Guide
5.2.3 Customizing the schedulerThe third component is the scheduler. By default, the scheduler is configured to collect monitoring at all times. If you have a requirement to monitor certain types of devices during predefined time periods, you can configure the scheduler to monitor a certain endpoint based on your requirements. To schedule monitoring, follow these steps:
1. From the Add Resource Models to Profile window (Figure 5-5 on page 64), click the Schedule button.
2. Deselect the Always check box and enter your scheduling requirements.3. Click Modify & Close.
5.2.4 Customizing data loggingThe fourth component that you can configure is logging. Logging allows for capturing performance data and storing it locally on the endpoint. You can view this data by the Web Health Console and store it in a central relational database management system (RDBMS) for further analysis. By default, no performance data is logged. The data that is logged can be kept for up to 24 hours. To log data, follow these steps:
1. In the Add Resource Models to Profile window (Figure 5-5 on page 64), click the Logging button.
2. In the Logging window, select the Enable Data Logging check box.
Logging data stores the raw data for the resource models on the endpoint. To aggregate the data, select the Aggregate Data check box and provide the aggregation period. You also need to specify how long to keep the historical data before it is deleted from the database. The database is local to the endpoint. This data can be rolled up to a central RDBMS. Using Tivoli Enterprise Data Warehouse, you can report on the data.
Note: On Windows endpoints, the data logging records information in the $LCF_DATDIR/LCFNEW/Tmw2k/db/tmw2kdb.mdb file. To provide ODBC access to this file, the system data source name tmw2k is created.
On UNIX endpoints, the data logging records information in the $LCF_DATDIR/LCFNEW/Tmw2k/Unix/data/logger/dblogger/datafile file.
The data files are created when there is a need to log data.
Chapter 5. Configuring IBM Tivoli Monitoring V5.1.1 server 67
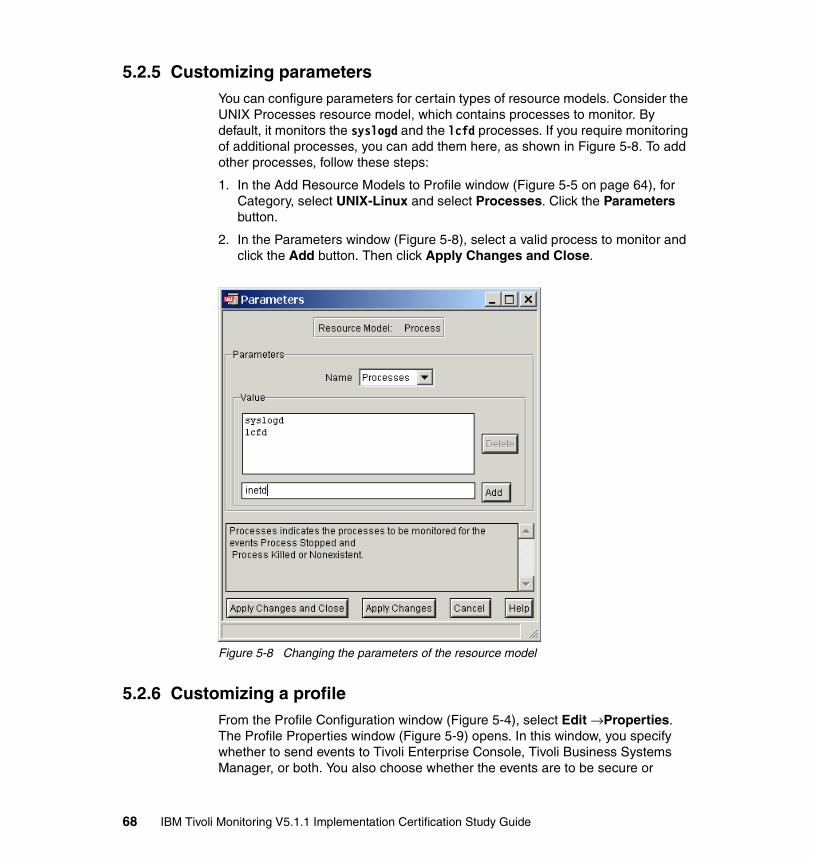
5.2.5 Customizing parametersYou can configure parameters for certain types of resource models. Consider the UNIX Processes resource model, which contains processes to monitor. By default, it monitors the syslogd and the lcfd processes. If you require monitoring of additional processes, you can add them here, as shown in Figure 5-8. To add other processes, follow these steps:
1. In the Add Resource Models to Profile window (Figure 5-5 on page 64), for Category, select UNIX-Linux and select Processes. Click the Parameters button.
2. In the Parameters window (Figure 5-8), select a valid process to monitor and click the Add button. Then click Apply Changes and Close.
Figure 5-8 Changing the parameters of the resource model
5.2.6 Customizing a profileFrom the Profile Configuration window (Figure 5-4), select Edit →Properties. The Profile Properties window (Figure 5-9) opens. In this window, you specify whether to send events to Tivoli Enterprise Console, Tivoli Business Systems Manager, or both. You also choose whether the events are to be secure or
68 IBM Tivoli Monitoring V5.1.1 Implementation Certification Study Guide
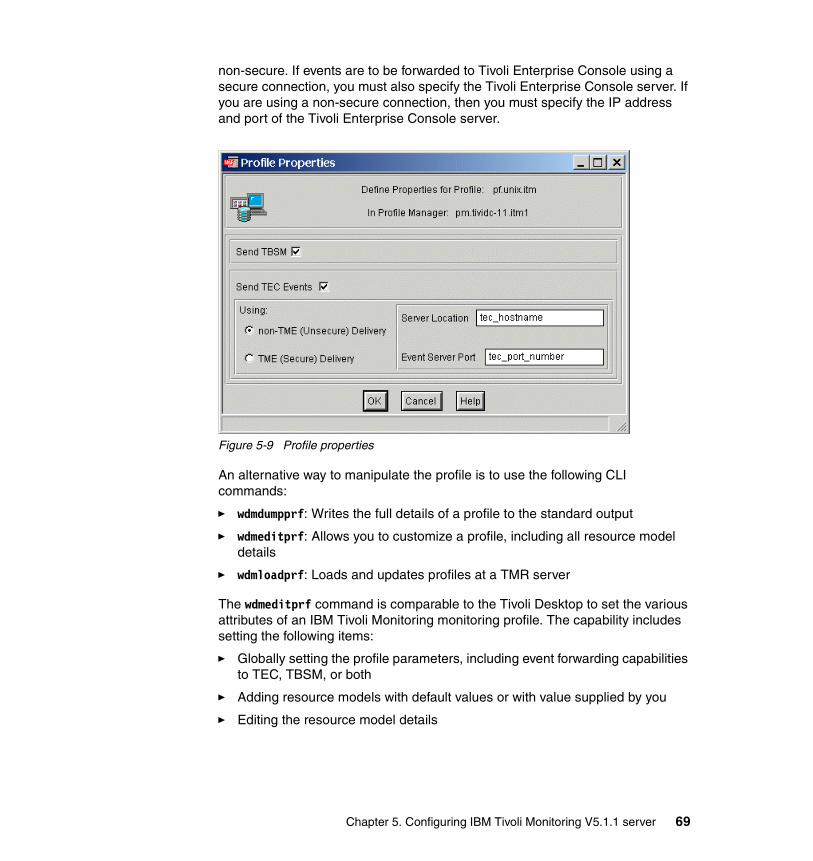
non-secure. If events are to be forwarded to Tivoli Enterprise Console using a secure connection, you must also specify the Tivoli Enterprise Console server. If you are using a non-secure connection, then you must specify the IP address and port of the Tivoli Enterprise Console server.
Figure 5-9 Profile properties
An alternative way to manipulate the profile is to use the following CLI commands:
� wdmdumpprf: Writes the full details of a profile to the standard output
� wdmeditprf: Allows you to customize a profile, including all resource model details
� wdmloadprf: Loads and updates profiles at a TMR server
The wdmeditprf command is comparable to the Tivoli Desktop to set the various attributes of an IBM Tivoli Monitoring monitoring profile. The capability includes setting the following items:
� Globally setting the profile parameters, including event forwarding capabilities to TEC, TBSM, or both
� Adding resource models with default values or with value supplied by you
� Editing the resource model details
Chapter 5. Configuring IBM Tivoli Monitoring V5.1.1 server 69
� Defining the destination monitors for events generated by the resource model, such as TEC or TBSM forwarding, from logging to historical database
� Defining the tasks triggered by events, generated by the resource model
After you edit the profile and save it, you can distribute the profile to endpoints, using the wdmdistrib command. When the direct subscriber of an IBM Tivoli Monitoring monitoring profile is a Dataless Profile Manager that contains endpoints, change the distribution defaults to All Levels/Make Exact Copy.
5.3 Resource modelsThis section discusses a resource model. A resource model is built using IBM Tivoli Monitoring workbench. The major components of a resource model are:
� Configuration file: This file contains configuration details including the resource model name, platform name, name of the decision tree file, and names of the Managed Object Format (MOF) files.
� MOF file: This file contains the particular resource model’s class description and event definitions. The classes are derived from the corresponding base classes of the resources.
The base classes for the model-to-resources association are provided in a base MOF file. The classes that describe physical resources used in the resource models, with respect to the instance providers, are provided in a resources MOF file. These additional MOF files are distributed to the endpoint the first time an IBM Tivoli Monitoring 5.1 profile is distributed to it.
� Decision tree file: This file contains both the initialization settings for the resource model and the algorithm that is used by the IBM Tivoli Monitoring 5.1 analyzer to determine if a problem is encountered in the resources described by the resource model. In Windows, this is VisualBasic script or JavaScript, and for UNIX and LINUX platforms, it is JavaScript.
� Message catalog: This catalog is for building the Tivoli Enterprise Console and Tivoli Business Systems Manager events.
� Class files: These files interface with the native library that collects performance metrics.
When an IBM Tivoli Monitoring 5.1 profile that contains a resource model is distributed to the endpoint, the following actions take place:
� Resource model files are unzipped from the resource model-specific ZIP file.
� MOF files that are specific to the resource model are compiled.
70 IBM Tivoli Monitoring V5.1.1 Implementation Certification Study Guide
� All components of the IBM Tivoli Monitoring 5.1 engine are created, loaded in memory, and started (logger, analyzer, action manager, event aggregator, and event correlator).
The profile then associates the resource model with the monitoring parameters. The available monitoring parameters within a resource model for a metric are:
� Threshold: Determines what is OK and not OK
� Monitoring interval: Determines how often to check a metric; each interval is also called a cycle
� Occurrence: Refers to a cycle during which an indication occurs for a given resource model
� Hole: Refers to a cycle during which an indication does not occur for a given resource model; none of the conditions specified for the generation of any indication are met
You can configure the resource model to accept predefined occurrences and holes before triggering the notification to prevent false alarms and event floods. The algorithm to generate the notification follows this sequence:
1. An occurrence starts the counter.
2. It counts all occurrences and holes. When the number of holes exceeds the predefined number, it resets the counter. Any exception resets the number of holes.
3. When the number of occurrences exceeds the predefined number, it generates an exception.
4. When the number of holes exceeds the predefined number, a clearing event is generated and all counters are reset.
5.4 Historical data collectionData collected from the resource models can be stored in a database. This database is based on the RDBMS interface module (RIM) technology in Tivoli Management Framework. This facility is installed with the IBM Tivoli Monitoring V5.1.1 Data Warehouse integration component.
After you install the feature, you can create the database using the scripts stored in $BINDIR/TME/Tmw2k/warehousecfg. The script is called cr_tedw_rim.sh. You must supply the information similar to the parameter of the wcrtrim command to create the RIM object. The default RIM object name is itm_rim_host name. Table 5-1 lists the various database type attributes.
Chapter 5. Configuring IBM Tivoli Monitoring V5.1.1 server 71
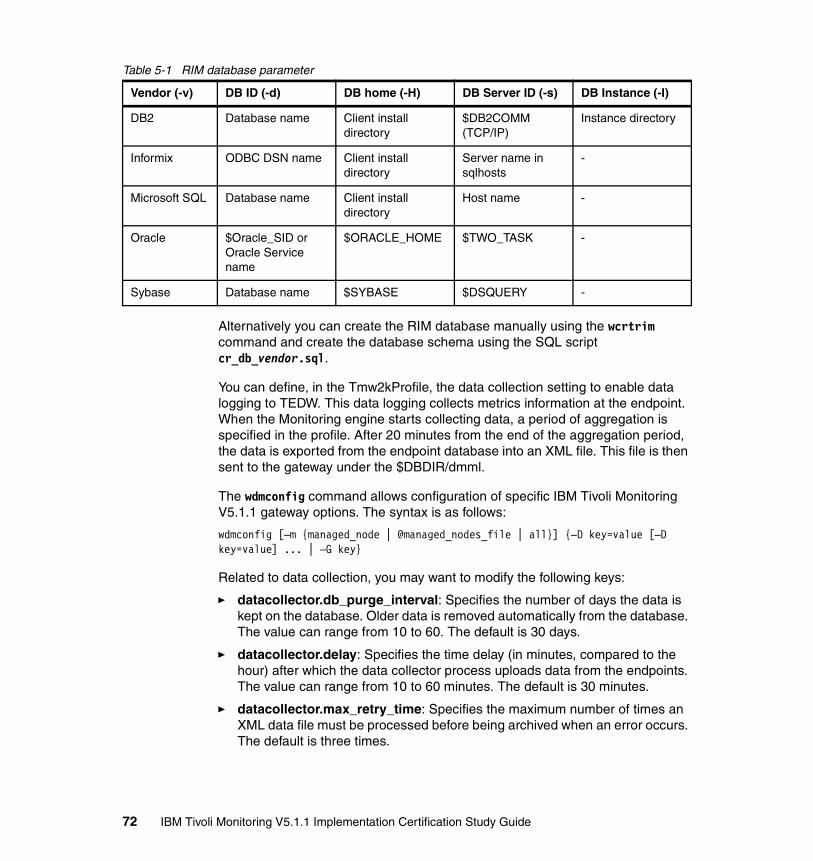
Table 5-1 RIM database parameter
Alternatively you can create the RIM database manually using the wcrtrim command and create the database schema using the SQL script cr_db_vendor.sql.
You can define, in the Tmw2kProfile, the data collection setting to enable data logging to TEDW. This data logging collects metrics information at the endpoint. When the Monitoring engine starts collecting data, a period of aggregation is specified in the profile. After 20 minutes from the end of the aggregation period, the data is exported from the endpoint database into an XML file. This file is then sent to the gateway under the $DBDIR/dmml.
The wdmconfig command allows configuration of specific IBM Tivoli Monitoring V5.1.1 gateway options. The syntax is as follows:
wdmconfig [–m {managed_node | @managed_nodes_file | all}] {–D key=value [–D key=value] ... | –G key}
Related to data collection, you may want to modify the following keys:
� datacollector.db_purge_interval: Specifies the number of days the data is kept on the database. Older data is removed automatically from the database. The value can range from 10 to 60. The default is 30 days.
� datacollector.delay: Specifies the time delay (in minutes, compared to the hour) after which the data collector process uploads data from the endpoints. The value can range from 10 to 60 minutes. The default is 30 minutes.
� datacollector.max_retry_time: Specifies the maximum number of times an XML data file must be processed before being archived when an error occurs. The default is three times.
Vendor (-v) DB ID (-d) DB home (-H) DB Server ID (-s) DB Instance (-I)
DB2 Database name Client install directory
$DB2COMM (TCP/IP)
Instance directory
Informix ODBC DSN name Client install directory
Server name in sqlhosts
-
Microsoft SQL Database name Client install directory
Host name -
Oracle $Oracle_SID or Oracle Service name
$ORACLE_HOME $TWO_TASK -
Sybase Database name $SYBASE $DSQUERY -
72 IBM Tivoli Monitoring V5.1.1 Implementation Certification Study Guide
� datacollector.rim_name: Specifies the name of the RIM object that the data collection process uses to load data to the database. The default is itm_rim_RIM host name.
� datacollector.sleep_time: Specifies the time interval (in minutes) between two consecutive requests of data uploading generated by the data collector processor. The value can range from 10 to 60 minutes. The default is 10 minutes.
� datacollector.trace_level: Specifies the level of the data collector trace. The minimum value is 0, the maximum is 2, and the default is 1.
� datacollector.trace_size: Specifies the size in bytes of the data collector trace. The default is 500000.
The wdmcollect command defines the collection property of specific endpoints. The syntax of the command is:
wdmcollect {{{–e {endpoint_name | @endpoints_file} {–s time_interval | –t | –r }} | –t | –q} [ –m managed_node ]} | { –m all { –t | –q }}wdmcollect –p
The options that you can specify or modify using the wdmconfig command are:
-e Endpoint list-s Collection time interval-t Terminate collection-r Process XML files-q Query status-p Purge data according to db_purge_interval key
Collection to the RIM database is performed typically using the wdmcollect command or automatically (for the central data warehouse) at the next full hour after profile distribution time. At that point, after an aggregation period of one hour, the data is stored in the endpoint database. Finally, 20 minutes later, the data is exported from the endpoint database into an XML file. These XML files are then written to the RIM database.
5.5 Heartbeat functionIBM Tivoli Monitoring 5.1 includes a heartbeat function, which monitors the basic signs of life at endpoints attached to the gateway at which it is enabled. Therefore, the heartbeat monitoring process is performed from the gateway.
Chapter 5. Configuring IBM Tivoli Monitoring V5.1.1 server 73
One problem that clients faced with older versions of Distributed Monitoring was that, if the engine on the endpoint failed, they had no way of knowing this. Now, the heartbeat function regularly monitors the endpoints, checking if they are running correctly. Events may be sent to any of the following locations:
� The Tivoli Business Systems Manager provided that the Tivoli Business Systems Manager Adapter component is installed at the gateway
� The Tivoli Enterprise Console for Tivoli Management Environment (TME) or secure events only
� Tivoli notice group when using Tivoli Distributed Monitoring Advanced Edition
The function can register the following statuses for an endpoint in its cache. The statuses are divided into two groups, depending on whether information or an error event is sent to the monitors:
� Statuses for which an information event is sent:
– Alive– Heartbeat has been stopped
� Statuses for which an error event is sent:
– Resource model in error status– IBM Tivoli Monitoring 5.1 engine stopped– Endpoint not available
The heartbeat function is enabled on the managed node or gateway of the endpoints that you want to monitor. The heartbeat monitoring engine has the ability to forward events to the Tivoli Enterprise Console, Tivoli Business Systems Manager, or both and send notices to the Tivoli Notice Groups. Three activities make up the heartbeat function:
� Endpoint registration� Heartbeat monitoring� Viewing endpoint cache
5.5.1 Endpoint registrationConsider a case where an IBM Tivoli Monitoring 5.1 profile is pushed to an endpoint for the first time or the IBM Tivoli Monitoring 5.1 engine is restarted on an endpoint. In this situation, the information in the endpoint cache is updated when the gateway receives a message from the endpoint. The message informs the gateway that its IBM Tivoli Monitoring 5.1 engine has been started. Figure 5-10 illustrates the flow of data.
74 IBM Tivoli Monitoring V5.1.1 Implementation Certification Study Guide
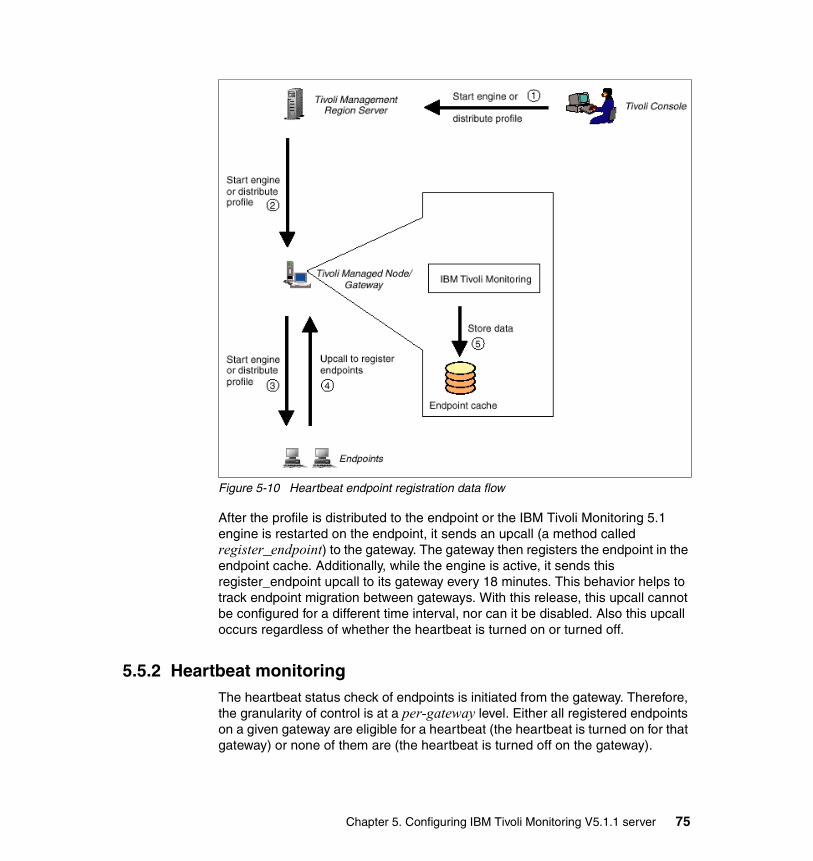
Figure 5-10 Heartbeat endpoint registration data flow
After the profile is distributed to the endpoint or the IBM Tivoli Monitoring 5.1 engine is restarted on the endpoint, it sends an upcall (a method called register_endpoint) to the gateway. The gateway then registers the endpoint in the endpoint cache. Additionally, while the engine is active, it sends this register_endpoint upcall to its gateway every 18 minutes. This behavior helps to track endpoint migration between gateways. With this release, this upcall cannot be configured for a different time interval, nor can it be disabled. Also this upcall occurs regardless of whether the heartbeat is turned on or turned off.
5.5.2 Heartbeat monitoringThe heartbeat status check of endpoints is initiated from the gateway. Therefore, the granularity of control is at a per-gateway level. Either all registered endpoints on a given gateway are eligible for a heartbeat (the heartbeat is turned on for that gateway) or none of them are (the heartbeat is turned off on the gateway).
Chapter 5. Configuring IBM Tivoli Monitoring V5.1.1 server 75
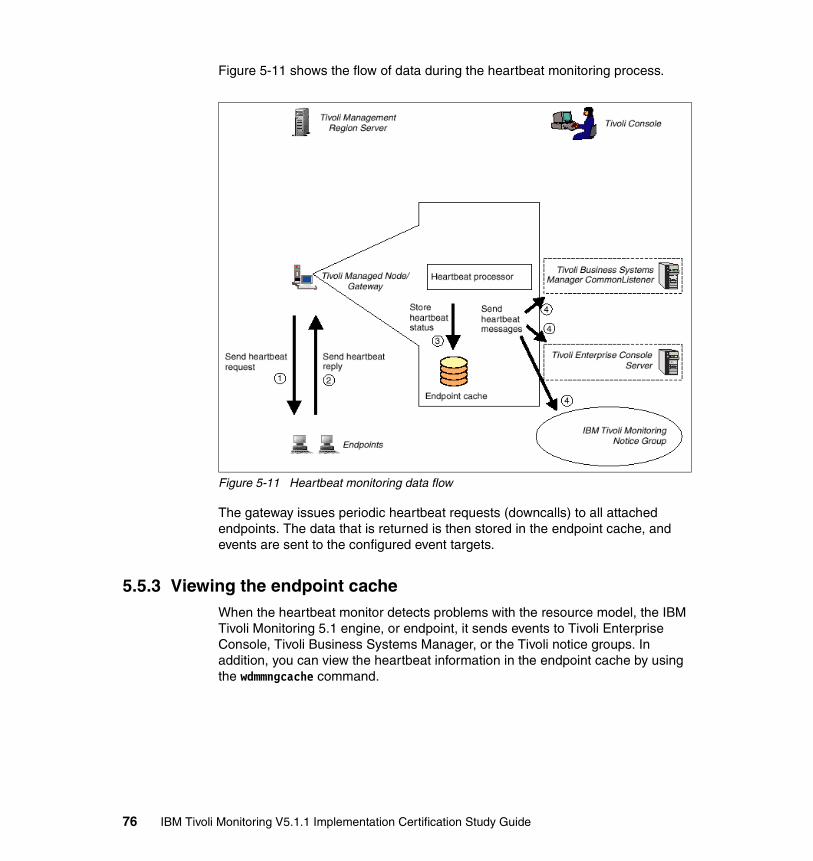
Figure 5-11 shows the flow of data during the heartbeat monitoring process.
Figure 5-11 Heartbeat monitoring data flow
The gateway issues periodic heartbeat requests (downcalls) to all attached endpoints. The data that is returned is then stored in the endpoint cache, and events are sent to the configured event targets.
5.5.3 Viewing the endpoint cacheWhen the heartbeat monitor detects problems with the resource model, the IBM Tivoli Monitoring 5.1 engine, or endpoint, it sends events to Tivoli Enterprise Console, Tivoli Business Systems Manager, or the Tivoli notice groups. In addition, you can view the heartbeat information in the endpoint cache by using the wdmmngcache command.
76 IBM Tivoli Monitoring V5.1.1 Implementation Certification Study Guide
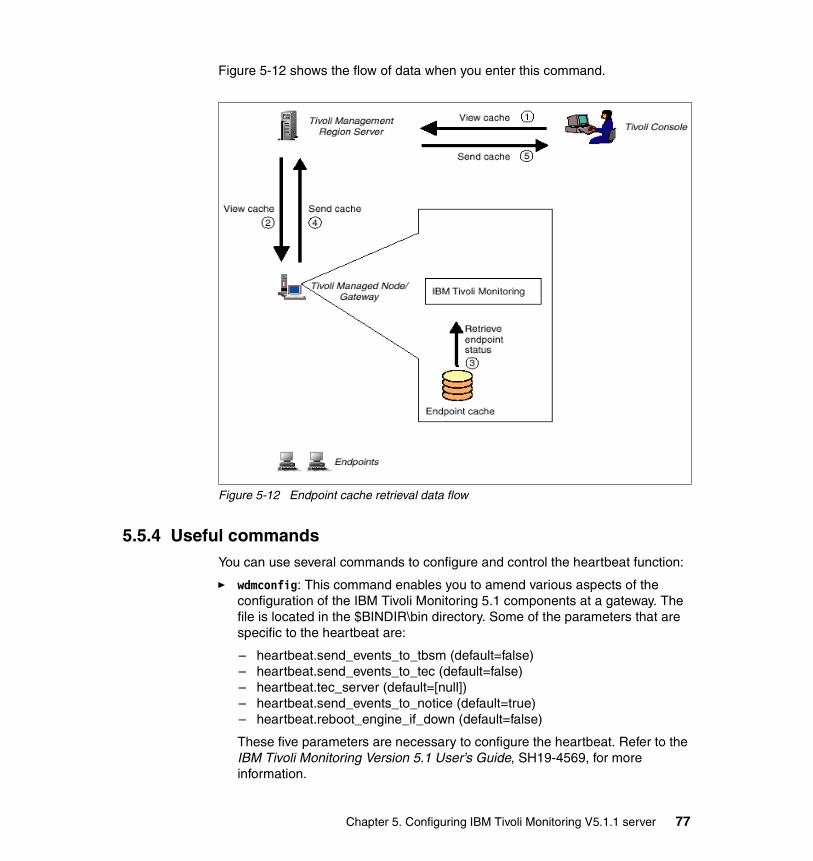
Figure 5-12 shows the flow of data when you enter this command.
Figure 5-12 Endpoint cache retrieval data flow
5.5.4 Useful commandsYou can use several commands to configure and control the heartbeat function:
� wdmconfig: This command enables you to amend various aspects of the configuration of the IBM Tivoli Monitoring 5.1 components at a gateway. The file is located in the $BINDIR\bin directory. Some of the parameters that are specific to the heartbeat are:
– heartbeat.send_events_to_tbsm (default=false)– heartbeat.send_events_to_tec (default=false)– heartbeat.tec_server (default=[null])– heartbeat.send_events_to_notice (default=true)– heartbeat.reboot_engine_if_down (default=false)
These five parameters are necessary to configure the heartbeat. Refer to the IBM Tivoli Monitoring Version 5.1 User’s Guide, SH19-4569, for more information.
Chapter 5. Configuring IBM Tivoli Monitoring V5.1.1 server 77
� wdmheartbeat: This command stops or starts the heartbeat function on gateways. It also configures the frequency and queries the status of the heartbeat processor.
� wdmmn: This command stops and starts the following processes on the gateway:
– Task engine– Tivoli Business Systems Manager adapter– Heartbeat engine (stop only)
� wdmmngcache: This command can perform a number of functions, one of which is to retrieve the endpoint cache from a gateway.
5.6 TBSM common listenerIBM Tivoli Business Systems Manager integration is performed to enable Tivoli Business Systems Manager to view the resources monitored by IBM Tivoli Monitoring V5.1.1. The integration provides a complete availability solution that you can view at the business level. IBM Tivoli Monitoring V5.1.1 feeds the availability status of various resources to Tivoli Business Systems Manager and the configured LOB views present the Business Systems Manager critical data to manage the business objects. With this view, the Business Systems Manager can understand the business impact that the availability status of a resource can have.
The integration between IBM Tivoli Monitoring V5.1.1 and Tivoli Business Systems Manager is achieved by:
� Installing and configuring the CommonListener service on the Tivoli Business Systems Manager Management Server
� Installing and configuring the TBSM Adapter on each of the gateways whose attached endpoints are to be monitored
By integrating Tivoli Business Systems Manager with IBM Tivoli Monitoring V5.1.1, the following actions are performed:
� TBSM Adapter performs endpoint registration and discovery when you issue the wdmdiscovery command on the gateway.
Note: You can stop the heartbeat engine with the wdmmn command, but not restart it. After you stop the engine, you must use the wdmheartbeat command to reconfigure the frequency and restart the heartbeat engine.
78 IBM Tivoli Monitoring V5.1.1 Implementation Certification Study Guide
� IBM Tivoli Monitoring V5.1.1 events are sent directly to Tivoli Business Systems Manager through the TBSM Adapter on the endpoint gateway.
� IBM Tivoli Monitoring V5.1.1 Health Console can be launched from the Tivoli Business Systems Manager Java Console.
The IBM Tivoli Monitoring V5.1.1 TBSM Adapter is installed on each gateway that is required to send events from its endpoints to Tivoli Business Systems Manager.
You configure the IBM Tivoli Monitoring V5.1.1 TBSM Adapter using the wdmconfig command. You must do this before IBM Tivoli Monitoring V5.1.1 can interact with Tivoli Business Systems Manager. Configure the following parameters for this functionality:
� transport.server.mqe.port: This is the port number that is used by the CommonListener to listen. The default port number is 8082.
� transport.server.ip.address: This is the IP address of the Tivoli Business Systems Manager server where the CommonListener service is installed.
� tbsma.jre_root: This is the root path of the JRE installation, if it is not specified at the time of installing the IBM Tivoli Monitoring V5.1.1 TBSM Adapter.
Other key/value pairs that you can use for the TBSM Adapter configuration are provided in the following list. All these of these pairs and their values are contained in the $DBDIR/dmml/.config file, which you can read, but not modify manually. If you want to modify this file, use the wdmconfig command.
� adapter.trace.enable: Set this to true if you want to write to the file identified in trace.filename, all trace messages regarding the operations of the adapter. The default is false.
� adapter.trace.level: Set this to low, medium, or high, according to the level of detail that you require if you enabled adapter trace messages. The default is low.
� adapter.working.dir: This is the working directory that is used by the adapter. The default, which you are recommended to use, is the Tivoli Monitoring middle layer directory ($DBDIR/dmml).
Note: Before you install the IBM Tivoli Monitoring V5.1.1 TBSM Adapter, add jre_root/jre/bin;/jre_root/jre/bin/classic (jre_root is the directory where JRE is installed) to the PATH environment variable in both UNIX and Windows systems.
Chapter 5. Configuring IBM Tivoli Monitoring V5.1.1 server 79
� subnet-mask:network_id: This is the subnet mask of the CommonListener component, for example:
subnet-mask:mynetworkid=255.255.255.0
� tbsma.jre_root: This parameter is set during the installation of the Tivoli Business Systems Manager Adapter. You do not need to change it manually.
However, for example, if you want to install the adapter on a group of gateways using one instance of the install action or command, you must change this parameter on any gateways in the group that have JRE installed at a location different from the one that is supplied in the Install Options window. Set this parameter to the complete path of the root directory of JRE 1.3.0 (excluding the /bin directory).
� trace.filename: This is the file name to which the trace messages from the adapter are written. The default is dm.trc.
� transport.mqe.usefiller: Set this parameter to true if the gateway on which the adapter is installed is running Windows NT 4.0 Service Pack 5. Otherwise leave it is as the default value of false.
� transport.trace.enable = false: Set this parameter to true if you want to write, to the file identified in trace.filename, all messages regarding the transport of adapter-acquired data to the CommonListener. The default is false.
� transport.trace.level: Set this value to low, medium, or high, according to the level of detail that you require if you enabled transport trace messages. The default is low.
After you install and configure the adapter, the adapter provides its services in a fully automatic way, without needing to be independently started or stopped. It carries out the following activities:
� Bulk discovery
You can issue the wdmdiscovery command from the Tivoli desktop to carry out a bulk discovery. The adapter sends details of all systems that it has in its cache to the Tivoli Business Systems Manager's CommonListener.
� Delta discovery
You can also issue the wdmdiscovery command from the Tivoli desktop to carry out a delta discovery. The adapter sends details of all changes since the last discovery to the Tivoli Business Systems Manager’s CommonListener.
Note: In a Windows NT workstation, if the install target path contains a directory with spaces in the name, you must specify the directory name between single quotation marks, for example, D:\'Program Files'\jre.
80 IBM Tivoli Monitoring V5.1.1 Implementation Certification Study Guide
The Tivoli Business Systems Manager Management Server is populated with the resources monitored by IBM Tivoli Monitoring V5.1.1 through the TBSM Adapter by using the wdmdiscovery command. When the wdmdiscovery command is issued the first time with the bulk discovery switch, the resource objects monitored by IBM Tivoli Monitoring V5.1.1 are automatically created in the TSBM server. When the wdmdiscovery command is issued, the TBSM Adapter retrieves the endpoint list from the epcache.db file in the $DBDIR/dmml directory and communicates the discovered resources to the Tivoli Business Systems Manager server through the CommonListener.
If the wdmdiscovery command is issued with the bulk discovery option again, then existing objects that were populated by the command issued before are deleted before recreating objects for discovered resources. Therefore, we recommend that you issue the command with the delta discovery switch if there are no significant changes in the IBM Tivoli Monitoring V5.1.1 monitoring environment.
5.7 Event forwarding to TECYou perform the configuration required to forward events to IBM Tivoli Enterprise Console on both the IBM Tivoli Monitoring V5.1.1 and IBM Tivoli Enterprise Console.
5.7.1 Setting up the IBM Tivoli Monitoring V5.1.1 profileTo set up the profile, follow these steps:
1. From any Tmw2kProfile window, select Edit →Properties.
2. The Profile Properties window (Figure 5-13) opens.
a. Select the Send TEC Events check box to enable sending events to the Tivoli Enterprise Console server.
b. Choose the delivery mode for sending the events. The choices are:
• Non-TME (Unsecure) Delivery: You must specify the event server port and server location where the event will be sent. Specify the event server port if the TEC server runs on Windows (default is 5529). Otherwise, set this value to 0. Enter the server location as a fully qualified Tivoli Enterprise Console server host name (DNS name) or IP address.
• TME (Secure) Delivery: From the Choose TEC Server list, select the Tivoli Enterprise Console server. The Tivoli Enterprise Console Adapter Configuration Facility (ACF) must be installed on the gateway if you choose the TME (secure) delivery mode.
Chapter 5. Configuring IBM Tivoli Monitoring V5.1.1 server 81
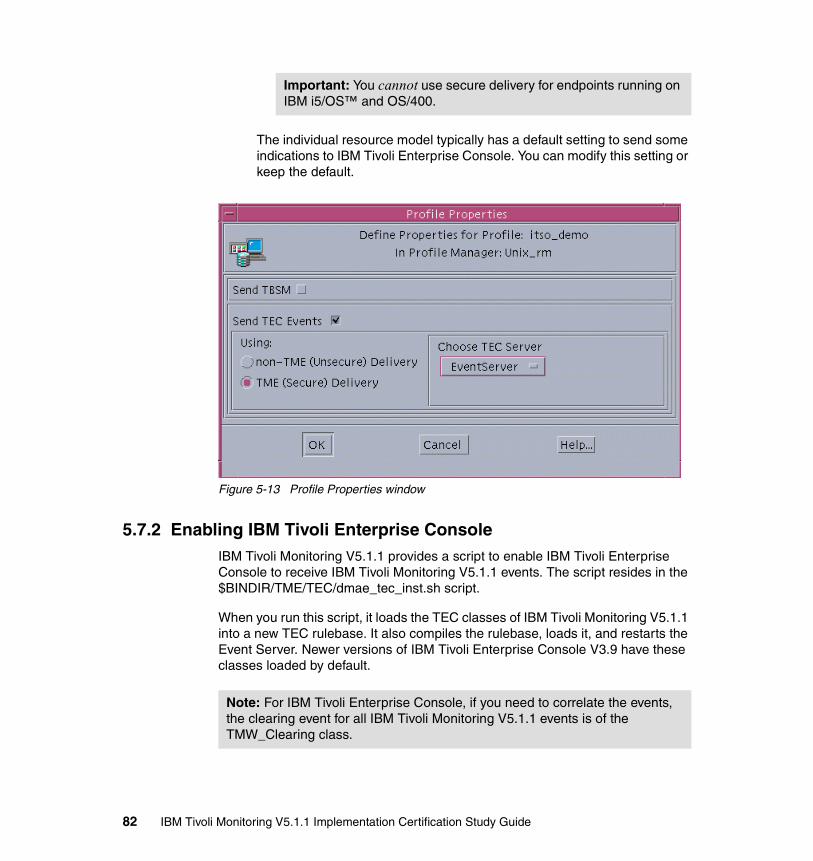
The individual resource model typically has a default setting to send some indications to IBM Tivoli Enterprise Console. You can modify this setting or keep the default.
Figure 5-13 Profile Properties window
5.7.2 Enabling IBM Tivoli Enterprise Console IBM Tivoli Monitoring V5.1.1 provides a script to enable IBM Tivoli Enterprise Console to receive IBM Tivoli Monitoring V5.1.1 events. The script resides in the $BINDIR/TME/TEC/dmae_tec_inst.sh script.
When you run this script, it loads the TEC classes of IBM Tivoli Monitoring V5.1.1 into a new TEC rulebase. It also compiles the rulebase, loads it, and restarts the Event Server. Newer versions of IBM Tivoli Enterprise Console V3.9 have these classes loaded by default.
Important: You cannot use secure delivery for endpoints running on IBM i5/OS™ and OS/400.
Note: For IBM Tivoli Enterprise Console, if you need to correlate the events, the clearing event for all IBM Tivoli Monitoring V5.1.1 events is of the TMW_Clearing class.
82 IBM Tivoli Monitoring V5.1.1 Implementation Certification Study Guide
Chapter 6. Problem determination for IBM Tivoli Monitoring V5.1.1
This chapter discusses various techniques for debugging and problem determination. This includes tracing and finding log files.
6
© Copyright IBM Corp. 2004. All rights reserved. 83
6.1 TMR server logs and tracesIn Tivoli Management Region (TMR) servers, IBM Tivoli Monitoring V5.1.1 provides a distribution log in addition to the Tivoli Framework log files.
6.1.1 Profile distribution processThe profile distribution process records information about distribution and status on the TMR server. Therefore, you should analyze distribution problem gathering logs from the TMR server.
The log file maintained in the TMR contains information about profile distribution to any of the subscribers. It includes the following details:
� Name of the log file: msg_Tmw2kProfilename.log
� Location of the log file: $DBDIR/AMW/logs
� Configuration: To configure the log when distributing by means of the wdmdistrib command, use the options - e, - i, and - w. There are no configuration options when the graphical user interface (GUI) is used to perform a distribution. The default is that all options are specified.
The profile distribution process uses MDist2. Therefore, you may need to check the MDist2 logs.
� TMR Distribution Manager: $DBDIR/distmgr.log� Gateway Repeater: $DBDIR/gatelog� Managed node Repeater: $DBDIR/rpt2log� Endpoint: $LCF_DATDIR/lcfd.log
6.2 Gateway logs and tracesAt the gateway, IBM Tivoli Monitoring V5.1.1 maintains five traces, each of which is explained in the following sections:
� Heartbeat engine traces� Task engine trace� Endpoint upcall traces� Request manager trace� Profile core trace
Tip: You can use the wmdist -D command to change the level of detail for distmgr.log. Valid debug numbers are from 0 (least information) through 9 (most information). The default value is 3.
84 IBM Tivoli Monitoring V5.1.1 Implementation Certification Study Guide
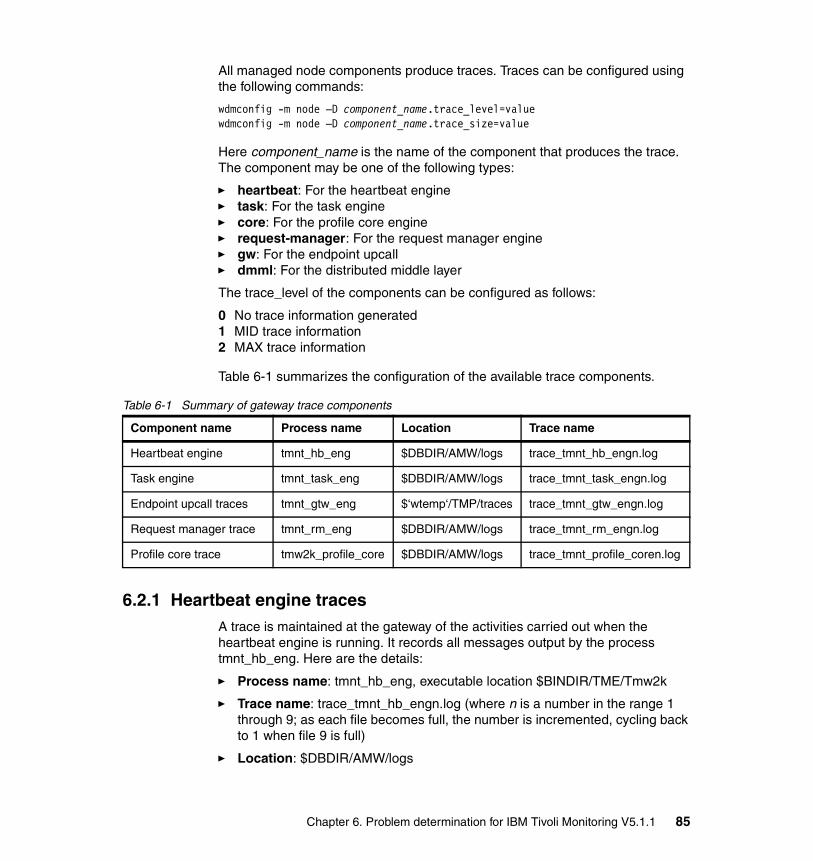
All managed node components produce traces. Traces can be configured using the following commands:
wdmconfig -m node –D component_name.trace_level=valuewdmconfig -m node –D component_name.trace_size=value
Here component_name is the name of the component that produces the trace. The component may be one of the following types:
� heartbeat: For the heartbeat engine� task: For the task engine� core: For the profile core engine� request-manager: For the request manager engine� gw: For the endpoint upcall� dmml: For the distributed middle layer
The trace_level of the components can be configured as follows:
0 No trace information generated1 MID trace information2 MAX trace information
Table 6-1 summarizes the configuration of the available trace components.
Table 6-1 Summary of gateway trace components
6.2.1 Heartbeat engine tracesA trace is maintained at the gateway of the activities carried out when the heartbeat engine is running. It records all messages output by the process tmnt_hb_eng. Here are the details:
� Process name: tmnt_hb_eng, executable location $BINDIR/TME/Tmw2k
� Trace name: trace_tmnt_hb_engn.log (where n is a number in the range 1 through 9; as each file becomes full, the number is incremented, cycling back to 1 when file 9 is full)
� Location: $DBDIR/AMW/logs
Component name Process name Location Trace name
Heartbeat engine tmnt_hb_eng $DBDIR/AMW/logs trace_tmnt_hb_engn.log
Task engine tmnt_task_eng $DBDIR/AMW/logs trace_tmnt_task_engn.log
Endpoint upcall traces tmnt_gtw_eng $‘wtemp‘/TMP/traces trace_tmnt_gtw_engn.log
Request manager trace tmnt_rm_eng $DBDIR/AMW/logs trace_tmnt_rm_engn.log
Profile core trace tmw2k_profile_core $DBDIR/AMW/logs trace_tmnt_profile_coren.log
Chapter 6. Problem determination for IBM Tivoli Monitoring V5.1.1 85
� Configuration: To configure the log, use the command:
wdmconfig -m node –D heartbeat.trace_level= 0 - 2wdmconfig -m node –D heartbeat.trace_size=value
After you change the trace level or size, restart the heartbeat engine to reflect the changes. To stop the heartbeat engine, use the command:
wdmmn -stop -m node -h
To start the heartbeat engine, enter the command:
wdmheartbeat -m node -s frequency
6.2.2 Task engine traceA trace is maintained at the gateway of the activities carried out when the task engine is running, to perform tasks on attached endpoints, as determined by resource model definitions. It records all messages output by the process tmnt_task_eng. Here are the details:
� Process name: tmnt_task_eng, executable location $BINDIR/TME/Tmw2k
� Trace name: trace_tmnt_task_engn.log (where n is a number in the range 1 through 9; as each file becomes full, the number is incremented, cycling back to 1 when file 9 is full)
� Location: $DBDIR/AMW/logs
� Configuration: To configure the log, use the commands:
wdmconfig -m node –D task.trace_level= 0 - 2wdmconfig -m node –D task.trace_size=value
After you change the trace level or size, restart the task engine to reflect the changes. To stop the task engine, use the command:
wdmmn -stop -m node -t
To start the task engine, type the command:
wdmmn -start -m node -t
6.2.3 Endpoint upcall tracesA trace is maintained at the gateway of the upcall messages sent to the gateway from the endpoints. It contains the following details:
� Endpoint registration upcalls� Events and indications sent from the endpoint component� Task upcalls
86 IBM Tivoli Monitoring V5.1.1 Implementation Certification Study Guide
It records all messages output by the process tmnt_gtw_eng, which receives the upcalls. Here are the details:
� Process name: tmnt_gtw_eng, executable location $BINDIR/TME/Tmw2k
� Trace name: trace_tmnt_gtw_engn.log (where n is a number in the range 1 through 9; as each file becomes full, the number is incremented, cycling back to 1 when file 9 is full)
� Location:
– UNIX or Linux: /tmp/AMW/logs– Windows: $DBDIR/tmp/AMW/logs
� Configuration: To configure the log, use the commands:
wdmconfig –D gw.trace_level = <value1>wdmconfig –D gw.trace_size = <value2>
6.2.4 Request manager traceA trace is maintained at the gateway of the activities carried out when the request manager process is running. It records all messages output by the process tmnt_rm_eng. Here are the details:
� Process name: tmnt_trm_eng, executable location $BINDIR/TME/Tmw2k
� Trace name: trace_tmnt_rm_engn.log (where n is a number in the range 1 through 9; as each file becomes full, the number is incremented, cycling back to 1 when file 9 is full)
� Location: $DBDIR/AMW/logs
� Configuration: To configure the log, use the commands:
wdmconfig -m node –D request-manager.trace_level= 0 - 2wdmconfig -m node –D request-manager.trace_size= value
After you change the trace level or size, restart the request manager to reflect the changes. To stop the request manager, use the command:
wdmmn -stop -m node -r
To start the request manager, type the command:
wdmmn -start -m node -r
Note: In our environment, the process tmnt_gtw could not generate trace information about the trace_tmnt_gtw_engn.log file, even when the trace_level was configured to the higher trace level.
Chapter 6. Problem determination for IBM Tivoli Monitoring V5.1.1 87
6.2.5 Profile core traceA log is maintained at the gateway of the activities carried out when the profile core engine is running. It records all messages output by the process tmw2k_profile_core. Here are the details:
� Process name: tmw2k_profile_core, executable location $BINDIR/TME/Tmw2k
� Trace name: trace_tmnt_profile_coren.log (where n is a number in the range 1 through 9; as each file becomes full, the number is incremented, cycling back to 1 when file 9 is full)
� Location: $DBDIR/AMW/logs
� Configuration: To configure the log, use the wdmconfig command to change the following variables:
wdmconfig -m node –D core.trace_level= 0 - 2wdmconfig -m node –D core.trace_size=value
6.3 Endpoint logsDifferent log files are available depending on the platform of the operating system. Logs and traces maintained at Windows endpoints are different from those at non-Windows endpoints.
6.3.1 Common endpoint logsThe common endpoint logs are primarily profile distribution endpoint logs. IBM Tivoli Monitoring V5.1.1 uses lcfd.log as a profile distribution endpoint log.
The IBM Tivoli Monitoring V5.1.1 distribution process records the MDist2 activities of the engine update, as follows:
� Process name: Tmw2k_ep
� Log name: lcfd.log
� Location: $LCF_DATDIR
� Configuration: To configure the log, you can edit the last.cfg, and then change the parameter log_threshold to 3 or enter the following command:
wadminep endpoint reexec_lcfd -D log_threshold=3
88 IBM Tivoli Monitoring V5.1.1 Implementation Certification Study Guide
6.3.2 Windows endpoint logsIBM Tivoli Monitoring V5.1.1 maintains an endpoint engine log at Windows endpoints, and there are also logs maintained by Windows Management Instrumentation (WMI).
Windows endpoint engine logThe main trace log generated by the IBM Tivoli Monitoring V5.1.1 engine at Windows endpoints records the activities of the endpoint engine, as follows:
� Process name:
– Tmw2k, executable location %LCF_DATDIIR%\LCFNEW\Tmw2k\bin
– Tmw2k_ep, executable location %LCF_DATDIIR%\cache\bin\w32-ix86\TME\Tmw2k
� Trace name: Tmw2k.log (when the log is full, the oldest 20% of messages is deleted)
� Location: %LCF_DATDIR%/LCFNEW/Tmw2k
� Configuration: To configure the trace, issue the wdmtrceng command from the server or managed node. Identify the endpoint at which you want to configure the log. You can set any of the following parameters:
– Trace: Tmw2k.log.– Trace level: Default is 0, or you can set the level to the following modes:
0 Errors1 Warnings and errors2 All steps of the monitoring process3 Verbose output, all operations of the monitoring process
– Maximum file size: Default is 5000000 (5.0 MB).
The wdmtrceng command changes the following registry hives:
� HKEY_LOCAL_MACHINE →SOFTWARE →Tivoli →Tmw → DisplayThreshold
� HKEY_LOCAL_MACHINE →SOFTWARE →Tivoli →Tmw →MaxFileLogSize
Each line in the log contains the following columns:
� Date
� Trace level
Note: We recommend that you do not change the trace level for performance reasons.
Chapter 6. Problem determination for IBM Tivoli Monitoring V5.1.1 89
� Component/classes
– ActionManager: Executes corrective actions (built-in tasks)
– Adapters: Sends events to TEC and Tivoli Business Systems Manager (TBSM)
– Analyzer: Collects and analyses the performance data
– ComponentManager: Provides the default implementation for creation/profile as push, start, stop, or delete
– Dispatcher: Responsible for forwarding the events or operations to the subscribed components
– EventAggregator: Receives indications from decision trees and processes those based on the occurrences and holes
– EventCorrelator: Consolidates and correlates events generated between different resource models
– InstallSharedDll: Installs the shared dynamic linked library (DLL)
– Logger: Stores the data locally on the endpoint
– MsgQueueManager
– MofCompiler
– TemporarySink: A virtual utility that provides a wrapping to WMI for facilitating the implementation of WMI event listeners; also provides support for checking the correct behavior, ensuring that WMI does not unload the listeners
– TMNT_Upcall
– TMWMethodProv: The WMI method provider; responsible for implementing the Common Information Model (CIM) class methods
– TMWService: An object that allows the scripts implementing the best practices to configure and set the default values for parameters and thresholds to specify the data sources that will be used; also useful to use such IBM Tivoli Monitoring V5.1.1 services as event sending, tracing, running monitors and scripts, and data logging; basically, a way the scripts interface the engine and the underlying CIM implementation
– WbemConnector
Note: This is because the upcall is not thread safe. Therefore, events or operations that need to perform upcall need to pass through the dispatcher.
90 IBM Tivoli Monitoring V5.1.1 Implementation Certification Study Guide
� Thread ID
� Message
After you change the trace settings, restart the endpoint monitoring engine to reflect the changes. To stop the monitoring engine, use the command:
wdmcmd -stop -e endpoint_label
To start the monitoring engine, enter the command:
wdmcmd -restart -e endpoint_label
WMIYou can use the Workbench to see the functionality of the Windows resource model, and then use CIM Studio to browse the CIM repository. CIM Studio provides the wbemdump command, which is a command line interface (CLI) tool that can query the CIM repository. These kinds of tools can be useful to determine the efficiency of the probes.
The WMI log files record the activities of WMI in collecting the data required by the resource models. These log files are located in the %SystemRoot%/system32/wbem/logs directory.
For details, see the WMI documentation available in Windows Help, or refer to the WMI Tutorial on the Web at:
http://www.microsoft.com/downloads/release.asp?releaseid=12570
6.3.3 Non-Windows endpoint logsIBM Tivoli Monitoring V5.1.1 maintains four logs at the endpoint:
� Endpoint engine update log� Endpoint engine log and trace� Endpoint native trace� Endpoint JMX log
The following sections explain each of these logs in more detail.
Tip: When you enter the wdmtrceng command on a Windows target system, you must use the forward slash (/) in the directory path, for example:
wdmtrceng -e itsotiv1 c:/progra~1/tivoli/lcf/dat /1/LCFNEW/ Tmw2k/Tmw2k.log 3 800000
Chapter 6. Problem determination for IBM Tivoli Monitoring V5.1.1 91
Endpoint engine update logThe endpoint engine update log maintains details of the activities of the engine update process, which is the process that launches and controls the endpoint engine, as follows:
� Process name: The tmw2k_ep process starts and finishes quickly, so it is not possible to see the running process.
� Log name: When the trace_dmxeu.log log is full, it is renamed as dmxeu.old, deleting any existing file with that name, and a new log file is created.
� Location: The log is located in $LCFDATDIR/LCFNEW/AMW/logs.
� Configuration: To configure the trace, issue the wdmtrceng command from the server or managed node, identifying the endpoint at which you want to configure the log. You can set any of the following parameters:
– Trace trace_dmxeu.log– Trace level: Default is 0 or you can set the following modes:
0 Errors1 Warnings and errors: Trace level MID2 All steps of the monitoring: Trace level MAX3 Verbose output, all operations of the monitoring process: Trace level
MAX and OTHER
Note: The endpoint engine update log, endpoint engine log, endpoint native trace, and endpoint JMX log use the same configuration file for tracing. Therefore, changing the trace level of one log affects the settings of the other logs.
The wdmtrceng command changes the files:
� $LCF_DATDIR/LCFNEW/Tmw2k/Unix/data/log_level� $LCF_DATDIR/LCFNEW/Tmw2k/Unix/data/log_size
In our environment, to change all trace levels to 3 and the trace size to 8000000, we entered the following command:
wdmtrceng -e itsodev3 /Tivoli/lcf/dat/1/LCFNEW/Tmw2k/Unix/data/log_level 3 8000000
92 IBM Tivoli Monitoring V5.1.1 Implementation Certification Study Guide
Endpoint engine log and traceThe endpoint engine log and trace maintain details of the activities of the engine. This is the process that runs the resource models and sends events and indications to the gateway, as follows:
� Process name: java com.tivoli.dmunix.ep.agent.Main
� Log name: msg_dmxengine.log (when the log is full, it is renamed as dmxengine.old, deleting any existing file with that name; a new log file is created)
� Trace name: trace_dmxengine.log (when the log is full, it is renamed as dmxengine.old, deleting any existing file with that name; a new log file is created)
� Location: $LCF_DATDIR/LCFNEW/AMW/logs
� Configuration: To configure the trace, issue the wdmtrceng command from the server or managed node, identifying the endpoint at which you want to configure the log. You can set any of the following parameters:
– Trace trace_dmxeu.log– Trace level: Default is 0 or you can set to the following modes:
0 Errors1 Warnings and errors: Trace level MID2 All steps of the monitoring: Trace level MAX3 Verbose output, all operations of the monitoring process: Trace level
MAX and OTHER
Endpoint native traceThe endpoint native trace maintains details about the activities of the native processes. This process obtains the resource information required by the resource models, as follows:
� Process name: java com.tivoli.dmunix.ep.agent.Main
� Log name: trace_dmxntv.log (when the log is full, it is renamed as dmxntv.old, deleting any existing file with that name; a new log file is created)
� Location: $LCFDATDIR/LCFNEW/AMW/logs
� Configuration: To configure the trace, issue the wdmtrceng command from the server or managed node, identifying the endpoint at which you want to configure the log. You can set any of the following parameters:
– Trace trace_dmxeu.log– Trace level: The default is 0 or you can set this to the following modes:
2 All steps of the monitoring: Trace level MAX3 Verbose output, all operations of the monitoring process: Trace level
MAX and OTHER
Chapter 6. Problem determination for IBM Tivoli Monitoring V5.1.1 93
Endpoint JMX logThe endpoint JMX log maintains details of the activities of the JMX process, which is a Tivoli implementation of Java Management Extension. It is only written when the trace level is set to 3. Here are the details:
� Process name: Tmx4j
� Log name: Tmx4j_1.log (when the log is full, it is renamed as Tmnx4j_2.log, deleting any existing file with that name; a new log file is created)
� Location: $LCF_DATDIR/LCFNEW/Tmw2k/UNIX
� Configuration: To configure the log, issue the wdmtrceng command from the server or managed node, identifying the endpoint at which you want to configure the log. Note that this command maintains a common configuration for all logs at a non-Windows endpoint. You can set the Trace level: 2 (verbose) parameter.
6.4 Web Health Console logs and tracesThe Web Health Console has a facility for both standard message logging and advanced debug tracing. Message logging and minimum level debug tracing are always on and writing to their own files. You can find these files in the /usr/Tivoli/AMW/logs directory.
6.4.1 Modifying Web Health Console tracing parametersYou can adjust tracing by modifying the tracing parameters for the Web Health Console application. Edit the WHC_INSTALL_DIR\installedApps\dm.ear\dm.war\ WEB-INF\classes\com\ibm \dm\web\util\PDLog.properties file. Depending on how much tracing you want, MIN, MID or MAX, you can change the line:
tmeLogger.trc.level=DEBUG_MINtmeLogger.trc.level=DEBUG_MIDtmeLogger.trc.level=DEBUG_MAX
MID provides a good amount of Web Health Console operation, and MAX provides a great deal of detailed internal operation.
Note: For the log’s endpoint native trace and endpoint JMX, we noticed that only some information is registered in the log after setting log_level to a minimum value of 2.
94 IBM Tivoli Monitoring V5.1.1 Implementation Certification Study Guide
You can also adjust the following lines to change the number of trace files written and the maximum size of the files before it roles over to a new file:
file.maxFiles=3file.maxFileSize=1024
After you make these changes, stop and start the WebSphere Application Server to enable the changes, using the following commands:
� UNIX
export DISPLAY=machineName:0.0WHC_INSTALL_DIR/bin/stopServer.shWHC_INSTALL_DIR/bin/startServer.sh
� Windows
WHC_INSTALL_DIR/bin/stopServer.batWHC_INSTALL_DIR/bin/startServer.bat
6.4.2 WebSphere tracingYou can also set WebSphere Application Server tracing. This enables you to see all the requests and operations in the ApplicationServer perspective. To enable WebSphere tracing, enter the following commands:
$WHC_INSTALL_DIR/bin/DrAdmin.sh -serverPort 7000 -setRingBufferSize 2048$WHC_INSTALL_DIR/bin/DrAdmin.sh -serverPort 7000 -setTrace "com.ibm.*=all=enabled"
After you run these commands, the trace log is located in $WHC_HOME/logs/default_server_stdout.log and $WHC_HOME/logs/default_server_stderr.log.
To disable WebSphere tracing, enter the following command:
$WHC_INSTALL_DIR/bin/DrAdmin.sh -serverPort 7000 -setTrace "com.ibm.*=all=disabled"
For further reference about troubleshooting WebSphere, see IBM WebSphere Version 4.0 Advanced Edition Handbook, SG24-6176.
Note: The Web Health Console runs slower while in MID or MAX tracing. Change the tracing level to the MIN setting as soon as possible.
Chapter 6. Problem determination for IBM Tivoli Monitoring V5.1.1 95
6.5 ToolsThis section describes the tools that are provided with IBM Tivoli Monitoring V5.1.1, as well as other available tools.
6.5.1 Tool to generate XML fileThe formatter program creates an XML-based file from the log or trace generated by IBM Tivoli Monitoring V5.1.1. It is located on the IBM Tivoli Monitoring V5.1.1 Tools CD in the directory LogToXML. It accepts three parameters:
� The first parameter defines whether IBM Tivoli Monitoring V5.1.1 is dealing with a log file or a message file.
� The second parameter is the name of the source file (either a log or a message file).
� The third parameter is the name of the file to be created in XML.
Here is an example:
prepareLog LOG trace_x.log trace_x.xml
6.5.2 Serviceability tasksIBM Tivoli Monitoring V5.1.1 provides three serviceability tasks:
� DMCollectEpLog� DMCollectMnLog� DMCollectEpEnv
DMCollectEpLogThe DMCollectEpLog task collects (in a tar file created at the endpoint) all the endpoint logs and information about the size and dates of the binaries. It also collects the current and universal time the logs were created. The task accepts the name of the tar file as an argument. You can find the tar file in the endpoint directory $LCF_DATDIR.
For UNIX and Linux platforms, the following files are collected:
� $LCF_DATDIR/lcfd.log� $LCF_DATDIR/lcfd.bk� $LCF_DATDIR/last.cfg� $LCF_DATDIR/LCFNEW/Tmw2k/Unix/Tmx4j1.log
Note: Before you run the prepare log program, set the Java Virtual Machine 1.3.0 path.
96 IBM Tivoli Monitoring V5.1.1 Implementation Certification Study Guide
� $LCF_DATDIR/LCFNEW/Tmw2k/Unix/Tmx4j2.log� $LCF_DATDIR/LCFNEW/AMW/logs/trace_xxxxx.log� $LCF_DATDIR/LCFNEW/AMW/logs/msg_xxxxx.log� $LCF_DATDIR/LCFNEW/Tmw2k/Unix/data/dmxout.log (This file traces errors
at Java engine startup.)
For Windows platforms, the following files are collected:
� %LCF_DATDIR%/lcfd.log� %LCF_DATDIR%/lcfd.bk� %LCF_DATDIR%/last.cfg� %LCF_DATDIR%/LCFNEW/Tmw2k/Unix/Tmw2k.log
Any core dumps from the engine are not included in the tar file to avoid impacting the task performance. You can find core dumps in the $LCF_DATDIR \LCFNEW\Tmw2k\Unix directory.
DMCollectMnLogThe DMCollectMnLog task collects (in a tar file created at the managed node in the $DBDIR directory) all the managed node logs and traces, including event logs for Windows platforms. The task accepts the name of the tar file as an argument. You can find the tar file in the managed node directory $DBDIR.
For UNIX and Linux platforms, the following files are collected:
� $DBDIR/oservlog� $DBDIR/gatelog� /tmp/traces/trace_tnmt_gtw_engn.log� $DBDIR/AMW/logs/trace_xxxx.log� $DBDIR/<odstat output>� $DBDIR/<wtrace -jHk $DBDIR output>
For Windows platforms, the following files are collected:
� %DBDIR%/oservlog� %DBDIR%/gatelog� %DBDIR%/tmp/traces/trace_tnmt_gtw_engn.log� %DBDIR%/AMW/logs/trace_xxxx.log� %DBDIR%/<odstat output>� %DBDIR%/<wtrace -jHk $DBDIR output>
Chapter 6. Problem determination for IBM Tivoli Monitoring V5.1.1 97
DMCollectEpEnvThe DMCollectEpEnv task collects information about the environment at the endpoint. The data collected is written to a file using the Execute Task window (Save to File option). This task does not accept arguments. For UNIX and Linux platforms, the following information is collected:
� Operating system version� Disk space statistics and file system installation at the endpoint� Memory statistics (available and used)� Environment variable settings� List of system patches installed
For Windows platforms, the output from the winmsd command is collected.
� For Windows 2000, the report is created in %LCF_DATDIR%/winmsdreport.txt.
� For Windows NT, the report is created in %LCF_DATDIR%/host name.txt.
6.6 Helpful troubleshooting proceduresThis section discusses common problem determination procedures for IBM Tivoli Monitoring V5.1.1.
6.6.1 Profile distribution problemsProfile distribution is performed using the MDist 2 facility. There are several symptoms of profile distribution problems, such as:
� Monitors are not shown for the endpoint in the Web Health Console.� There are no TEC event or TBSM changes.� Data is not collected in the historical database.
Some initial verification that you must perform is:
� Run the following command to verify that the profile is not received:
wdmlseng -e endpoint
� Check the MDist2 distribution status using the following command and check for distribution called profilename(install):wmdist -l
� Verify that the endpoint is running using following command:
wep endpoint status
� Verify that the gateway is running using the following command:
wgateway
98 IBM Tivoli Monitoring V5.1.1 Implementation Certification Study Guide
If the result from those commands cannot yield a sufficient clue, you may need to consult the distribution logs:
� In the TMR server: rpt2log, msg_profilename.log� In the gateways: rpt2log� In the endpoints: lcfd.log
6.6.2 IBM Tivoli Monitoring engine troubleshootingWhen the IBM Tivoli Monitoring engine has problem, some symptoms may be:
� There are no TEC event or TBSM changes. � Data is not collected in the historical database.� Monitor is shown for the endpoint in the Web Health Console.
Some initial verification that you need to performed is:
� Run the following command to verify that the IBM Tivoli Monitoring engine is running:
wdmlseng -e endpoint
� Run the following commands to stop and start the IBM Tivoli Monitoring engine:
wdmcmd -stop -e endpoint wdmcmd -restart -e endpoint
� Clear the endpoint engine profile cache, by removing the *.dmprf and engine.pid files.
� Remove the method cache in the LCFNEW directory.
Perform further troubleshooting on the endpoint by analyzing the lcfd.log and Tmw2k.log files. Ultimately you can also run the DMEndpointUninstall task to remove the IBM Tivoli Monitoring engine and clean the resource cache.
6.6.3 Resolving resource model problemsResource model problems are caused by the following symptoms:
� There are no TEC event or TBSM changes. � Data is not collected in the historical database.� Monitor is shown for the endpoint in the Web Health Console with a
non-running status.
Chapter 6. Problem determination for IBM Tivoli Monitoring V5.1.1 99
Some initial verification that you need to perform is:
� Check the resource model status using the following command:
wdmlseng -e endpoint -verbose
� Restart the resource model on the endpoint using the following command:
wdmeng
� Check options in the profile itself, such as TEC event or TBSM event generation.
� Verify the prerequisites, such as:
– Java Runtime Environment (JRE) linking from DMLink JRE– Simple Network Management Protocol (SNMP) service for Windows– Running the diskperf command for Windows
� Examine the endpoint profile logs (see 6.3, “Endpoint logs” on page 88).
100 IBM Tivoli Monitoring V5.1.1 Implementation Certification Study Guide
Chapter 7. Operating IBM Tivoli Monitoring V5.1.1
This chapter discusses various operational and management issues with IBM Tivoli Monitoring V5.1.1.
7
© Copyright IBM Corp. 2004. All rights reserved. 101
7.1 MDist profile distributionThis section explains the IBM Tivoli Monitoring V5.1.1 profile distribution using MDist2.
7.1.1 MDist2 supportIBM Tivoli Monitoring V5.1.1 uses Tivoli Management Framework Multiplexed Distribution service (MDist2) to perform profile distribution. It fully uses the following MDist2 functions:
� Asynchronous delivery
MDist2 uses an asynchronous interface to applications. This means that, when IBM Tivoli Monitoring V5.1.1 submits a distribution request, it immediately receives a distribution identifier and confirmation that the distribution is in progress.
� Assured delivery
The distribution of IBM Tivoli Monitoring V5.1.1 profiles is assured even when there are network interruptions, power-off machines, or disconnected endpoints.
� Check-point and restart
A distribution data stream that has been interrupted can be resumed by IBM Tivoli Monitoring V5.1.1 from the last successful checkpoint. This means that it is not necessary to resend all of the profile data when the distribution is resumed by MDist2. The IBM Tivoli Monitoring V5.1.1 receiver method requests only the data that was not sent when the interruption occurred.
� Data depoting
MDist2 allows the storage of distribution segments at a depot close to the endpoint, and for the distribution to be submitted to the endpoints from that depot.
7.1.2 Profile distribution using MDist2IBM Tivoli Monitoring V5.1.1 only supports profile distribution to ProfileManager, TMA endpoint, Application Proxy, and Application Services.
You can configure the following options in a profile distribution. In the Profile Manager window, open a profile to be distributed. Click Profile →Distribute. The IBM Tivoli Monitoring V5.1.1 Profile window (Figure 7-1) opens.
102 IBM Tivoli Monitoring V5.1.1 Implementation Certification Study Guide
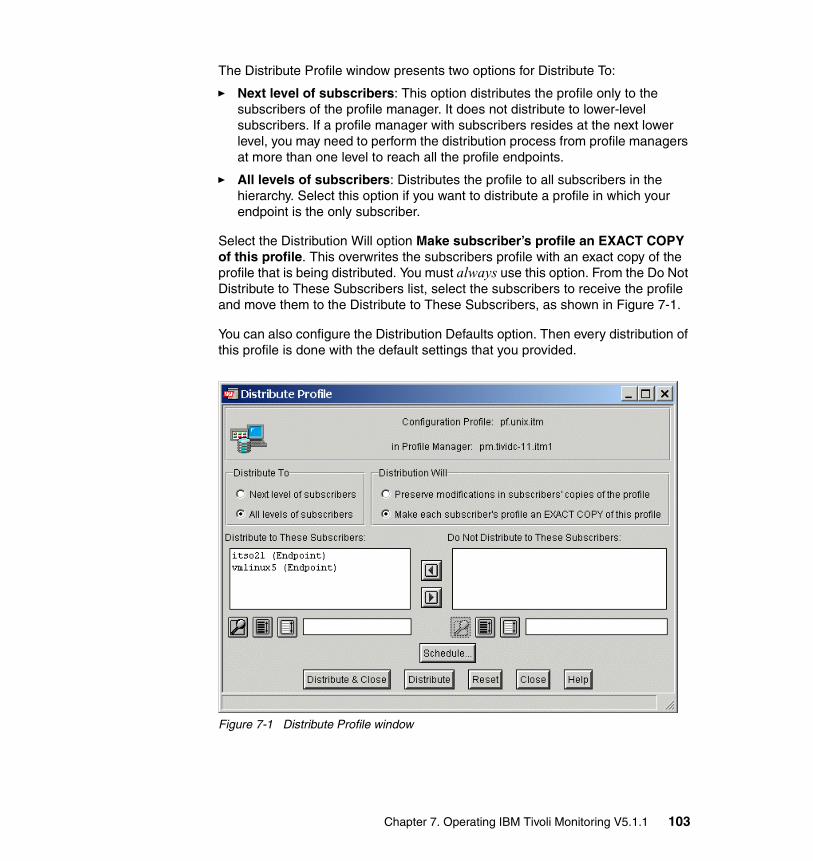
The Distribute Profile window presents two options for Distribute To:
� Next level of subscribers: This option distributes the profile only to the subscribers of the profile manager. It does not distribute to lower-level subscribers. If a profile manager with subscribers resides at the next lower level, you may need to perform the distribution process from profile managers at more than one level to reach all the profile endpoints.
� All levels of subscribers: Distributes the profile to all subscribers in the hierarchy. Select this option if you want to distribute a profile in which your endpoint is the only subscriber.
Select the Distribution Will option Make subscriber’s profile an EXACT COPY of this profile. This overwrites the subscribers profile with an exact copy of the profile that is being distributed. You must always use this option. From the Do Not Distribute to These Subscribers list, select the subscribers to receive the profile and move them to the Distribute to These Subscribers, as shown in Figure 7-1.
You can also configure the Distribution Defaults option. Then every distribution of this profile is done with the default settings that you provided.
Figure 7-1 Distribute Profile window
Chapter 7. Operating IBM Tivoli Monitoring V5.1.1 103
There are three possible ways to perform profile distribution in IBM Tivoli Monitoring V5.1.1:
� Graphical user interface (GUI) distribution
a. Drag and drop the profile in the target subscriber.
b. In the Profile Manager window, open the profile to be distributed. The IBM Tivoli Monitoring V5.1.1 Profile window opens. Click Profile →Distribute.
� Framework wdistrib CLI command
The following command example is for distributing a profile called pf.unix.itm to an endpoint called vmlinux5:
wdistrib -l over_all @Tmw2kProfile:pf.unix.itm @Endpoint:vmlinux5
� IBM Tivoli Monitoring V5.1.1 wdmdistrib CLI command
This new MDist2-based command offers a richer set of options to distribute an IBM Tivoli Monitoring V5.1.1 profile to subscribers. You can have the profile storage in the MDist2 depot permanent or temporary.
You can use the following flags with the wdmdistrib CLI command:
wdmdistrib -p <profile-name> [-D <MDist2_property=value>...] [-e][-w][-i] [-J <JRE_location_dir>][-d][-R][-l] [-s <subscribers-file>] [subscriber...]
For further reference about wdmdistrib usage, see IBM Tivoli Monitoring User’s Guide Version 5.1, SH19-4569.
7.1.3 TMF MDist2 commandsThe Tivoli Management Framework (TMF) wmdist and wdepot commands provide many options for you to check and manage distribution packages. You can also perform MDist2 management using the GUI provided with MDist2.
The following commands can be useful to monitor IBM Tivoli Monitoring V5.1.1 profile distribution status:
� List distributions
wmdist –l [-I dist_id] [-a] [-v]
-I Specific distribution ID-a Shows only active distributions-v Verbose output
Note: In a distribution on a Tmw2kProfile that is always labelled with the status of install, for example, the distribution of profile Monitor.pf is called Monitor.pf(install).
104 IBM Tivoli Monitoring V5.1.1 Implementation Certification Study Guide
� Endpoint distribution status
wmdist –e dist_id [-t endpoint_id]
-t Status for specific endpoint
� Cancel distributions
wmdist –c dist_id [endpoint…]
� Pause distributions
wmdist –p dist_id [endpoint…]
� Resume distributions
wmdist –r dist_id [endpoint…]
� List repeater depot
wdepot repeater_name list -l
� View repeater depot statistics
wdepot repeater_name describe
For more information about MDist2 commands, refer to Tivoli Framework Version 3.7.1 Installation Guide, GC32-0395.
7.2 Maintaining the Tivoli environmentThis section describes the new command line, directory structure, and log files to be monitored. The maintenance of the Framework environment is not described in this chapter. However, you can find a good reference in Maintaining Your Tivoli Environment, SG24-5013.
7.2.1 IBM Tivoli Monitoring V5.1.1 command lineThis section explains, with examples, some of the commands provided with IBM Tivoli Monitoring V5.1.1.
� wdmconfig: This command creates and updates the configuration file ($DBDIR/dmml/.config) on a gateway. Here is an example of using the wdmconfig command to configure the trace of components size to 800000 bytes and the trace details to verbose:
wdmconfig -m all -D dmml.trace_size=8000000 -D dmml.trace_level=4Role needed: super or senior.
� wdmmn: This command stops or starts selected IBM Tivoli Monitoring V5.1.1 processes on one or all managed nodes or gateways. The role needed is super, senior or administrator.
Chapter 7. Operating IBM Tivoli Monitoring V5.1.1 105
The processes that can be started and stopped are:
– Task engine (tmnt_task_eng), flag -t– Tivoli Business Systems Manager (TBSM) Adapter, flag -b– Heartbeat engine (tmnt_gtw), flag -h– Resource model engine (tmnt_rm_eng), flag -r
� wdmcmd: This command stops or restarts IBM Tivoli Monitoring V5.1.1 on one or more endpoints from a managed node, gateway, or server. You can specify endpoints or a profile manager. If you specify a profile manager, it affects all endpoints that are subscribers of the profile manager. The role needed is super, senior, or administrator.
� wdmeng: This command stops or starts profiles or resource models at endpoints. It also deletes profiles at endpoints. The role needed is super, senior, or administrator.
� wdmlseng: This command lists the running resource models and their statuses of specified endpoints. It can also output the result in XML. The command can be used for a specified endpoint or a specified indicator within the endpoint. The role needed is super, senior, administrative, or user.
� wdmrm: This adds, lists, or removes a specified resource model at the Tivoli Management Region (TMR) server or managed node or gateway from where it is issued. It also adds the national language support (NLS) catalog to an already installed default resource model. The resource models are also registered in the Name Registry and can be queried using the following command:
wlookup -ar Tmw2kProfile
The role needed is super, senior, or administrator.
� wdmcollect: This command manages the data collection for monitoring metrics from the gateway for specific endpoints. The role needed is super, senior, administrator, or user.
7.2.2 Heartbeat maintenanceIf you are using the heartbeat functionality, be aware that, when you delete an endpoint from the Tivoli environment, and this endpoint is monitored by the heartbeat, it is not removed automatically from the heartbeat database.
To remove an endpoint from the heartbeat database, run the command:
wdmmngcache -m gateway -d endpoint_label
To manage heartbeat process on the gateways, you use the wdmheartbeat command.
106 IBM Tivoli Monitoring V5.1.1 Implementation Certification Study Guide
7.2.3 Managing profiles This section discusses usage of the profile manipulation commands, of which some are in IBM Tivoli Monitoring V5.1.1. These commands are useful to manage the monitoring profiles from a batch file or shell script.
� wdmeditprf: This command enables you to change various attributes of a profile. Resource models can be added using all of the default values supplied. Alternatively you can add a model with one or more values modified to suit your environment. You can also edit any of the details of an existing resource model. And you can change and define event generations and action tasks.
� wdmdumpprf: This command writes the full details of the selected profile to the standard output, in Tivoli Management Framework format or XML format. You can save the output and edit and reload it as a new or amended profile using the wdmloadprf command.
� wdmloadprf: This command makes new profiles available on the Tivoli server. If the command identifies an existing profile, the command updates the profile. It requires you to choose whether to merge the new resource models with the existing ones, substitute the existing resource models for the new ones, or keep the existing resource models.
7.2.4 Managing resource modelsThe wdmrm command enables you to manage resource models from a command line. You can add, list, or remove a specified default resource model at the TMR server or managed node or gateway from where you issue it. It also adds the NLS catalog to an already installed default resource model. The command works only for the server and managed nodes of the local region.
The command syntax is:
wdmrm –add resource_model_tarfile wdmrm –addcat resource_model [–f catalog_file –l locale] wdmrm –list wdmrm –remove resource_model
Chapter 7. Operating IBM Tivoli Monitoring V5.1.1 107
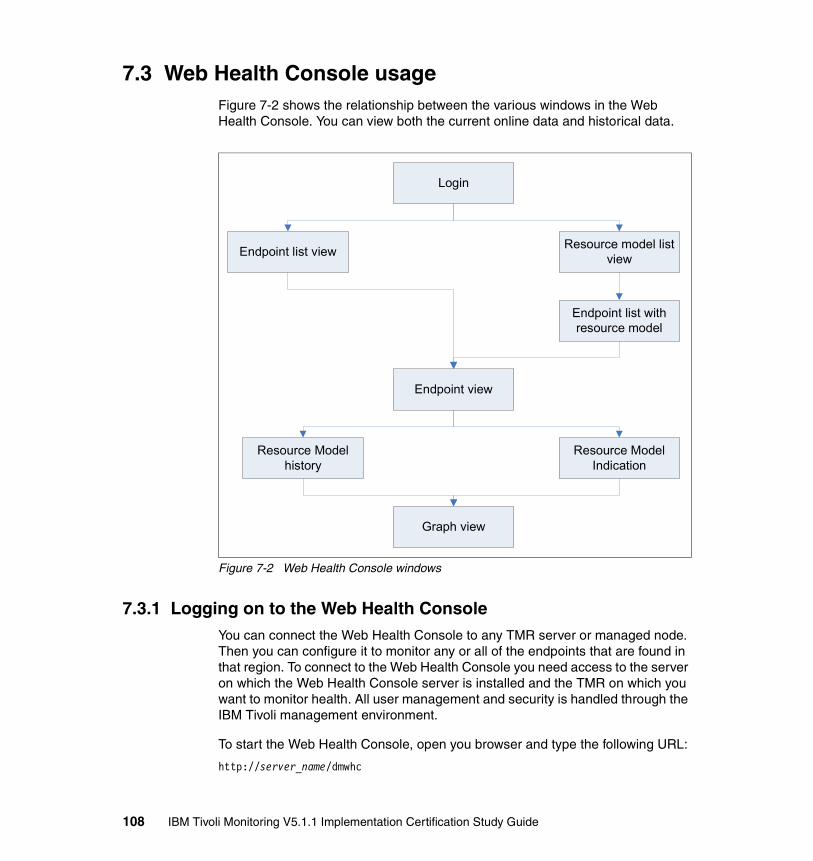
7.3 Web Health Console usageFigure 7-2 shows the relationship between the various windows in the Web Health Console. You can view both the current online data and historical data.
Figure 7-2 Web Health Console windows
7.3.1 Logging on to the Web Health ConsoleYou can connect the Web Health Console to any TMR server or managed node. Then you can configure it to monitor any or all of the endpoints that are found in that region. To connect to the Web Health Console you need access to the server on which the Web Health Console server is installed and the TMR on which you want to monitor health. All user management and security is handled through the IBM Tivoli management environment.
To start the Web Health Console, open you browser and type the following URL:
http://server_name/dmwhc
Login
Endpoint list view Resource model list view
Endpoint list with resource model
Endpoint view
Resource Model history
Resource Model Indication
Graph view
108 IBM Tivoli Monitoring V5.1.1 Implementation Certification Study Guide
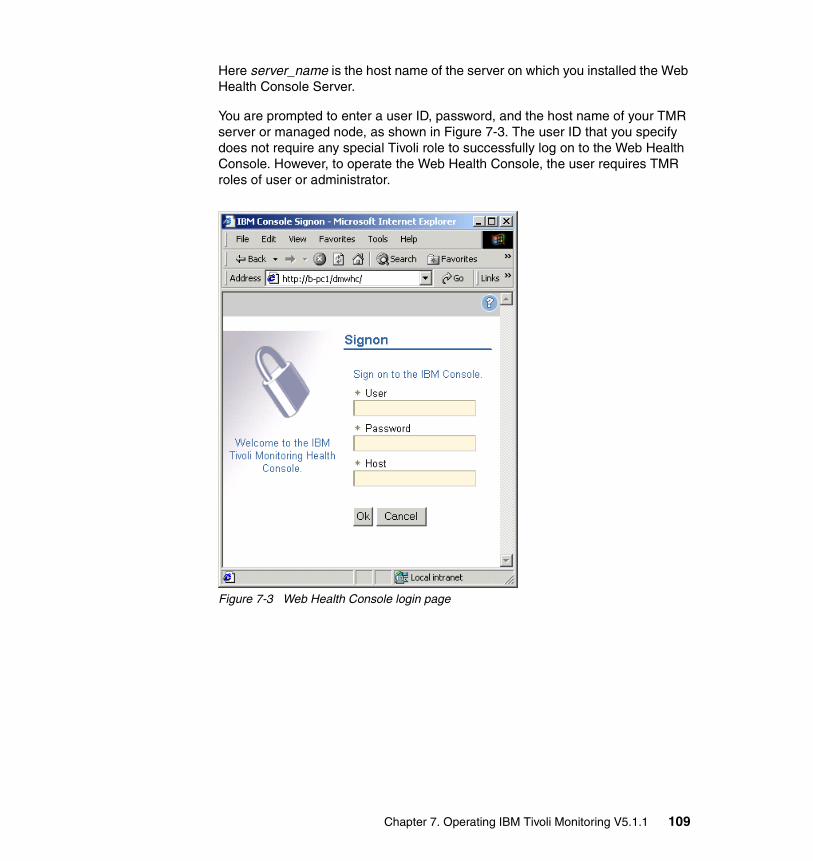
Here server_name is the host name of the server on which you installed the Web Health Console Server.
You are prompted to enter a user ID, password, and the host name of your TMR server or managed node, as shown in Figure 7-3. The user ID that you specify does not require any special Tivoli role to successfully log on to the Web Health Console. However, to operate the Web Health Console, the user requires TMR roles of user or administrator.
Figure 7-3 Web Health Console login page
Chapter 7. Operating IBM Tivoli Monitoring V5.1.1 109
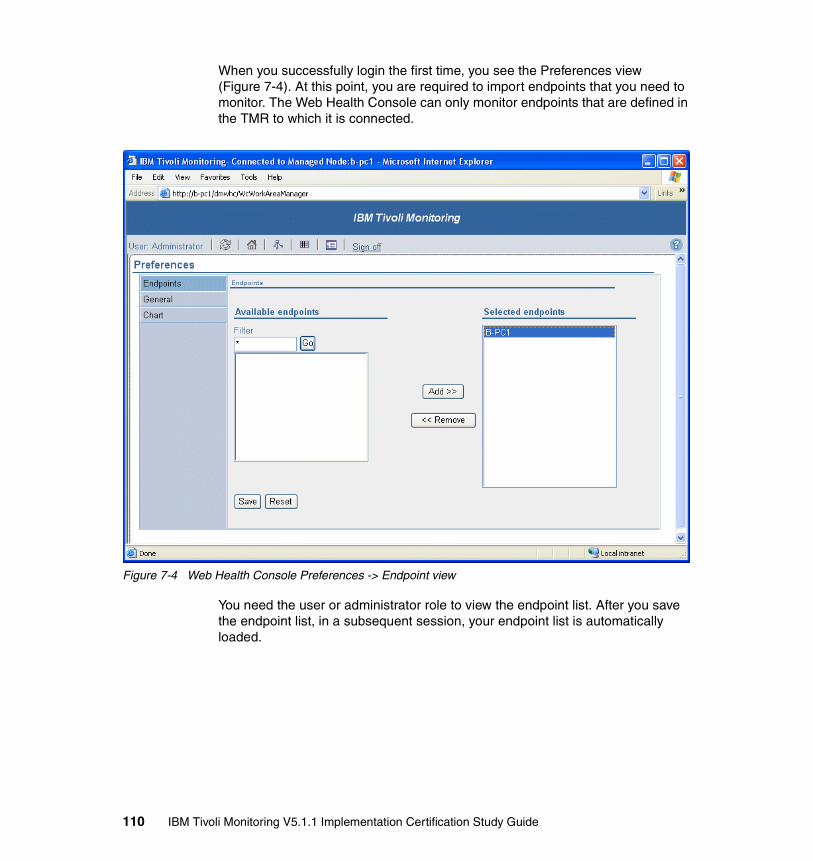
When you successfully login the first time, you see the Preferences view (Figure 7-4). At this point, you are required to import endpoints that you need to monitor. The Web Health Console can only monitor endpoints that are defined in the TMR to which it is connected.
Figure 7-4 Web Health Console Preferences -> Endpoint view
You need the user or administrator role to view the endpoint list. After you save the endpoint list, in a subsequent session, your endpoint list is automatically loaded.
110 IBM Tivoli Monitoring V5.1.1 Implementation Certification Study Guide
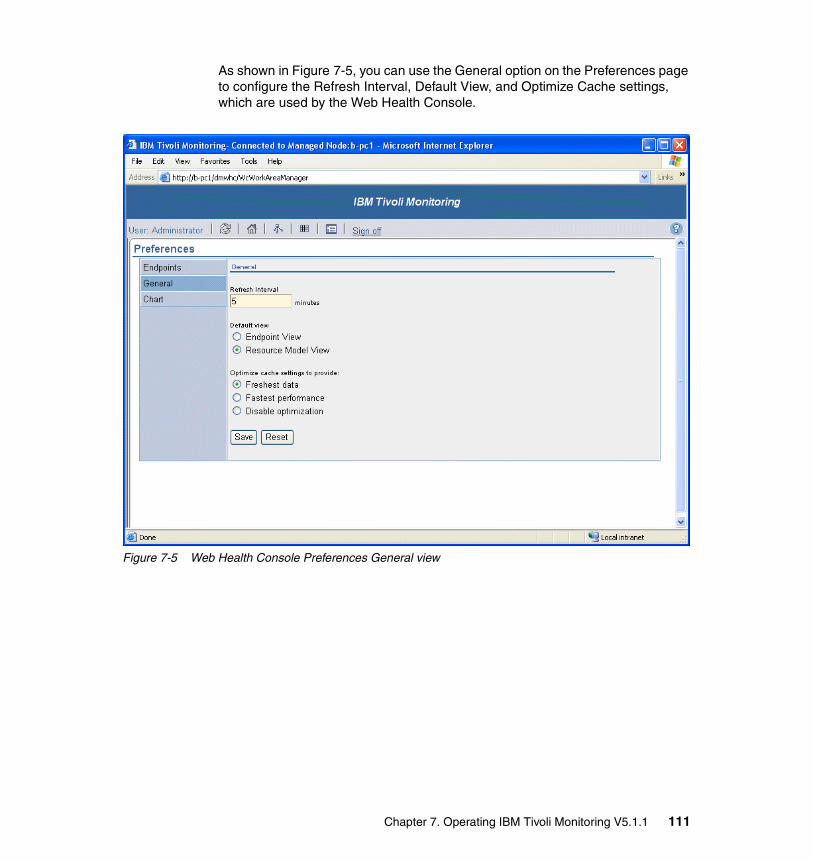
As shown in Figure 7-5, you can use the General option on the Preferences page to configure the Refresh Interval, Default View, and Optimize Cache settings, which are used by the Web Health Console.
Figure 7-5 Web Health Console Preferences General view
Chapter 7. Operating IBM Tivoli Monitoring V5.1.1 111
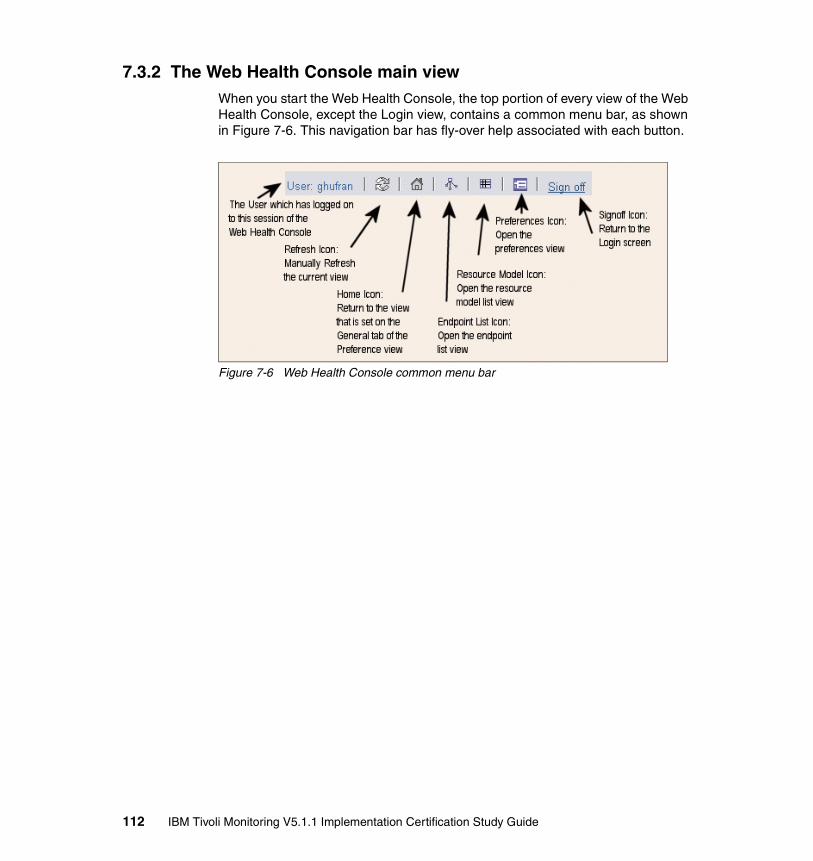
7.3.2 The Web Health Console main viewWhen you start the Web Health Console, the top portion of every view of the Web Health Console, except the Login view, contains a common menu bar, as shown in Figure 7-6. This navigation bar has fly-over help associated with each button.
Figure 7-6 Web Health Console common menu bar
112 IBM Tivoli Monitoring V5.1.1 Implementation Certification Study Guide
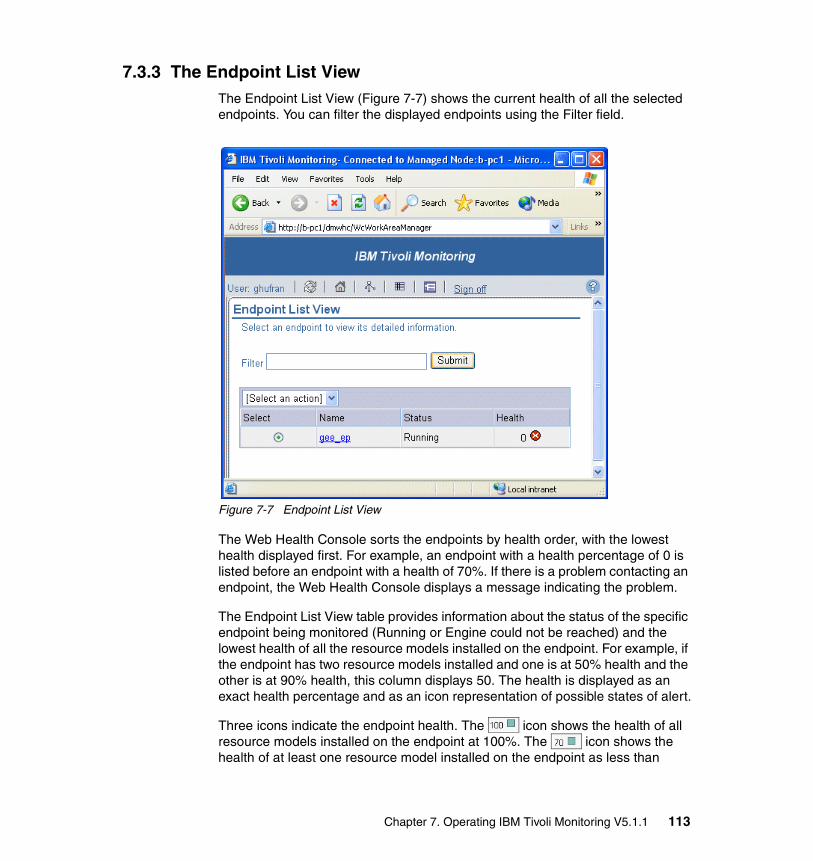
7.3.3 The Endpoint List ViewThe Endpoint List View (Figure 7-7) shows the current health of all the selected endpoints. You can filter the displayed endpoints using the Filter field.
Figure 7-7 Endpoint List View
The Web Health Console sorts the endpoints by health order, with the lowest health displayed first. For example, an endpoint with a health percentage of 0 is listed before an endpoint with a health of 70%. If there is a problem contacting an endpoint, the Web Health Console displays a message indicating the problem.
The Endpoint List View table provides information about the status of the specific endpoint being monitored (Running or Engine could not be reached) and the lowest health of all the resource models installed on the endpoint. For example, if the endpoint has two resource models installed and one is at 50% health and the other is at 90% health, this column displays 50. The health is displayed as an exact health percentage and as an icon representation of possible states of alert.
Three icons indicate the endpoint health. The icon shows the health of all resource models installed on the endpoint at 100%. The icon shows the health of at least one resource model installed on the endpoint as less than
Chapter 7. Operating IBM Tivoli Monitoring V5.1.1 113
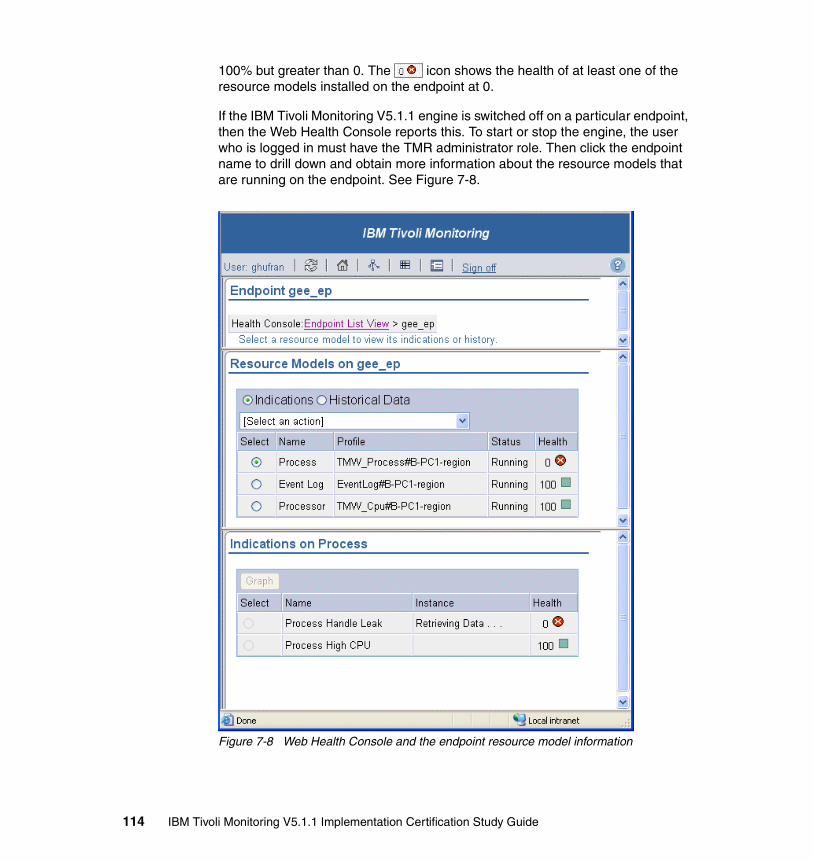
100% but greater than 0. The icon shows the health of at least one of the resource models installed on the endpoint at 0.
If the IBM Tivoli Monitoring V5.1.1 engine is switched off on a particular endpoint, then the Web Health Console reports this. To start or stop the engine, the user who is logged in must have the TMR administrator role. Then click the endpoint name to drill down and obtain more information about the resource models that are running on the endpoint. See Figure 7-8.
Figure 7-8 Web Health Console and the endpoint resource model information
114 IBM Tivoli Monitoring V5.1.1 Implementation Certification Study Guide
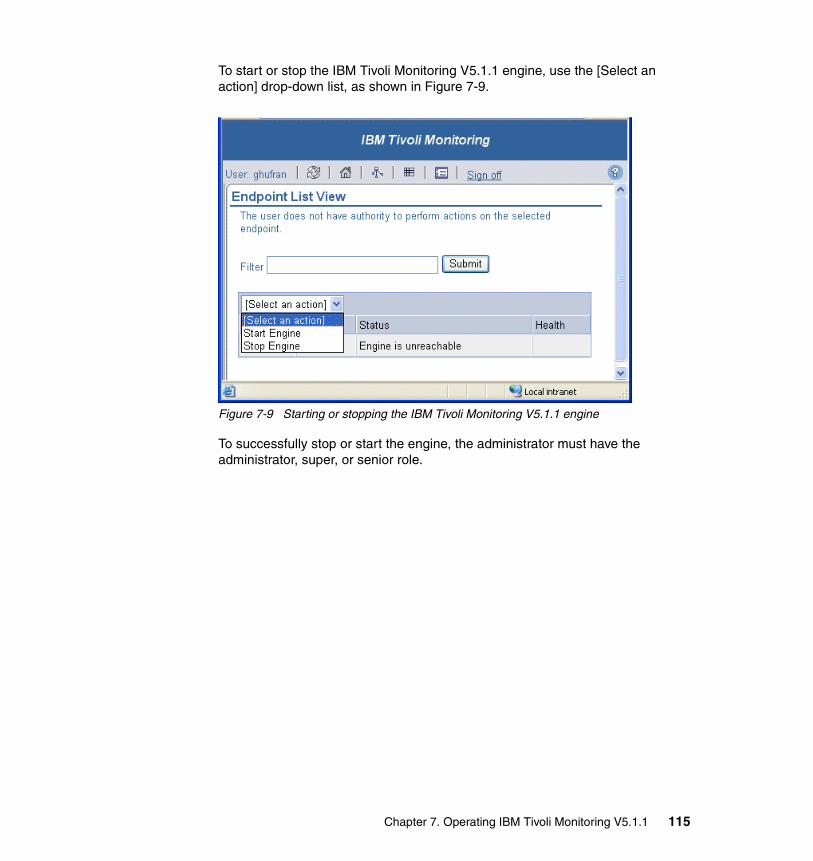
To start or stop the IBM Tivoli Monitoring V5.1.1 engine, use the [Select an action] drop-down list, as shown in Figure 7-9.
Figure 7-9 Starting or stopping the IBM Tivoli Monitoring V5.1.1 engine
To successfully stop or start the engine, the administrator must have the administrator, super, or senior role.
Chapter 7. Operating IBM Tivoli Monitoring V5.1.1 115
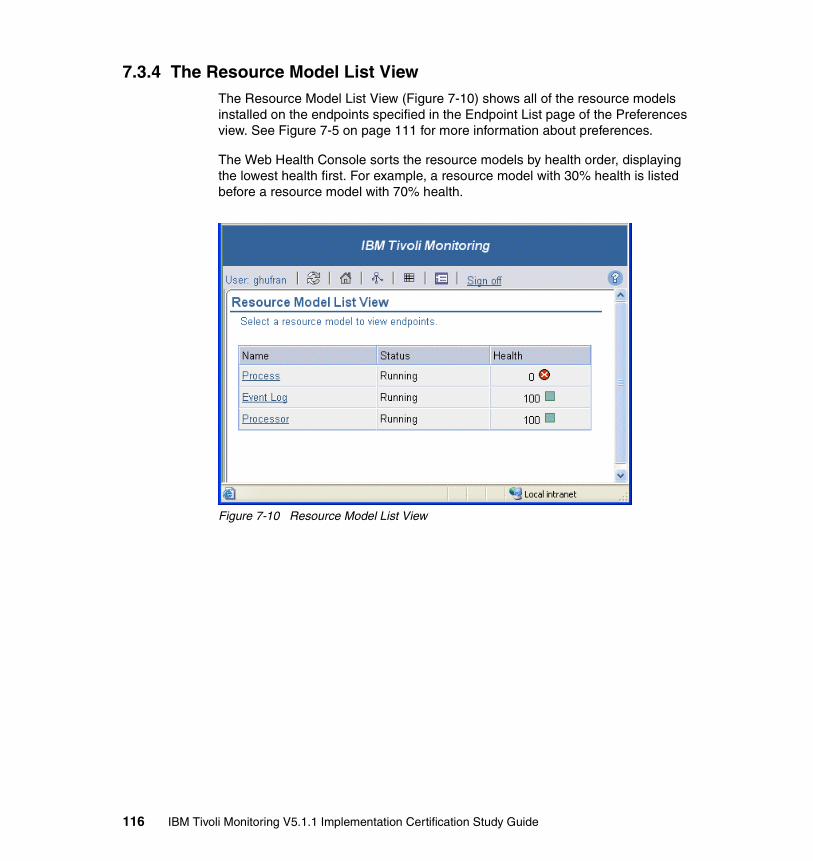
7.3.4 The Resource Model List ViewThe Resource Model List View (Figure 7-10) shows all of the resource models installed on the endpoints specified in the Endpoint List page of the Preferences view. See Figure 7-5 on page 111 for more information about preferences.
The Web Health Console sorts the resource models by health order, displaying the lowest health first. For example, a resource model with 30% health is listed before a resource model with 70% health.
Figure 7-10 Resource Model List View
116 IBM Tivoli Monitoring V5.1.1 Implementation Certification Study Guide
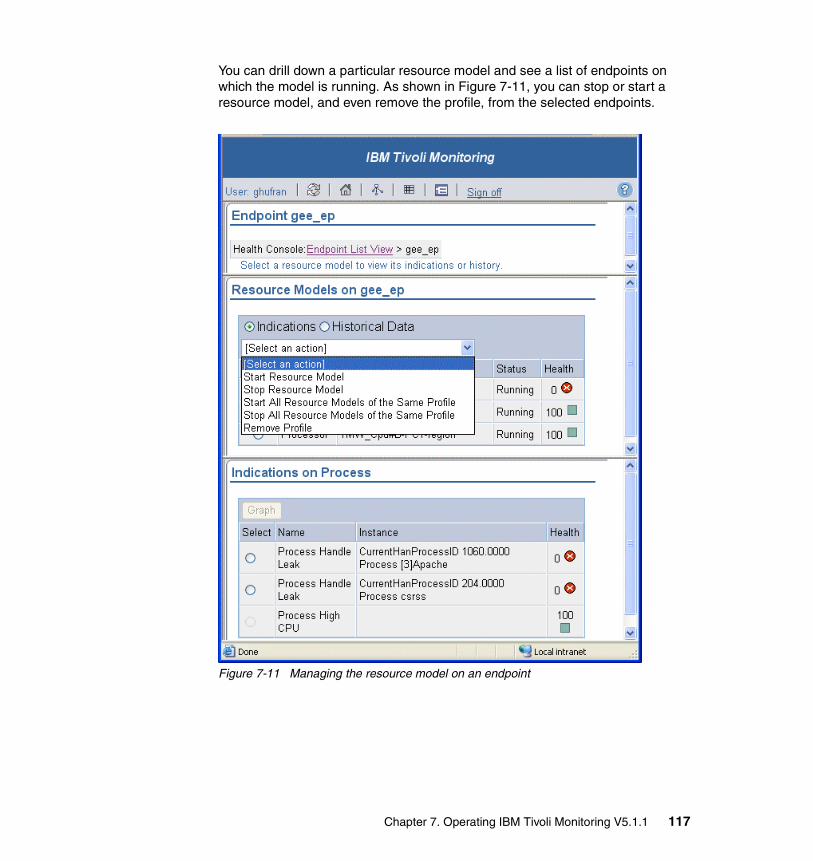
You can drill down a particular resource model and see a list of endpoints on which the model is running. As shown in Figure 7-11, you can stop or start a resource model, and even remove the profile, from the selected endpoints.
Figure 7-11 Managing the resource model on an endpoint
Chapter 7. Operating IBM Tivoli Monitoring V5.1.1 117
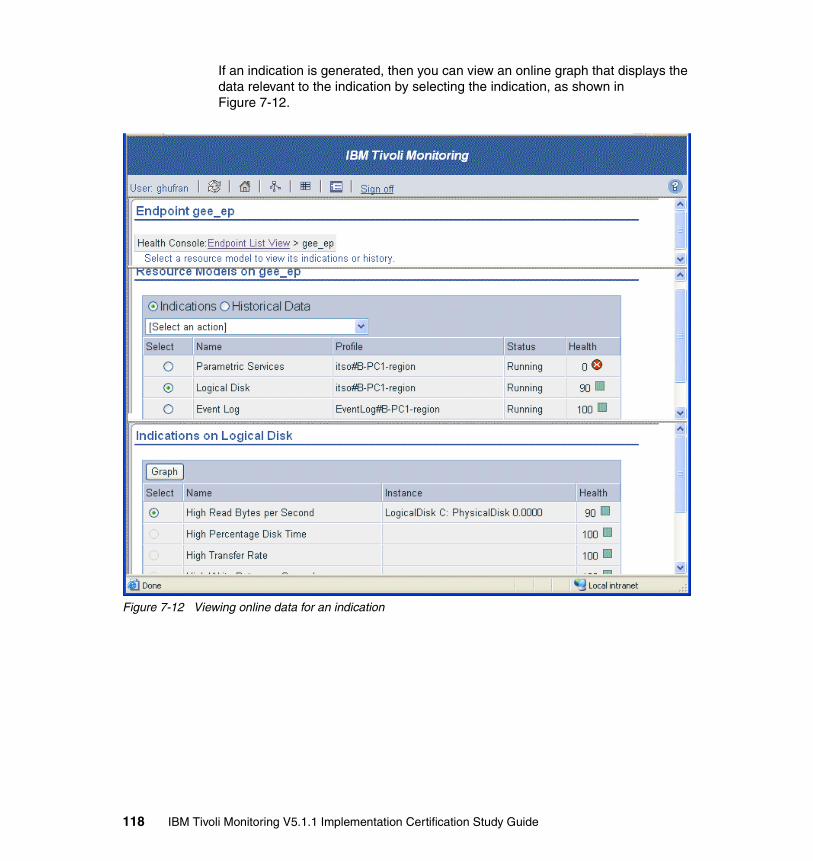
If an indication is generated, then you can view an online graph that displays the data relevant to the indication by selecting the indication, as shown in Figure 7-12.
Figure 7-12 Viewing online data for an indication
118 IBM Tivoli Monitoring V5.1.1 Implementation Certification Study Guide
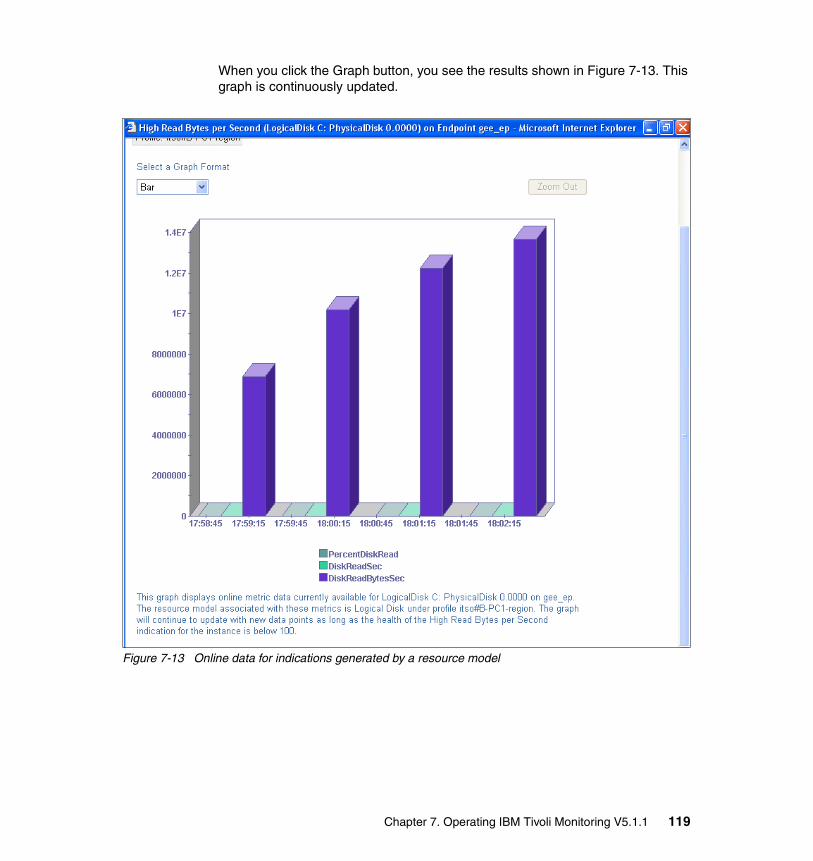
When you click the Graph button, you see the results shown in Figure 7-13. This graph is continuously updated.
Figure 7-13 Online data for indications generated by a resource model
Chapter 7. Operating IBM Tivoli Monitoring V5.1.1 119
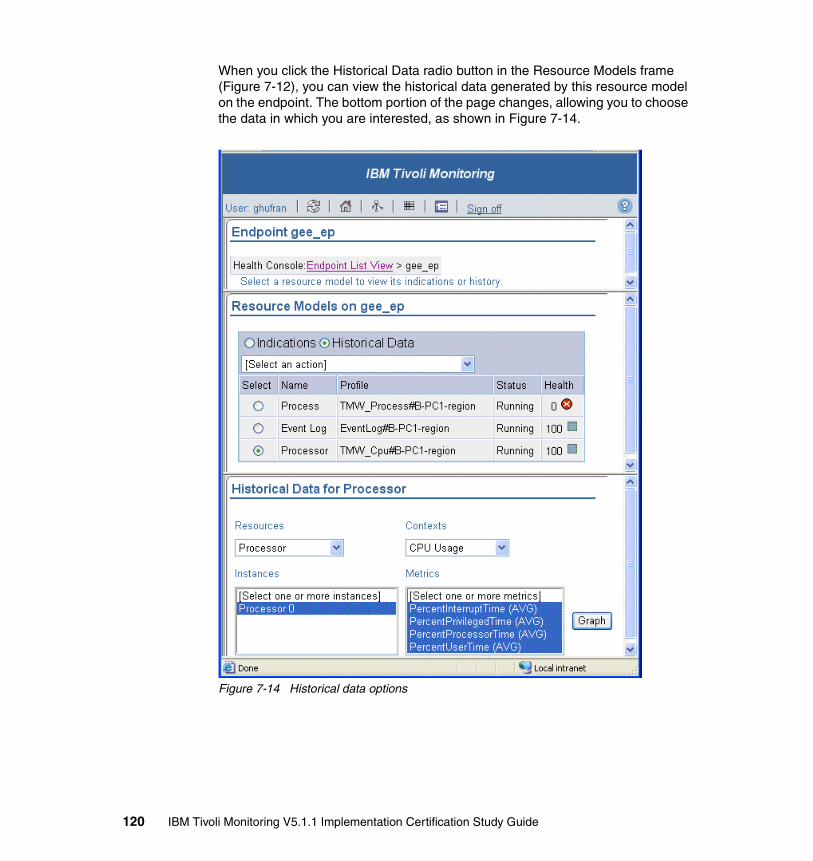
When you click the Historical Data radio button in the Resource Models frame (Figure 7-12), you can view the historical data generated by this resource model on the endpoint. The bottom portion of the page changes, allowing you to choose the data in which you are interested, as shown in Figure 7-14.
Figure 7-14 Historical data options
120 IBM Tivoli Monitoring V5.1.1 Implementation Certification Study Guide
Using the historical data selection controls, you select instances and metrics from the selected resource model to create a chart of recent historical data from the endpoint. To create historical data, logging must be enabled for the resource model. With logged data, you can use the historical data graph to identify specific instances of resource problems over the past 1, 6, 12, or 24 hours.
To create a historical data graph as shown in Figure 7-15, follow these steps:
1. Select a resource model from the Resource Model list in the upper frame and click the Historical Data radio button (see Figure 7-14).
2. The Historical Data information for your selection appears in the lower frame.
a. The Resource list is the only option that is active when the frame opens. From the Resources list, select a resource.
b. From the Contexts list, select a context. Each context identifies a logical grouping of problems related to the specified resource.
c. From the Instances list, select one or more instances. These identify specific instances of the selected indication.
d. From the Metrics list, select one or more metrics. These metrics are used to measure the selected indication.
e. Click Graph.
Chapter 7. Operating IBM Tivoli Monitoring V5.1.1 121
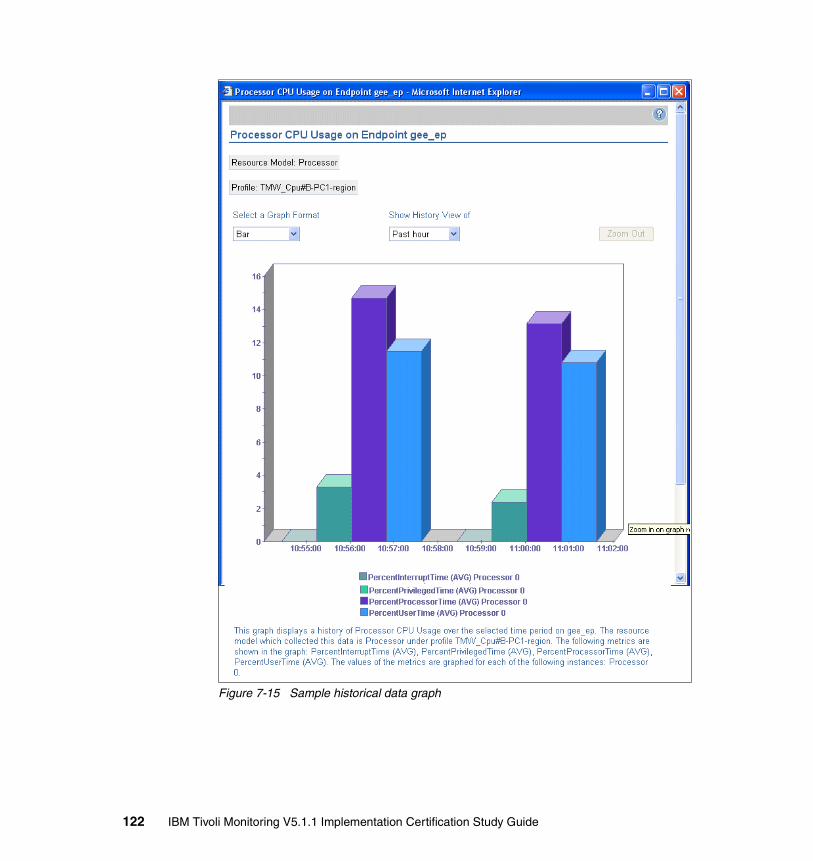
Figure 7-15 Sample historical data graph
122 IBM Tivoli Monitoring V5.1.1 Implementation Certification Study Guide
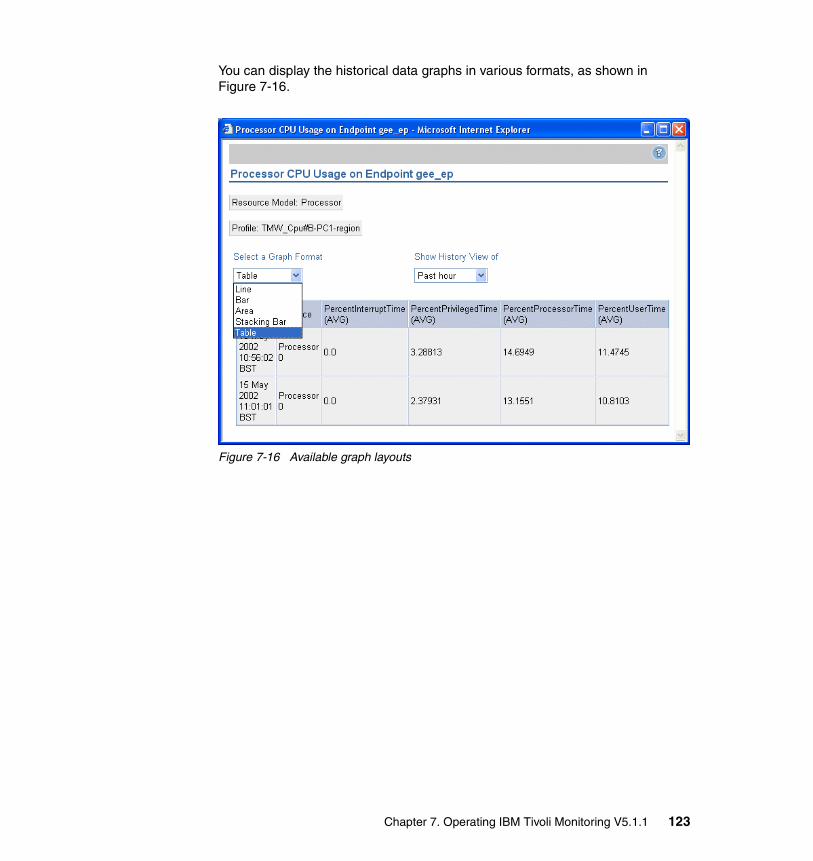
You can display the historical data graphs in various formats, as shown in Figure 7-16.
Figure 7-16 Available graph layouts
Chapter 7. Operating IBM Tivoli Monitoring V5.1.1 123

124 IBM Tivoli Monitoring V5.1.1 Implementation Certification Study Guide
Chapter 8. IBM Tivoli Monitoring Workbench
This chapter explains how to use IBM Tivoli Monitoring Workbench to create and customize resource model and migrating classic Distributed Monitoring monitors.
8
© Copyright IBM Corp. 2004. All rights reserved. 125
8.1 Using the WorkbenchWe begin by exploring one of the simpler resource models shipped with IBM Tivoli Monitoring, the PhysicalDiskModel. We use this model later in our examples to illustrate some of the advanced features of the Workbench. To begin, follow these steps:
1. Double-click the IBM Tivoli Monitoring Workbench icon (Figure 8-1).
2. Open the sample project file for the PhysicalDiskModel (shipped with the product). From the menu, select File →Open.
3. Go to the samples/Windows directory in the install location of IBM Tivoli Monitoring. The samples directory consists of four subdirectories with sample resource models source.
This sample use the Windows PhsicalDiskModel to demonstrate the basics of using the Workbench. The source for this model is in the TMW_PhysicalDiskModel.dmws project file. This project file is a non-editable file that contains all of the element definitions for the PhysicalDisk resource model. It is sometimes referred to as a project file. You can open this file and explore each of its elements. For a UNIX resource model, you can also browse this information by importing the associated Managed Object Format (MOF) file using the mofcomp command line interface (CLI) command.
The Workbench is made of three panes as shown in Figure 8-2:
� Pane 1
The first pane contains most of the resource model elements that make up a particular model. These elements are ordered in a tree-like hierarchy. The root node of the tree is the name of the resource model and describes the model’s general settings. In this case, it is TMW_PhysicalDiskModel.
In most cases, you can open any element in the tree by double-clicking the mouse. Some elements in the tree have multiple options associated with it. Right-clicking the mouse on any element in the tree lists the associated options for that element. For example, right-clicking the TMW_PhysicalDisk element, under Dynamic Model/CIM Classes, display three options: Modify, Remove, and Collection Test. We illustrate the use of many of these options later in the examples.
� Pane 2
This pane contains the Java or Visual Basic script code used in the resource model. The functions in this code are used to initialize, set the configuration options, and run the decision tree logic.
Figure 8-1 IBM Tivoli Monitoring Workbench icon
126 IBM Tivoli Monitoring V5.1.1 Implementation Certification Study Guide
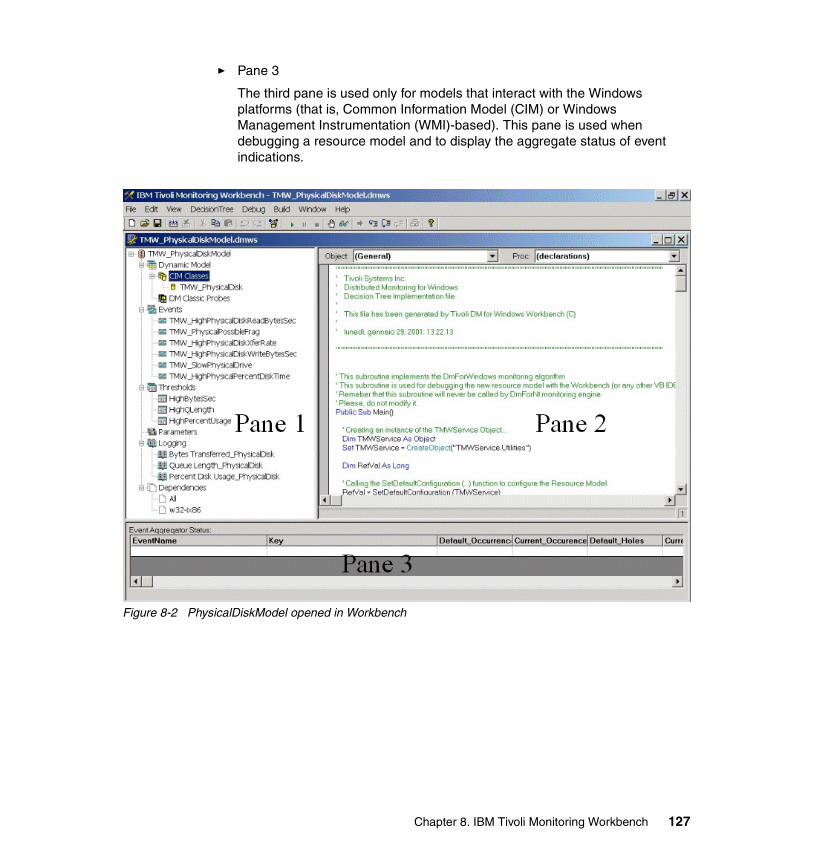
� Pane 3
The third pane is used only for models that interact with the Windows platforms (that is, Common Information Model (CIM) or Windows Management Instrumentation (WMI)-based). This pane is used when debugging a resource model and to display the aggregate status of event indications.
Figure 8-2 PhysicalDiskModel opened in Workbench
Chapter 8. IBM Tivoli Monitoring Workbench 127
8.2 Elements of a resource modelAll resource models are made up of seven basic elements.
� Dynamic model
In this element, you define all of the CIM classes and properties for the resource model. Under the dynamic model element are two sub-elements:
– CIM classes: This is where you define all resource model class definitions. To define and modify the CIM classes, you invoke the Workbench CIM browser. Figure 8-7 on page 134 shows an example of this.
– DM classic probes: This is where you define the Tivoli Distributed Monitoring (Classic Edition) 3.7 compatibility mode monitors. These definitions are imported from dumped MCSL files or source CSL files.
� Events
The event element is where all of the resource model indications are defined. It is where you define the default attributes that make up an event, along with the aggregation defaults (holes and occurrences). For greater discussion about this topic, see 8.3.3, “Event element of PhysicalDiskModel” on page 137.
� Thresholds
The threshold element is where you define the different resource model class property thresholds. For example, in TMW_PhysicalDiskModel, there are three threshold properties: HighBytesSec,HighQLength, and HighPercentUsage. These thresholds are set when the resource model is initialized on the endpoint and retrieved on each cycle time by the decision tree logic. The decision tree logic uses the threshold elements to determine if an indication should be sent.
� Parameters
The parameters element is used for parametric resource models. Parametric resource models are designed to allow the user to customize the resource model definitions from the IBM Tivoli Monitoring V5.1.1 profile. Some
Note: An event element in a resource model is an indication definition (as seen in an IBM Tivoli Monitoring V5.1.1 Profile). The event element is not the same thing as a TEC or Tivoli Business Systems Manager (TBSM) event. The IBM Tivoli Monitoring event aggregator processes all indications using event element (holes and occurrences) definitions. After it passes through the event aggregation, based on the number of holes and occurrences and the profile definitions, it can then become a TEC or TBSM event.
128 IBM Tivoli Monitoring V5.1.1 Implementation Certification Study Guide
examples of parametric-based resource models are TMW_ParamPort, TMW_ParamEventLog, and the TMW_ParamServices resource models. For example, the TMW_ParamServices resource model allows a user to customize the Windows NT or Windows 2000 monitored services defined in the profile from the Tivoli Desktop. The types of parameters are boolean list, choice list, numeric list, or string list.
� Logging
You use the logging element to define the properties of the resource model that are to be logged. All of the examples discussed in this chapter include logging elements.
� Dependencies
You use the dependencies element to define file dependencies that are to be pushed with the resource model when the profile is distributed to the endpoint. Examples of dependency files are dynamic linked libraries (DLLs), MOF files, and executable script files. We demonstrate the use of dependencies in some examples later in this chapter.
� Decision tree script
The decision tree script is made up of a set of function routines that provide the heart of the logic of the resource model. These functions set the default configuration definitions and thresholds, and process them by generating indications and logging events. Three primary functions are used by the IBM Tivoli Monitoring 5.1 engine at runtime, and one is used for debugging.
– SetDefaultConfiguration: This function sets runtime definitions based on resource model element settings. This routine is run once when the IBM Tivoli Monitoring 5.1 profile is pushed to the endpoint. The code in the function should not be modified because it is generated automatically by the Workbench. For example, if we use the Workbench to change the event element definitions, it automatically changes the corresponding definition in this function.
– Init: This function is called after the SetDefaultConfiguration function. you can use it to create user settings or change default settings. Remember that some of the values defined in the resource model elements can be overridden in the IBM Tivoli Monitoring profile. This routine runs after the profile settings are initialized.
– VisitTree: This routine runs every cycle time after the IBM Tivoli Monitoring profile is pushed. This function contains all of the decision tree logic. The VisitTree function retrieves threshold values defined in the SetDefaultConfiguration function and processes the decision tree logic through a series of “if” statements. When a threshold exceeded is detected, the VisitTree generates indications, logging events, or both. All of our examples demonstrate customizing the VisitTree code.
Chapter 8. IBM Tivoli Monitoring Workbench 129
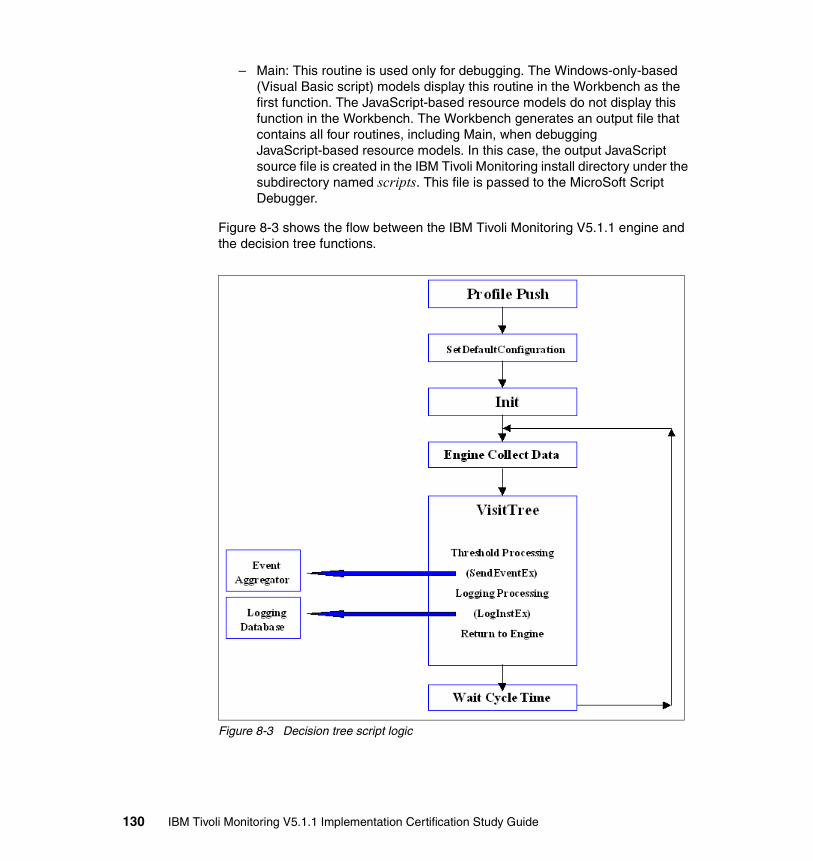
– Main: This routine is used only for debugging. The Windows-only-based (Visual Basic script) models display this routine in the Workbench as the first function. The JavaScript-based resource models do not display this function in the Workbench. The Workbench generates an output file that contains all four routines, including Main, when debugging JavaScript-based resource models. In this case, the output JavaScript source file is created in the IBM Tivoli Monitoring install directory under the subdirectory named scripts. This file is passed to the MicroSoft Script Debugger.
Figure 8-3 shows the flow between the IBM Tivoli Monitoring V5.1.1 engine and the decision tree functions.
Figure 8-3 Decision tree script logic
130 IBM Tivoli Monitoring V5.1.1 Implementation Certification Study Guide
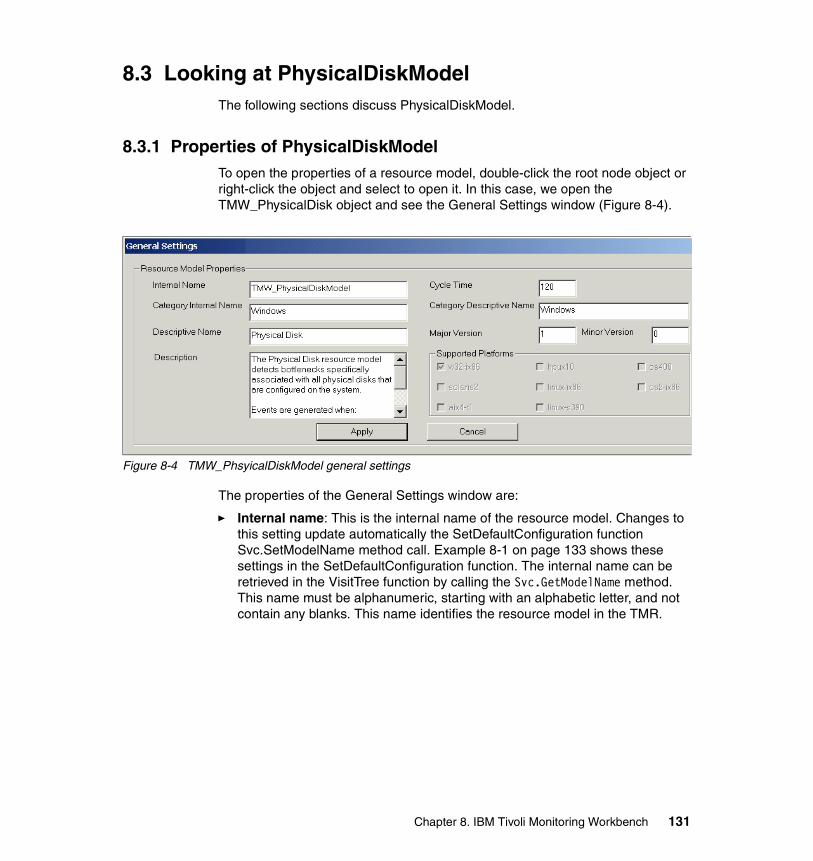
8.3 Looking at PhysicalDiskModelThe following sections discuss PhysicalDiskModel.
8.3.1 Properties of PhysicalDiskModelTo open the properties of a resource model, double-click the root node object or right-click the object and select to open it. In this case, we open the TMW_PhysicalDisk object and see the General Settings window (Figure 8-4).
Figure 8-4 TMW_PhsyicalDiskModel general settings
The properties of the General Settings window are:
� Internal name: This is the internal name of the resource model. Changes to this setting update automatically the SetDefaultConfiguration function Svc.SetModelName method call. Example 8-1 on page 133 shows these settings in the SetDefaultConfiguration function. The internal name can be retrieved in the VisitTree function by calling the Svc.GetModelName method. This name must be alphanumeric, starting with an alphabetic letter, and not contain any blanks. This name identifies the resource model in the TMR.
Chapter 8. IBM Tivoli Monitoring Workbench 131
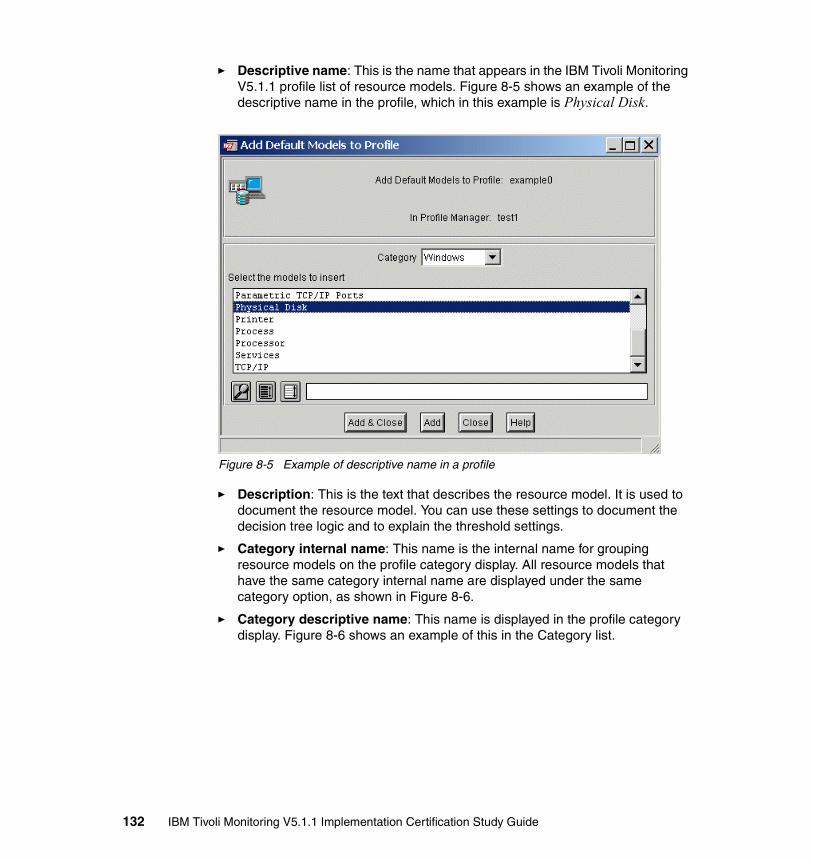
� Descriptive name: This is the name that appears in the IBM Tivoli Monitoring V5.1.1 profile list of resource models. Figure 8-5 shows an example of the descriptive name in the profile, which in this example is Physical Disk.
Figure 8-5 Example of descriptive name in a profile
� Description: This is the text that describes the resource model. It is used to document the resource model. You can use these settings to document the decision tree logic and to explain the threshold settings.
� Category internal name: This name is the internal name for grouping resource models on the profile category display. All resource models that have the same category internal name are displayed under the same category option, as shown in Figure 8-6.
� Category descriptive name: This name is displayed in the profile category display. Figure 8-6 shows an example of this in the Category list.
132 IBM Tivoli Monitoring V5.1.1 Implementation Certification Study Guide
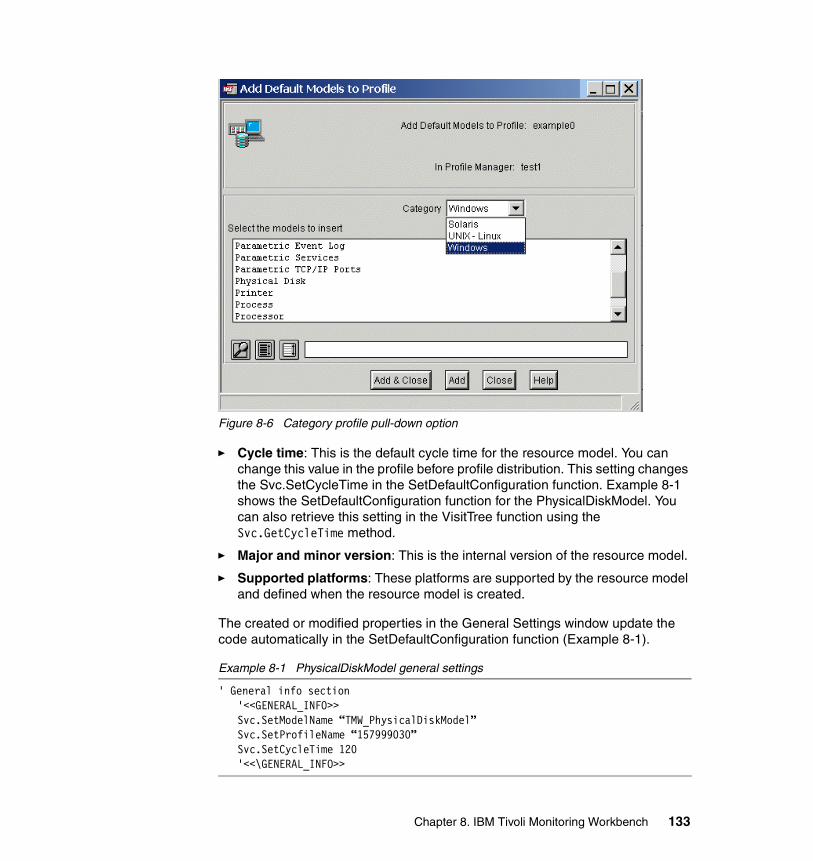
Figure 8-6 Category profile pull-down option
� Cycle time: This is the default cycle time for the resource model. You can change this value in the profile before profile distribution. This setting changes the Svc.SetCycleTime in the SetDefaultConfiguration function. Example 8-1 shows the SetDefaultConfiguration function for the PhysicalDiskModel. You can also retrieve this setting in the VisitTree function using the Svc.GetCycleTime method.
� Major and minor version: This is the internal version of the resource model.
� Supported platforms: These platforms are supported by the resource model and defined when the resource model is created.
The created or modified properties in the General Settings window update the code automatically in the SetDefaultConfiguration function (Example 8-1).
Example 8-1 PhysicalDiskModel general settings
' General info section'<<GENERAL_INFO>>Svc.SetModelName “TMW_PhysicalDiskModel”Svc.SetProfileName “157999030”Svc.SetCycleTime 120'<<\GENERAL_INFO>>
Chapter 8. IBM Tivoli Monitoring Workbench 133
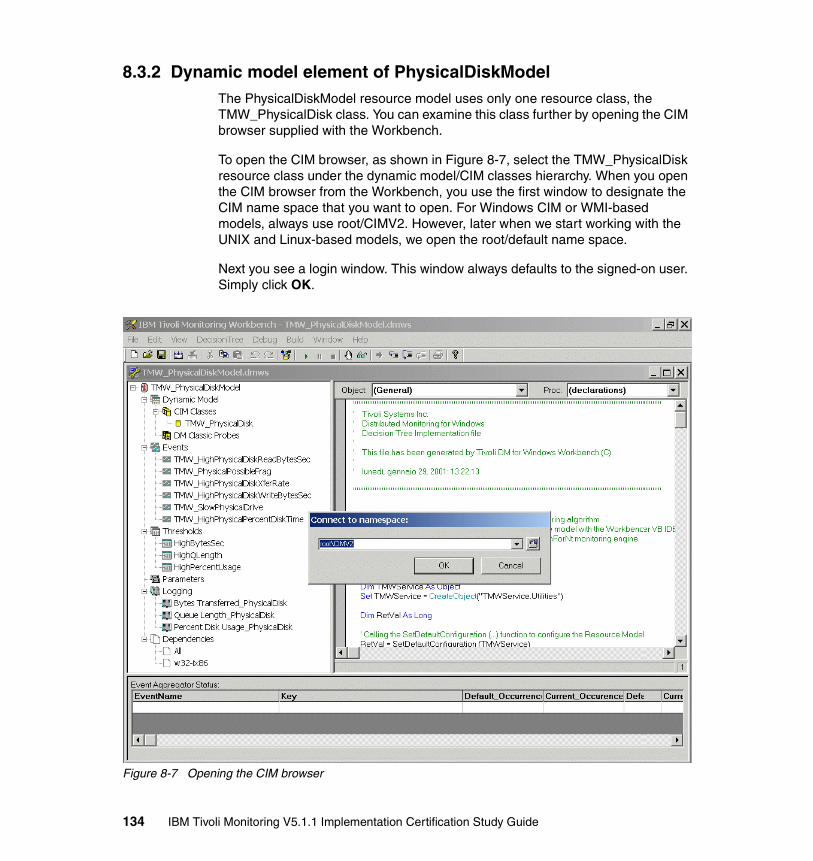
8.3.2 Dynamic model element of PhysicalDiskModelThe PhysicalDiskModel resource model uses only one resource class, the TMW_PhysicalDisk class. You can examine this class further by opening the CIM browser supplied with the Workbench.
To open the CIM browser, as shown in Figure 8-7, select the TMW_PhysicalDisk resource class under the dynamic model/CIM classes hierarchy. When you open the CIM browser from the Workbench, you use the first window to designate the CIM name space that you want to open. For Windows CIM or WMI-based models, always use root/CIMV2. However, later when we start working with the UNIX and Linux-based models, we open the root/default name space.
Next you see a login window. This window always defaults to the signed-on user. Simply click OK.
Figure 8-7 Opening the CIM browser
134 IBM Tivoli Monitoring V5.1.1 Implementation Certification Study Guide
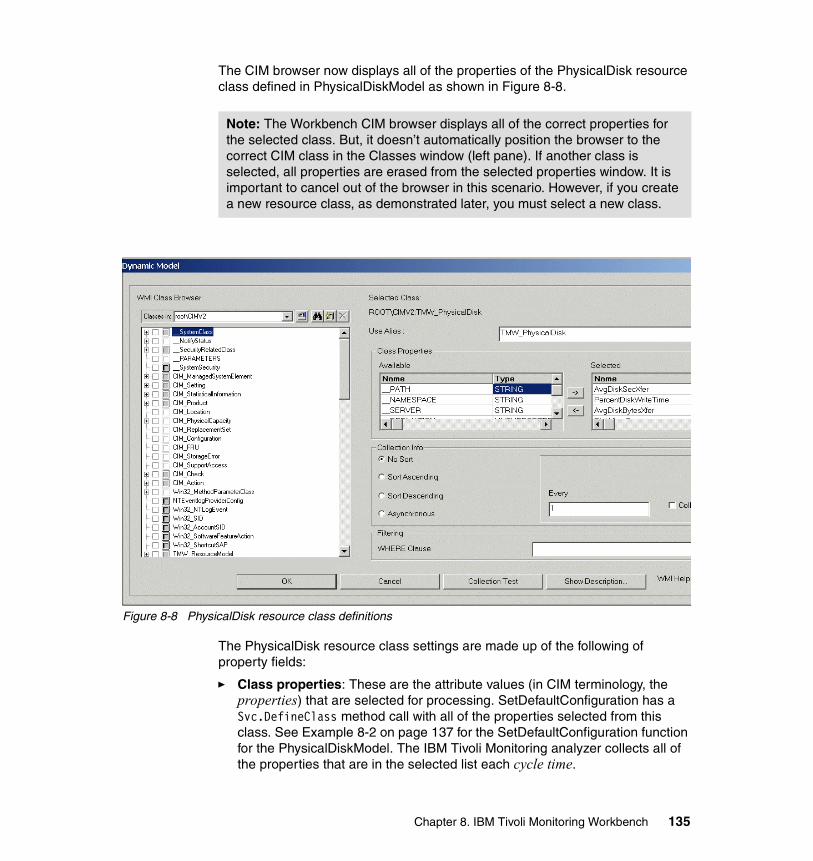
The CIM browser now displays all of the properties of the PhysicalDisk resource class defined in PhysicalDiskModel as shown in Figure 8-8.
Figure 8-8 PhysicalDisk resource class definitions
The PhysicalDisk resource class settings are made up of the following of property fields:
� Class properties: These are the attribute values (in CIM terminology, the properties) that are selected for processing. SetDefaultConfiguration has a Svc.DefineClass method call with all of the properties selected from this class. See Example 8-2 on page 137 for the SetDefaultConfiguration function for the PhysicalDiskModel. The IBM Tivoli Monitoring analyzer collects all of the properties that are in the selected list each cycle time.
Note: The Workbench CIM browser displays all of the correct properties for the selected class. But, it doesn’t automatically position the browser to the correct CIM class in the Classes window (left pane). If another class is selected, all properties are erased from the selected properties window. It is important to cancel out of the browser in this scenario. However, if you create a new resource class, as demonstrated later, you must select a new class.
Chapter 8. IBM Tivoli Monitoring Workbench 135
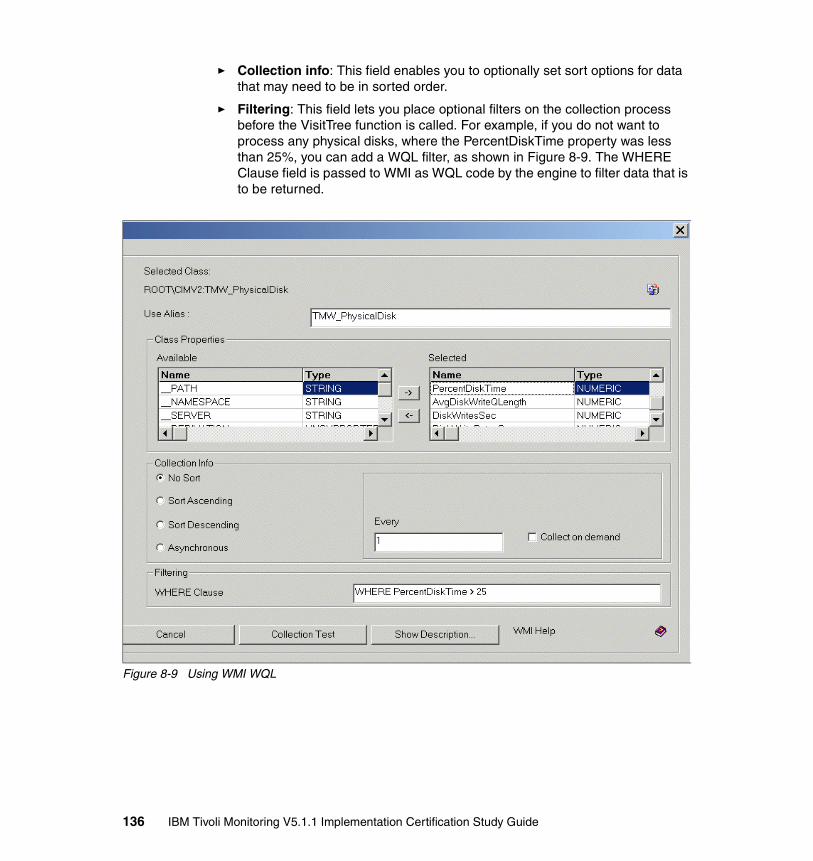
� Collection info: This field enables you to optionally set sort options for data that may need to be in sorted order.
� Filtering: This field lets you place optional filters on the collection process before the VisitTree function is called. For example, if you do not want to process any physical disks, where the PercentDiskTime property was less than 25%, you can add a WQL filter, as shown in Figure 8-9. The WHERE Clause field is passed to WMI as WQL code by the engine to filter data that is to be returned.
Figure 8-9 Using WMI WQL
136 IBM Tivoli Monitoring V5.1.1 Implementation Certification Study Guide
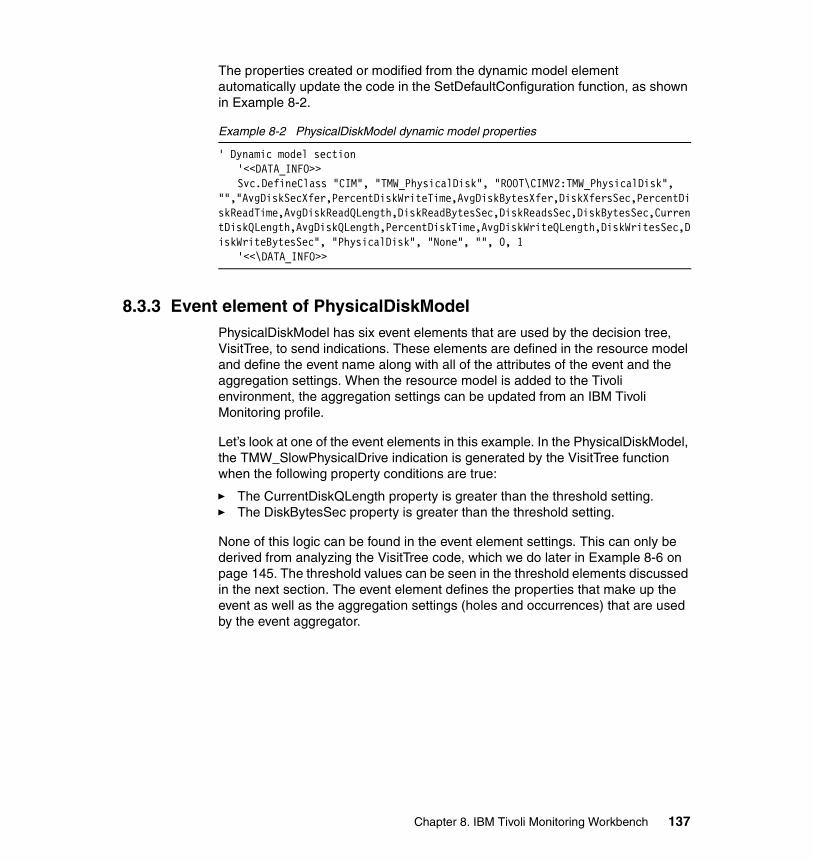
The properties created or modified from the dynamic model element automatically update the code in the SetDefaultConfiguration function, as shown in Example 8-2.
Example 8-2 PhysicalDiskModel dynamic model properties
' Dynamic model section'<<DATA_INFO>>Svc.DefineClass "CIM", "TMW_PhysicalDisk", "ROOT\CIMV2:TMW_PhysicalDisk",
"","AvgDiskSecXfer,PercentDiskWriteTime,AvgDiskBytesXfer,DiskXfersSec,PercentDiskReadTime,AvgDiskReadQLength,DiskReadBytesSec,DiskReadsSec,DiskBytesSec,CurrentDiskQLength,AvgDiskQLength,PercentDiskTime,AvgDiskWriteQLength,DiskWritesSec,DiskWriteBytesSec", "PhysicalDisk", "None", "", 0, 1
'<<\DATA_INFO>>
8.3.3 Event element of PhysicalDiskModelPhysicalDiskModel has six event elements that are used by the decision tree, VisitTree, to send indications. These elements are defined in the resource model and define the event name along with all of the attributes of the event and the aggregation settings. When the resource model is added to the Tivoli environment, the aggregation settings can be updated from an IBM Tivoli Monitoring profile.
Let’s look at one of the event elements in this example. In the PhysicalDiskModel, the TMW_SlowPhysicalDrive indication is generated by the VisitTree function when the following property conditions are true:
� The CurrentDiskQLength property is greater than the threshold setting.� The DiskBytesSec property is greater than the threshold setting.
None of this logic can be found in the event element settings. This can only be derived from analyzing the VisitTree code, which we do later in Example 8-6 on page 145. The threshold values can be seen in the threshold elements discussed in the next section. The event element defines the properties that make up the event as well as the aggregation settings (holes and occurrences) that are used by the event aggregator.
Chapter 8. IBM Tivoli Monitoring Workbench 137

Figure 8-10 shows an example of the TMW_SlowPhysicalDrive event element in the Workbench.
Figure 8-10 TMW_SlowPhysicalDrive event element settings
The TMW_SlowPhysicalDrive properties include:
� Internal name: This is the internal name used for this indication. It is defined in the SetDefaultConfiguration function with the Svc.DefineEvent method.
See Example 8-3 for the SetDefaultConfiguration function for the PhysicalDiskModel. The internal name is referenced in the VisitTree function by the SvcSendEvent and Svc.SendEventEx methods. The SendEvent and SendEventEx methods pass indications to the event aggregator to determine the action to take. The internal name is also used as a prefix to variables passed to shell scripts. For example, if a Perl script is invoked as a response from the TMW_SlowPhysicalDrive, one variable that is set in the Perl script at runtime is TMW_SlowPhysicalDrive_PercentDiskTime.
� Attributes: These attributes are of the event. If the event aggregator generates a TEC or TBSM event (based on holes and occurrences), these properties are passed into the slots of the TEC event and attributes of the TBSM event. These attributes are set in the VisitTree code before the SendEvent or SendEventEx methods are invoked.
� Aggregation settings: This is where you define the aggregation keys, along with the number of occurrences and holes for this indication.
138 IBM Tivoli Monitoring V5.1.1 Implementation Certification Study Guide
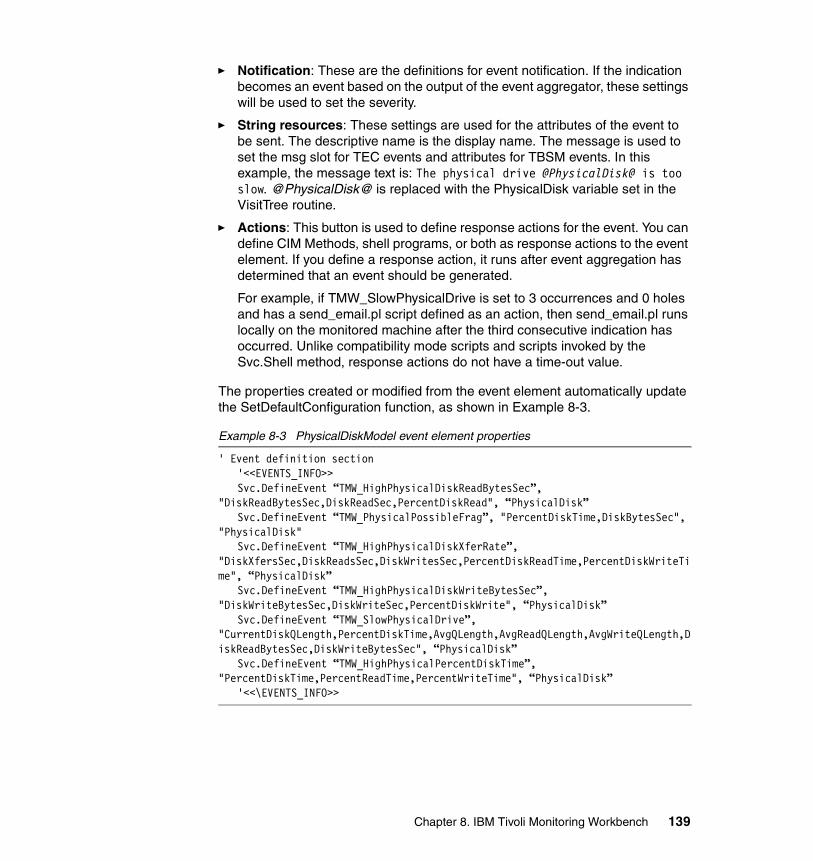
� Notification: These are the definitions for event notification. If the indication becomes an event based on the output of the event aggregator, these settings will be used to set the severity.
� String resources: These settings are used for the attributes of the event to be sent. The descriptive name is the display name. The message is used to set the msg slot for TEC events and attributes for TBSM events. In this example, the message text is: The physical drive @PhysicalDisk@ is too slow. @PhysicalDisk@ is replaced with the PhysicalDisk variable set in the VisitTree routine.
� Actions: This button is used to define response actions for the event. You can define CIM Methods, shell programs, or both as response actions to the event element. If you define a response action, it runs after event aggregation has determined that an event should be generated.
For example, if TMW_SlowPhysicalDrive is set to 3 occurrences and 0 holes and has a send_email.pl script defined as an action, then send_email.pl runs locally on the monitored machine after the third consecutive indication has occurred. Unlike compatibility mode scripts and scripts invoked by the Svc.Shell method, response actions do not have a time-out value.
The properties created or modified from the event element automatically update the SetDefaultConfiguration function, as shown in Example 8-3.
Example 8-3 PhysicalDiskModel event element properties
' Event definition section'<<EVENTS_INFO>>Svc.DefineEvent “TMW_HighPhysicalDiskReadBytesSec”,
"DiskReadBytesSec,DiskReadSec,PercentDiskRead", “PhysicalDisk”Svc.DefineEvent “TMW_PhysicalPossibleFrag”, "PercentDiskTime,DiskBytesSec",
"PhysicalDisk"Svc.DefineEvent “TMW_HighPhysicalDiskXferRate”,
"DiskXfersSec,DiskReadsSec,DiskWritesSec,PercentDiskReadTime,PercentDiskWriteTime", “PhysicalDisk”
Svc.DefineEvent “TMW_HighPhysicalDiskWriteBytesSec”, "DiskWriteBytesSec,DiskWriteSec,PercentDiskWrite", “PhysicalDisk”
Svc.DefineEvent “TMW_SlowPhysicalDrive”, "CurrentDiskQLength,PercentDiskTime,AvgQLength,AvgReadQLength,AvgWriteQLength,DiskReadBytesSec,DiskWriteBytesSec", “PhysicalDisk”
Svc.DefineEvent “TMW_HighPhysicalPercentDiskTime”, "PercentDiskTime,PercentReadTime,PercentWriteTime", “PhysicalDisk”
'<<\EVENTS_INFO>>
Chapter 8. IBM Tivoli Monitoring Workbench 139
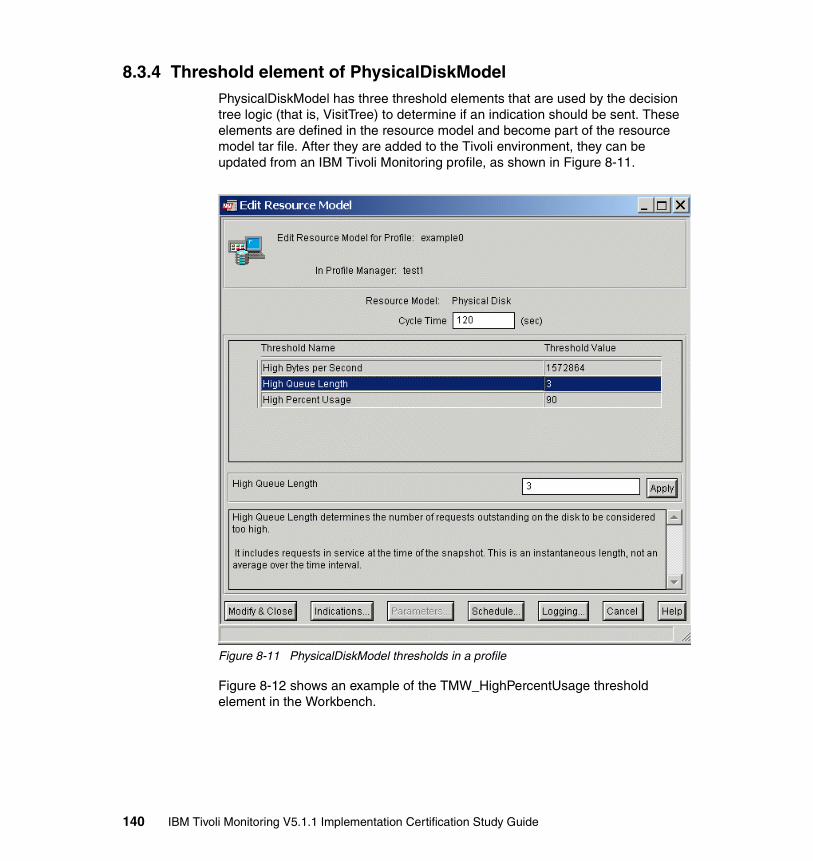
8.3.4 Threshold element of PhysicalDiskModelPhysicalDiskModel has three threshold elements that are used by the decision tree logic (that is, VisitTree) to determine if an indication should be sent. These elements are defined in the resource model and become part of the resource model tar file. After they are added to the Tivoli environment, they can be updated from an IBM Tivoli Monitoring profile, as shown in Figure 8-11.
Figure 8-11 PhysicalDiskModel thresholds in a profile
Figure 8-12 shows an example of the TMW_HighPercentUsage threshold element in the Workbench.
140 IBM Tivoli Monitoring V5.1.1 Implementation Certification Study Guide
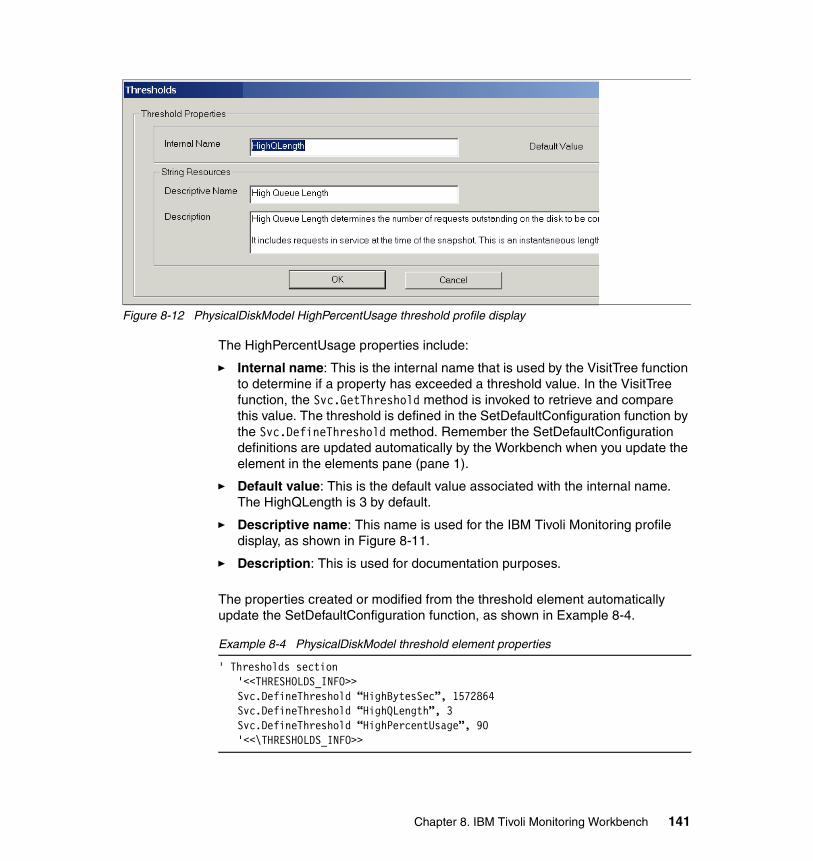
Figure 8-12 PhysicalDiskModel HighPercentUsage threshold profile display
The HighPercentUsage properties include:
� Internal name: This is the internal name that is used by the VisitTree function to determine if a property has exceeded a threshold value. In the VisitTree function, the Svc.GetThreshold method is invoked to retrieve and compare this value. The threshold is defined in the SetDefaultConfiguration function by the Svc.DefineThreshold method. Remember the SetDefaultConfiguration definitions are updated automatically by the Workbench when you update the element in the elements pane (pane 1).
� Default value: This is the default value associated with the internal name. The HighQLength is 3 by default.
� Descriptive name: This name is used for the IBM Tivoli Monitoring profile display, as shown in Figure 8-11.
� Description: This is used for documentation purposes.
The properties created or modified from the threshold element automatically update the SetDefaultConfiguration function, as shown in Example 8-4.
Example 8-4 PhysicalDiskModel threshold element properties
' Thresholds section'<<THRESHOLDS_INFO>>Svc.DefineThreshold “HighBytesSec”, 1572864Svc.DefineThreshold “HighQLength”, 3Svc.DefineThreshold “HighPercentUsage”, 90'<<\THRESHOLDS_INFO>>
Chapter 8. IBM Tivoli Monitoring Workbench 141
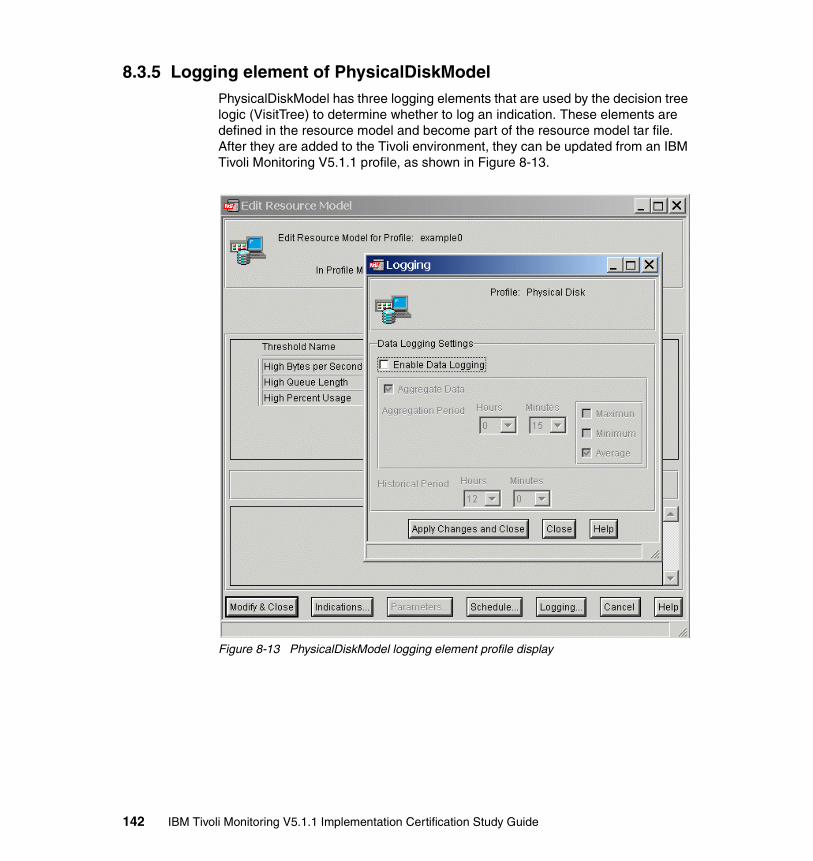
8.3.5 Logging element of PhysicalDiskModelPhysicalDiskModel has three logging elements that are used by the decision tree logic (VisitTree) to determine whether to log an indication. These elements are defined in the resource model and become part of the resource model tar file. After they are added to the Tivoli environment, they can be updated from an IBM Tivoli Monitoring V5.1.1 profile, as shown in Figure 8-13.
Figure 8-13 PhysicalDiskModel logging element profile display
142 IBM Tivoli Monitoring V5.1.1 Implementation Certification Study Guide
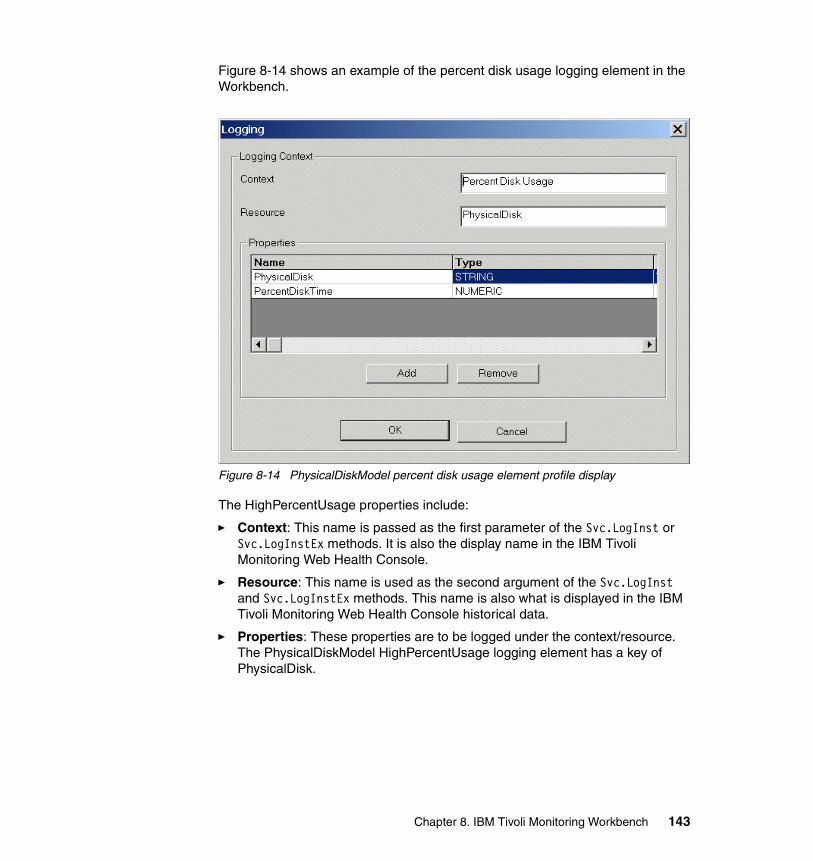
Figure 8-14 shows an example of the percent disk usage logging element in the Workbench.
Figure 8-14 PhysicalDiskModel percent disk usage element profile display
The HighPercentUsage properties include:
� Context: This name is passed as the first parameter of the Svc.LogInst or Svc.LogInstEx methods. It is also the display name in the IBM Tivoli Monitoring Web Health Console.
� Resource: This name is used as the second argument of the Svc.LogInst and Svc.LogInstEx methods. This name is also what is displayed in the IBM Tivoli Monitoring Web Health Console historical data.
� Properties: These properties are to be logged under the context/resource. The PhysicalDiskModel HighPercentUsage logging element has a key of PhysicalDisk.
Chapter 8. IBM Tivoli Monitoring Workbench 143
The properties created or modified from the logging element automatically update the SetDefaultConfiguration function, as shown in Example 8-5.
Example 8-5 Physicaldiskmodel logging element properties
' Logging definition section'<<LOGGING_INFO>>Svc.DefineLogInst “Bytes Transferred”, “PhysicalDisk”, “PhysicalDisk”,
“DiskBytesSec”, “PhysicalDisk”Svc.DefineLogInst “Queue Length”, “PhysicalDisk”, “PhysicalDisk”,
“AvgQLength”, “PhysicalDisk”Svc.DefineLogInst “Percent Disk Usage”, “PhysicalDisk”, “PhysicalDisk”,
“PercentDiskTime”, “PhysicalDisk”'<<\LOGGING_INFO>>
8.3.6 Decision tree script of PhysicalDiskModelAs you have seen so far, PhysicalDiskModel is made up of four key components: dynamic model elements, event elements, threshold elements, and logging elements. We have been focusing on the three specific elements:
� The TMW_SlowPhysicalDrive event element� The HighQueueLength threshold element� The Percent Disk Usage_PhysicalDisk logging element
The PhysicalDiskModel decision tree script code ties these three elements together. This is a Visual Basic script-based model that uses Microsoft’s WMI to retrieve CIM data. WMI is Microsoft’s implementation of the CIM architecture on Windows machines.
VisitTree in PhysicalDiskModel only generates indications and logs data. First let’s look at how the TMW_SlowPhysicalDrive indication is sent to the event aggregator.
PhysicalDiskModel collects data from the WMI Performance Monitoring Provider (PerfProv). Most of the Windows-based resource models collect data from PerfProv as well. In the dynamic model element of PhysicalDiskModel, all of the properties that are defined are collected each cycle time before the VisitTree function is called.
Note: The event aggregator is not in the decision tree code. It is part of the IBM Tivoli Monitoring engine.
144 IBM Tivoli Monitoring V5.1.1 Implementation Certification Study Guide
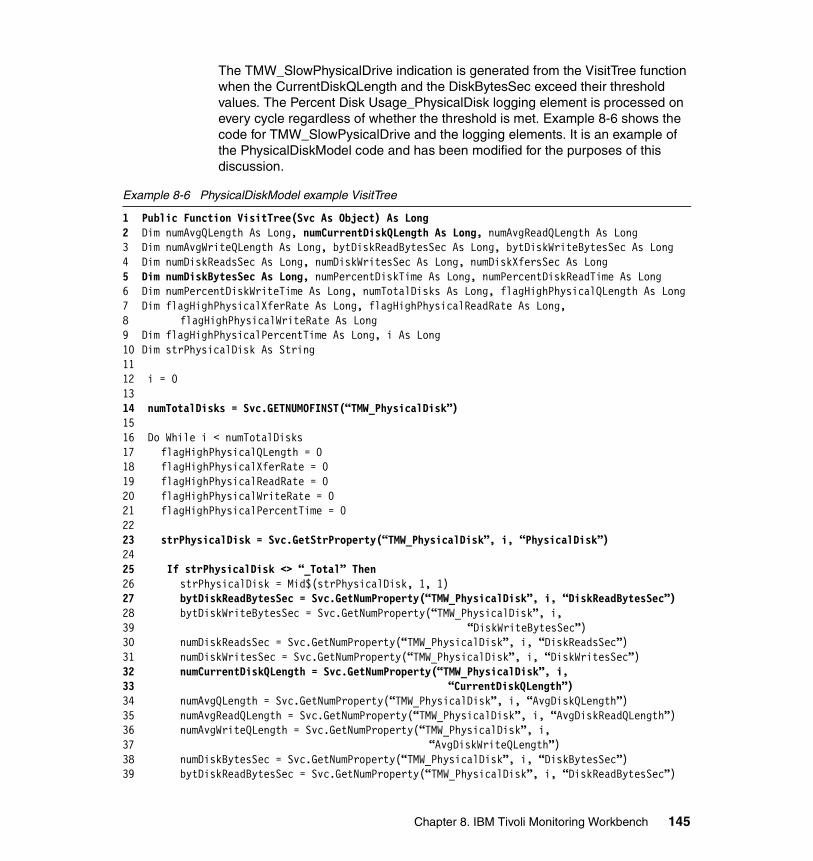
The TMW_SlowPhysicalDrive indication is generated from the VisitTree function when the CurrentDiskQLength and the DiskBytesSec exceed their threshold values. The Percent Disk Usage_PhysicalDisk logging element is processed on every cycle regardless of whether the threshold is met. Example 8-6 shows the code for TMW_SlowPysicalDrive and the logging elements. It is an example of the PhysicalDiskModel code and has been modified for the purposes of this discussion.
Example 8-6 PhysicalDiskModel example VisitTree
1 Public Function VisitTree(Svc As Object) As Long2 Dim numAvgQLength As Long, numCurrentDiskQLength As Long, numAvgReadQLength As Long3 Dim numAvgWriteQLength As Long, bytDiskReadBytesSec As Long, bytDiskWriteBytesSec As Long4 Dim numDiskReadsSec As Long, numDiskWritesSec As Long, numDiskXfersSec As Long5 Dim numDiskBytesSec As Long, numPercentDiskTime As Long, numPercentDiskReadTime As Long6 Dim numPercentDiskWriteTime As Long, numTotalDisks As Long, flagHighPhysicalQLength As Long7 Dim flagHighPhysicalXferRate As Long, flagHighPhysicalReadRate As Long,8 flagHighPhysicalWriteRate As Long9 Dim flagHighPhysicalPercentTime As Long, i As Long10 Dim strPhysicalDisk As String1112 i = 01314 numTotalDisks = Svc.GETNUMOFINST(“TMW_PhysicalDisk”)15 16 Do While i < numTotalDisks17 flagHighPhysicalQLength = 018 flagHighPhysicalXferRate = 019 flagHighPhysicalReadRate = 020 flagHighPhysicalWriteRate = 021 flagHighPhysicalPercentTime = 02223 strPhysicalDisk = Svc.GetStrProperty(“TMW_PhysicalDisk”, i, “PhysicalDisk”)2425 If strPhysicalDisk <> “_Total” Then26 strPhysicalDisk = Mid$(strPhysicalDisk, 1, 1)27 bytDiskReadBytesSec = Svc.GetNumProperty(“TMW_PhysicalDisk”, i, “DiskReadBytesSec”)28 bytDiskWriteBytesSec = Svc.GetNumProperty(“TMW_PhysicalDisk”, i,39 “DiskWriteBytesSec”)30 numDiskReadsSec = Svc.GetNumProperty(“TMW_PhysicalDisk”, i, “DiskReadsSec”)31 numDiskWritesSec = Svc.GetNumProperty(“TMW_PhysicalDisk”, i, “DiskWritesSec”)32 numCurrentDiskQLength = Svc.GetNumProperty(“TMW_PhysicalDisk”, i,33 “CurrentDiskQLength”)34 numAvgQLength = Svc.GetNumProperty(“TMW_PhysicalDisk”, i, “AvgDiskQLength”)35 numAvgReadQLength = Svc.GetNumProperty(“TMW_PhysicalDisk”, i, “AvgDiskReadQLength”)36 numAvgWriteQLength = Svc.GetNumProperty(“TMW_PhysicalDisk”, i,37 “AvgDiskWriteQLength”)38 numDiskBytesSec = Svc.GetNumProperty(“TMW_PhysicalDisk”, i, “DiskBytesSec”)39 bytDiskReadBytesSec = Svc.GetNumProperty(“TMW_PhysicalDisk”, i, “DiskReadBytesSec”)
Chapter 8. IBM Tivoli Monitoring Workbench 145
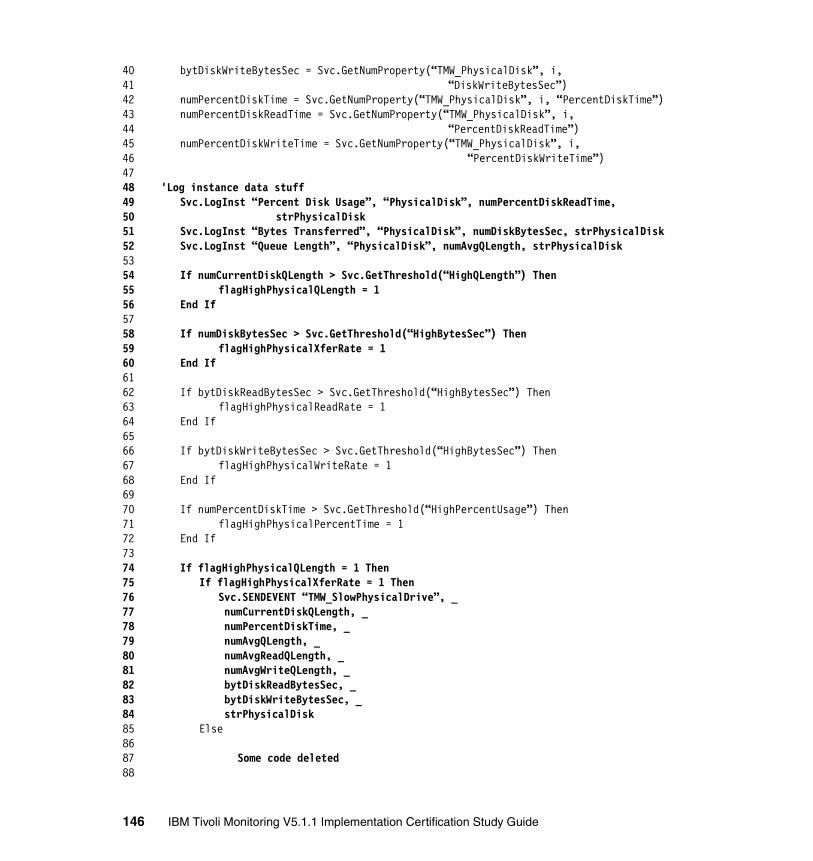
40 bytDiskWriteBytesSec = Svc.GetNumProperty(“TMW_PhysicalDisk”, i,41 “DiskWriteBytesSec”)42 numPercentDiskTime = Svc.GetNumProperty(“TMW_PhysicalDisk”, i, “PercentDiskTime”)43 numPercentDiskReadTime = Svc.GetNumProperty(“TMW_PhysicalDisk”, i,44 “PercentDiskReadTime”)45 numPercentDiskWriteTime = Svc.GetNumProperty(“TMW_PhysicalDisk”, i,46 “PercentDiskWriteTime”)4748 'Log instance data stuff49 Svc.LogInst “Percent Disk Usage”, “PhysicalDisk”, numPercentDiskReadTime,50 strPhysicalDisk51 Svc.LogInst “Bytes Transferred”, “PhysicalDisk”, numDiskBytesSec, strPhysicalDisk52 Svc.LogInst “Queue Length”, “PhysicalDisk”, numAvgQLength, strPhysicalDisk5354 If numCurrentDiskQLength > Svc.GetThreshold(“HighQLength”) Then55 flagHighPhysicalQLength = 156 End If5758 If numDiskBytesSec > Svc.GetThreshold(“HighBytesSec”) Then59 flagHighPhysicalXferRate = 160 End If6162 If bytDiskReadBytesSec > Svc.GetThreshold(“HighBytesSec”) Then63 flagHighPhysicalReadRate = 164 End If65 66 If bytDiskWriteBytesSec > Svc.GetThreshold(“HighBytesSec”) Then67 flagHighPhysicalWriteRate = 168 End If6970 If numPercentDiskTime > Svc.GetThreshold(“HighPercentUsage”) Then71 flagHighPhysicalPercentTime = 172 End If7374 If flagHighPhysicalQLength = 1 Then75 If flagHighPhysicalXferRate = 1 Then76 Svc.SENDEVENT “TMW_SlowPhysicalDrive”, _77 numCurrentDiskQLength, _78 numPercentDiskTime, _79 numAvgQLength, _80 numAvgReadQLength, _81 numAvgWriteQLength, _82 bytDiskReadBytesSec, _83 bytDiskWriteBytesSec, _84 strPhysicalDisk85 Else8687 Some code deleted88
146 IBM Tivoli Monitoring V5.1.1 Implementation Certification Study Guide
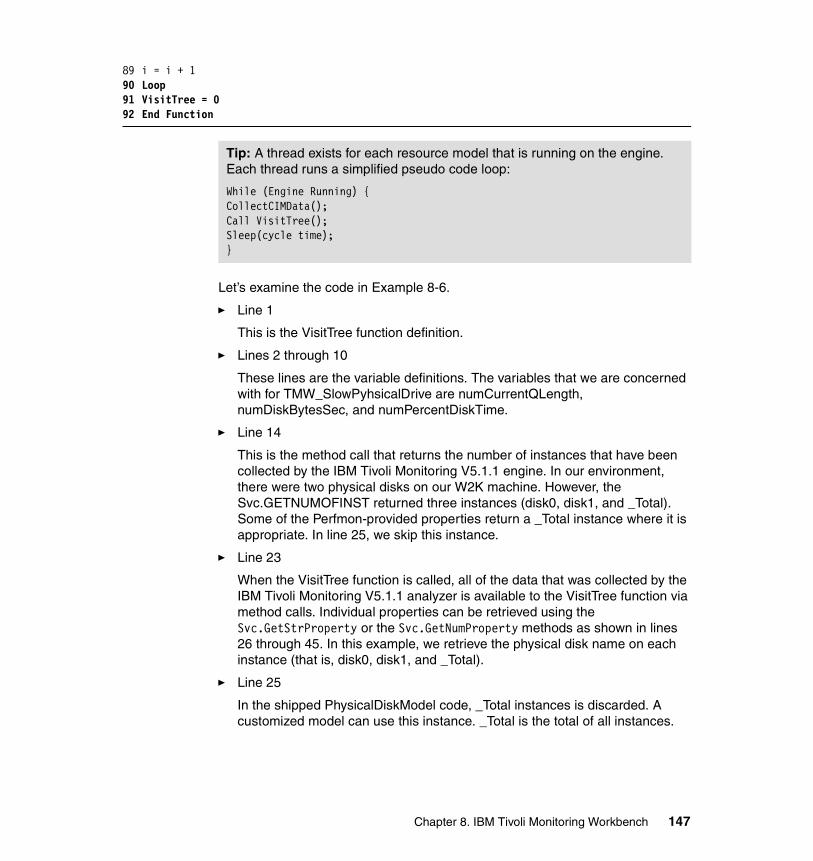
89 i = i + 190 Loop91 VisitTree = 092 End Function
Let’s examine the code in Example 8-6.
� Line 1
This is the VisitTree function definition.
� Lines 2 through 10
These lines are the variable definitions. The variables that we are concerned with for TMW_SlowPyhsicalDrive are numCurrentQLength, numDiskBytesSec, and numPercentDiskTime.
� Line 14
This is the method call that returns the number of instances that have been collected by the IBM Tivoli Monitoring V5.1.1 engine. In our environment, there were two physical disks on our W2K machine. However, the Svc.GETNUMOFINST returned three instances (disk0, disk1, and _Total). Some of the Perfmon-provided properties return a _Total instance where it is appropriate. In line 25, we skip this instance.
� Line 23
When the VisitTree function is called, all of the data that was collected by the IBM Tivoli Monitoring V5.1.1 analyzer is available to the VisitTree function via method calls. Individual properties can be retrieved using the Svc.GetStrProperty or the Svc.GetNumProperty methods as shown in lines 26 through 45. In this example, we retrieve the physical disk name on each instance (that is, disk0, disk1, and _Total).
� Line 25
In the shipped PhysicalDiskModel code, _Total instances is discarded. A customized model can use this instance. _Total is the total of all instances.
Tip: A thread exists for each resource model that is running on the engine. Each thread runs a simplified pseudo code loop:
While (Engine Running) {CollectCIMData(); Call VisitTree();Sleep(cycle time);}
Chapter 8. IBM Tivoli Monitoring Workbench 147
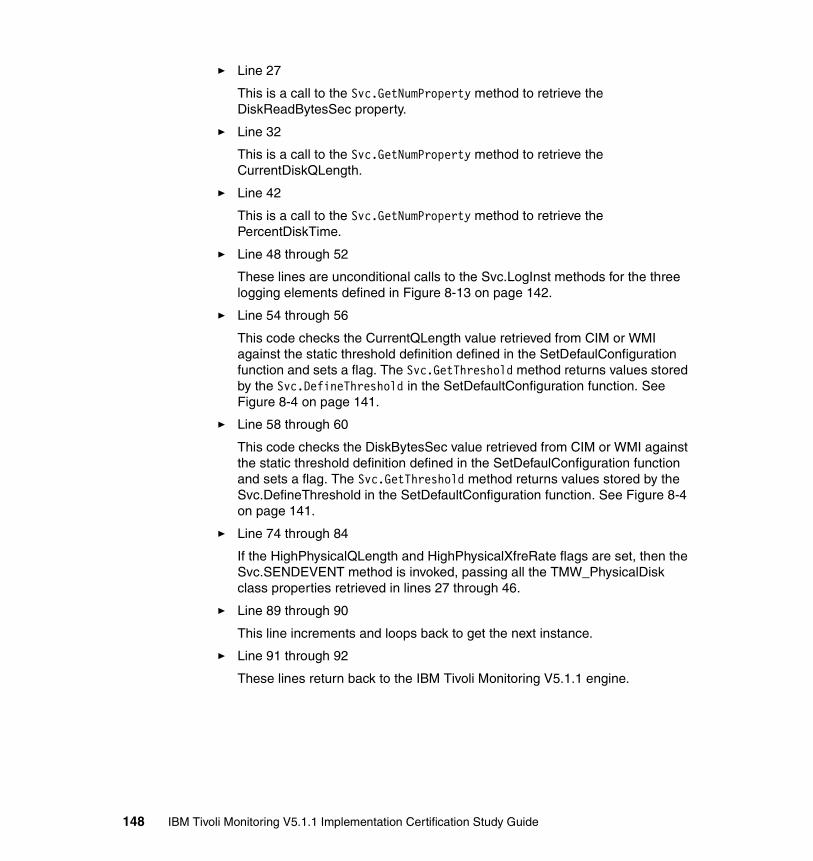
� Line 27
This is a call to the Svc.GetNumProperty method to retrieve the DiskReadBytesSec property.
� Line 32
This is a call to the Svc.GetNumProperty method to retrieve the CurrentDiskQLength.
� Line 42
This is a call to the Svc.GetNumProperty method to retrieve the PercentDiskTime.
� Line 48 through 52
These lines are unconditional calls to the Svc.LogInst methods for the three logging elements defined in Figure 8-13 on page 142.
� Line 54 through 56
This code checks the CurrentQLength value retrieved from CIM or WMI against the static threshold definition defined in the SetDefaulConfiguration function and sets a flag. The Svc.GetThreshold method returns values stored by the Svc.DefineThreshold in the SetDefaultConfiguration function. See Figure 8-4 on page 141.
� Line 58 through 60
This code checks the DiskBytesSec value retrieved from CIM or WMI against the static threshold definition defined in the SetDefaulConfiguration function and sets a flag. The Svc.GetThreshold method returns values stored by the Svc.DefineThreshold in the SetDefaultConfiguration function. See Figure 8-4 on page 141.
� Line 74 through 84
If the HighPhysicalQLength and HighPhysicalXfreRate flags are set, then the Svc.SENDEVENT method is invoked, passing all the TMW_PhysicalDisk class properties retrieved in lines 27 through 46.
� Line 89 through 90
This line increments and loops back to get the next instance.
� Line 91 through 92
These lines return back to the IBM Tivoli Monitoring V5.1.1 engine.
148 IBM Tivoli Monitoring V5.1.1 Implementation Certification Study Guide
8.4 Working with a resource model in WorkbenchWhen you start IBM Tivoli Monitoring V5.1.1 Workbench, there are several options to start working with resource models.
� Create an empty resource model and build the resource model from scratch. With this method, you need to:
– Define the resource model property– Define a dynamic model– Define events– Define thresholds– Define parameters– Define data to log– Define the decision tree script– Add dependencies– Build a resource model
� Import a monitoring source. You can import a monitoring source (or a whole monitoring collection) also in a resource model that already exists, by opening the resource model tree structure. This is typically performed for importing the DM classic module. Under the Dynamic Model element, right-click DM Classic Probes, and select the file format of mcsl or csl output.
� Generate resource models using the Resource Model wizard. This allows you to build the resource model without the need of coding. The wizard allows you to create a resource model from:
– A selected CIM class taken from the WMI repository
– A monitoring collection extracted using the mcsl command from Tivoli Distributed Monitoring
– A custom script that sent as a dependency and invoked using the ServiceShell method from VisitTree function
After you define your resource model, you can start building components of your resource models. Run the following options under the build option:
� Building the Package
To build your resource model into a complete tar package that you can later install on the IBM Tivoli Monitoring V5.1.1 server, install the resource model. From the command line, type the following command:
wdmrrm -add filename.tar
Chapter 8. IBM Tivoli Monitoring Workbench 149
� Building the TEC BAROC
To see your resource model events on the Tivoli Enterprise Console, you have to build and export a TEC BAROC file. This file contains all the event definitions specified in the BAROC language. You can install this file on a TEC Rule base. It allows the Tivoli Enterprise Console to display the events of your resource model.
� Exporting the Message Catalog
Optionally, you can build a message file containing all the information that will be displayed in IBM Tivoli Monitoring dialogs. This can be useful if you want to translate your text information into other languages. The workbench is designed to generate resource model packages that contain all the strings for the English Locale. Therefore, double-byte character set (DBCS) characters are not supported. All localized strings should be handled separately from the workbench.
� Building an HTML file
You can build an HTML document that contains all the information that is related to your resource model and included in the descriptive sections of the resource model components.
150 IBM Tivoli Monitoring V5.1.1 Implementation Certification Study Guide
Appendix A. Sample test questions
This appendix contains a collection of sample test questions and their answers to help you prepare for Certification Test 593: IBM Tivoli Monitoring V5.1.1 Implementation.
A
© Copyright IBM Corp. 2004. All rights reserved. 151
Sample test questionsAnder the following questions. To check your answers, see “Answers to sample test questions” on page 156.
1. What documentation contains information about the Framework patches that are required before you install IBM Tivoli Monitoring V5.1.1?
a. IBM Tivoli Monitoring Release Notes 5.1.1 b. IBM Tivoli Monitoring User Guide 5.1.1 c. IBM Tivoli Monitoring Workbench Release Notes 5.1.1 d. IBM Tivoli Monitoring Resource Model User Guide 5.1.1
2. Which three platforms are supported by IBM Tivoli Monitoring V5.1.1? (Choose three.)
a. Windows XP b. NetWare c. HP-UX d. OS/400 e. OS/2® f. SCO UNIX
3. What is the minimum memory requirement for the IBM Tivoli Monitoring Web Health Console?
a. 256 MB b. 512 MB c. 384 MB d. 1024 MB
4. Which two statements are true about the “supported” database creation for the Tivoli Enterprise Data Warehouse Support Component? (Choose two.)
a. cr_itm_db.sh must be executed from the DB server for DB2. b. cr_itm_db.sh must be executed from the DB server for Informix. c. cr_itm_db.sh must be executed from the DB server for MS SQL. d. cr_itm_db.sh must be executed from the DB server for Sybase. e. cr_itm_db.sh must be executed from the DB server for Oracle.
5. Which language is supported in the IBM Tivoli Monitoring Workbench’s Decision Tree script? (Choose two.)
a. Perl b. Visual Basic c. JavaScript d. C++ e. XML
152 IBM Tivoli Monitoring V5.1.1 Implementation Certification Study Guide
6. Which command do you use to enable the physical and logical disk counters on Windows-based platforms?
a. Perfmon b. Diskperf c. WMI d. Diskmon
7. What is the recommended amount of memory for the IBM Tivoli Monitoring V5.1.1 Web Health Console?
a. 256 MB b. 384 MB c. 512 MB d. 1 GB
8. Which product can coexist with IBM Tivoli Monitoring 5.1.1?
a. Tivoli Distributed Monitoring (Classic Edition) 3.7 b. Tivoli Distributed Monitoring (Advanced Edition) 4.1 c. Tivoli Distributed Monitoring for Windows 3.7 d. Tivoli Manager for Windows NT
9. IBM Tivoli Monitoring 5.1.1 requires a Java Runtime Environment (JRE) to be installed on the endpoint. What command should you use to deploy the compressed version of the JRE shipped with IBM Tivoli Monitoring 5.1.1 to the endpoint?
a. wdmdeploy -J b. wdmjredeploy -J c. wdmdeployjre -J d. wdmdistrib -J
10.Assuming a Windows-based TEC server with default configuration, what port should you use when configuring an IBM Tivoli Monitoring Monitoring Profile for sending non-TME events to TEC?
a. 0 b. 5529 c. 9494 d. 9495
11.You have a Tmw2kProfile that contains three resource models which support logging. Where is the Data Logging feature enabled to ensure that the models collect data for the Web Health Console?
a. Web Health Console Preferences view b. Tmw2kProfile GUI window c. Resource Model GUI window d. Workbench must be used to rebuild the models.
Appendix A. Sample test questions 153
12.Which database requires you to change the password for the IBM Tivoli Monitoring RIM object from the Tivoli default?
a. Microsoft SQL Server b. Oracle c. Sybase d. DB2
13.What command do you use to configure the heartbeat options other than the heartbeat frequency?
a. wdmheartbeat b. wdmeng c. wdmmn d. wdmconfig
14.What do the individual resource model BAROC files depend on being loaded into TEC first?
a. Itm511.baroc b. Tmw2k.baroc c. dmae.baroc d. dm.baroc
15.The client wants to monitor the activity of distributed resource models on UNIX endpoints and to log errors that occur to /tmp/MyTrace.log. Which CLI command should the client use to achieve this?
a. wdmtrceng -e MyEndpoint "" /tmp/MyTrace.log b. wdmtrceng -e MyEndpoint /tmp/MyTrace.log 3 c. wdmtrceng -e MyEndpoint /tmp/MyTrace.log 0 d. This capability is not possible.
16.Which command is most useful when troubleshooting the error message "Failed to enumerate instances" when it appears in theTmw2k.log on a Windows-based endpoint?
a. wmitest.exe b. wmiinst -debug c. java d. wbemtest.exe
17.You have distributed a profile that contains five resource models. One resource model is not sending Tivoli Business Systems Manager (TBSM) events, although the others are doing successfully. What should you verify?
a. The Send TBSM box is selected for this profile. b. The Send TBSM Events button is clicked for the appropriate indication. c. Severity is set to FATAL for the appropriate indication. d. The Send TEC Event button is clicked for the appropriate indication.
154 IBM Tivoli Monitoring V5.1.1 Implementation Certification Study Guide
18.Tivoli Monitoring provides three serviceability tasks to collect, in tar format, logs and trace information. Which task is not one of the provided three serviceability tasks?
a. DMCollectMnEnv b. DMCollectEpEnv c. DMCollectMnLog d. DMCollectEpLog
19.Which CLI command is used to monitor the distribution of a Tmw2KProfile?
a. wdmdistrib b. wmdist c. wrpt d. wdepot
20.What are two valid resource model status messages returned by wdmlseng? (Choose two.)
a. Scheduled b. Distributed c. Compiled d. Restarted e. Not compiled
21.What information can you view using the wdmmngcache -m all -l –v command? (Choose two.)
a. A list of endpoints in the Tivoli Name Registry that have not yet been discovered
b. The list of resource models cached on the managed node and gateways
c. The TEC events cached from endpoints running IBM Tivoli Monitoring resource models
d. The TBSM status for discovered endpoints
e. The heartbeat status for discovered endpoints
22.Which statement is true?
a. Using the command line operation, it is possible to create an IBM Tivoli Monitoring 5.1.1 profile using an XML file on a Windows-based platform.
b. Using the command line operation, it is possible to create an IBM Tivoli Monitoring 5.1.1 profile using an XML file on a UNIX-based platform.
c. Using the command line operation, it is possible to create an IBM Tivoli Monitoring 5.1.1 profile using an XML file on any platform.
d. Using the command line operation, it is possible to create an IBM Tivoli Monitoring 5.1.1 profile using an XML file on Linux-based platform.
Appendix A. Sample test questions 155
23.In which two scripting languages can resource models be written? (Choose two.)
a. Visual Basic b. Shell c. Perl d. JavaScript e. Bash
24.Which command allows the user to browse details of Classic Distributed Monitoring probes and collections as well as to dump the internal source?
a. wdmcol b. dmtf c. mcsl d. wdmrm
Answers to sample test questions The answers are highted in bold.
1. What documentation contains information about the Framework patches that are required before you install IBM Tivoli Monitoring V5.1.1?
a. IBM Tivoli Monitoring Release Notes 5.1.1 b. IBM Tivoli Monitoring User Guide 5.1.1 c. IBM Tivoli Monitoring Workbench Release Notes 5.1.1 d. IBM Tivoli Monitoring Resource Model User Guide 5.1.1
2. Which three platforms are supported by IBM Tivoli Monitoring V5.1.1? (Choose three.)
a. Windows XP b. NetWare c. HP-UX d. OS/400 e. OS/2 f. SCO UNIX
3. What is the minimum memory requirement for the IBM Tivoli Monitoring Web Health Console?
a. 256 MB b. 512 MB c. 384 MB d. 1024 MB
156 IBM Tivoli Monitoring V5.1.1 Implementation Certification Study Guide
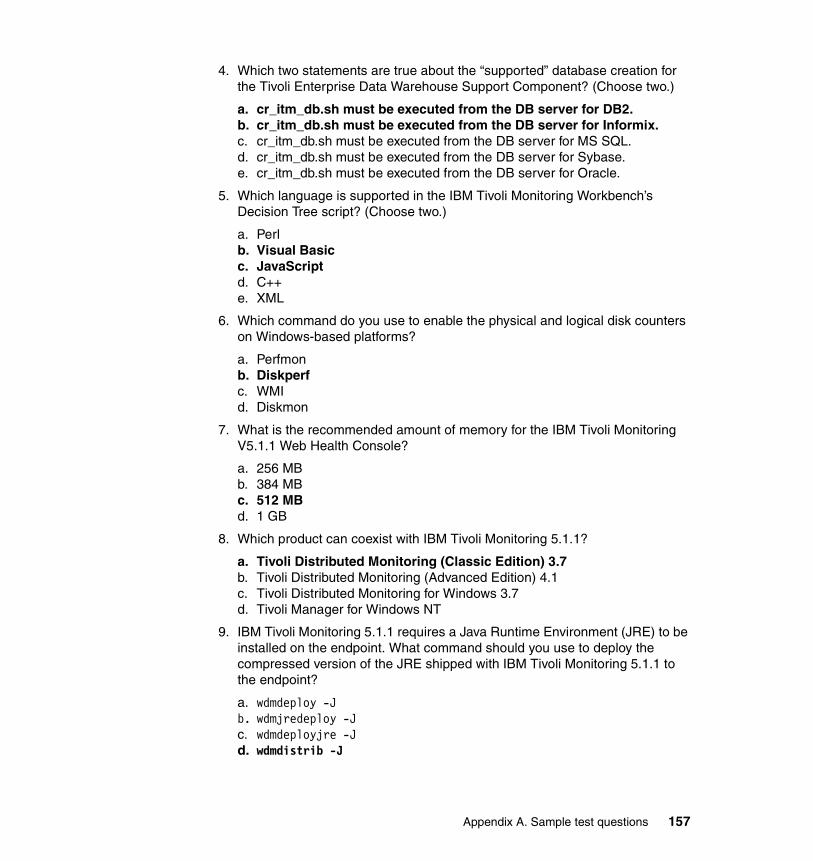
4. Which two statements are true about the “supported” database creation for the Tivoli Enterprise Data Warehouse Support Component? (Choose two.)
a. cr_itm_db.sh must be executed from the DB server for DB2. b. cr_itm_db.sh must be executed from the DB server for Informix. c. cr_itm_db.sh must be executed from the DB server for MS SQL. d. cr_itm_db.sh must be executed from the DB server for Sybase. e. cr_itm_db.sh must be executed from the DB server for Oracle.
5. Which language is supported in the IBM Tivoli Monitoring Workbench’s Decision Tree script? (Choose two.)
a. Perl b. Visual Basic c. JavaScript d. C++ e. XML
6. Which command do you use to enable the physical and logical disk counters on Windows-based platforms?
a. Perfmon b. Diskperf c. WMI d. Diskmon
7. What is the recommended amount of memory for the IBM Tivoli Monitoring V5.1.1 Web Health Console?
a. 256 MB b. 384 MB c. 512 MB d. 1 GB
8. Which product can coexist with IBM Tivoli Monitoring 5.1.1?
a. Tivoli Distributed Monitoring (Classic Edition) 3.7 b. Tivoli Distributed Monitoring (Advanced Edition) 4.1 c. Tivoli Distributed Monitoring for Windows 3.7 d. Tivoli Manager for Windows NT
9. IBM Tivoli Monitoring 5.1.1 requires a Java Runtime Environment (JRE) to be installed on the endpoint. What command should you use to deploy the compressed version of the JRE shipped with IBM Tivoli Monitoring 5.1.1 to the endpoint?
a. wdmdeploy -J b. wdmjredeploy -J c. wdmdeployjre -J d. wdmdistrib -J
Appendix A. Sample test questions 157
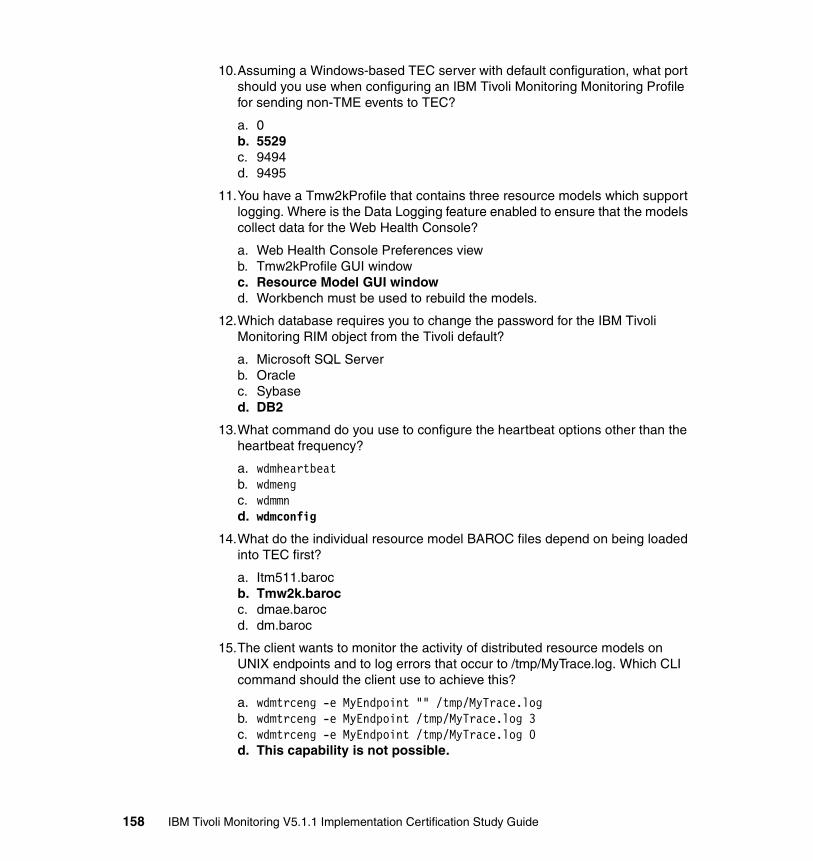
10.Assuming a Windows-based TEC server with default configuration, what port should you use when configuring an IBM Tivoli Monitoring Monitoring Profile for sending non-TME events to TEC?
a. 0 b. 5529 c. 9494 d. 9495
11.You have a Tmw2kProfile that contains three resource models which support logging. Where is the Data Logging feature enabled to ensure that the models collect data for the Web Health Console?
a. Web Health Console Preferences view b. Tmw2kProfile GUI window c. Resource Model GUI window d. Workbench must be used to rebuild the models.
12.Which database requires you to change the password for the IBM Tivoli Monitoring RIM object from the Tivoli default?
a. Microsoft SQL Server b. Oracle c. Sybase d. DB2
13.What command do you use to configure the heartbeat options other than the heartbeat frequency?
a. wdmheartbeat b. wdmeng c. wdmmn d. wdmconfig
14.What do the individual resource model BAROC files depend on being loaded into TEC first?
a. Itm511.baroc b. Tmw2k.baroc c. dmae.baroc d. dm.baroc
15.The client wants to monitor the activity of distributed resource models on UNIX endpoints and to log errors that occur to /tmp/MyTrace.log. Which CLI command should the client use to achieve this?
a. wdmtrceng -e MyEndpoint "" /tmp/MyTrace.log b. wdmtrceng -e MyEndpoint /tmp/MyTrace.log 3 c. wdmtrceng -e MyEndpoint /tmp/MyTrace.log 0 d. This capability is not possible.
158 IBM Tivoli Monitoring V5.1.1 Implementation Certification Study Guide
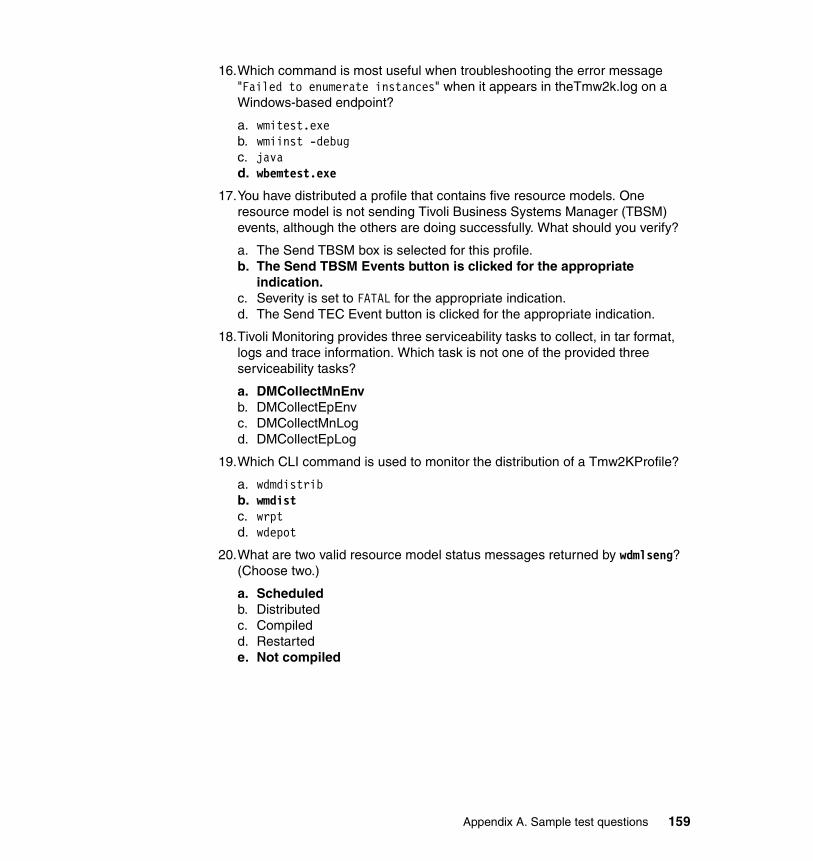
16.Which command is most useful when troubleshooting the error message "Failed to enumerate instances" when it appears in theTmw2k.log on a Windows-based endpoint?
a. wmitest.exe b. wmiinst -debug c. java d. wbemtest.exe
17.You have distributed a profile that contains five resource models. One resource model is not sending Tivoli Business Systems Manager (TBSM) events, although the others are doing successfully. What should you verify?
a. The Send TBSM box is selected for this profile. b. The Send TBSM Events button is clicked for the appropriate
indication. c. Severity is set to FATAL for the appropriate indication. d. The Send TEC Event button is clicked for the appropriate indication.
18.Tivoli Monitoring provides three serviceability tasks to collect, in tar format, logs and trace information. Which task is not one of the provided three serviceability tasks?
a. DMCollectMnEnv b. DMCollectEpEnv c. DMCollectMnLog d. DMCollectEpLog
19.Which CLI command is used to monitor the distribution of a Tmw2KProfile?
a. wdmdistrib b. wmdist c. wrpt d. wdepot
20.What are two valid resource model status messages returned by wdmlseng? (Choose two.)
a. Scheduled b. Distributed c. Compiled d. Restarted e. Not compiled
Appendix A. Sample test questions 159
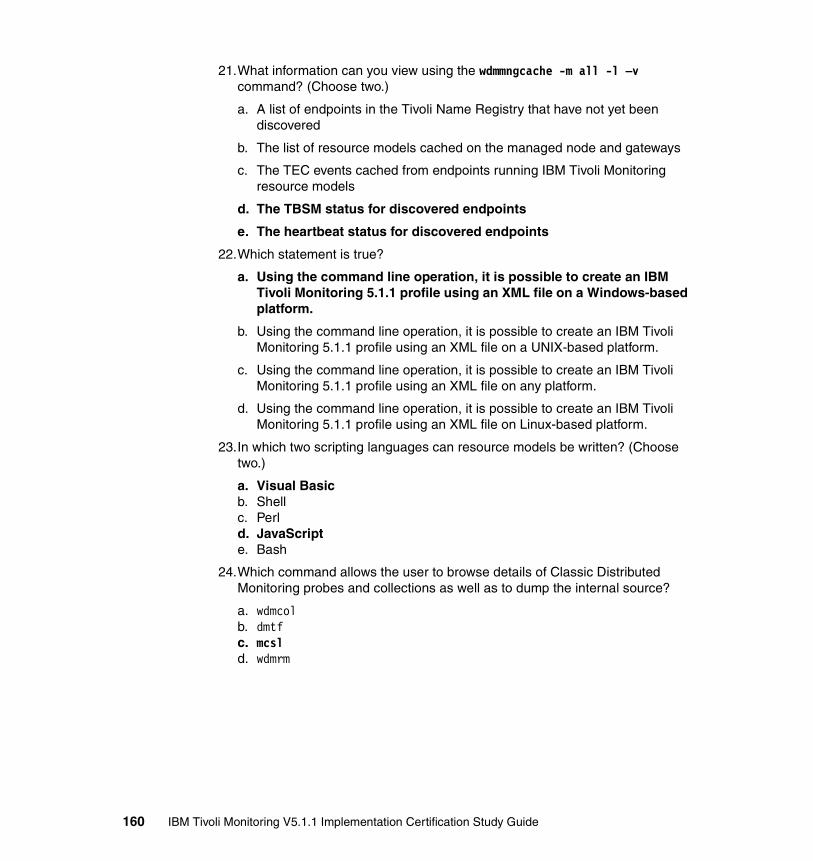
21.What information can you view using the wdmmngcache -m all -l –v command? (Choose two.)
a. A list of endpoints in the Tivoli Name Registry that have not yet been discovered
b. The list of resource models cached on the managed node and gateways
c. The TEC events cached from endpoints running IBM Tivoli Monitoring resource models
d. The TBSM status for discovered endpoints
e. The heartbeat status for discovered endpoints
22.Which statement is true?
a. Using the command line operation, it is possible to create an IBM Tivoli Monitoring 5.1.1 profile using an XML file on a Windows-based platform.
b. Using the command line operation, it is possible to create an IBM Tivoli Monitoring 5.1.1 profile using an XML file on a UNIX-based platform.
c. Using the command line operation, it is possible to create an IBM Tivoli Monitoring 5.1.1 profile using an XML file on any platform.
d. Using the command line operation, it is possible to create an IBM Tivoli Monitoring 5.1.1 profile using an XML file on Linux-based platform.
23.In which two scripting languages can resource models be written? (Choose two.)
a. Visual Basic b. Shell c. Perl d. JavaScript e. Bash
24.Which command allows the user to browse details of Classic Distributed Monitoring probes and collections as well as to dump the internal source?
a. wdmcol b. dmtf c. mcsl d. wdmrm
160 IBM Tivoli Monitoring V5.1.1 Implementation Certification Study Guide
Related publications
The publications listed in this section are considered particularly suitable for a more detailed discussion of the topics covered in this Redpaper.
IBM RedbooksFor information about ordering these publications, see “How to get IBM Redbooks” on page 162. Note that some of the documents referenced here may be available in softcopy only.
� Maintaining Your Tivoli Environment, SG24-5013
� IBM Tivoli Monitoring Version 5.1: Advanced Resource Monitoring, SG24-5519
� IBM WebSphere Version 4.0 Advanced Edition Handbook, SG24-6176
� IBM Tivoli Monitoring Version 5.1.1 Creating Resource Models and Providers, SG24-6900
� Tivoli Business Systems Manager V2.1 End-to-end Business Impact Management, SG24-6610
� Implementing Tivoli Data Warehouse V 1.2, SG24-7100
Other publicationsThese publications are also relevant as further information sources:
� Tivoli Framework Version 3.7.1 Installation Guide, GC32-0395
� IBM Tivoli Monitoring Release Notes Version 5.1.1, GI10-5797
� IBM Tivoli Monitoring User’s Guide Version 5.1.1, SH19-4569
� IBM Tivoli Monitoring Resource Model Reference Version 5.1, SH19-4570
� IBM Tivoli Monitoring Workbench User’s Guide Version 5.1.1, SH19-4571
� IBM Tivoli Monitoring: Resource Model Builder User's Guide
� IBM Tivoli Monitoring: Resource Model Builder Problem Determination Guide
� IBM Tivoli Monitoring: Deployment Supplement
� IBM Tivoli Monitoring: Road Map for a Typical Installation
© Copyright IBM Corp. 2004. All rights reserved. 161
Online resourcesThese Web sites and URLs are also relevant as further information sources:
� IBM Certification page
http://ibm.com/certify
� IBM Publication Center page
http://www.ibm.com/shop/publications/order
� IBM Education Services page
http://ibm.com/training
How to get IBM RedbooksYou can search for, view, or download Redbooks, Redpapers, Hints and Tips, draft publications and Additional materials, as well as order hardcopy Redbooks or CD-ROMs, at this Web site:
ibm.com/redbooks
Help from IBMIBM Support and downloads
ibm.com/support
IBM Global Services
ibm.com/services
162 IBM Tivoli Monitoring V5.1.1 Implementation Certification Study Guide
Index
Symbols$DBDIR/dmml/.config 105$root_user 26/etc/passwd 28
AActionManager, logging 90adapter, logging 90adapter.trace.enable 79adapter.trace.level 79adapter.working.dir 79administrator 24
authorization roles 26aggregate data, configuring 67analyzer 38, 65, 70
logging 90Application Proxy 102Application Services 102authorization role 26
Bbuilt-in tasks 65bulk discovery 80–81bulletin board 24
CCIM 35, 37, 65
architecture 35extension schemas 36name space 134Object Manager 36purpose 35static classes 36
CIM browser 134–135limitation 135
CIM classes 128CIM compliant 36CIM Schema 36
class 36CIM Specification 36CIM Studio 91CIMOM 36
© Copyright IBM Corp. 2004. All rights reserved.
classPhysicalDisk 135TMW_PhysicalDisk 134
CLI (command line interface) 23command
setupaix.bin 56setuphp1020.bin 56setuphp11x.bin 56setuplinux.bin 56setupsolarisSparc.bin 56setupwin32.exe 55wadminep 88wbemdump 91wbkupdb 51wdepot 104wdistrib 104wdmcmd 91, 106wdmcollect 106wdmconfig 77, 79, 85–88, 105wdmdiscovery 78, 80–81wdmdistrib 104wdmeng 106wdmheartbeat 78wdmmn 78, 86–87, 105wdmmngcache 76, 78, 106wdmrm 106wdmtrceng 89, 91–94winmsd 98wmdist 104
command endpoint log 88command line interface (CLI) 23comment, prepareLog 96Common Listener 78, 81common model 36ComponentManager, logging 90configuration file 105core dumps 97core model 36CurrentDiskQLength 137cycle time 65
Ddata logging, location of files 67
163
database 21decision tree file 38, 70decision tree script 129, 144default policy 25default policy method 25delta discovery 80delta discovery switch 81dependencies element 129depot 31
repeater 31desktop 21directory
$DBDIR/dmml 81$DBDIR†mml 77
DiskBytesSec 137dispatcher, logging 90distributed database 21Distributed Management Task Force (DMTF) 35DM classic probes 128DMLinkJre 54DMTF (Distributed Management Task Force) 35DNS name 81dynamic model 128, 137, 144dynamic model elements 144
Eenable data logging 67endpoint
cache, viewing 76collect environment 98collecting logs 96distribution 38, 70logs 88
endpoint enginelog 89, 93logging in UNIX 93stop or start 106trace 93update log 92
endpoint gateway 24endpoint JMX log 94endpoint manager 24endpoint native trace 93endpoint registration 74endpoint upcall, tracing 86engine 34engine update process log 92event aggregator 137, 144
event element 128, 137, 144Actions property 139Aggregation settings property 138Attributes property 138Internal name property 138Notification property 139String resources property 139
Event Server Port 81event, configuring 65EventAggregator, logging 90EventCorrelator, logging 90external script 65
Ffile
%DBDIR%/tmp/tivoli.cinstall 51/tmp/tivoli.cinstall 51epcache.db 81lcfd.bk 96lcfd.log 96PDLog.properties 94TMW_PhysicalDiskModel.dmws 126tmw2kdb.mdb 67UNIX datafile 67winmsdreport.txt 98
Ggateway 24gateway repeater 32
HHealth Console 67
configuring 108debug tracing 94drill down 114Endpoint List View 113endpoint sort order 113endpoints it can monitor 110Historical Data 120–121import endpoints 110logging 94logging in 108main view 112navigation bar 112online graph 118Preferences 111Refresh Interval 111
164 IBM Tivoli Monitoring V5.1.1 Implementation Certification Study Guide
Resource Model List view 116start or stop the engine 114Tivoli roles 109usage 108
Heartbeatactivities 74configure 77control 77error event 74monitoring 76overview 74status 74stopping and starting 78
heartbeat database, removing endpoint 106heartbeat engine
restarting 86stop or start 106tracing 85
heartbeat function 74heartbeat.reboot_engine_if_down 77heartbeat.send_events_to_notice 77heartbeat.send_events_to_tbsm 77heartbeat.send_events_to_tec 77heartbeat.tec_server 77historical data 67historical data graph, creating 121holes, modifying 65
IIBM HTTP Server, installation 56icons
bulletin board 24endpoint manager 24job 25policy region 24profile 24profile manager 24scheduler 25task 25TMA endpoint 22
indication 65generation 145modifying 65
Init 129installation
error files 51steps 52Windows TMR additional step 53
InstallSharedDll, logging 90intermediate client 31
Jjava com.tivoli.dmunix.ep.agent.Main, logging 93Java interface 32JavaBeans 18JavaScript 38, 70JMX trace 94job 25
Llast.cfg
log_threshold 88log
default_server_stderr.log 95default_server_stdout.log 95dmxout.log 97gatelog 97last.cfg 96msg_dmxengine.log 93msg_xxxxx.log 97oservlog 97Tmw2k.log 97Tmx4j_1.log 94Tmx4j1.log 96Tmx4j2.log 97trace_dmxeu.log 92trace_dmxntv.log 93trace_tnmt_gtw_engn.log 97trace_xxxx.log 97trace_xxxxx.log 97
Logger, logging 90logging element 129, 142, 144
propertiesContext 143Properties 143Resource 143
logging, customizing data 67logs
$DBDIR/distmgr.log 84$DBDIR/rpt2log 84$LCF_DATDIR/lcfd.log 84Endpoint 84endpoints 88file summary 85Gateway Repeater 84Managed node Repeater 84
Index 165
msg_Tmw2kProfilename.log 84profile distribution 84server 84TMR Distribution Manager 84Tmw2k.log 89trace_tmnt_gtw_engn.log 87trace_tmnt_hb_engn.log 85trace_tmnt_profile_coren.log 88trace_tmnt_rm_engn.log 87trace_tmnt_task_engn.log 86
Mmain function for debugging 130managed node 22
collecting logs 97repeater 32
managed resources 24management by subscription 21MDist 2 components
Distribution manager 32GUI 32Repeater Depot 31Repeater manager 31Repeater queue 32Repeater site 31
MDIST2assured delivery 102asynchronous delivery 102check-point and restart 102data depoting 102
message catalog 38, 70meta-schema 36method
register_endpoint 75SendEvent 138SendEventEx 138Svc.DefineClass 135Svc.DefineEvent 138Svc.DefineThreshold 148Svc.GetModelName 131Svc.GETNUMOFINST 147Svc.GetNumProperty 148Svc.GetNumPropery 147Svc.GetStrProperty 147Svc.GetThreshold 148Svc.LogInst 143, 148Svc.LogInstEx 143Svc.SENDEVENT 148
Svc.SendEventEx 138Svc.SetModelName 131SvcSendEvent 138
model-to-resources association 38, 70MOF file 38, 70, 129
base 38, 70distribution 38, 70resources 38, 70
MofCompiler, logging 90monitoring of additional processes 68MsgQueueManager, logging 90
Nname space
root/CIMV2 134root/default 134
native processes 93NetWare Managed Site (NWMS) 28NetWare servers
See also NWMS 28NIS 28non-secure events 69non-TME delivery 81notification 24NWMS (NetWare Managed Site) 28
Oobject-oriented database 21occurrence, modifying 65odadmin command 33ODBC tmw2k data source 67oserv daemon 21
Pparameters element 128Perfmon 147PhysicalDiskModel 126, 131, 135policy 22, 24
default policy 25policy method 25policy region 24–25policy subregion 25validation policy 25
policy region creation 53profile 21, 24, 27
customization 68overview 34
166 IBM Tivoli Monitoring V5.1.1 Implementation Certification Study Guide
types 28profile core, tracing 88profile distribution 104
actions 38, 70configuring logging level 88logs 88
profile distribution endpoint log 88profile endpoint 28profile manager 24, 27, 53
database mode 29dataless mode 29
ProfileManager 102
Qqueuing mechanism 31
RRapid Deployment 43RDBMS Interface Module
See RIMRDBMS interface module (RIM) 19Redbooks Web site 162
Contact us xregistry hive 89repeater depot 31request manager
restarting 87tracing 87
resource classClass properties 135Collection info 136Filtering 136property fields 135
Resource Interface Instrumentation Library Type 37resource model 34
Category descriptive name 132Category internal name 132components 38, 70configuration file 38, 70customize example 64Cycle time 133definition 37Description 132Descriptive name 132elements 128event automated tasks 65Internal name 131
Major and minor version 133properties 131stop or start 106Supported platforms 133UNIX Processes 68
resource model threads 147resource, managed 24response script variables 138retry function 31RIM (RDBMS interface module) 19, 32root cause analysis 38
Sschedule monitoring 67scheduler 25
configuring 67script 25
after_install_win.sh 53startServer.bat 95startServer.sh 95stopServer.bat 95stopServer.sh 95
secure connection 69Server Location 81server location 81SetDefaultConfiguration 129SNMP 36storage mechanism 31subnet-mask:network_id 80subscriber 28synchronous transfer 31syslogd 68
Ttarget machine 28task 25
dm_mn_send_email 66dm_mn_send_notice 66DMCollectEpEnv 98DMCollectEpLog 96DMCollectMnLog 97task library 25
task enginerestarting 86tracing 86
Task Library 53installation 53
TBSM Adapter 78–79
Index 167
configuring 79endpoint discovery 81installation 79
tbsma.jre_root 79–80TemporarySink, logging 90threshold 65
names 65values 65
threshold element 128, 137, 140, 144properties
Default value 141Description 141Descriptive name 141Internal name 141
Tivoli Business Systems Manager 38, 68, 70, 74, 76
Health Console launching 79integration functions 78integration steps 78
Tivoli Business Systems Manager Adapterstop or start 106
Tivoli Desktop 21Tivoli Enterprise Console 38, 68, 70, 74, 76Tivoli Enterprise Console Adapter Configuration Fa-cility 81Tivoli Enterprise Data Warehouse 67Tivoli Management Region
See TMRTivoli Notice Groups 74, 76Tivoli role
admin 109, 114–115senior 115super 115user 109
TivoliDefaultMw2kRegion 53TMA endpoint 22, 102TME (Secure) Delivery 81TME delivery mode 81tmeLogger.trc.level 94tmnt_gtw_eng, tracing 87tmnt_hb_eng, tracing 85tmnt_rm_eng, stop or start 106tmnt_task_eng
stop or start 106tracing 86
tmnt_trm_eng, tracing 87TMNT_Upcall, logging 90TMR
See Tivoli Management Region
TMR server 21TMW_HighPercentUsage 140TMW_ParamEventLog 129TMW_ParamPort 129TMW_ParamServices 129TMW_PhysicalDisk 131TMW_PhysicalDiskModel 126TMW_Services 38TMW_SlowPhysicalDrive 137–138Tmw2k logs 89Tmw2k_ep log 88–89tmw2k_ep log 92tmw2k_profile_core, tracing 88TMWMethodProv, logging 90TMWService, logging 90Tmx4j, logging 94TouchPoint 37
ILT 37TSL 37
Touchpoint Service Layer 37trace file summary 85trace, configuring 85trace.filename 80transport.mqe.usefiller 80transport.server.ip.address 79transport.server.mqe.port 79transport.trace.enable 80transport.trace.level 80
UUNIX
CIM 37endpoint trace level 92logging 93
Vvalidation policy 25validation policy method 25variable definitions 147VB script 38, 70VisitTree 129, 144Visual Basic 144
WWbemConnector, logging 90wbkupdb command 34wchkdb command 34
168 IBM Tivoli Monitoring V5.1.1 Implementation Certification Study Guide
Web Health Console 34disk space 55logs and traces 94temporary install space 56UNIX install 56
WebSphere Application Serverdisabling tracing 95recycling 95tracing 95
WHERE Clause 136Windows endpoint log 89Windows Management Instrumentation
see WMI 37Windows NT 81wlookup command 33wlsinst command 33wmdist command 34WMI
logging 91logs 89Windows NT 4.0 37
WMI Performance Monitoring Provider 144Workbench panes 126WQL filter 136
XxmlCIM 16
Index 169

170 IBM Tivoli Monitoring V5.1.1 Implementation Certification Study Guide

®
INTERNATIONAL TECHNICALSUPPORTORGANIZATION
BUILDING TECHNICALINFORMATION BASED ONPRACTICAL EXPERIENCE
IBM Redbooks are developed by the IBM International Technical Support Organization. Experts from IBM, Customers and Partners from around the world create timely technical information based on realistic scenarios. Specific recommendations are provided to help you implement IT solutions more effectively in your environment.
For more information:ibm.com/redbooks
Redpaper
IBM Tivoli Monitoring V5.1.1 ImplementationCertification Study Guide
Explains how to prepare for, install, configure and operate IBM Tivoli Monitoring V5.1.1
Prepares you to take Certification Test 593
Includes sample test questions and answers
This IBM Redpaper prepares you with the necessary knowledge to help you complete Certification Test 593: IBM Tivoli Monitoring V5.1.1 Implementation. This test leads to certification for Tivoli Certified Deployment Professional for IBM Tivoli Monitoring.
The scope of the certification tests your ability to demonstrate the following areas of expertise required for IBM Tivoli Monitoring V5.1.1:
� Prerequisite knowledge for IBM Tivoli Monitoring� Planning the implementation� Installation prerequisites � The installation process� Configuration of the IBM Tivoli Monitoring server� Problem determination� General operations � IBM Tivoli Monitoring Workbench
You can find the information that you need about these topics all in this IBM Redpaper. Plus, you have a chance to test your knowledge using the sample test questions at the back of the paper.
Back cover