Embed Size (px)
Citation preview
Fac
ulty
of S
cien
ce, E
ngin
eerin
g &
Tec
hnol
ogy
Optimising Hydropower Generation Through Fluid Dynamics Research
Dr Jessica Andrewartha*, Dr Jane Sargison, Xiao Lin LiSchool of Engineering, University of Tasmania, Australia
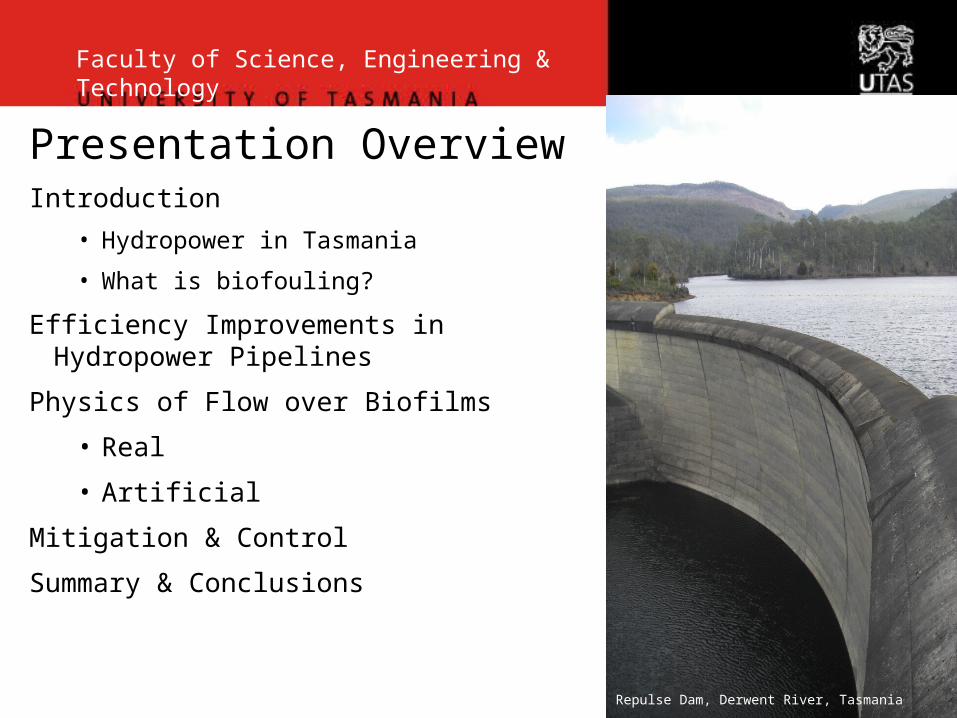
Presentation OverviewIntroduction
• Hydropower in Tasmania
• What is biofouling?
Efficiency Improvements in Hydropower Pipelines
Physics of Flow over Biofilms
• Real
• Artificial
Mitigation & Control
Summary & Conclusions
Repulse Dam, Derwent River, Tasmania
Faculty of Science, Engineering & Technology

Introduction
• Majority of electricity in Tasmania produced by 29 hydropower stations
• Potential for hydropower in Australia well exploited – now looking at efficiency improvements
• Hydropower stations require transport of water – sometimes over long distances (20 + km)
• Tunnels, canals, flumes, pipelines & penstocks – susceptible to biofouling
• UTAS / Hydro / ARC 10 year research collaboration on biofouling
Tarraleah Penstocks, Tasmania
Faculty of Science, Engineering & Technology

Introduction
Biofouling is the undesirable growth of biological matter at liquid – solid interfaces
Global problem – causes large drag penalties
3 categories:• Low-form gelatinous (slimes)• Filamentous• Hard deposits
Natural biofilms consist of one or more components
www.crestock.com/image/131228-Barnacle-Texture.aspx
Faculty of Science, Engineering & Technology
Efficiency Improvements in Hydropower Pipelines
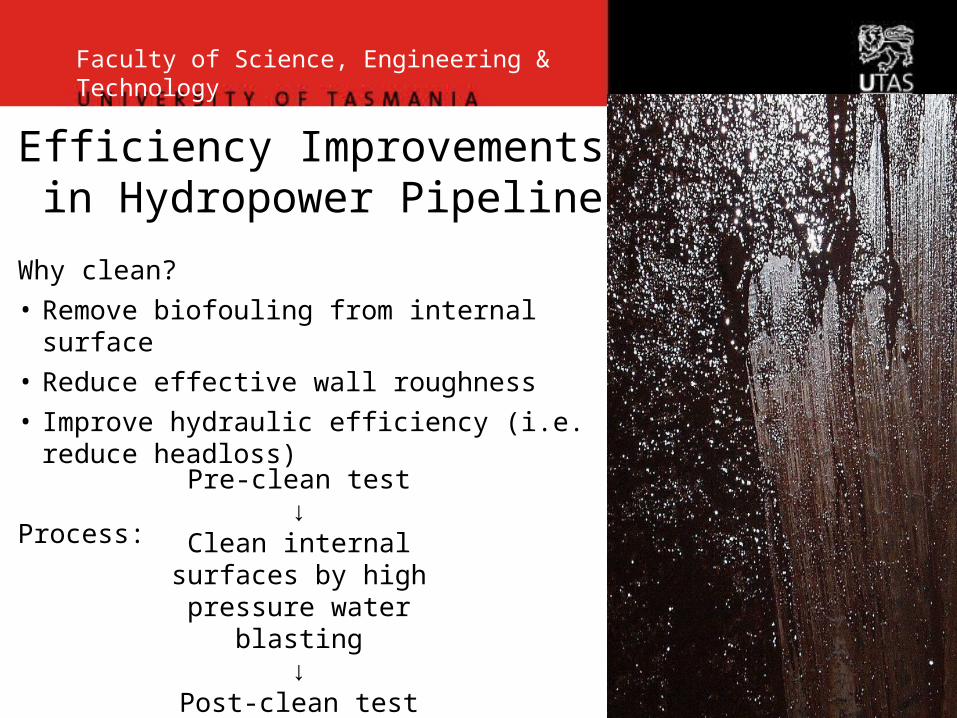
Why clean?• Remove biofouling from internal surface• Reduce effective wall roughness• Improve hydraulic efficiency (i.e. reduce headloss)
Process: Pre-clean test↓
Clean internal surfaces by high pressure water
blasting↓
Post-clean test
Faculty of Science, Engineering & Technology
Efficiency Improvements in Hydropower Pipelines
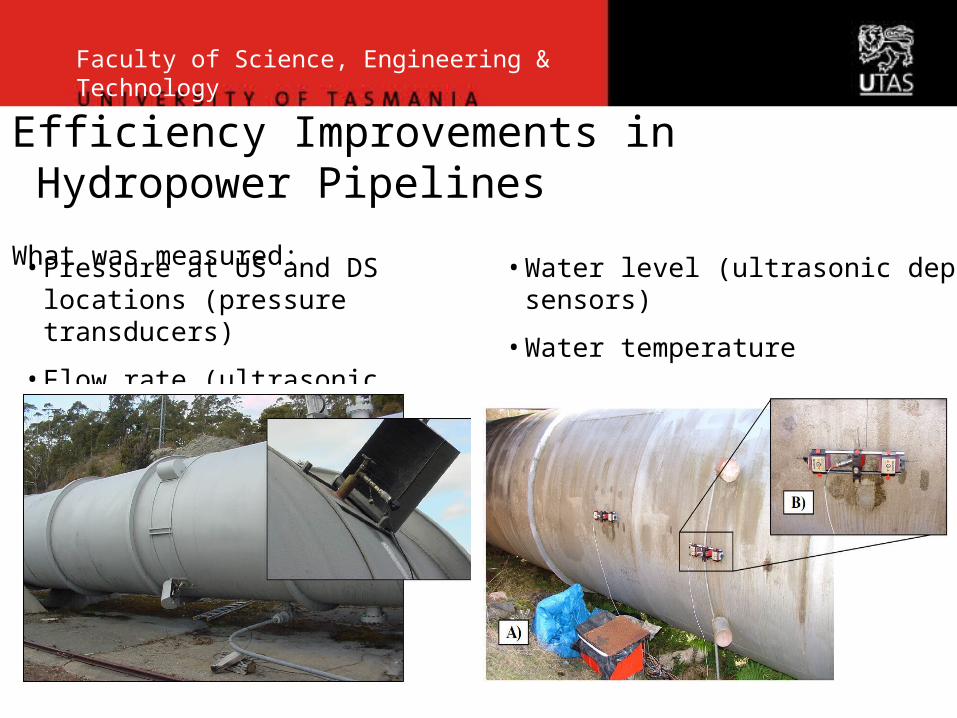
What was measured:
• Pressure at US and DS locations (pressure transducers)
• Flow rate (ultrasonic flowmeters)
• Water level (ultrasonic depth sensors)
• Water temperature
• Machine characteristics
Faculty of Science, Engineering & Technology
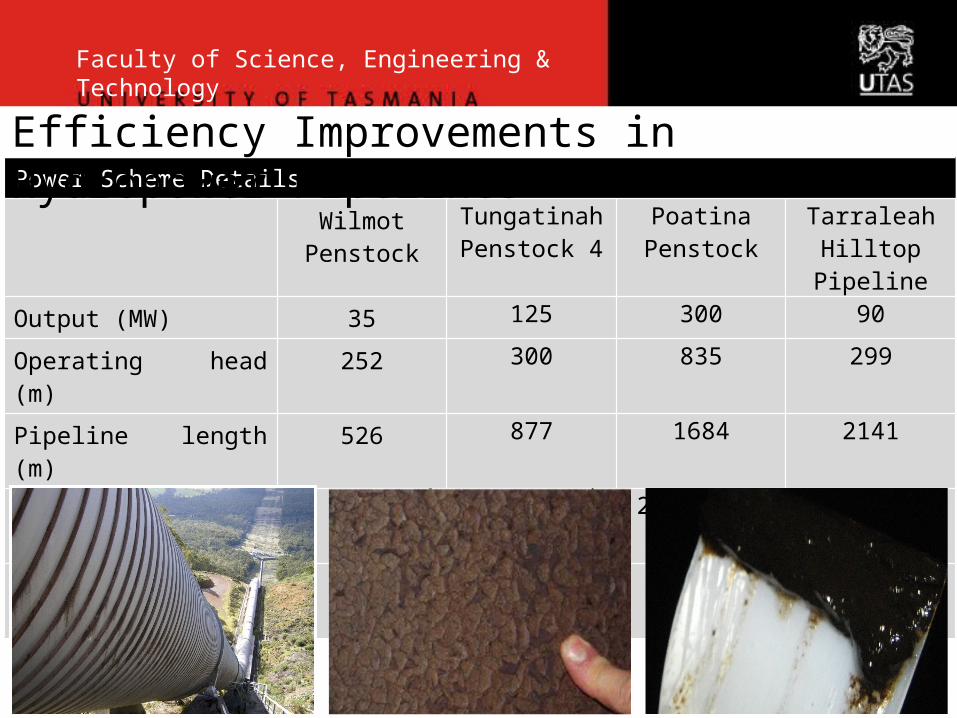
Power Scheme Details
Wilmot Penstock
Tungatinah Penstock 4
Poatina Penstock
Tarraleah Hilltop Pipeline
Output (MW) 35 125 300 90
Operating head (m) 252 300 835 299
Pipeline length (m) 526 877 1684 2141
Penstock diameter (m) 1.98 1.7 - 2.3 2.6 – 3.1 2.6
Improvement in Headloss (m)
1.0 0.8 - 2.0
Efficiency Improvements in Hydropower Pipelines
Faculty of Science, Engineering & Technology

• Biofilms increase headloss
• Gains in energy production can be made by removing biofouling
• Data plotted on a Moody diagram is not typical of engineering roughness
• Moody diagram extensively used in industry to predict friction losses
• More data over wider range of Reynolds numbers is needed
• New pipe rig at UTAS will be used to gather this data
• Rig in field to grow biofilms
• Rig in lab for detailed testing
Faculty of Science, Engineering & Technology
Efficiency Improvements in Hydropower Pipelines
Faculty of Science, Engineering & Technology
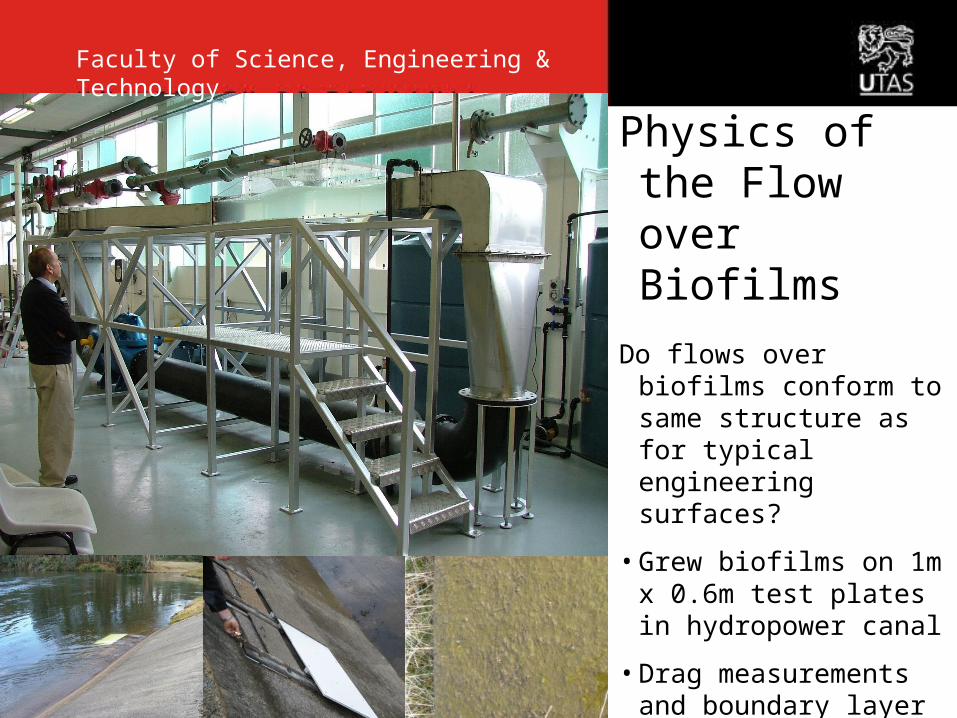
Physics of the Flow over Biofilms
Do flows over biofilms conform to same structure as for typical engineering surfaces?
• Grew biofilms on 1m x 0.6m test plates in hydropower canal
• Drag measurements and boundary layer profiles in water tunnel
• Characterised roughness using photogrammetry
Faculty of Science, Engineering & Technology
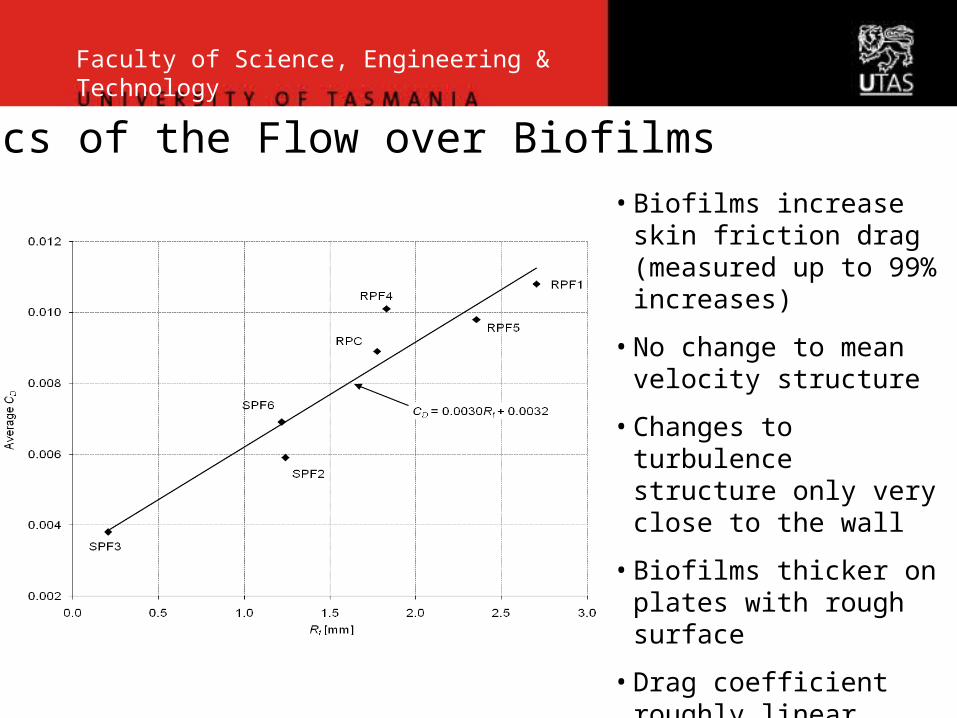
Physics of the Flow over Biofilms• Biofilms increase skin
friction drag (measured up to 99% increases)
• No change to mean velocity structure
• Changes to turbulence structure only very close to the wall
• Biofilms thicker on plates with rough surface
• Drag coefficient roughly linear function of max peak-to-valley height of biofilm

0.0 0.5 1.0 1.50.0
4.0
8.0
12.0
(y+e)/d
(U-u
)/u*
Flow over Artificial Biofilms• Skin friction increased by 23%
• No change to mean velocity structure
• Turbulence intensity increased by 50% in region y > 1 mm out to freestream
• Streamers change turbulence structure
• Working on capturing motion using high-speed cameras
• Find frequency of oscillation
Streamers: black Smooth: red
U = 1.0, 1.25, 1.75, 2.0 m/s
0.0 0.5 1.0 1.50.0
4.0
8.0
12.0
(y+e)/d
(%
)U
u2 '
Faculty of Science, Engineering & Technology
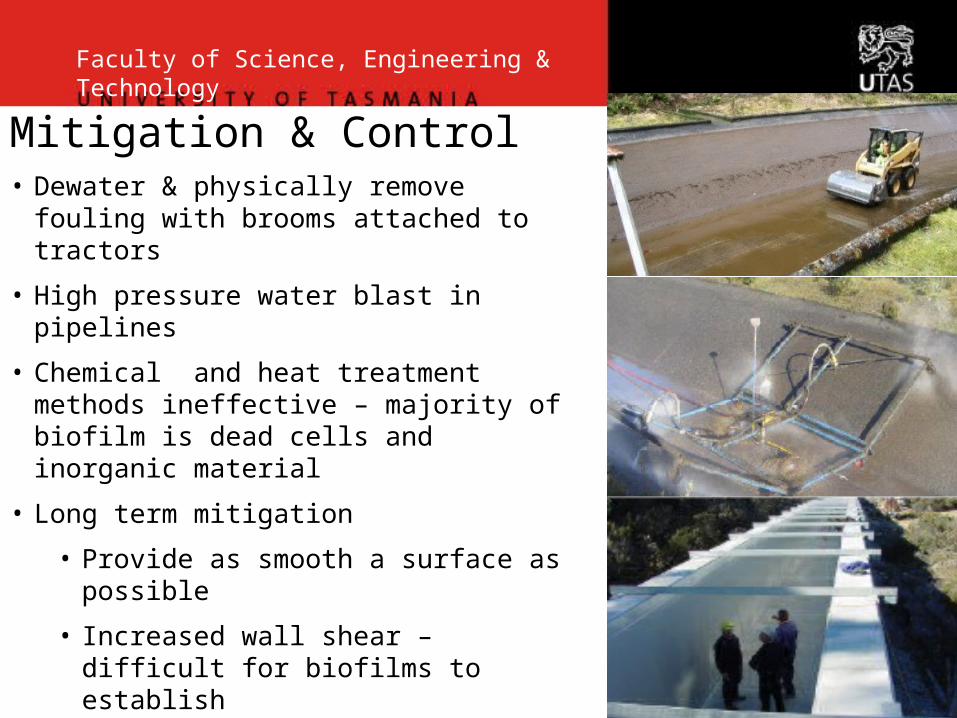
Mitigation & Control• Dewater & physically remove fouling with brooms
attached to tractors
• High pressure water blast in pipelines
• Chemical and heat treatment methods ineffective – majority of biofilm is dead cells and inorganic material
• Long term mitigation
• Provide as smooth a surface as possible
• Increased wall shear – difficult for biofilms to establish
• Trials of different surface coatings – some perform better than others
Faculty of Science, Engineering & Technology

Summary & Conclusions• Significant improvements to efficiency &
generating capacity can be made by removing biofilms
• Control of biofouling is a global problem, and not just in hydropower
• Current research – understanding wall flows with complex organic interacting surfaces, rather than typical engineering roughnesses
• Climate change policy will see greater investment in renewable energy technologies
Faculty of Science, Engineering & Technology

AcknowledgementsThis research was funded by:
• 3 Australian Research Council Linkage Grants
• Hydro Tasmania
• University of Tasmania New Appointees Research Grant
The authors also gratefully acknowledge:
A. Barton, K. Perkins, G. Walker, A. Henderson, J. Osborn, A. Leith, G. Hallegraeff, P. Brandner, workshop staff at UTAS, and the many staff at Hydro Tasmania involved in the project.
Faculty of Science, Engineering & Technology