Embed Size (px)
Citation preview
Soundsense: An IoT Application using Raspberry Pi and Amazon WebServices
(Peter) Donghyeok Shin, Cameron Sherr
University of District of Columbia: CSIT Department
CS 538 Physical Computing: Fall 2016
Abstract— Soundsense is a detection device which measuresvolume levels constantly by using Raspberry Pi and Amazonservices. And when it detects abnormal volume change, italerts the user about the event. Combined with a simplemicrophone connected through the GPIO ports, the device satstationary in a specific location and recorded the surroundingsound. Kalman Filter was used for smoothing extreme changesand through the Amazon IoT, the measure data could besent to DynamoDB. Along with data recording, EC2 instancewas running an analysis application which constantly readDynamoDB items to look for sudden change. All data fromDynamoDB was graphed automatically through a real-timecomprehensive interface, Plot.ly. Using moving average basedevaluation, abnormal volume change could be detected, andalerted the responsible user through Amazon SES. For futureimprovement, different statistical analysis can be used. Andneural-network based approach can be considered to minimizethe effort to find the best Kalman Filter configuration. (Shin)
Index Terms— Internet of Things, Raspberry Pi, Kalman Fil-ter, Moving Average, Sound detection, DynamoDB, StreamingData
I. INTRODUCTION
This report is about our experience with Raspberry Pibased IoT device manufacturing and using it for measuringsound volume and reacting to the situation when the volumechange happened in extreme way.
Using the title Soundsense, our application utilized Rasp-berry Pi, Sound Sensor, and several services from Amazon:Internet of Things [1], DynamoDB [2], EC2 [3], SES [4].Additionally, for visualizing real-time charting for monitor-ing purpose, Plot.ly graphing service [5] was used. Eventhough, we used only one device, the expected scope of usagewas imagined to be for massive deployment up to about1,000 devices running simultaneously. Also, monitoring in-stances were imagined to be many, requiring high-velocitymassive writing and reading onto database.
Like many cases of measuring values, noisy data shouldbe considered, and had to be smoothed by using KalmanFilter [6] in conventional way. Of course, it required manytrials to find the optimal R and Q values in this project aswell.
The program for measuring sound, transmitting data toAmazon IoT and DynamoDB was written in Python, andwas running in Soundsense Raspberry Pi computer. Theother program for reading collected data in DynamoDB for
analysis, and send an email if an anomaly was detected, wasalso written in Python and was running in EC2 instance.
As the simplest method, Simple Moving Average [7] basedevaluation was used to determine if the newly collectedsound data was an extreme change that should alert theresponsible administrator-like user. In our own experiment,when the detection happened, we could confirm that alertingemail was successfully sent.
Moving average approach was useful to distinguish be-tween normal ambient sound and unexpected sudden risingof noise. However, more sophisticated statistical evaluationapproaches could be used to improve the project, along withadvanced neural-network based way to find optimal R andQ values without excessive trials. (Shin, Sherr)
II. RELATED WORK
1) Glass Break Detectors: These systems work based ona system pre-programmed to listen to a certain frequencyof sound (one matching the brand of glass being shatteredthat they are in proximity to). The system featured in thisprocess works on similar principal, constantly listening foran anomaly in sound and immediately reporting on it themoment it is detected. Our system might improve uponthis by providing an opportunity to expand the alarm, po-tentially allowing it to be more than a one-trick pony. Anexample being tuning the system to detect multiple sound-based anomalies. Shattered glass would of course remaina feature but initially we might tune it to detect volumesfrequencies such as the car being damaged or rammed into(ex. crunched/distorted metal), or someone pounding againstglass (thus providing the option for the alarm to sound beforethe glass is actually shattered) [8].
2) Access-Based Systems: Model followed by many homesecurity systems. Motion-based Sensors are placed at variousplaces at various entryways throughout the home, whenmotion is detected at an entryway a signal is sent to thesecurity system to check whether or not it is valid (based onwhether or not it is currently armed). Traditionally, when asensor is set off when the system is set to armed’ it providesa brief grace period for someone to set it to unarmed’ (eithervia a password input, or some other means input via an app,or key fob). Including the sound-system might add a bit morefunctionality to these existing systems. The addition a sound-detector might provide home owners with an additional
layer of relief while they are away from home: monitoringwhether or not rowdy children might be throwing a house-party, if house-sitters are actually doing their duties, and(as stated earlier) providing an additional layer of securityto detect potential intruders [9]. (Durant, Osamor: Initially,it was understood that this project was joint project whichcould share same contents. While this section was written byother course’s members, their intention was to provide somematerial that is more relevant to this course’s report.)
III. EXPERIMENT
The volume data was collected using a Raspberry Piand a volume sensor module, connected through the GPIOinterface. A Python program was running to measure soundand apply Kalman Filter [6] and transmit the both volumedata using Amazon IoT MQTT protocol. For record keep-ing, the database created on Amazon DynamoDB, receivedand wrote formatted items from Amazon IoT. Residing onAmazon EC2, an analyzer application was running to readitems from DynamoDB for real-time streaming chart, usingPlot.ly service [5]. While reading and visualizing, recentrange of data will be used to evaluate if the latest measure-ment is unexpected and should be considered abnormal vol-ume. When evaluation detected an unusual spike of volumechange, it uses Amazon SES to send email notification tothe administrator-kind personnel (Figure 1). (Shin)
A. Imagined Scale of Application
This project imagined the case of using massive number ofSoundsense devices. We considered about more than 1,000devices, which send messages at the interval about 0.05second at the slowest. Since the devices were meant tooperate continuously throughout hours and days, we expectedto receive 1,200 * 1,000 = 1,200,000 messages from allSoundsense devices per second, at least.
Also, on the other hand, analysis application was imaginedto become multiple instances, to reflect the case of accommo-dating multiple users having administrative-kind roles. Thisanalysis application was running at the interval about 1.0second at the slowest to visualize real-time streaming chart,which was to be monitored. While doing so, evaluation fordetecting unusual volume spike was done as well. (Shin)
B. Programming
1) Outlier(Anomaly) Detection: The type of our collectedvolume measurements are time-series data. Using KalmanFiltering, collected data could be graphed like EXCERPTED:Figure 2. And once we collected our own data, actual volumegraph was like Figure 3.
What we were looking for as an outlier or an anomaly,was suddenly appearing peaks like t2 in the example EX-CERPTED: Figure 2. And similar spike could also be foundat the right side of Figure 3.
As the simplest method, we thought moving averagebased evaluation could be sufficient [7]. Of course, thismoving average should be defined constantly while running
Soundsense device being stationed in the operation envi-ronment. At about every analysis interval, about N hourworth of volume data could be traced back to be collected.From the collection, maximum, minimum, average, median,deviation can be statistically inferred. Using the inference,interquartile distribution [10] can be graphed like followingEXCERPTED: Figure 4.
Using the minimum and the maximum of the interquartilerange of distribution to be thresholds, an anomaly can bedetected when the volume measurement is outside of therange. Such inference can be done regularly to build seriesof boxplots [11] to be used for evaluating next volumemeasurements. For example, at each interval, when newvolume is being measured, current boxplot constructed fromprevious N amount of data can be used to evaluate if thisnew volume measurement is an outlier or not. By definingthat volume measurement being inside the interquartile rangeof boxplot of N amount of data to be Normal, and Anomalywhen its being outside the interquartile range, normal andanomaly can be distinguished. Since calculating one dimen-sional volume array for average, minimum, maximum, andmedian can be done quickly, instead of using disconnecteddataset, we could use sliding dataset like EXCERPTED:Figure 5 at each measuring interval. (Shin)
2) Using Kalman Filtering: In our project, Kalman Fil-tering [6] was used to smoothing noisy measurements tocorrectly support identifying at what time frame, outliervolume value could be actually found.
Initially in our project, R(estimated measurement variance)and Q(process variance) had values suggested by Greg Welchand Gary Bishop [6]. In the paper, about how to assign initialvalues to R and Q, the paper recommended R = (0.1)2 = 0.01because it being the true measurement error variance. It couldprovide the best performance for balancing responsivenessand estimate variance. And also the paper recommended Q= 1e 5, because it could provide more flexibility in tuningwhile looking for best R and Q constants.
Throughout our research, R and Q was calibrated by com-paring graphs for both volume actual and volume filtered.This empirical comparison was suggested by Scott Lobdell[12]. This tutorial was chosen due to its relevancy to sensormeasuring, which was very similar to what our projectwas about. Also, the tutorial provided a quality snippet forimplementing Kalman Filter in Python. (Shin)
# R: estimate of measurement variance,change to see effect
estimated_measurement_variance = 0.1 **2
# Q: process varianceprocess_variance = 1e-5
# Initializationvolume_filtered = 0.0 # X:

Soundsense IoT Application
Raspberry PiGPIO Volume
Module
Amazon IoT SDK Amazon IoT
ServiceMQTT
Amazon Dynamo DB
write item
Soundsense Analyzer Application
Amazon EC2
Amazon DynamoDBSDK
read item
Analyzing for Volume Spike
Plot.ly SDK
(Actual & Filtered)Volume Data Line Chart
streaming
Amazon SES Amazon SESSDKenque notification
send email
Fig. 1. Describing main components and actions for Soundsense IoT Application and Analysis
Fig. 2. EXCERPTED: Sample Contextual Outlier [17]
# P: estimation error covariancecurrent_error_estimate = 1.0
volume_actual = Measured.FromSoundSendor{}
while (volume_actual >= 0.0)# While measurement is being continued
at each iteration
# Reset with previous valuesprevious_volume = volume_filtered #
X‘previous_error_estimate =
current_error_estimate +process_variance # P‘
# Apply filteringkalman_gain =
previous_error_estimate / (previous_error_estimate +estimated_measurement_variance)
# Both variables will have newvalues
volume_filtered = previous_volume +kalman_gain * (volume_actual -previous_volume)
current_error_estimate = (1 -kalman_gain) *previous_error_estimate
# USE: volume_filtered
C. Equipment
Our goal was to create a small, easily transportable devicethat can collect sound data from any of the surroundingenvironment. Figure 6 below was our own manufacturedresult, following the tutorial in Sunfounder Website [13].GPIO connectable Sound Sensor(EXCERPTED: Figure 7),actually gets measurement in analog data. Because of thisaddtional PCF8591 Analog-to-Digital Converter had to beused, according to the Sunfounder tutorial [13]. The devicewas (virtually) deployed to a location with identifier andwas running constantly to measure volume data. While still
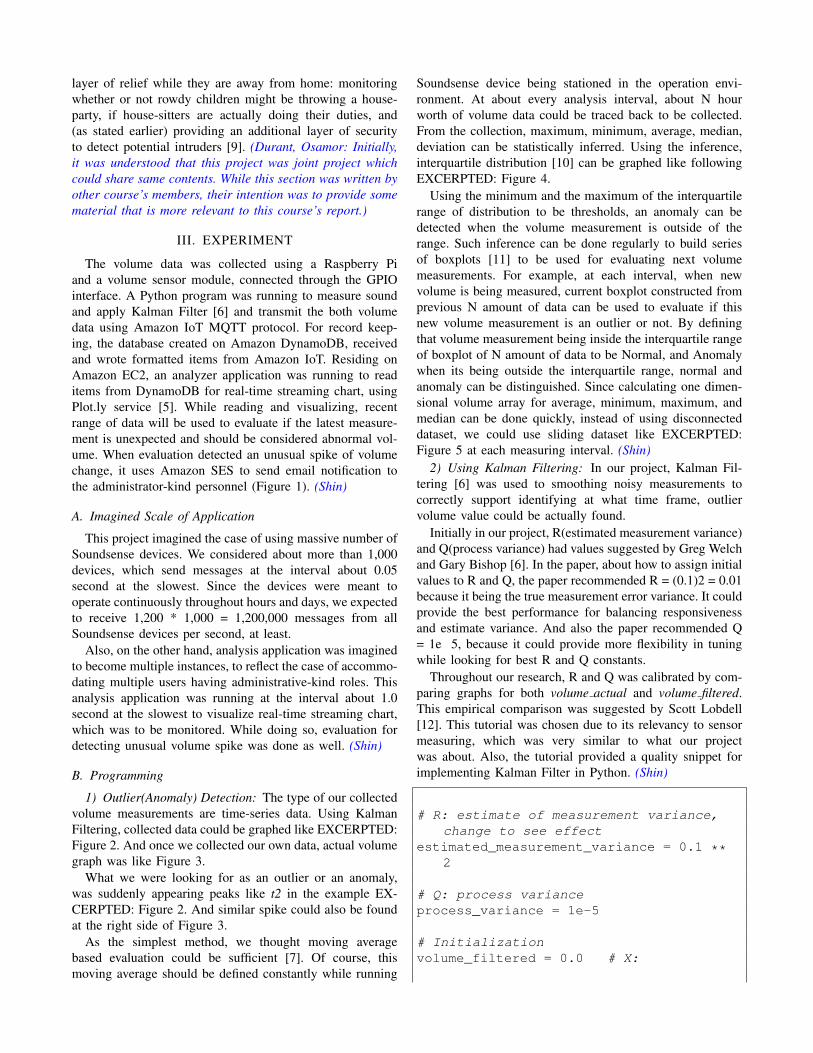
Fig. 3. Case of detecting a sudden spike, even while there were some level of sound already
being connected through an internet connection, the devicecould transmit high velocity data tuples that was consistingof identifier, timestamp, actual volume, and (Kalman)filteredvolume, unto Amazon IoT (Figure 1). (Shin, Sherr)
D. Result
Once data had been collected into DynamoDB, the real-time charting for volume data could be generated likeFigure 3, using a separate analysis application reading thedatabase constantly.
When the level of sound was high, the value was given lowinteger, which could be as low as 40 to 50. The value being inbetween 140 to 150 was considered normal sound situation.Adhering to the purpose of Soundsense device, the alertingdidn’t happen until extreme change of volume was detected.From left to right in Figure 3, there were some spikes ofvalues going down to about 80 to 100. However, this levelcould be considered normal, since the measurements weretaken for normal human talking, like giving presentation forthis project. Because of using moving average methods, ifvolume was measured to be at constant level consistently,situation was interpreted to be normal.
For example, if Soundsense was deployed to a restaurantsetting, it should not react to every conversation of guest,nor at music being played. Instead of comparing it withtotal silence, as long as sound level could remain at level,Soundsense could remain unresponsive. But, if there werescreaming, fire, or explosion, noticeable change of sound vol-ume is inevitable. And it will be measured to show extremechange, like the way depicted in right-end of Figure 3. Thissuddenly appearing extreme change was difficult to ignore,
as moving average based evaluation definitely recognize thatnew measurement was surely outside of it’s current average,minimum thresholds of volume values.
As detection happened, the responsible administrator-kinduser received an email sent automatically for alerting, withthe information containing the device identifier and the timeof detection occurred.
IV. FUTURE WORKS
A. Other Statistical Approaches
While Simple Moving Average was used in this project,there were other statistical methods that could be tested inthe category of Moving Average [7].
Simple Moving Average may have some drawback, suchas sudden fluctuation of average value if the small samplesof measurements are too extreme, affecting the resulting av-erage. Even though our project expected to find an anomalywhich is far from normal average, we tested with differentshifting windows to minimize occurrence of extreme changesin calculated average.
Cumulative Moving Average could be useful for minimiz-ing such sudden fluctuation, since it could use previously cal-culated average with the new measurement. Also, this couldminimize data scanning once first average was calculated.
Since we expected there may be various threshold to beused for finding an anomaly during a day, Weighted MovingAverage approach could be useful. For example, insteadof using same criteria, different weights during differenttimes of the day could be used to determine if the newmeasurement was outside the normal range. (Shin)

Fig. 4. EXCERPTED: Sample Interquartile [10]
Fig. 5. EXCERPTED: Series of Boxplots [11]
B. Neural Network as replacement for Kalman Filter
Kalman Filter has been used for smoothing noise mea-surements for many different projects. However, it’s alwaysdifficult to find optimal R and Q values early. Likewise, thisproject had to deal with many trials to obtain good R andQ value for charting with correct smoothness. There wereseveral attempts to improve Kalman Filter or replace it, byusing neural network [14] [15] [16]. The very essential butmost difficult process for finding optimal R and Q valuescould be done by using neural network approach, minimizingrepetitive work. (Shin)
V. CONCLUSION
In our experiment under controlled environment, ourSoundsense device did detect unusual change of volume.Moreover, such detection was done while distinguishing thenormal level of ambient sound, which should be intentionallyignored. For the purpose of smoothing out noisy measure-
Fig. 6. Soundsense Rapsberry Pi device using Sound Sensor
Fig. 7. EXCERPTED: Sound Sensor [13]
ment, Kalman Filter was used in the conventional way.However, finding R and Q values were not a mere task, andmotivated us to look for better ways. Testing Amazon’s ser-vices were not the topic of this project, however, standardizedinfrastructure was highly useful for saving precious time forthis project.
REFERENCES
[1] AWS IoT Platform - Amazon Web Services, Amazon Web Services,Inc. [Online]. Available: https://aws.amazon.com/iot-platform/. [Ac-cessed: 15-Dec-2016].
[2] Amazon DynamoDB NoSQL Cloud Database Ser-vice, Amazon Web Services, Inc. [Online]. Available:https://aws.amazon.com/dynamodb/. [Accessed: 15-Dec-2016].
[3] Elastic Compute Cloud (EC2) Cloud Server & Hosting AWS, AmazonWeb Services, Inc. [Online]. Available: https://aws.amazon.com/ec2/.[Accessed: 15-Dec-2016].
[4] AWS — Amazon Simple Email Service (SES) - Cloud BasedEmail Services, Amazon Web Services, Inc. [Online]. Available:https://aws.amazon.com/ses/. [Accessed: 15-Dec-2016].
[5] plotly, Python Graphing Library, Plotly. [Online]. Available:https://plot.ly/python/. [Accessed: 15-Dec-2016].
[6] Welch, G., & Bishop, G. (2006). An Introduction to the Kalman Filter.In Practice, 7(1), 116. https://doi.org/10.1.1.117.6808
[7] Moving average, Wikipedia. [Online]. Available:https://en.wikipedia.org/wiki/Moving average. [Accessed: 15-Dec-2016].
[8] How Motion Sensors Work with a Security System,theHomeSecurityAdvisercom, May-2016. [Online]. Available:http://thehomesecurityadviser.com/how-motion-sensors-work-with-a-security-system/. [Accessed: 13-Dec-2016].
[9] C. Harrelson, Audio Verification Equals More Ap-prehensions, Intrusion RSS, 2013. [Online]. Available:http://www.securitysales.com/article/audio-verification-equals-more-apprehensions. [Accessed: 13-Dec-2016].
[10] Interquartile range, Wikipedia. [Online]. Available:https://en.wikipedia.org/wiki/Interquartile range. [Accessed: 15-Dec-2016].
[11] Time-series boxplot in pandas, python - Time-seriesboxplot in pandas - Stack Overflow. [Online]. Available:http://stackoverflow.com/questions/26507404/time-series-boxplot-in-pandas. [Accessed: 15-Dec-2016].
[12] Kalman Filtering in Python for Reading Sensor Input -Scott Lobdell, Scott Lobdell, 2014. [Online]. Available:http://scottlobdell.me/2014/08/kalman-filtering-python-reading-sensor-input/. [Accessed: 15-Dec-2016].
[13] Lesson 19 Sound Sensor, Lesson 19 Sound Sensor. [Online].Available: https://www.sunfounder.com/learn/sensor-kit-v2-0-for-raspberry-pi-b-plus/lesson-19-sound-sensor-sensor-kit-v2-0-for-b-plus.html. [Accessed: 13-Dec-2016].
[14] Belhajem, I., Maissa, Y. Ben, & Tamtaoui, A. (2016). A hybrid lowcost approach using Extended Kalman Filter and Neural Networks forreal time positioning. https://doi.org/10.1109/IT4OD.2016.7479298
[15] Deb, A. K. (2016). Estimation of States of a Nonlinear Plant usingDynamic Neural Network and Kalman Filter, 497502.
[16] Xu, L., & Xu, H. Y. (2009). Performance evaluation of innova-tive enterprises based on Neural network-Kalman filter model. 2009International Conference on Management Science and Engineer-
ing - 16th Annual Conference Proceedings, ICMSE 2009, 450455.https://doi.org/10.1109/ICMSE.2009.5317386
[17] Outlier, Wikipedia. [Online]. Available:https://en.wikipedia.org/wiki/Outlier. [Accessed: 15-Dec-2016].