Embed Size (px)
Citation preview

Issue Date:
Revision:
IPv6 in Asia:
Laggards and Trends
11 July 2016
1
July 2016
Guangliang Pan

IPv6 allocations How many allocations have been made by each RIR by year?
2
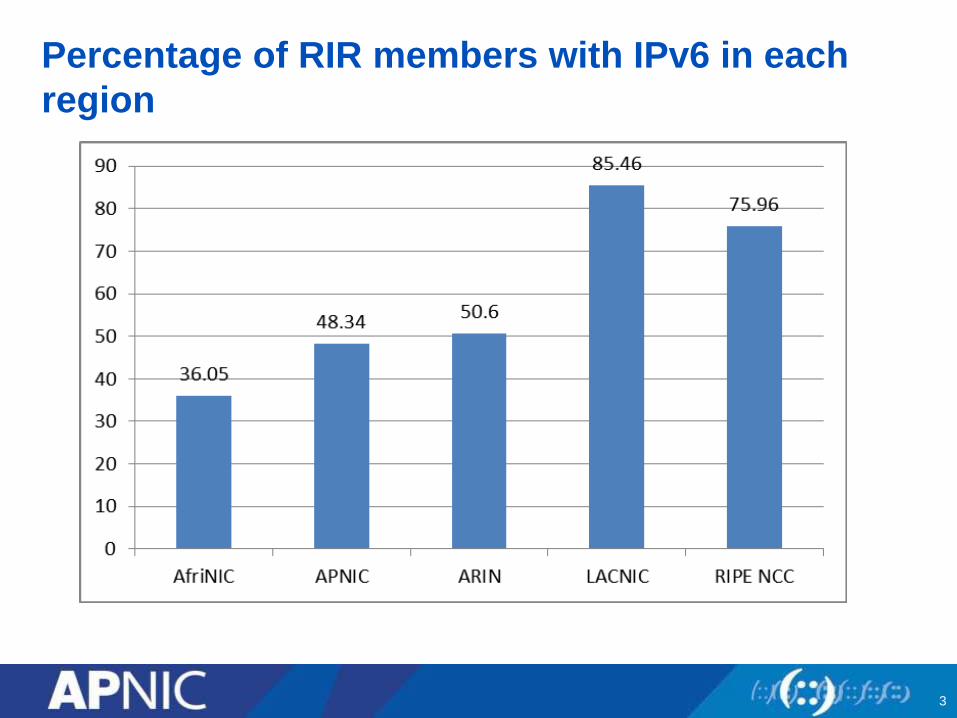
Percentage of RIR members with IPv6 in each
region
3

Global IPv6 active BGP entries
4
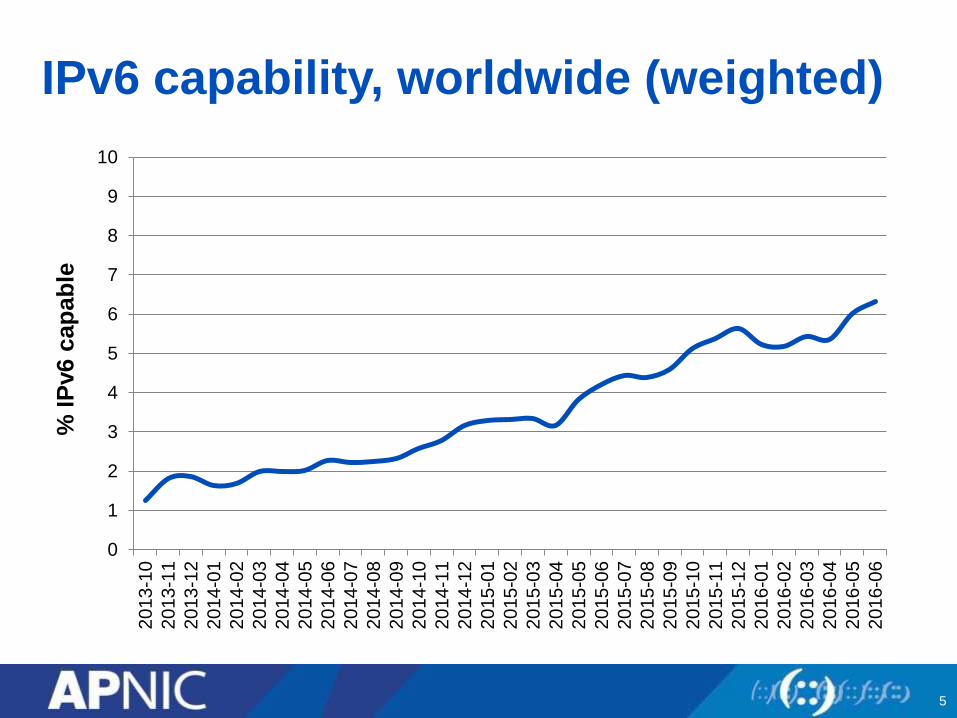
IPv6 capability, worldwide (weighted)
0
1
2
3
4
5
6
7
8
9
102
01
3-1
0
20
13
-11
20
13
-12
20
14
-01
2014-0
2
20
14
-03
20
14
-04
20
14
-05
20
14
-06
20
14
-07
20
14
-08
20
14
-09
20
14
-10
20
14
-11
20
14
-12
20
15
-01
20
15
-02
20
15
-03
20
15
-04
20
15
-05
20
15
-06
20
15
-07
2015-0
8
20
15
-09
20
15
-10
20
15
-11
20
15
-12
2016-0
1
20
16
-02
20
16
-03
20
16
-04
20
16
-05
20
16
-06
% I
Pv6 c
ap
ab
le
5

6.5%? Google says 10+?
• APNIC applies a weighting function to get the total
measurements:
– Based on ITU internet population data; to adjust for sample size
anomalies worldwide
• You can consider this worldwide figure as a low-side count
– and the Google (and other) measures as a high-side count
• It’s probably somewhere in between the two
6

IPv6 capability, worldwide (weighted)
0
1
2
3
4
5
6
7
8
9
10
2013-10
2013-12
2014-02
2014-04
2014-06
2014-08
2014-10
2014-12
2015-02
2015-04
2015-06
2015-08
2015-10
2015-12
2016-02
2016-04
2016-06
% IP
v6 c
apab
le
7

CC IPv6 % CC IPv6 % CC IPv6 % CC IPv6 % CC IPv6 % CC IPv6 %
BE 53.35% CH 29.49% US 29.02% DE 28.44% PT 28.33% GR 26.77%
EE 19.34% PE 18.97% LU 17.63% JP 16.79% FI 16.76% MY 13.81%
EU 12.94% FR 12.54% BR 10.86% GB 10.78% CA 10.35% NO 9.65%
HT 9.50% NL 8.27% SG 8.23% RO 8.13% AT 7.26% CZ 6.21%
CC IPv6 % CC IPv6 % CC IPv6 % CC IPv6 % CC IPv6 % CC IPv6%
IE 5.36% AU 4.82% HU 4.56% BO 4.35% SE 4.28% AX 4.05%
SA 3.97% BA 3.71% NZ 3.03% PL 2.86% TR 2.30% HK 1.53%
SI 1.51% LK 1.41% MT 1.34% RU 1.33% IN 1.30% KR 1.20%
TT 0.96% BT 0.86% CW 0.77% BG 0.68% CN 0.51% VN 0.50%
IT 0.49% UA 0.43% MD 0.40% DK 0.39% IL 0.36% TH 0.33%
SD 0.27% BQ 0.23% SK 0.21% LV 0.21% ZA 0.21% LT 0.21%
BW 0.17% GF 0.16% MK 0.12% TW 0.12% CL 0.12% ES 0.11%
IS 0.11% ID 0.10% TZ 0.10% GT 0.10% PA 0.10%
8
Above and below the line

IPv6 capable rate by economy
9

Emerging problem in the AP region
• Few economies in the AP region are above world-grade
IPv6 capability (green)
• Of the economies below the line, many are stagnant (red);
some are moving upward (yellow)
• Hard to quantify what quality determines ranking
10
It’s not just about
economic size;
diversity of the ISP
Is it about capital
investment, or
other reasons?
Two kinds of Internet?
• IPv4 and IPv6 can’t directly interoperate as protocols
– You can tunnel, and you can gateway but you can’t send IP packets
directly from
• 2000::/3 to 10.0.0.0/8
– The decision to proceed with IPv6 deployment implies dual-stack
operations; short or long term
– The decision to remain in IPv4 implies increasing use of CGN and
other techniques to maximize address reuse
11
There is no avoidance of extra
technology costs to continue to grow
the Internet

It looks like it on a macro scale
• There are signs that at a high-level view, the economies
investing in IPv6 are now diverging from the ones who are
staying with IPv4
– It’s not just about size, or economic capacity
• Let’s review some of the players in each ‘camp’
– Some economies with signs of significant IPv6 deployment
– Some economies with little or no sign of significant IPv6 deployment
12

IPv6 capability, worldwide (weighted)
0
1
2
3
4
5
6
7
8
9
102
01
3-1
0
20
13
-11
20
13
-12
20
14
-01
20
14
-02
20
14
-03
20
14
-04
2014-0
5
20
14
-06
20
14
-07
20
14
-08
20
14
-09
20
14
-10
20
14
-11
20
14
-12
20
15
-01
20
15
-02
20
15
-03
20
15
-04
20
15
-05
20
15
-06
20
15
-07
20
15
-08
20
15
-09
20
15
-10
20
15
-11
20
15
-12
20
16
-01
20
16
-02
20
16
-03
2016-0
4
20
16
-05
20
16
-06
% I
Pv6 c
ap
ab
le
13
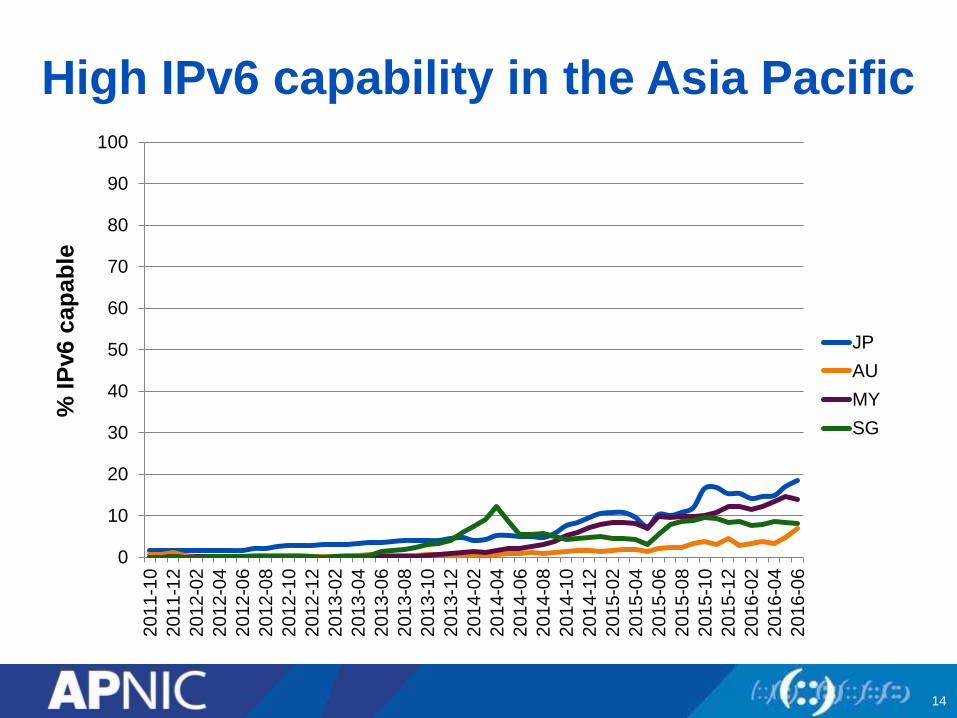
High IPv6 capability in the Asia Pacific
0
10
20
30
40
50
60
70
80
90
1002
01
1-1
0
20
11
-12
20
12
-02
20
12
-04
20
12
-06
20
12
-08
20
12
-10
20
12
-12
20
13
-02
20
13
-04
2013-0
6
20
13
-08
20
13
-10
20
13
-12
20
14
-02
20
14
-04
20
14
-06
2014-0
8
20
14
-10
20
14
-12
20
15
-02
20
15
-04
20
15
-06
20
15
-08
20
15
-10
20
15
-12
20
16
-02
20
16
-04
20
16
-06
% I
Pv6 c
ap
ab
le
JP
AU
MY
SG
14

SK Telecom (Korea)
0
10
20
30
40
50
60
70
80
90
1002
01
1-1
0
20
11
-12
20
12
-02
20
12
-04
20
12
-06
20
12
-08
20
12
-10
20
12
-12
20
13
-02
20
13
-04
20
13
-06
20
13
-08
20
13
-10
20
13
-12
20
14
-02
20
14
-04
20
14
-06
20
14
-08
2014-1
0
20
14
-12
20
15
-02
20
15
-04
20
15
-06
2015-0
8
20
15
-10
20
15
-12
20
16
-02
20
16
-04
2016-0
6
% I
Pv6 c
ap
ab
le
15

TMNET (Malaysia)
0
10
20
30
40
50
60
70
80
90
1002011-1
0
20
11
-12
20
12
-02
20
12
-04
20
12
-06
20
12
-08
20
12
-10
20
12
-12
20
13
-02
20
13
-04
20
13
-06
20
13
-08
20
13
-10
20
13
-12
20
14
-02
20
14
-04
20
14
-06
20
14
-08
20
14
-10
2014-1
2
20
15
-02
20
15
-04
20
15
-06
20
15
-08
20
15
-10
20
15
-12
20
16
-02
20
16
-04
20
16
-06
% I
Pv6 c
ap
ab
le
16
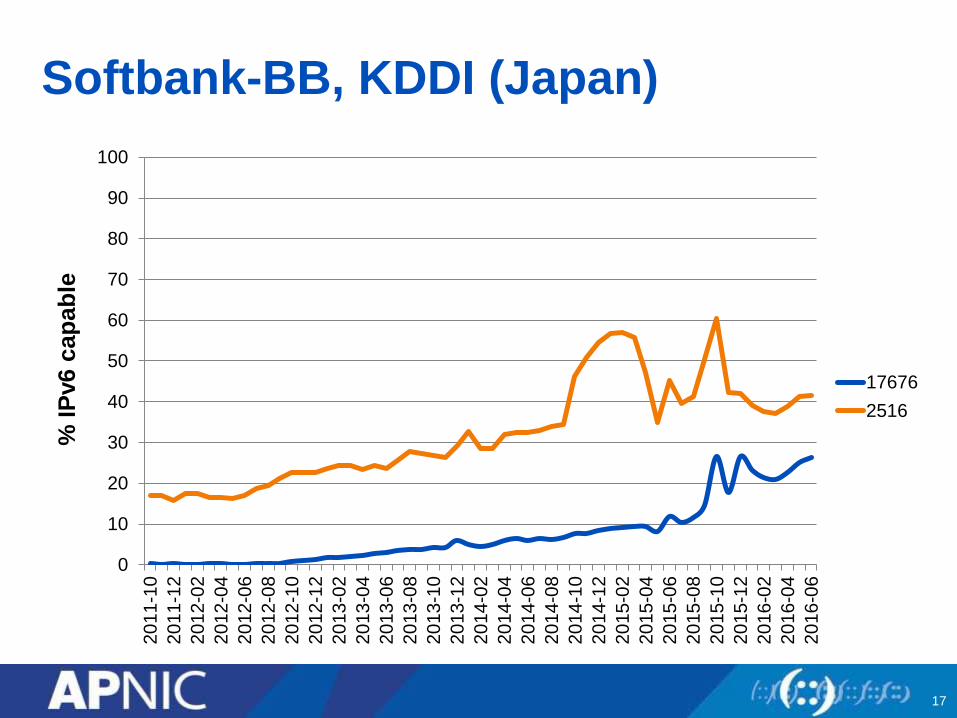
Softbank-BB, KDDI (Japan)
0
10
20
30
40
50
60
70
80
90
1002
01
1-1
0
20
11
-12
20
12
-02
20
12
-04
20
12
-06
20
12
-08
20
12
-10
20
12
-12
20
13
-02
20
13
-04
20
13
-06
20
13
-08
20
13
-10
20
13
-12
20
14
-02
20
14
-04
20
14
-06
20
14
-08
20
14
-10
20
14
-12
20
15
-02
20
15
-04
20
15
-06
20
15
-08
20
15
-10
20
15
-12
20
16
-02
20
16
-04
20
16
-06
% I
Pv6 c
ap
ab
le
17676
2516
17

StarHub, StarHub CableVision (Singapore)
0
10
20
30
40
50
60
70
80
90
1002
01
1-1
0
20
11
-12
20
12
-02
20
12
-04
20
12
-06
20
12
-08
20
12
-10
20
12
-12
20
13
-02
20
13
-04
20
13
-06
20
13
-08
20
13
-10
20
13
-12
20
14
-02
20
14
-04
20
14
-06
20
14
-08
20
14
-10
20
14
-12
20
15
-02
20
15
-04
20
15
-06
20
15
-08
20
15
-10
20
15
-12
20
16
-02
20
16
-04
20
16
-06
% I
Pv6 c
ap
ab
le
55430
10091
18

Telstra, Internode, Australia
0
10
20
30
40
50
60
70
80
90
1002
01
1-1
0
20
11
-12
20
12
-02
20
12
-04
20
12
-06
20
12
-08
20
12
-10
20
12
-12
20
13
-02
20
13
-04
20
13
-06
20
13
-08
20
13
-10
20
13
-12
20
14
-02
20
14
-04
20
14
-06
20
14
-08
20
14
-10
20
14
-12
20
15
-02
20
15
-04
20
15
-06
20
15
-08
20
15
-10
20
15
-12
20
16
-02
20
16
-04
20
16
-06
% I
Pv6 c
ap
ab
le
1221
4739
19

High IPv6 capability, selected economies
worldwide
0
10
20
30
40
50
60
70
80
90
1002
01
1-1
0
20
11
-12
20
12
-02
20
12
-04
20
12
-06
20
12
-08
20
12
-10
20
12
-12
20
13
-02
20
13
-04
20
13
-06
20
13
-08
20
13
-10
20
13
-12
20
14
-02
20
14
-04
20
14
-06
20
14
-08
20
14
-10
20
14
-12
20
15
-02
20
15
-04
20
15
-06
20
15
-08
20
15
-10
20
15
-12
20
16
-02
20
16
-04
20
16
-06
% I
Pv6 c
ap
ab
le
US
GB
DE
BE
EC
BR
20

Top 10 by sample, USASN AS name IPv6
capable
IPv6
preferred
#
Samples
AS7922 Comcast Cable Communications,
Inc.
61.75% 57.28% 14304843
AS7018 ATT-INTERNET4 - ATT Services,
Inc.
80.57% 73.20% 8526953
AS8075 Microsoft Corporation 0.00% 0.00% 5325116
AS701 Verizon Business 0.14% 0.01% 4728691
AS20115 Charter Communications 0.10% 0.02% 3463344
AS22773 Cox Communications Inc. 17.46% 16.15% 3164061
AS22394 Verizon Wireless 89.70% 80.89% 2621733
AS209 Qwest Communications Company 0.17% 0.10% 2432793
AS20057 ATT Mobility 9.50% 9.32% 2410034
AS10796 Time Warner Cable Internet 23.30% 21.79% 1999827
21

Top 10 by sample, BE
ASN AS name IPv6
capable
IPv6
preferred
#
Samples
AS5432 BELGACOM-SKYNET-AS
Proximus NV
44.06% 42.09% 958021
AS6848 TELENET-AS Telenet N.V. 71.09% 67.94% 879004
AS12392 ASBRUTELE Brutele SC 72.96% 70.51% 237980
AS47377 MES Mobistar SA 0.20% 0.05% 56730
AS21502 Numericable S.A. 0.01% 0.01% 48287
AS2611 BELNET BELNET 13.39% 12.44% 25361
AS44944 BASE-AS BASE Company NVSA 0.45% 0.16% 22518
AS29587 SCHEDOM-AS schedom vof 0.00% 0.00% 9654
AS41756 Orascom Telecom Algeria Spa 0.00% 0.00% 8245
AS51964 ORANGE-BUSINESS-
SERVICES-IPSN
0.00% 0.00% 7811
22
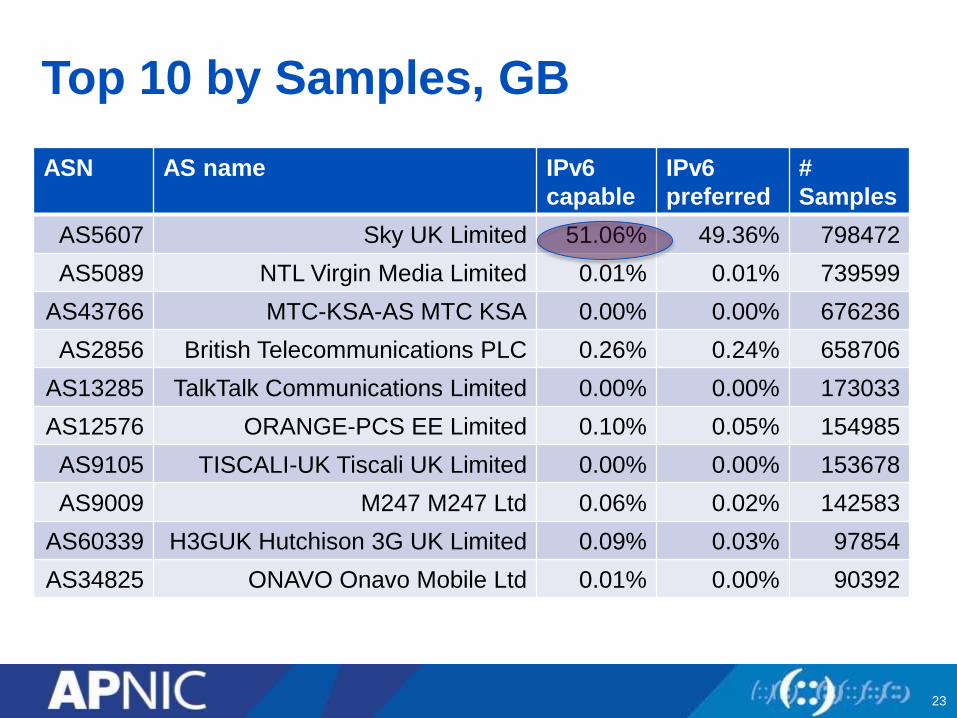
Top 10 by Samples, GB
ASN AS name IPv6
capable
IPv6
preferred
#
Samples
AS5607 Sky UK Limited 51.06% 49.36% 798472
AS5089 NTL Virgin Media Limited 0.01% 0.01% 739599
AS43766 MTC-KSA-AS MTC KSA 0.00% 0.00% 676236
AS2856 British Telecommunications PLC 0.26% 0.24% 658706
AS13285 TalkTalk Communications Limited 0.00% 0.00% 173033
AS12576 ORANGE-PCS EE Limited 0.10% 0.05% 154985
AS9105 TISCALI-UK Tiscali UK Limited 0.00% 0.00% 153678
AS9009 M247 M247 Ltd 0.06% 0.02% 142583
AS60339 H3GUK Hutchison 3G UK Limited 0.09% 0.03% 97854
AS34825 ONAVO Onavo Mobile Ltd 0.01% 0.00% 90392
23
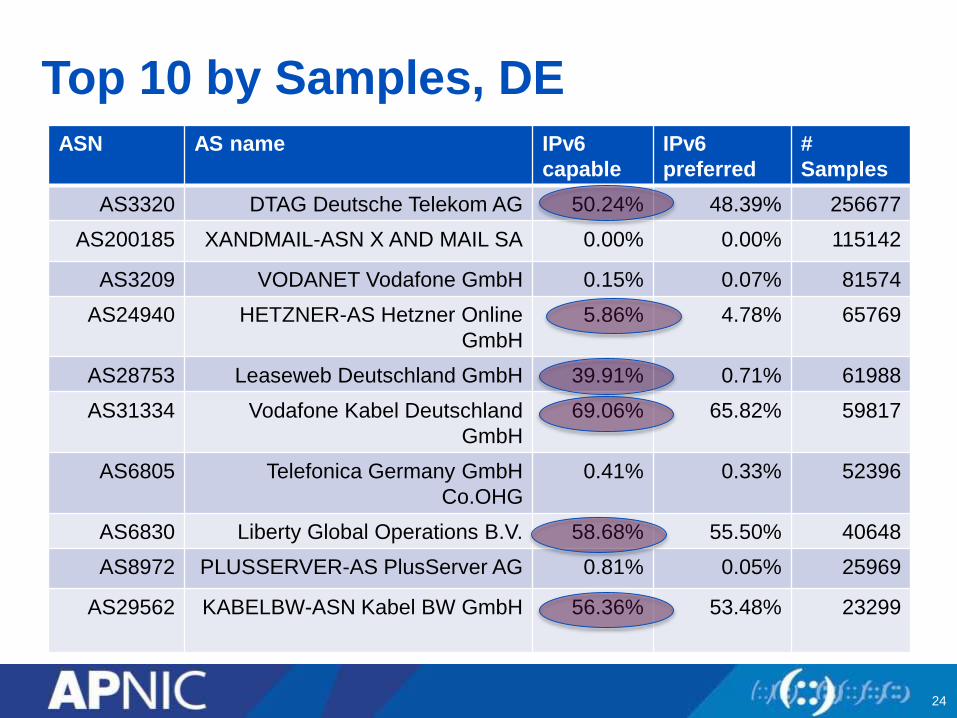
Top 10 by Samples, DE
ASN AS name IPv6
capable
IPv6
preferred
#
Samples
AS3320 DTAG Deutsche Telekom AG 50.24% 48.39% 256677
AS200185 XANDMAIL-ASN X AND MAIL SA 0.00% 0.00% 115142
AS3209 VODANET Vodafone GmbH 0.15% 0.07% 81574
AS24940 HETZNER-AS Hetzner Online
GmbH
5.86% 4.78% 65769
AS28753 Leaseweb Deutschland GmbH 39.91% 0.71% 61988
AS31334 Vodafone Kabel Deutschland
GmbH
69.06% 65.82% 59817
AS6805 Telefonica Germany GmbH
Co.OHG
0.41% 0.33% 52396
AS6830 Liberty Global Operations B.V. 58.68% 55.50% 40648
AS8972 PLUSSERVER-AS PlusServer AG 0.81% 0.05% 25969
AS29562 KABELBW-ASN Kabel BW GmbH 56.36% 53.48% 23299
24

Top 10 by samples BR
ASN AS Name IPv6
Capable
IPv6
Preferred
#
Samples
AS28573 CLARO S.A. 22.60% 20.60% 1354868
AS18881 Global Village Telecom 21.89% 20.73% 892808
AS7738 Telemar Norte Leste S.A. 3.84% 3.68% 575631
AS27699 TELEFNICA BRASIL S.A 2.26% 2.10% 419031
AS8167 Brasil Telecom SA - 2.46% 2.39% 339728
AS26615 Tim Celular S.A. 4.71% 4.60% 104354
AS26599 TELEFNICA BRASIL S.A 13.51% 13.12% 102621
AS53006 ALGAR TELECOM SA 0.05% 0.05% 62938
AS14868 COPEL Telecom S.A. 22.30% 21.73% 44573
AS22085 Claro SA 0.19% 0.04% 40324
25

Top 10 by samples, EC
ASN AS Name IPv6
Capable
IPv6
Preferred
#
Samples
AS14420 CNT EP 45.13% 43.66% 1582536
AS14522 Satnet 0.00% 0.00% 438480
AS27947 Telconet S.A 0.03% 0.03% 424395
AS27738 Ecuadortelecom S.A. 0.00% 0.00% 278140
AS23487 CONECEL 0.02% 0.01% 157551
AS19114 Otecel S.A. 0.03% 0.01% 155074
AS52257 Telconet S.A 0.01% 0.00% 135138
AS27668 ETAPA EP 0.00% 0.00% 126933
AS22724 PUNTONET S.A. 0.01% 0.01% 110372
AS28006 CNT EP 0.02% 0.01% 42226
26

Comcast, AT&T, Verizon, T-Mobile
0
10
20
30
40
50
60
70
80
90
100
2011-1
0
20
11
-12
20
12
-02
20
12
-04
20
12
-06
20
12
-08
20
12
-10
20
12
-12
20
13
-02
20
13
-04
20
13
-06
20
13
-08
20
13
-10
20
13
-12
20
14
-02
20
14
-04
20
14
-06
20
14
-08
20
14
-10
20
14
-12
20
15
-02
20
15
-04
20
15
-06
20
15
-08
20
15
-10
20
15
-12
20
16
-02
20
16
-04
2016-0
6
% I
Pv6 c
ap
ab
le
7922
22394
7018
21928
27
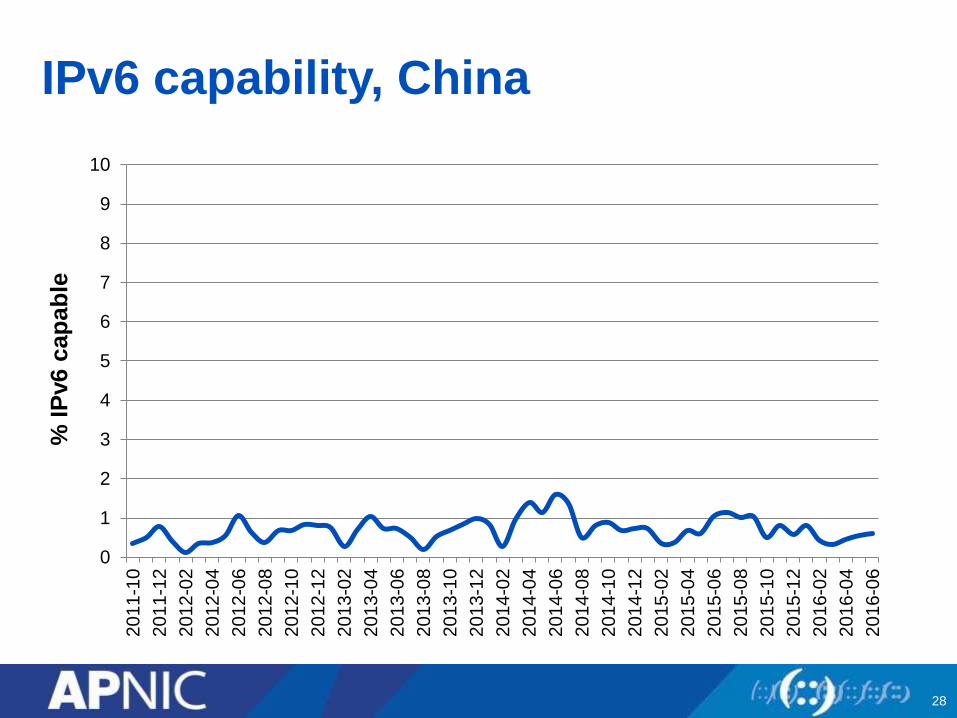
IPv6 capability, China
0
1
2
3
4
5
6
7
8
9
10
20
11
-10
20
11
-12
20
12
-02
20
12
-04
20
12
-06
20
12
-08
20
12
-10
20
12
-12
20
13
-02
20
13
-04
20
13
-06
20
13
-08
20
13
-10
20
13
-12
20
14
-02
20
14
-04
20
14
-06
20
14
-08
20
14
-10
20
14
-12
20
15
-02
20
15
-04
20
15
-06
2015-0
8
20
15
-10
20
15
-12
20
16
-02
20
16
-04
20
16
-06
% I
Pv6
cap
ab
le
28

What we know about China
1,382,013,910 people
692,388,968 Internet users
50% penetration
1,273 ASes
10.35T GDP
IPv4 316 in BGP
337,887,232 addresses
0.24 per head
88% visible
IPv6 55 in BGP
89,167,817 M addresses
64,520 per head
1% visible
1% capability
29

Top 10 by samples, China
ASN AS Name IPv6
Capable
IPv6
Preferred
# Samples
AS4134 CHINANET-BACKBONE 0.42% 0.24% 12628000
AS4837 CHINA169-BACKBONE CNCGROUP 0.21% 0.15% 9910451
AS9808 Guangdong Mobile Communication 0.09% 0.03% 2006643
AS4812 CHINANET-SH-AP China Telecom 0.17% 0.07% 1632577
AS4808 CHINA169-BJ CNCGROUP IP
network
1.12% 0.77% 1166552
AS56046 CMNET-JIANGSU-AP China Mobile 0.07% 0.01% 779374
AS56041 CMNET-ZHEJIANG-AP China Mobile 0.05% 0.00% 720916
AS24547 Hebei Mobile Communication 0.03% 0.00% 698409
AS17816 China Unicom IP network 0.27% 0.19% 479682
AS23724 China Telecommunications 0.14% 0.01% 317333
30
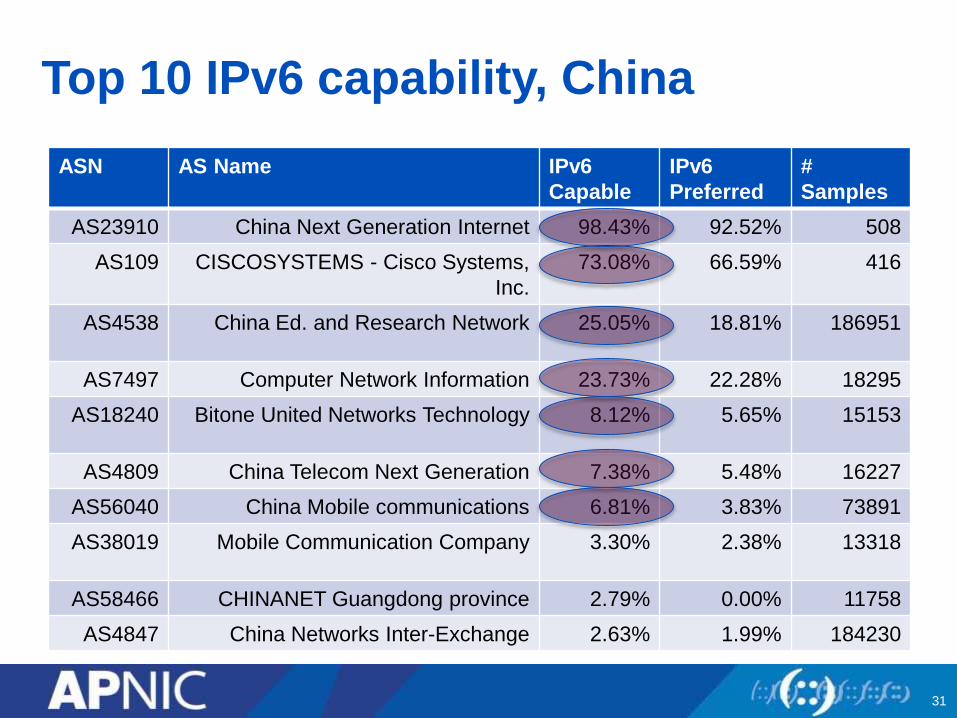
Top 10 IPv6 capability, China
ASN AS Name IPv6
Capable
IPv6
Preferred
#
Samples
AS23910 China Next Generation Internet 98.43% 92.52% 508
AS109 CISCOSYSTEMS - Cisco Systems,
Inc.
73.08% 66.59% 416
AS4538 China Ed. and Research Network 25.05% 18.81% 186951
AS7497 Computer Network Information 23.73% 22.28% 18295
AS18240 Bitone United Networks Technology 8.12% 5.65% 15153
AS4809 China Telecom Next Generation 7.38% 5.48% 16227
AS56040 China Mobile communications 6.81% 3.83% 73891
AS38019 Mobile Communication Company 3.30% 2.38% 13318
AS58466 CHINANET Guangdong province 2.79% 0.00% 11758
AS4847 China Networks Inter-Exchange 2.63% 1.99% 184230
31
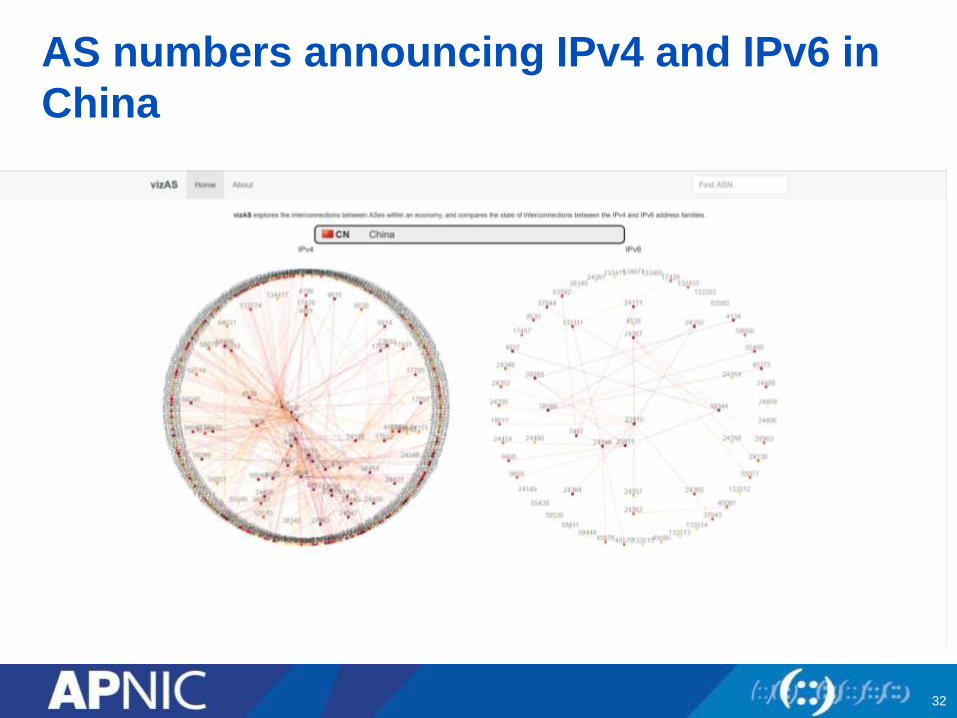
AS numbers announcing IPv4 and IPv6 in
China
32

So: is this an address
distribution problem?

No! This isn’t a distribution problem
• Lets look at some history
– Growth in distinct INR holders by economy over time
– Amount of IPv4, IPv6 by INR holder count by economy over time
• What kinds of trend do we see?

IPv4 by economy by holder, various
economies
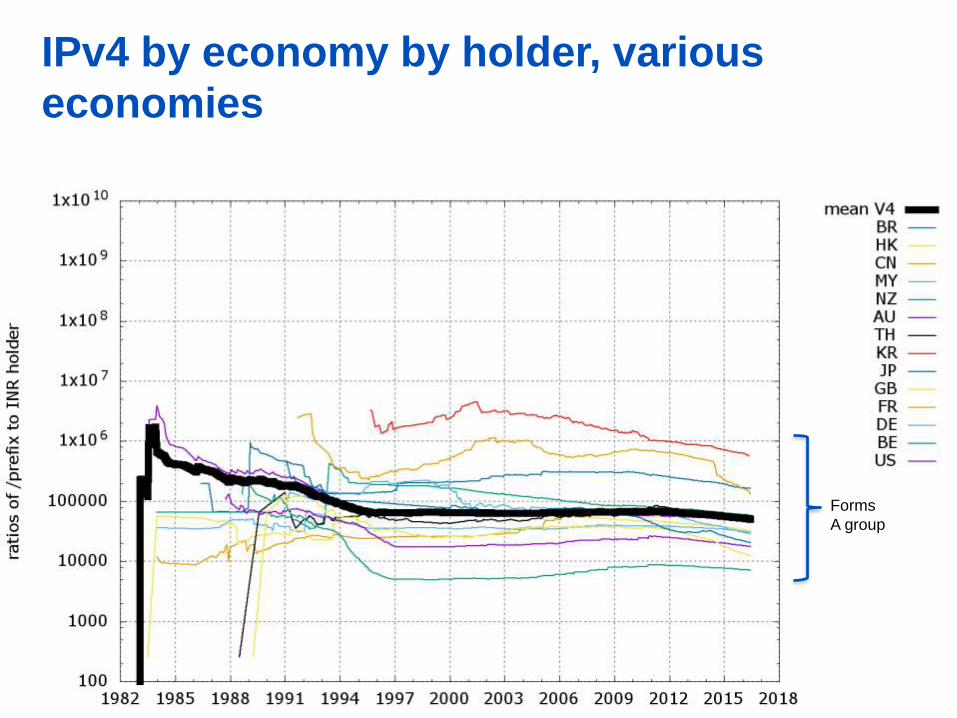
IPv4 by economy by holder, various
economies
Forms
A group

IPv4 by economy by holder
China
CN is above
average
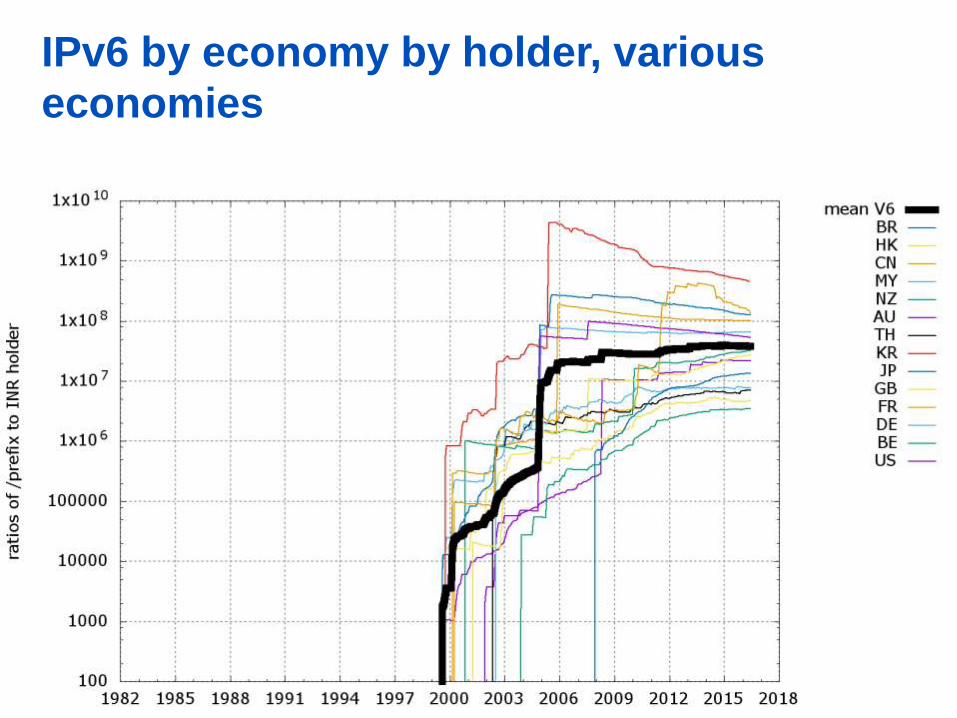
IPv6 by economy by holder, various
economies

IPv6 by economy by holder, various
economies
Forms
A group

IPv6 by economy by holder
China compared to Mean
CN is above
average
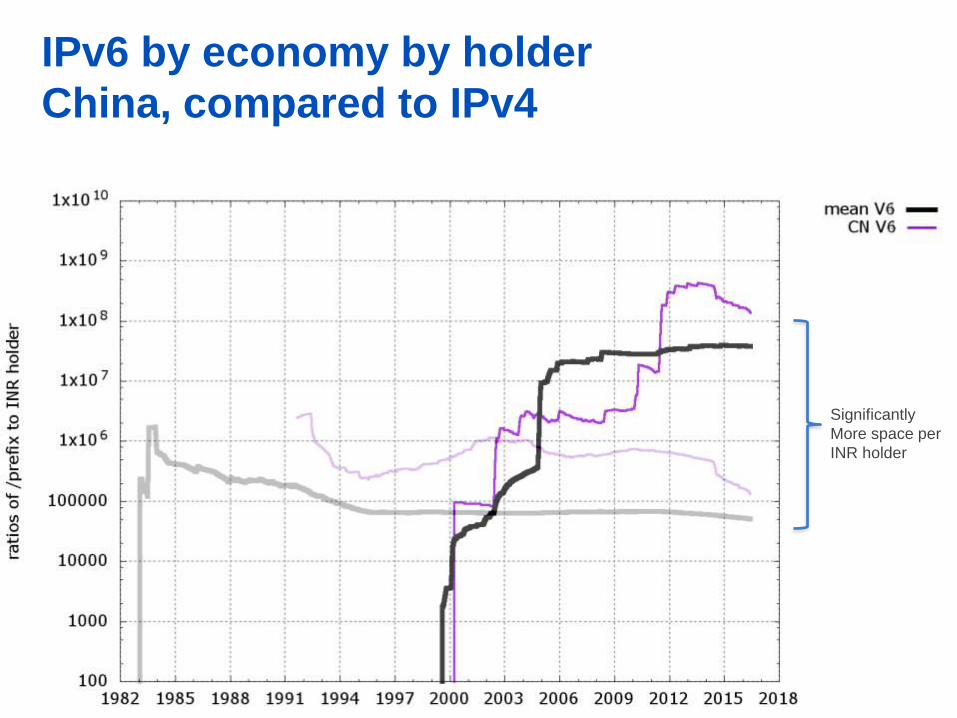
IPv6 by economy by holder
China, compared to IPv4
Significantly
More space per
INR holder
It’s not an allocation problem
• Its clear that The RIR system and CNNIC in particular has
performed VERY WELL in maintaining equitable access to
INR
– CN INR holders hold more than the average
– CN INR holders have significantly more IPv6 holdings per end-site,
than they have IPv4 per customer/user
• There is no doubt we’ve done our job!
– But there is still much to do, encouraging IPv6
• The problem is a deployment problem not an allocation
problem

IPv4 addresses delegations worldwideIn terms of /8s, how much space did each RIR issue by year?
43

Available IPv4 /8s in each RIR
44

IPv6 Address Delegations to China(Number of delegations by year)
45
0.00
50.00
100.00
150.00
200.00
250.00
300.00
2000 2002 2003 2004 2005 2006 2007 2008 2009 2010 2011 2012 2013 2014 2015 2016

Suggestions
• Have your IPv6 development plan ready NOW not later
• Apply for your IPv6 addresses if you have not done so
– APNIC direct Members: One Click via MyAPNIC
– CNNIC members: Apply via CNNIC
• Send technical staff to IPv6 training
• Deploy your IPv6 network
• Provide IPv6 services to your customers
46
Acknowledgement
• Many thanks to the APNIC Research Team - Geoff Huston,
George Michaelson and Byron Ellacott for their useful
measurement data and great support to prepare this
presentation!
• For more information, please visit:
»http://labs.apnic.net/
47
Share your IPv6 stories
• APNIC Blog
– https://blog.apnic.net/
• IPv6 Deployment Survey
– http://survey.consulintel.es/index.php/175122
48

Your views matter!
49
https://survey.apnic.net