Embed Size (px)
Citation preview

Matt GardnerApril 23, 2014

Consider the Source Recap Tech Works Investment Capital Human Capital 30,000-foot View Comparables Considerations Synthesis

About your correspondent Senior Fellow, Innovation, BACEI CEO of new CTC Former Engine, TechAmerica Former BayBio, Tech Council of Maryland


BORING

ACCESSIBLE

Insurance Guy
Sees Risk

NASCAR Driver
Sees Opportunity

Entrepreneur
Let me code you a nav system!

Economic Developer
That will take 20 years…
Policymaker
Our road isn’t like your road

NAICSCode Industry
3254 Pharmaceuticalandmedicinemanufacturing
3341 Computerandperipheralequipmentmanufacturing
3342 Communicationsequipmentmanufacturing
3344 Semiconductorandotherelectroniccomponentmanufacturing
3345 Navigational,measuring,electromedical,andcontrolinstrumentsmanufacturing
3364 Aerospaceproductandpartsmanufacturing
5112 Softwarepublishers
5161 Internetpublishingandbroadcasting
5179 Othertelecommunications
5181 InternetserviceprovidersandWebsearchportals
5182 Dataprocessing,hosting,andrelatedservices
5415 Computersystemsdesignandrelatedservices
5417 Scientificresearch-and-developmentservices
Source: Bureau of Labor Statistics

High-Tech Sector Drives Productivity, Income Growth
3.2%
2.4%
1.6%
0.8%
0.0% 1.0% 2.0% 3.0% 4.0%
2012-22*
2002-12
Compound Annual Growth Rate
Total
High-Tech
Source: Bureau of Labor Statistics; BACEI
Annualized Real Output per Worker Growth (2002-12) and Projections (2012-22)

Top 15 Metros for High-Tech Employment Growth, 2006-2011
Metro Area Change (%)
1. Boise City-Nampa, ID 82.9
2. Augusta-Richmond County, GA-SC 81.9
3. Peoria, IL 41.0
4. Columbia, SC 40.1
5. Charleston-North Charleston-Summerville, SC 39.2
8. SF-San Mateo-Redwood City, CA 27.8
11. Madison, WI 25.4
13. San Antonio, TX 23.6
14. Sacramento, CA 23.4
15. Charlotte-Gastonia-Concord, NC-SC 22.3
Source: Bureau of Labor Statistics; BACEI
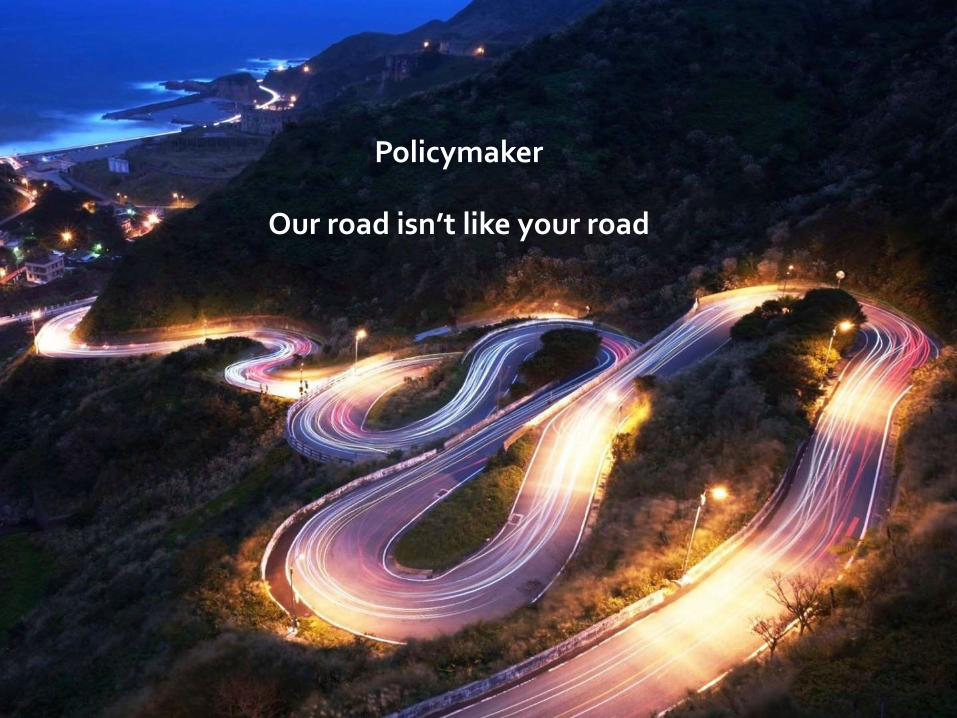
Metro Area High Tech Share (%)
High Tech Jobs (000)
One Year Change (%)
Five Year Change (%)
Average Wage ($)
Augusta-Richmond County, GA-SC
2.7 4.4 11.7 81.9 77,566
Columbia, SC 2.5 6.4 28.2 40.1 74,500
Charleston-North Charleston-Summerville, SC
4.7 10.4 5.2 39.2 76,599
Charlotte-Gastonia-Concord, NC-SC
4.0 28.7 3.9 22.3 84,584
South Carolina 3.7 53.3 8.6 22.7 72,142
United States 5.6 6,133.5 2.6 1.4 95,832
Source: Bureau of Labor Statistics; BACEI
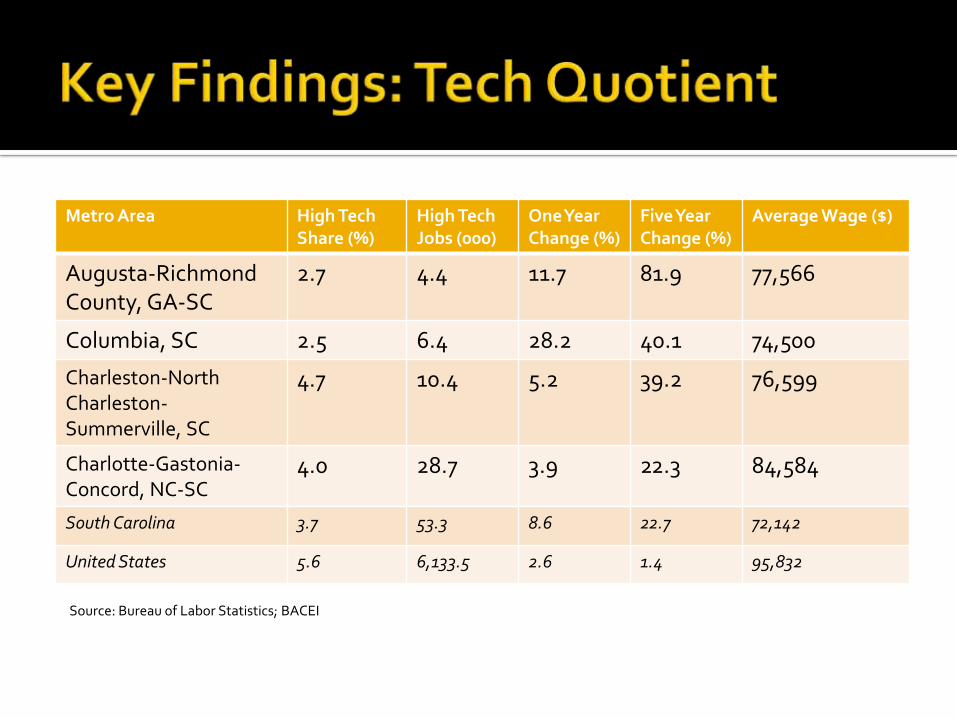
Is this growth representative of new companies?
Metro Area High Tech Startup Density (1990)
High Tech StartupDensity (2010)
Augusta-Richmond County, GA-SC 0.4 0.4
Columbia, SC 0.6 0.5
Charleston-North Charleston-Summerville, SC 0.8 0.6
Charlotte-Gastonia-Concord, NC-SC 0.9 1.2
Austin-Round Rock, TX 2.3 1.7
San Jose-Sunnyvale, CA 3.0 2.6
United States 1.0 1.0
Source: Bureau of Economic Analysis, NETS, Kauffman Foundation

Source: PWC MoneyTree
RegionTotal $
InvestedDeals
All $9,468,943,000 951
Amount % of Total DealsSilicon Valley $4698M 49.62% 321New England $1013M 10.70% 98
NY Metro $961M 10.14% 105LA/Orange County $520M 5.49% 62
Midwest $420M 4.44% 84Texas $349M 3.68% 41
SouthWest $261M 2.76% 22Southeast $260M 2.74% 44San Diego $243M 2.57% 23
DC/Metroplex $217M 2.30% 43Northwest $186M 1.97% 30
Colorado $113M 1.19% 22North Central $108M 1.14% 23
Philadelphia Metro $101M 1.07% 19South Central $18M 0.19% 6
Upstate NY $2M 0.02% 6AK/HI/PR $0M 0.00% 2
Q1 2014 Venture Capital Investments by US Region

Source: NSF Science & Engineering Indicators 2014
Institution 2010 2011 2012
All institutions 58,360,05661,996,23
562,266,083
1 Johns Hopkins U., The (private)a 1,997,252 2,135,547 2,092,9997 Duke U. (private) 980,514 1,018,241 1,004,7599 U. of North Carolina, Chapel Hill (public) 746,828 846,499 864,74810 Stanford U. (private) 810,300 868,393 854,58024 Georgia Institute of Technology (public) 611,226 650,588 683,89437 Emory U. (private) 498,309 479,678 474,53752 North Carolina State U. (public) 357,802 374,446 400,04668 U. of GA (public) 274,380 300,388 311,49886 Medical U. of South Carolina (public) 224,632 213,346 236,58699 Wake Forest U. (private) 192,034 208,460 203,730
Top 100 (select) academic institutions in S&E R&D expendituresRanked by FY 2012 R&D expenditures: FYs 2010–12 (000)

Source: NSF Science & Engineering Indicators 2014
Top 300 (select) organizations granted patens in 2012
Rank Organization Patents Change from 2011 (%)
1 IBM 6,457 5.0
2 Samsung 5,043 3.6
90 U California (System) 357 10.5
138 MIT 216 35.0
157 Stanford 182 19.0
197 U Texas 141 12.8
205 Cal Tech 136 22.5

Don’t create the next Silicon Valley
Be the first Belle Lab


Industry 2012 GDP ($bn)
% of Total
Transportation & Warehousing 4.06 2.3
Prof, Sci &Tech Services 9.49 5.4
Management of Companies 1.68 1.0
Administrative & Waste Mgmt 7.32 4.2
Ed Services (excl public schools) 1.25 0.7
Healthcare & Social Assistance 11.50 6.5
Arts, Entertainment & Recreation 1.16 0.7
Accommodation and Food Service 6.78 3.8
Other Services 4.64 2.6
Government 29.96 17.0
Industry 2012 GDP ($bn)
% of Total
Ag and Forestry 1.04 0.6
Mining 0.22 0.1
Utilities 5.57 3.2
Construction 7.23 4.1
Manufacturing 28.71 16.3
Wholesale Trade 9.69 5.5
Retail Trade 12.78 7.3
Information 4.33 2.5
Finance & Insurance
9.04 5.1
Real Estate 19.76 11.2
Source: South Carolina Department of Commerce
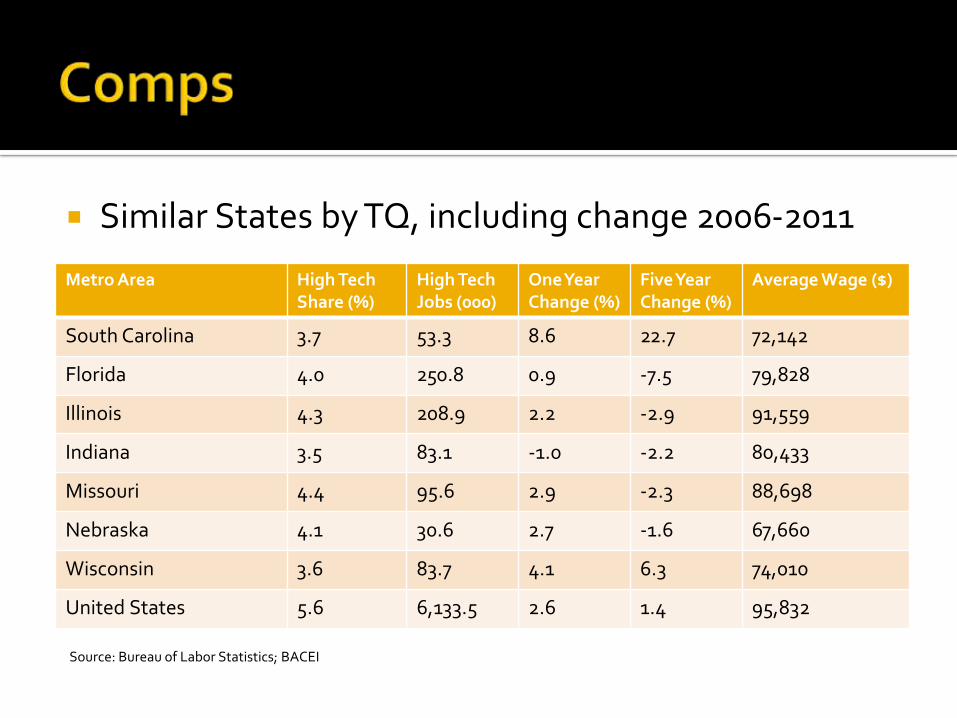
Similar States by TQ, including change 2006-2011
Metro Area High Tech Share (%)
High Tech Jobs (000)
One Year Change (%)
Five Year Change (%)
Average Wage ($)
South Carolina 3.7 53.3 8.6 22.7 72,142
Florida 4.0 250.8 0.9 -7.5 79,828
Illinois 4.3 208.9 2.2 -2.9 91,559
Indiana 3.5 83.1 -1.0 -2.2 80,433
Missouri 4.4 95.6 2.9 -2.3 88,698
Nebraska 4.1 30.6 2.7 -1.6 67,660
Wisconsin 3.6 83.7 4.1 6.3 74,010
United States 5.6 6,133.5 2.6 1.4 95,832
Source: Bureau of Labor Statistics; BACEI

Management Changes What is General Assembly and why should I
care? How does that relate to “kid comfort” with tech? Where is investment in tech going?
Energy
Ed Tech
Enterprise
IoT▪ Smart Grid, Efficiency, Buildings
▪ Transportation

Public Sector
Test beds
Procurement
Challenges KBA MdBio Biomass-to-energy

Federally flat R&D drivers Clearer picture with financial
disintermediation Democratization and availability of education
tools

Additional resources
BACEI www.bayareaeconomy.org
Kauffman Foundation
MoneyTree www.pwcmoneytree.com
Startup Genome
Startup America/UPglobal
Matthew M. Gardner, Tech-led Economic GrowthTw: @TechCitizenEmail: [email protected]