Embed Size (px)
Citation preview
A Perspective on Market Leadership A Perspective on Market Leadership in Today’s Marketin Today’s Market
July 20, 2011
2
Agenda
I. Introduction
II. Case Studies to Support Our View
III. Gridley’s Advice for the Audience
3
I. Introduction
4
Introduction
• Industry leaders today are highly vulnerable
• Increasingly tough to compete with new, innovative entrants
Unprecedented opportunity for new leaders to emerge across all sectors of Information Services
5
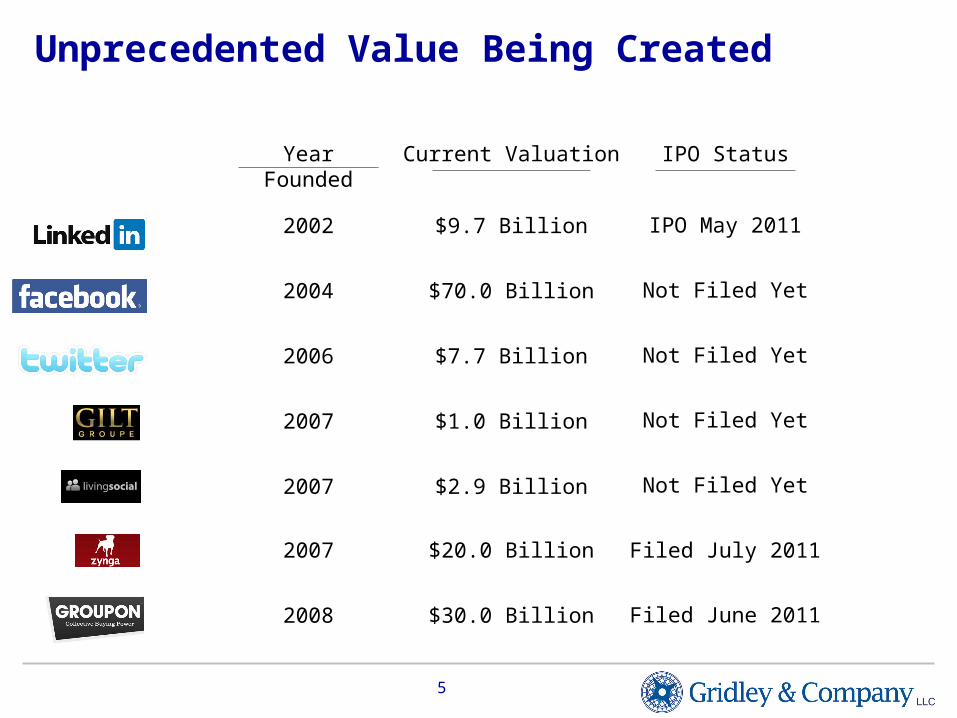
Unprecedented Value Being Created
Year Founded Current Valuation IPO Status
2002
2004
2006
2007
2007
2007
2008
$9.7 Billion IPO May 2011
Not Filed Yet
Filed July 2011
Filed June 2011
$70.0 Billion
$7.7 Billion
$1.0 Billion
$2.9 Billion
$20.0 Billion
$30.0 Billion
Not Filed Yet
Not Filed Yet
Not Filed Yet
6
II. Case Studies to Support Our View
7
Traditional Ad Agencies
vs.
Performance Based Marketing
8
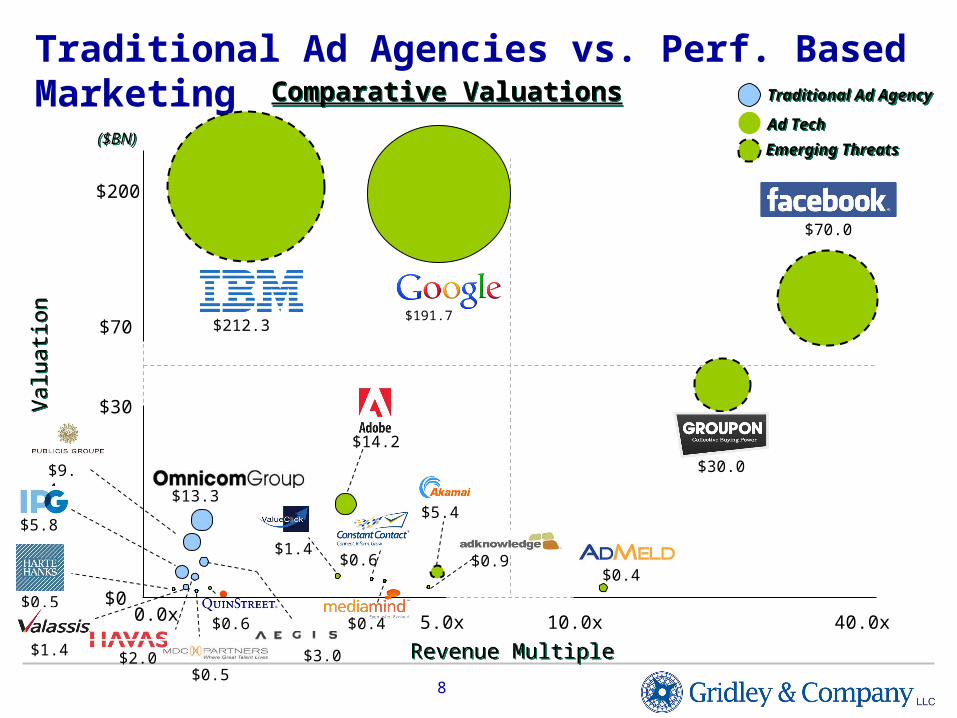
Traditional Ad Agencies vs. Perf. Based Marketing
Revenue MultipleRevenue Multiple
($BN)($BN)
0.0x$0
$200
5.0x 10.0x 40.0x
$70
$30
Val
uatio
nV
alua
tion
$14.2
$13.3
$9.4
$5.8
$3.0$1.4 $2.0
$0.5
$0.5
$0.6
$1.4$0.6 $0.9
$0.4
$0.4
$30.0
$5.4
$212.3$191.7
$70.0
Comparative ValuationsComparative Valuations
Emerging ThreatsEmerging Threats
Traditional Ad AgencyTraditional Ad Agency
Ad TechAd Tech
9
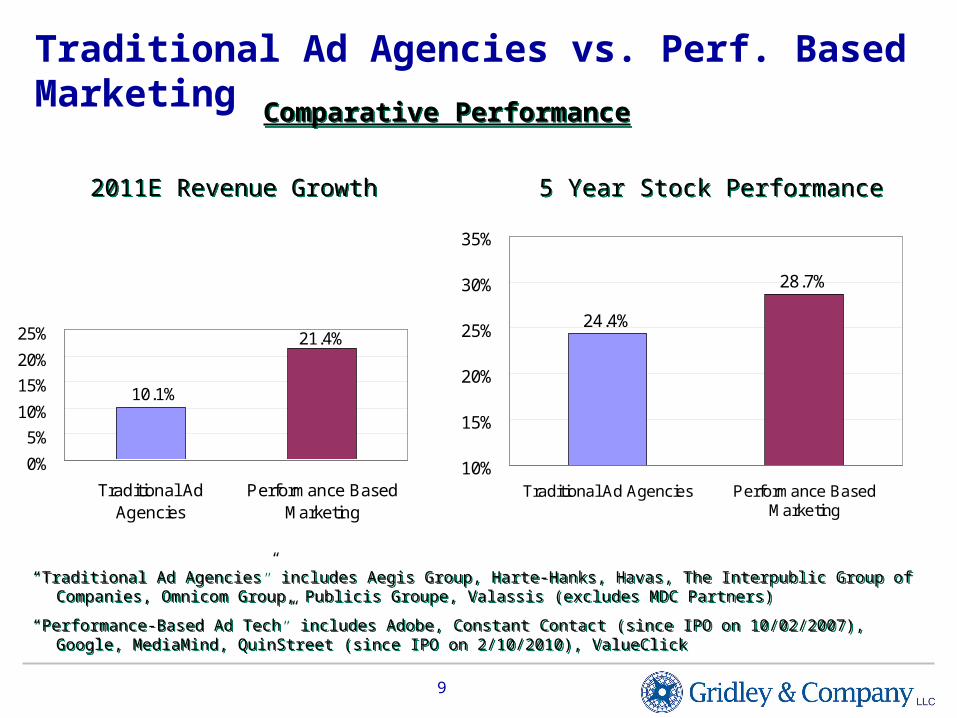
“Traditional Ad Agencies” includes Aegis Group, Harte-Hanks, Havas, The Interpublic Group of Companies, Omnicom Group, Publicis Groupe, Valassis (excludes MDC Partners)
“Performance-Based Ad Tech” includes Adobe, Constant Contact (since IPO on 10/02/2007), Google, MediaMind, QuinStreet (since IPO on 2/10/2010), ValueClick
5 Year Stock Performance5 Year Stock Performance2011E Revenue Growth2011E Revenue Growth
Comparative PerformanceComparative Performance
Traditional Ad Agencies vs. Perf. Based Marketing
10.1%
21.4%
0%
5%
10%
15%
20%
25%
Traditional AdAgencies
Performance BasedMarketing
24.4%
28.7%
10%
15%
20%
25%
30%
35%
Traditional Ad Agencies Performance BasedMarketing
10
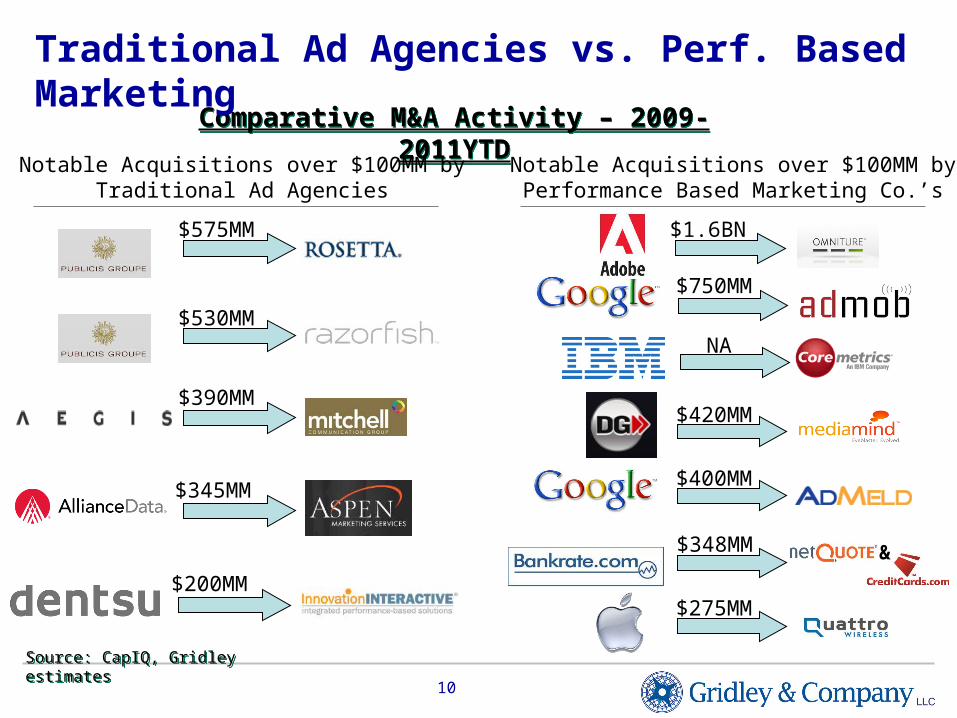
Comparative M&A Activity – 2009-2011YTDComparative M&A Activity – 2009-2011YTD
Traditional Ad Agencies vs. Perf. Based Marketing
$575MM
$530MM
$390MM
$750MM
$420MM
$400MM
$275MM
Notable Acquisitions over $100MM byTraditional Ad Agencies
Notable Acquisitions over $100MM byPerformance Based Marketing Co.’s
$348MM
$1.6BN
&
NA
$345MM
$200MM
Source: CapIQ, Gridley estimatesSource: CapIQ, Gridley estimates
11
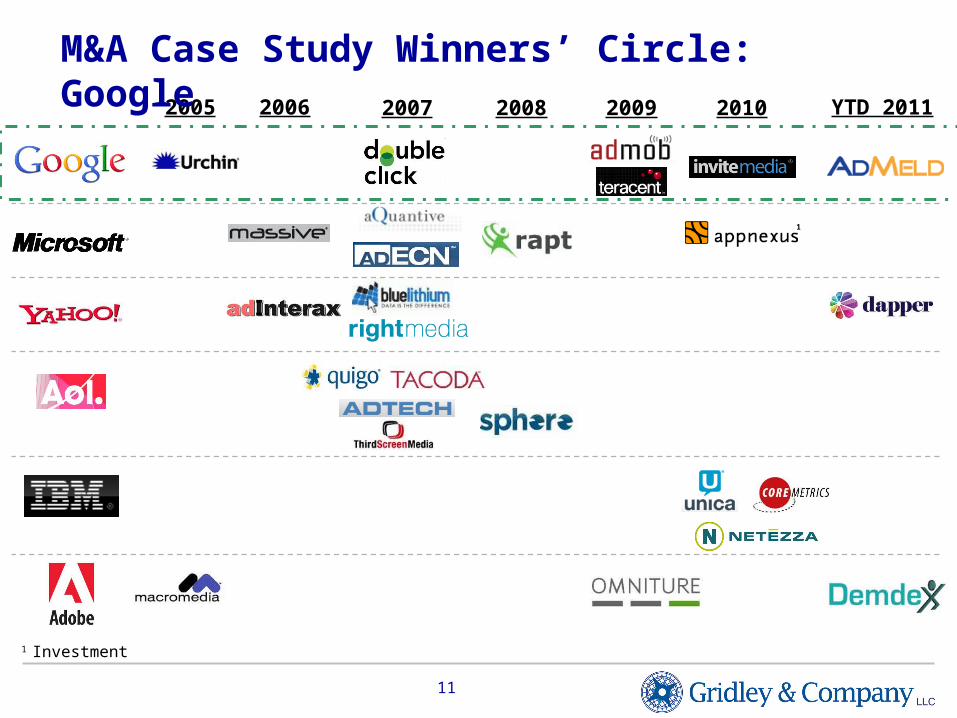
1 Investment
2006 2007 2008 2010
1
YTD 201120092005
M&A Case Study Winners’ Circle: Google
12
Traditional Media
vs.
Social Networks
13
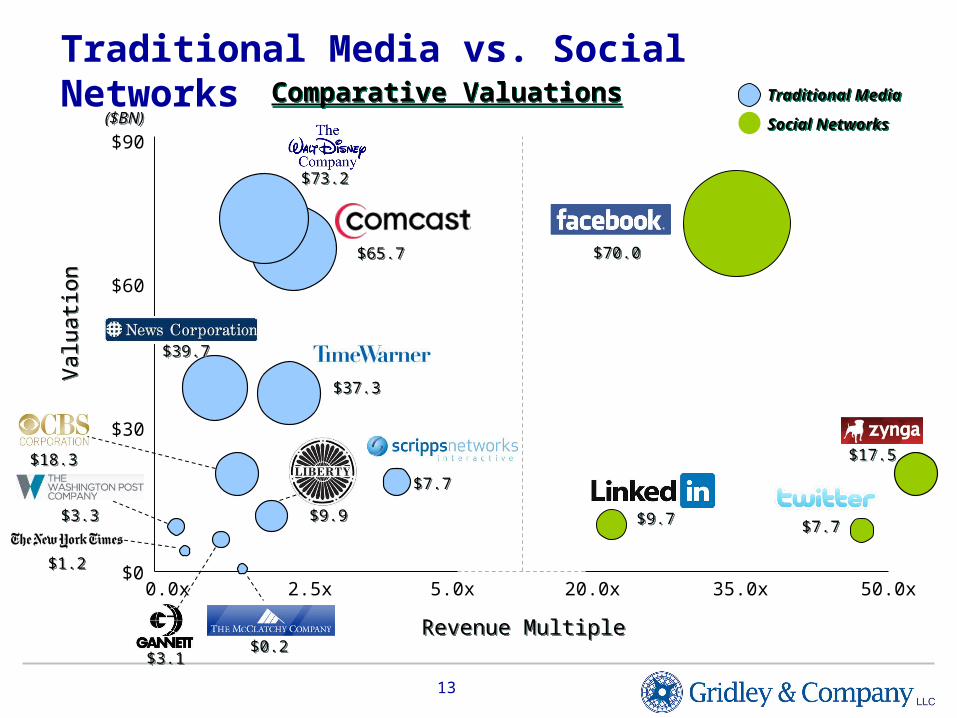
Traditional Media vs. Social NetworksComparative ValuationsComparative Valuations
Revenue MultipleRevenue Multiple
($BN)($BN)
Val
uatio
nV
alua
tion
0.0x 5.0x 20.0x 50.0x$0
$90
$30
$60
2.5x 35.0x
$70.0$70.0
$17.5$17.5
$9.7$9.7$7.7$7.7
$73.2$73.2
$65.7$65.7
$37.3$37.3
$7.7$7.7
$0.2$0.2
$9.9$9.9
$39.7$39.7
$3.1$3.1
$1.2$1.2
$3.3$3.3
$18.3$18.3
Traditional MediaTraditional Media
Social NetworksSocial Networks
14
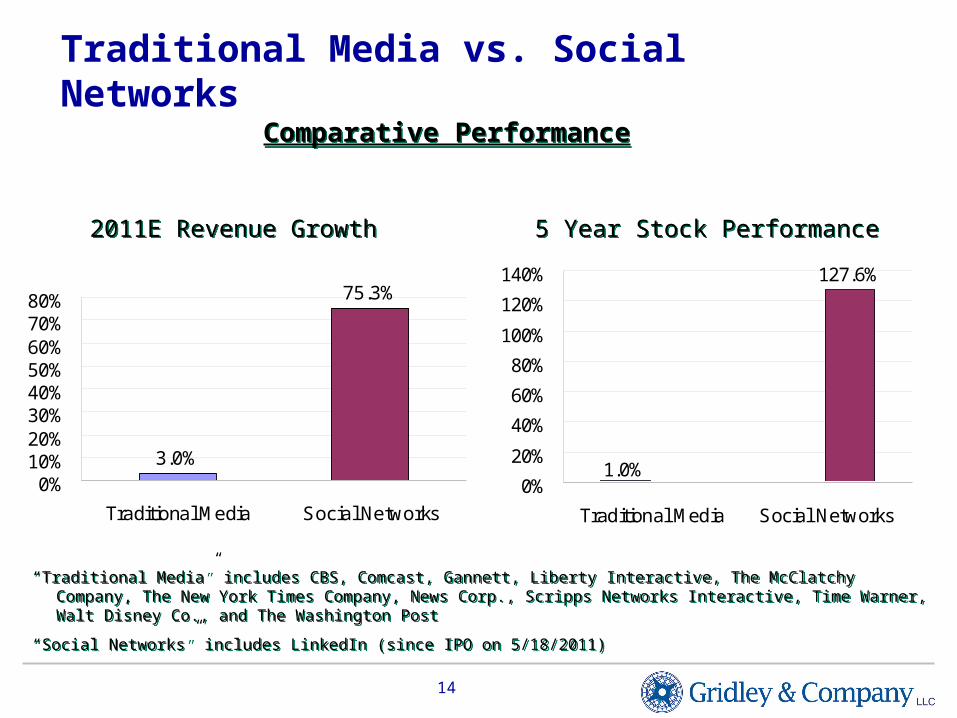
Traditional Media vs. Social Networks
5 Year Stock Performance5 Year Stock Performance2011E Revenue Growth2011E Revenue Growth
“Traditional Media” includes CBS, Comcast, Gannett, Liberty Interactive, The McClatchy Company, The New York Times Company, News Corp., Scripps Networks Interactive, Time Warner, Walt Disney Co., and The Washington Post
“Social Networks” includes LinkedIn (since IPO on 5/18/2011)
“Traditional Media” includes CBS, Comcast, Gannett, Liberty Interactive, The McClatchy Company, The New York Times Company, News Corp., Scripps Networks Interactive, Time Warner, Walt Disney Co., and The Washington Post
“Social Networks” includes LinkedIn (since IPO on 5/18/2011)
Comparative PerformanceComparative Performance
127.6%
1.0%0%
20%
40%
60%
80%
100%
120%
140%
Traditional Media Social Networks
3.0%
75.3%
0%10%20%30%40%50%60%70%80%
Traditional Media Social Networks
15
45
47
49
51
53
55
57
59
61
63
65
1945
1948
1951
1954
1957
1960
1963
1966
1969
1972
1975
1978
1981
1984
1987
1990
1993
1996
1999
2002
2005
2008
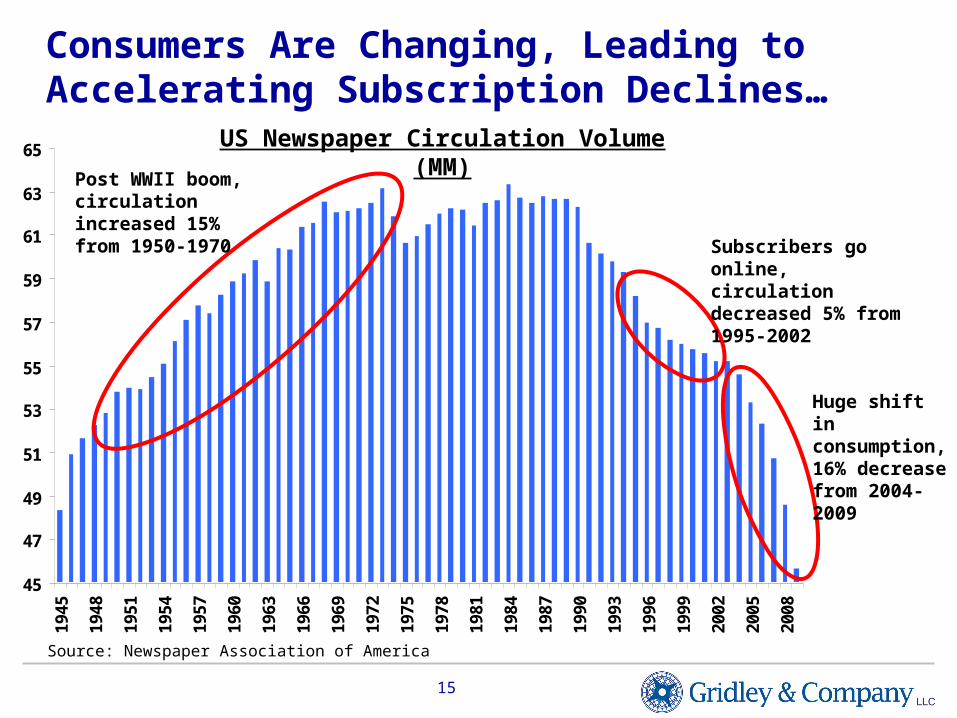
Consumers Are Changing, Leading to Accelerating Subscription Declines…
Post WWII boom, circulation increased 15% from 1950-1970
Subscribers go online, circulation decreased 5% from 1995-2002
US Newspaper Circulation Volume (MM)
Huge shift in consumption, 16% decrease from 2004-2009
Source: Newspaper Association of America
16
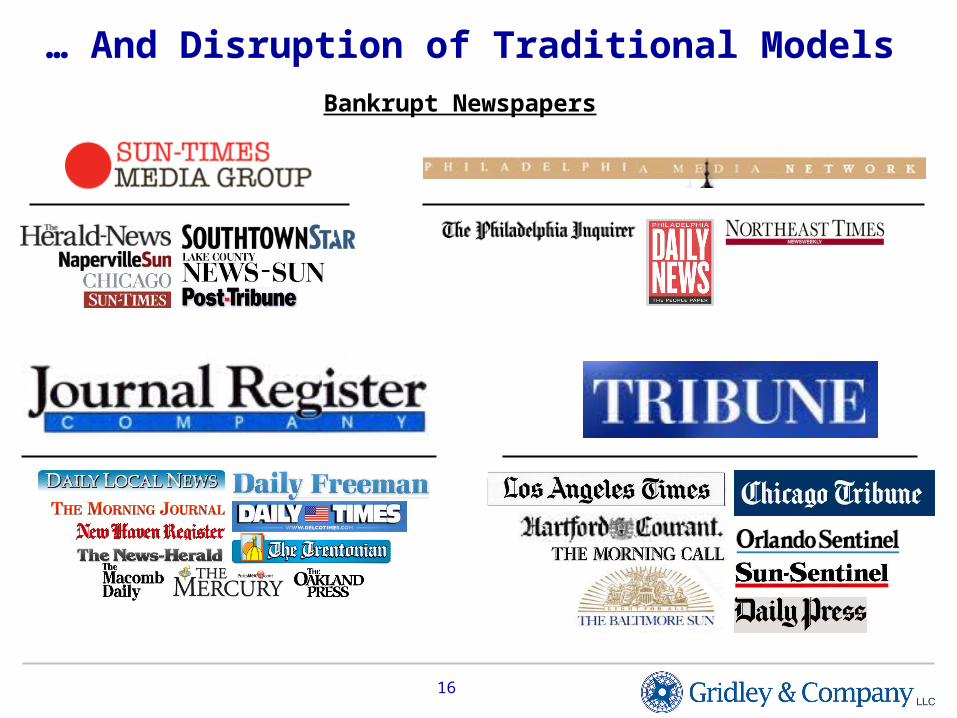
… And Disruption of Traditional Models
Bankrupt Newspapers
17
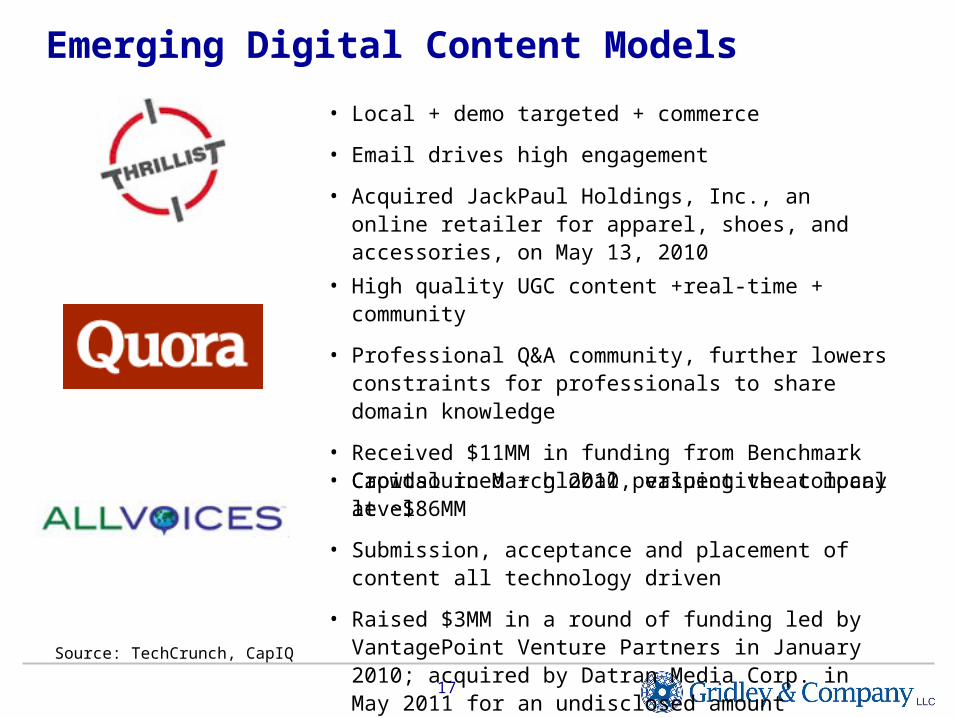
Emerging Digital Content Models
Source: TechCrunch, CapIQ
• Local + demo targeted + commerce
• Email drives high engagement
• Acquired JackPaul Holdings, Inc., an online retailer for apparel, shoes, and accessories, on May 13, 2010
• High quality UGC content +real-time + community
• Professional Q&A community, further lowers constraints for professionals to share domain knowledge
• Received $11MM in funding from Benchmark Capital in March 2010, valuing the company at ~$86MM
• Crowdsourced + global perspective at local level
• Submission, acceptance and placement of content all technology driven
• Raised $3MM in a round of funding led by VantagePoint Venture Partners in January 2010; acquired by Datran Media Corp. in May 2011 for an undisclosed amount
18
Traditional Retail
vs.
E-Commerce
19
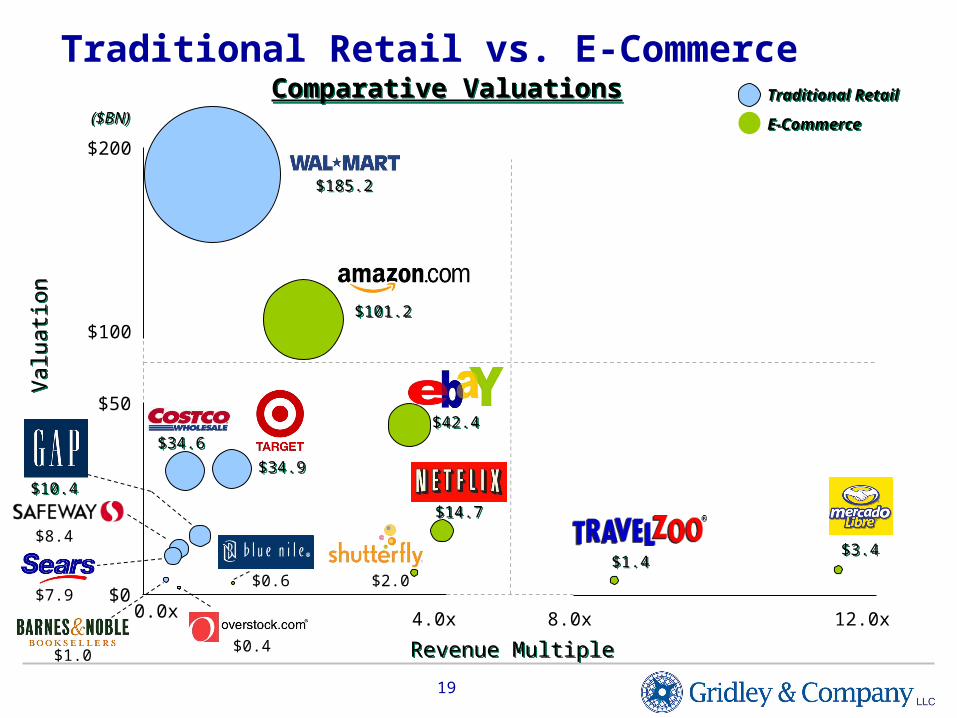
Traditional Retail vs. E-Commerce
0.0x 4.0x 8.0x 12.0x
($BN)($BN)
$0
$200
$100
$50
Val
uatio
nV
alua
tion
Revenue MultipleRevenue Multiple
$1.4$1.4$3.4$3.4
$14.7$14.7
$7.9
$1.0
$8.4
$2.0$0.6
$185.2$185.2
$101.2$101.2
$34.6$34.6
$34.9$34.9
$42.4$42.4
$10.4$10.4
$0.4
Comparative ValuationsComparative Valuations Traditional RetailTraditional Retail
E-CommerceE-Commerce
20
Traditional Retail vs. E-Commerce
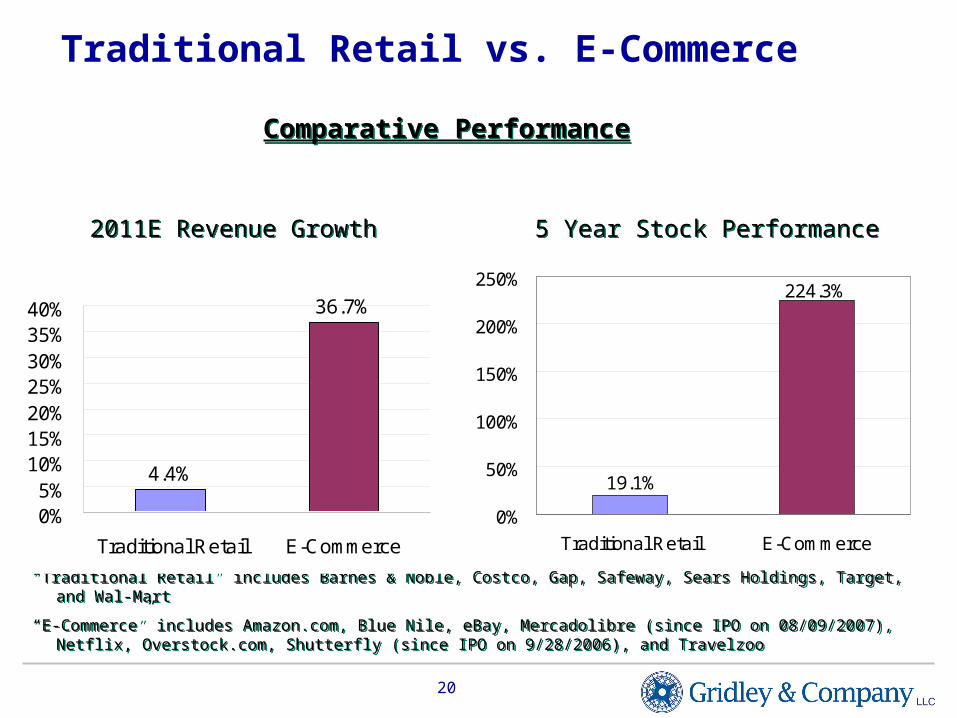
5 Year Stock Performance5 Year Stock Performance2011E Revenue Growth2011E Revenue Growth
“Traditional Retail” includes Barnes & Noble, Costco, Gap, Safeway, Sears Holdings, Target, and Wal-Mart
“E-Commerce” includes Amazon.com, Blue Nile, eBay, Mercadolibre (since IPO on 08/09/2007), Netflix, Overstock.com, Shutterfly (since IPO on 9/28/2006), and Travelzoo
“Traditional Retail” includes Barnes & Noble, Costco, Gap, Safeway, Sears Holdings, Target, and Wal-Mart
“E-Commerce” includes Amazon.com, Blue Nile, eBay, Mercadolibre (since IPO on 08/09/2007), Netflix, Overstock.com, Shutterfly (since IPO on 9/28/2006), and Travelzoo
Comparative PerformanceComparative Performance
4.4%
36.7%
0%5%
10%15%20%25%30%35%40%
Traditional Retail E-Commerce
19.1%
224.3%
0%
50%
100%
150%
200%
250%
Traditional Retail E-Commerce
21
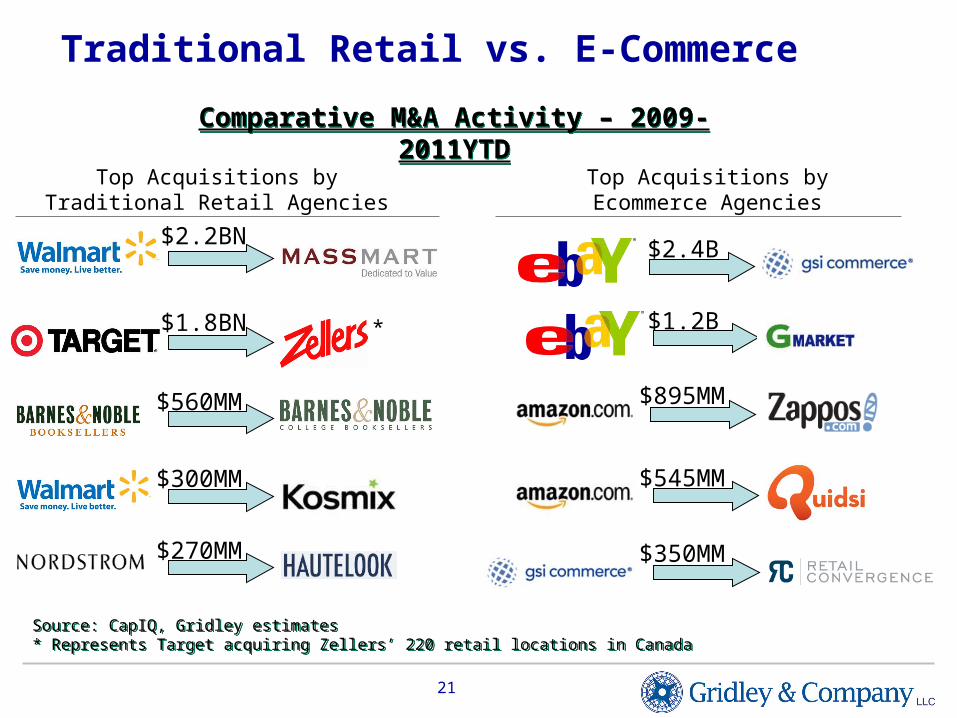
Traditional Retail vs. E-Commerce
Comparative M&A Activity – 2009-2011YTDComparative M&A Activity – 2009-2011YTD
$2.2BN
$560MM
$300MM
$270MM
$1.8BN *
$2.4B
$1.2B
$895MM
$545MM
$350MM
Top Acquisitions byTraditional Retail Agencies
Top Acquisitions byEcommerce Agencies
Source: CapIQ, Gridley estimates* Represents Target acquiring Zellers’ 220 retail locations in CanadaSource: CapIQ, Gridley estimates* Represents Target acquiring Zellers’ 220 retail locations in Canada
22
0
50
100
150
200
250
300
350
400
450
500
1/1/2009 7/1/2009 1/1/2010 7/1/2010 1/1/2011 7/1/2011
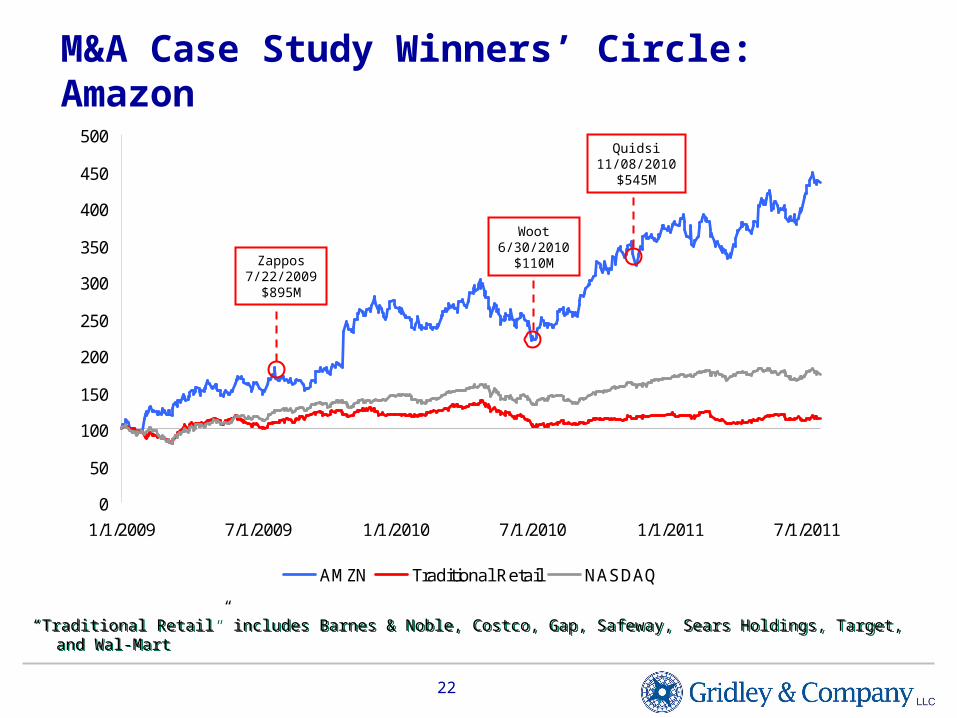
AMZN Traditional Retail NASDAQ
M&A Case Study Winners’ Circle: Amazon
Zappos7/22/2009
$895M
Woot6/30/2010
$110M
Quidsi11/08/2010
$545M
“Traditional Retail” includes Barnes & Noble, Costco, Gap, Safeway, Sears Holdings, Target, and Wal-Mart“Traditional Retail” includes Barnes & Noble, Costco, Gap, Safeway, Sears Holdings, Target, and Wal-Mart
23
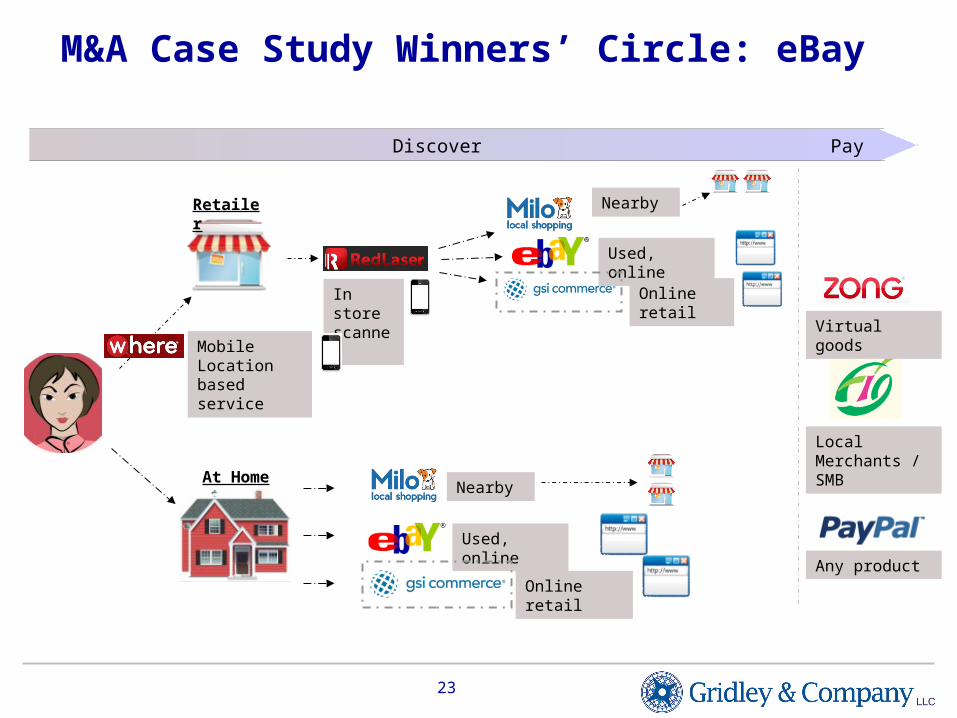
M&A Case Study Winners’ Circle: eBay
In store scanner
Nearby
Used, online
Online retail
Nearby
Used, online
Online retail
Virtual goods
Local Merchants / SMB
Any product
Discover Pay
Mobile Location based service
Retailer
At Home
24
III. Gridley’s Advice for the Audience

25
Unprecedented Agents of Change
Open SourceOpen Source Open ArchitectureOpen Architecture
Cloud ComputingCloud Computing New Business ModelsNew Business Models
26
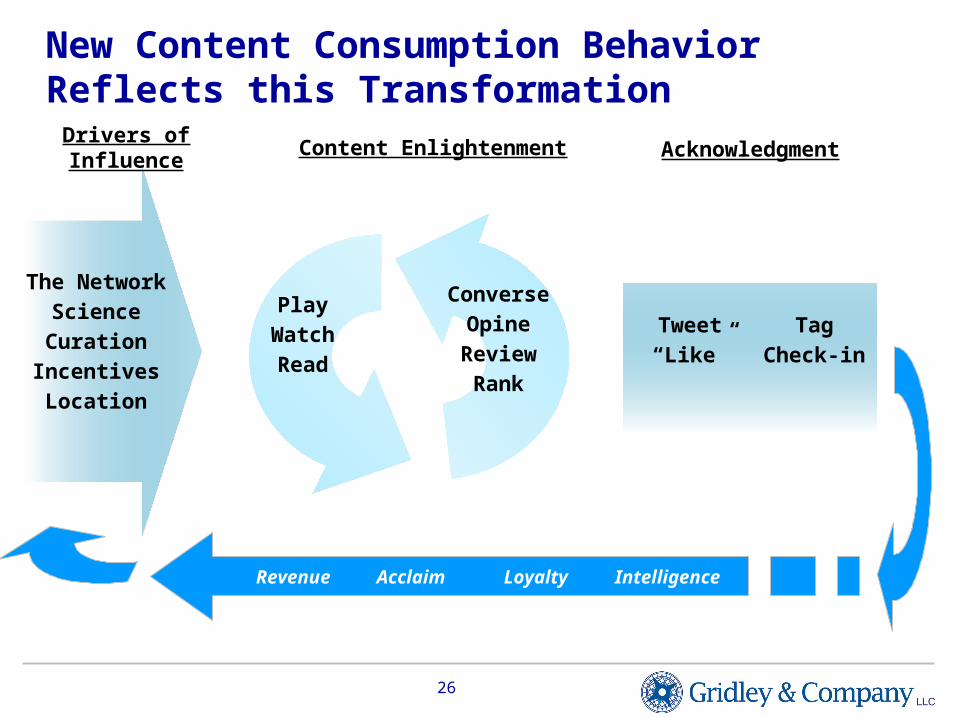
Drivers of Influence
The Network
Science
Curation
Incentives
Location
Acknowledgment
Tweet
“Like”
New Content Consumption Behavior Reflects this Transformation
Tag
Check-in
Content Enlightenment
Play
Watch
Read
Converse
Opine
Review
Rank
Revenue Acclaim Loyalty Intelligence
27
Advice to the Audience – Private Companies
• Unprecedented opportunity for new leadership
• Clear, differentiated capabilities are key
• Buyers will pay premiums for market leaders and experienced teams
• Scale and successful client case studies are key
• Watch for new buyers to emerge
28
Advice to the Audience – Public Companies
• Traditional leaders – You are more vulnerable than you think
• Think strategically about innovation and M&A
• Tremendous value being created, competitive dynamics are changing
• Watch out for disruptive business models
29
Advice to the Audience – VC / PE Investors
• "Jump In – The Water's Fine"
• Be careful about amount of $ invested
• $250MM+ exits aren't easy!
• Look for new strategic buyers to emerge
• Different companies require different exit strategies
30
Questions?
Linda GridleyGridley & Company LLC
10 East 53rd Street, 24th FloorNew York, NY 10022
212.400.9720 tel212.400.9717 fax
Twitter: @gridleycowww.gridleyco.com