Embed Size (px)
Citation preview
Web based simulations of Murine Lipoprotein Metabolism
With the Tiemann et al (2011) model
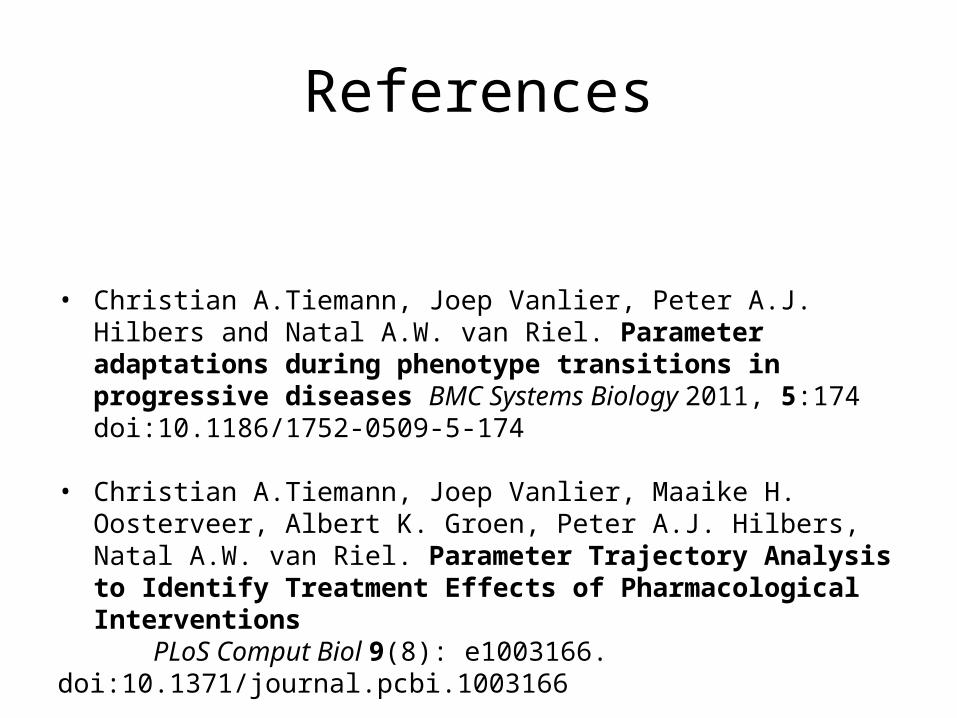
References
• Christian A.Tiemann, Joep Vanlier, Peter A.J. Hilbers and Natal A.W. van Riel. Parameter adaptations during phenotype transitions in progressive diseases BMC Systems Biology 2011, 5:174 doi:10.1186/1752-0509-5-174
• Christian A.Tiemann, Joep Vanlier, Maaike H. Oosterveer, Albert K. Groen, Peter A.J. Hilbers, Natal A.W. van Riel. Parameter Trajectory Analysis to Identify Treatment Effects of Pharmacological Interventions
PLoS Comput Biol 9(8): e1003166. doi:10.1371/journal.pcbi.1003166

Lipoprotein metabolism – Tiemann et al (2011)
The model we will use in this tutorial is found in the Biomodels database – Tiemann2011_PhenotypeTransitions
Lipoprotein metabolism – Tiemann et al (2011)
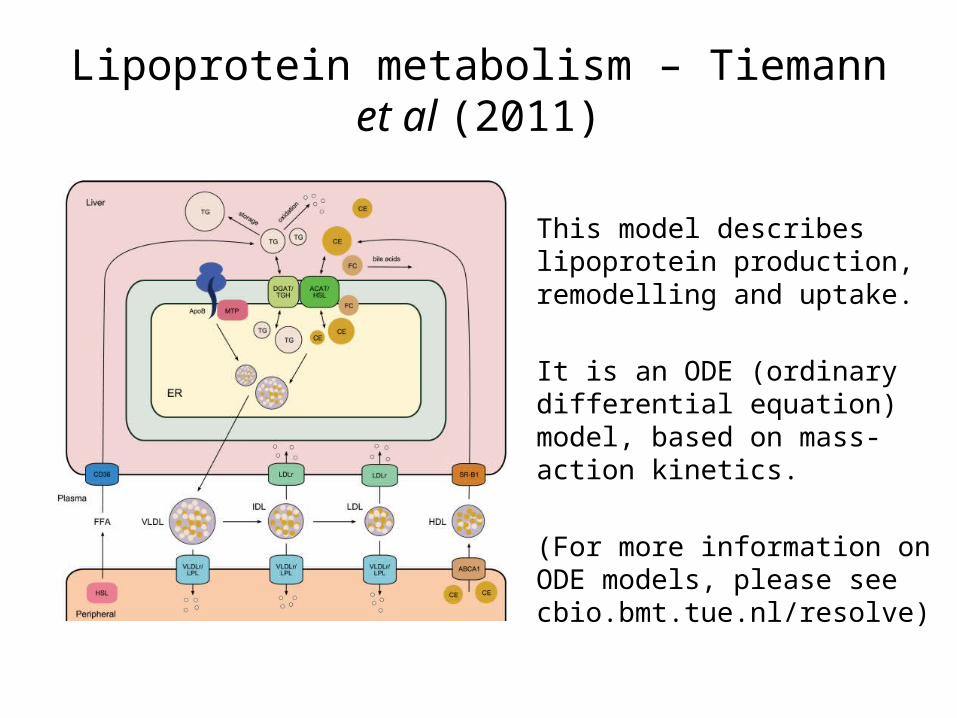
This model describes lipoprotein production, remodelling and uptake.
It is an ODE (ordinary differential equation) model, based on mass-action kinetics.
(For more information on ODE models, please see cbio.bmt.tue.nl/resolve)
Lipoprotein metabolism – Tiemann et al (2011)
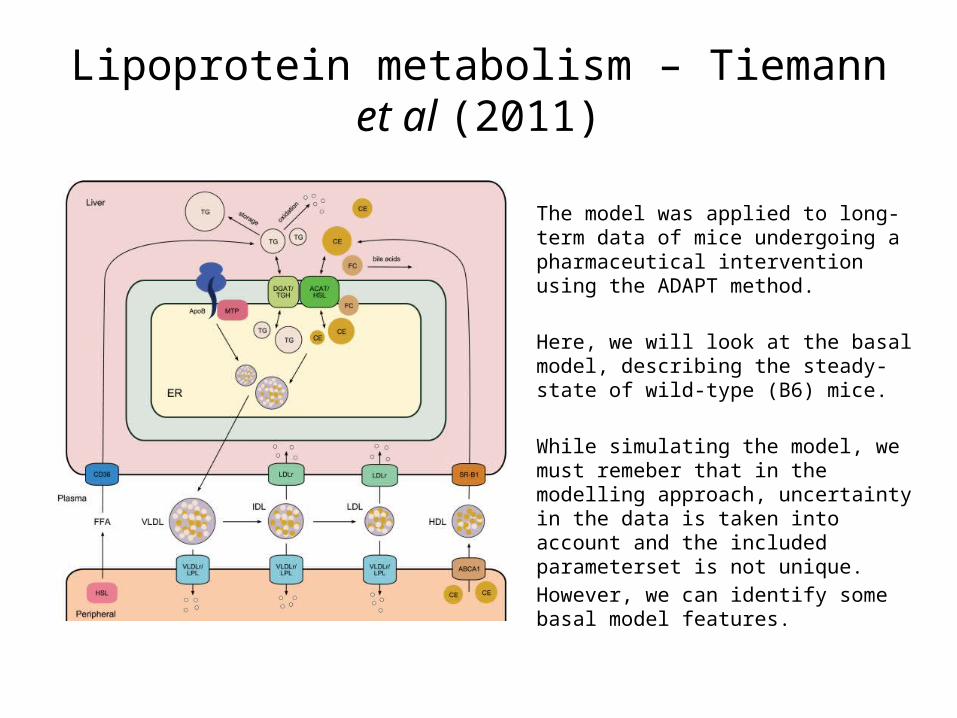
The model was applied to long-term data of mice undergoing a pharmaceutical intervention using the ADAPT method.
Here, we will look at the basal model, describing the steady-state of wild-type (B6) mice.
While simulating the model, we must remeber that in the modelling approach, uncertainty in the data is taken into account and the included parameterset is not unique.However, we can identify some basal model features.

Lipoprotein metabolism – Tiemann et al (2011)
The model contains 11 states
Plasma• TG (Triglycerides) in VLDL/IDL/LDL• CE (Cholesteryl ester) in VLDL/IDL/LDL• CE (Cholesteryl ester) in HDL
Liver • TG (Triglycerides)
– cytoplasm• CE (Cholesteryl ester)
– cytoplasm• TG (Triglycerides)
– endoplasmatic reticulum• CE (cholesteryl ester)
– endoplasmatic reticulum• FC (Free cholesterol)
Lipoprotein metabolism – Tiemann et al (2011)
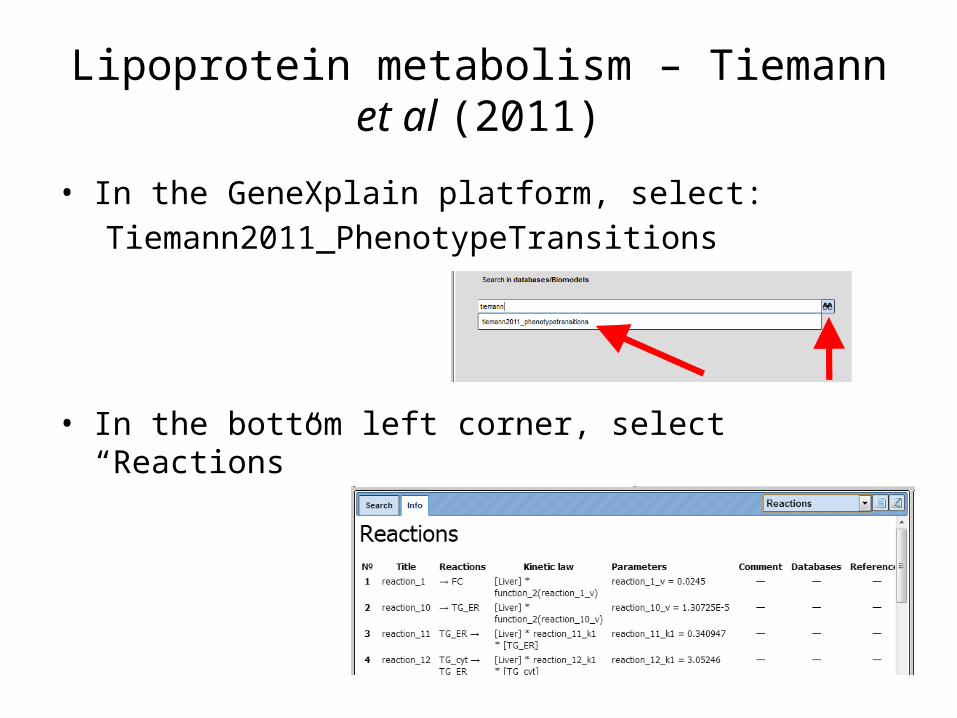
• In the GeneXplain platform, select:Tiemann2011_PhenotypeTransitions
• In the bottom left corner, select “Reactions”
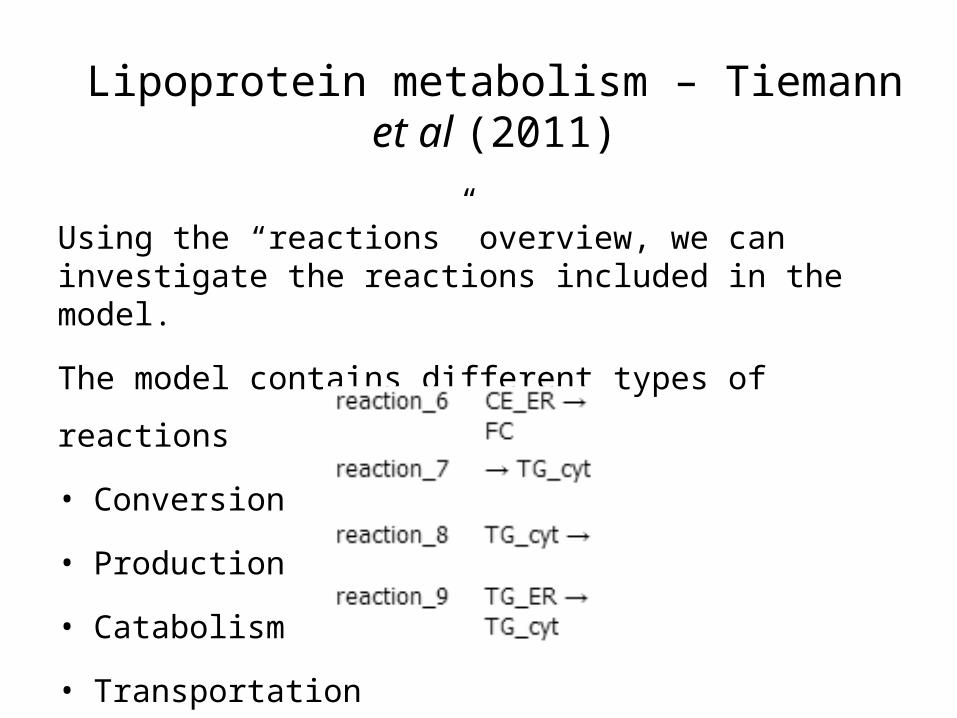
Using the “reactions” overview, we can investigate the reactions included in the model.
The model contains different types of reactions
• Conversion
• Production
• Catabolism
• Transportation
Lipoprotein metabolism – Tiemann et al (2011)
Hepatic triglyceride accumulation
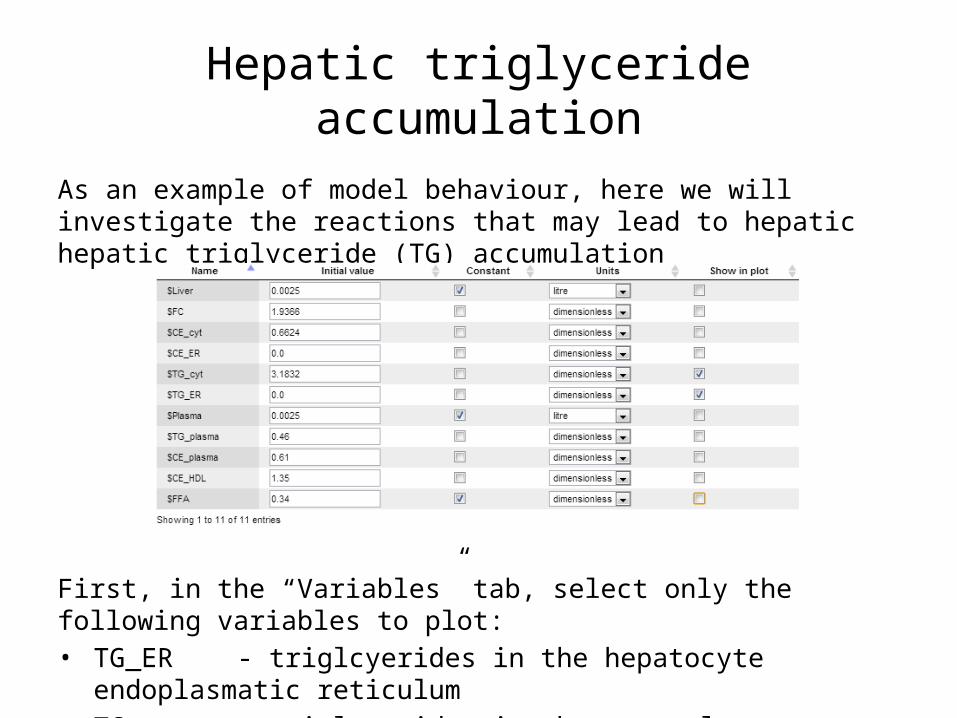
As an example of model behaviour, here we will investigate the reactions that may lead to hepatic hepatic triglyceride (TG) accumulation
First, in the “Variables” tab, select only the following variables to plot:• TG_ER - triglcyerides in the hepatocyte endoplasmatic reticulum• TG_cyt - triglycerides in the cytosol
Hepatic triglyceride accumulation
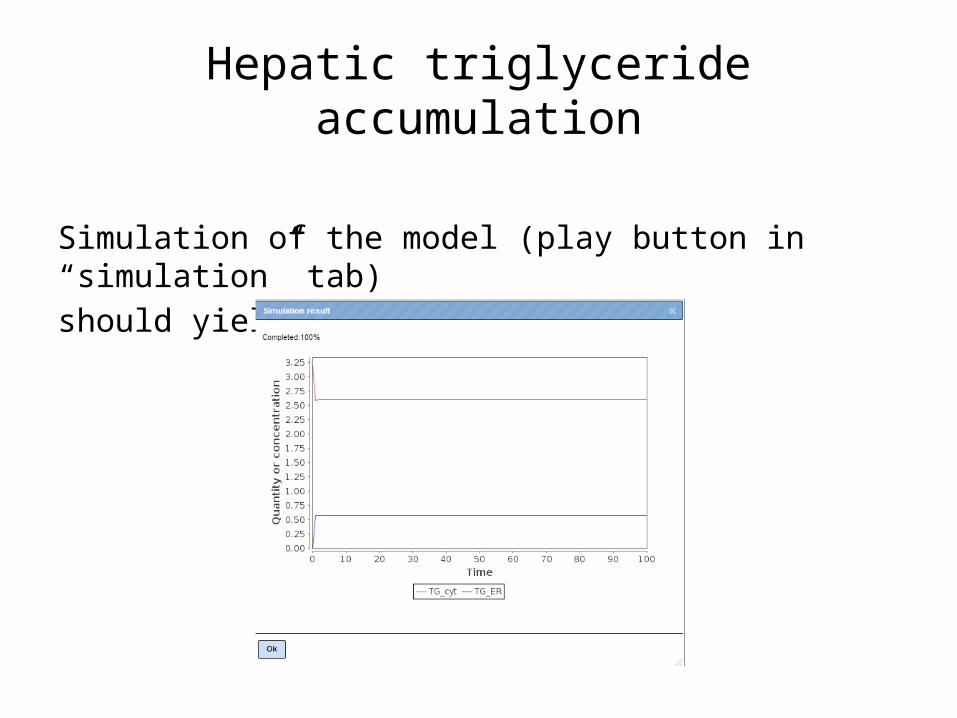
Simulation of the model (play button in “simulation” tab)should yield:
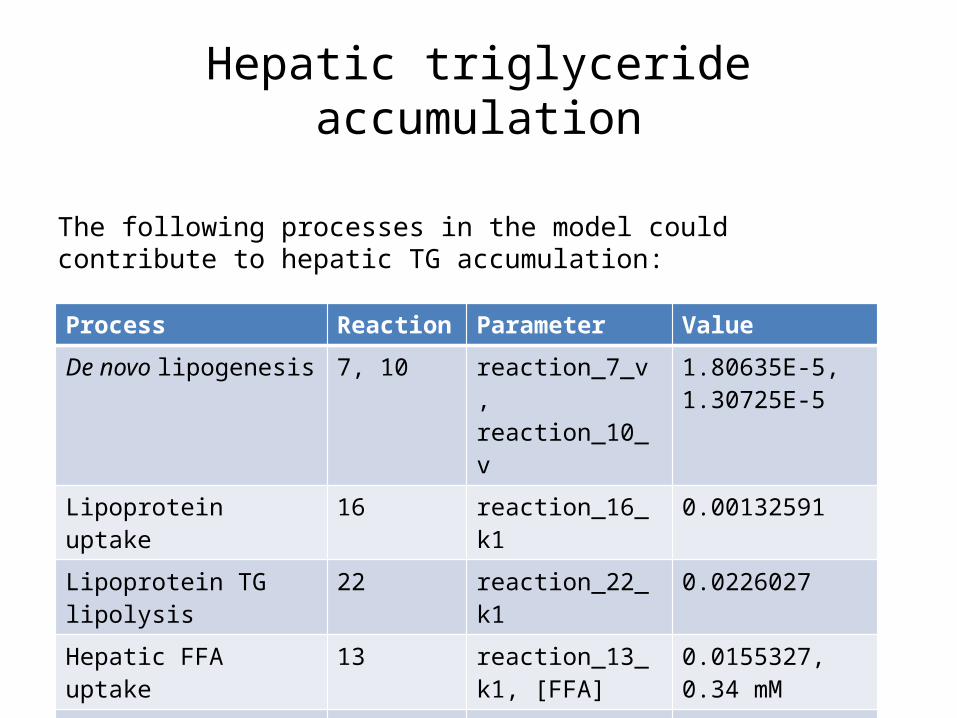
The following processes in the model could contribute to hepatic TG accumulation:
Hepatic triglyceride accumulation
Process Reaction Parameter Value
De novo lipogenesis 7, 10 reaction_7_v, reaction_10_v
1.80635E-5, 1.30725E-5
Lipoprotein uptake 16 reaction_16_k1 0.00132591
Lipoprotein TG lipolysis 22 reaction_22_k1 0.0226027
Hepatic FFA uptake 13 reaction_13_k1, [FFA]
0.0155327,0.34 mM
VLDL production 14 reaction_14_k1 0.019342
Hepatic TG hydrolysis 8, 11 reaction_8_k1, reaction_11_k1
0.701735, 0.340947
Hepatic triglyceride accumulation
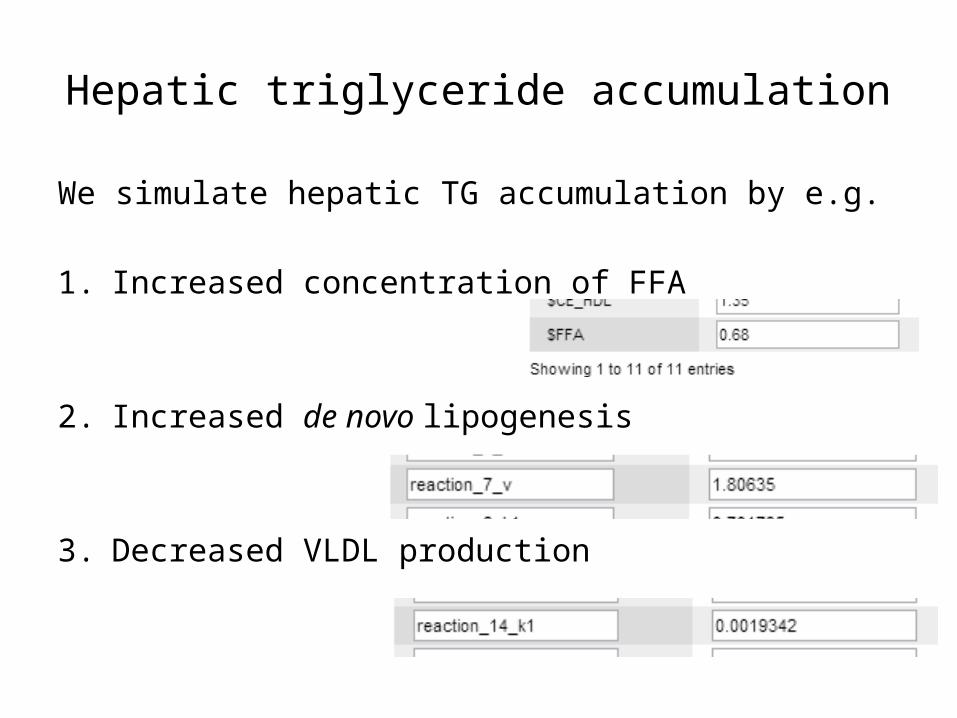
We simulate hepatic TG accumulation by e.g.
1. Increased concentration of FFA
2. Increased de novo lipogenesis
3. Decreased VLDL production
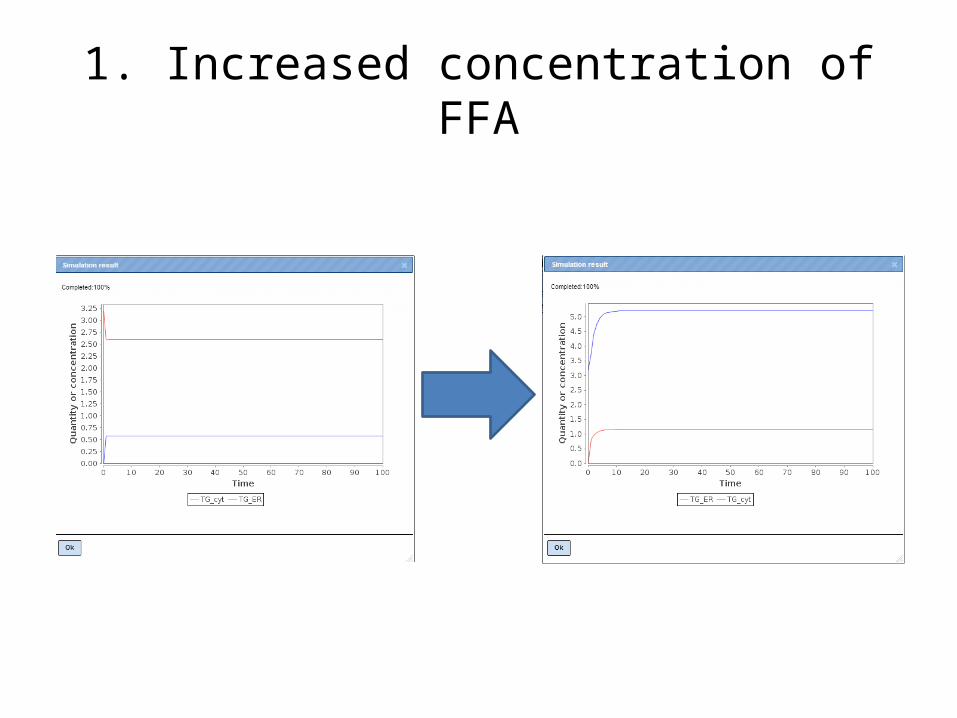
1. Increased concentration of FFA
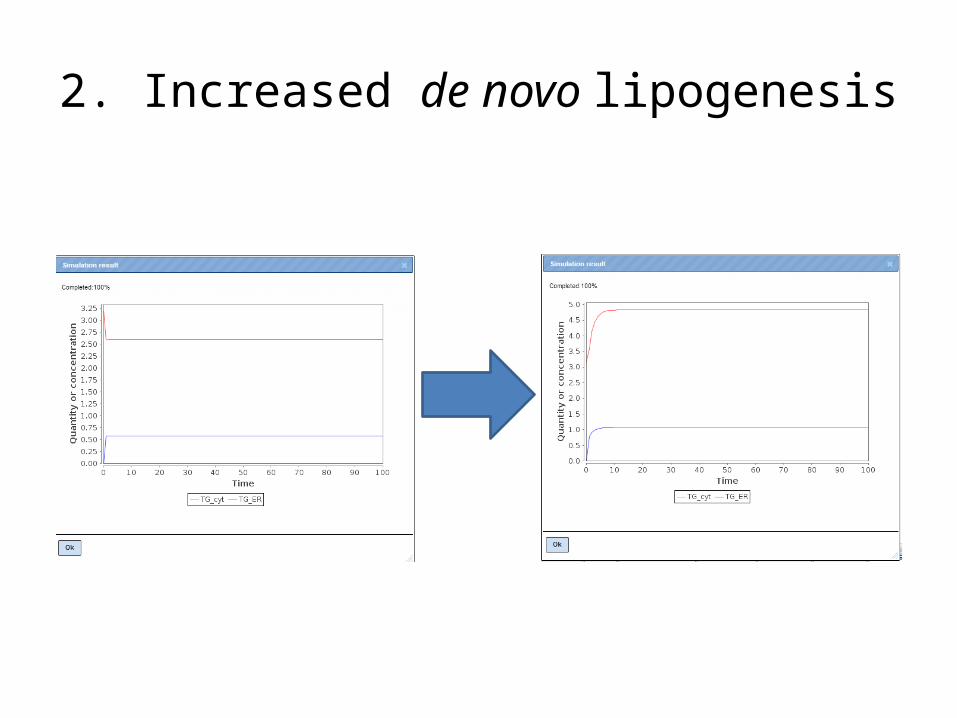
2. Increased de novo lipogenesis
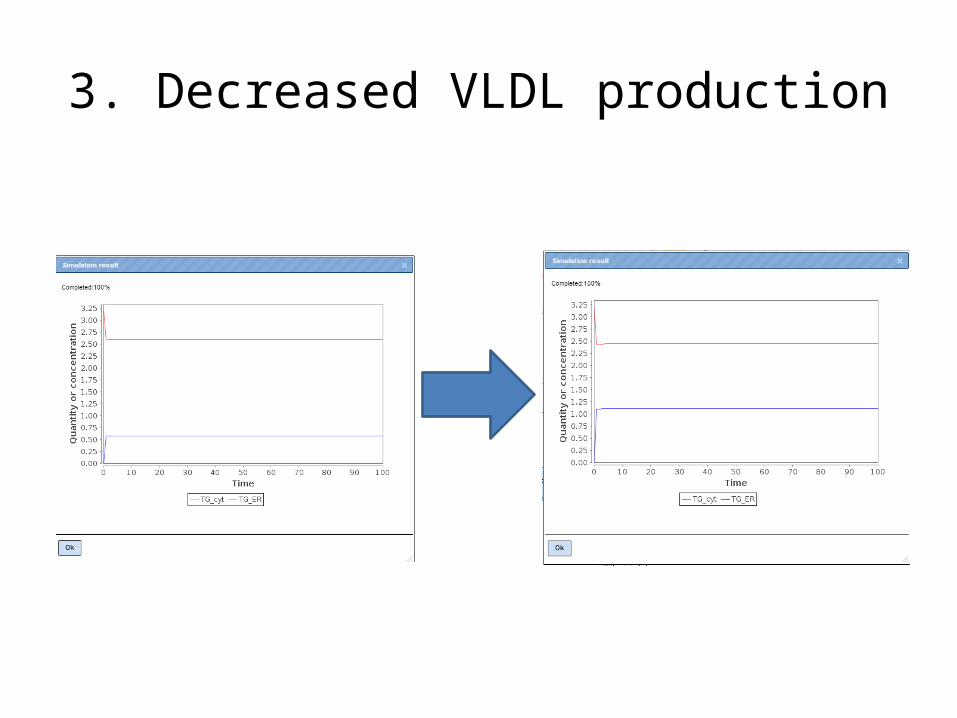
3. Decreased VLDL production
Hepatic triglyceride accumulation
Note the differences in
• The order of magnitude of change of the parameter to cause a quantitatively similar effect
• The compartment in which the accumulation is seen
cbio.bmt.tue.nl/resolve