Embed Size (px)
Citation preview

Modelling and managing urban water demand through smart meters: Benefits and challenges
from current research and emerging trends
Andrea Cominola, Matteo Giuliani, Andrea Castelletti, Dario Piga, Andrea E. Rizzoli

US246.2
Urban population in millions
81%Urban percentage
Mexico84.392
77%
Colombia34.373%
Brazil162.685%
Argentina35.690%
Ukraine30.968%
Russia103.673%
China559.2
Urban population in millions
42%Urban percentage
Turkey51.168%
India329.329%
Bangladesh38.226%
Philippines55.064%
Indonesia114.150%
S Korea39.081%
Japan84.766%
Egypt33.143%
S Africa28.660%
Canada26.3
Venezuela26.0
Poland23.9
Thailand21.5
Australia18.3
Netherlands13.3
Peru21.0
Saudi Arabia20.9
Iraq20.3 Vietnam
23.3
DR Congo20.2
Algeria22.0Morocco
19.4
Malaysia18.1
Burma16.5
Sudan16.3
Chile14.6
N Korea14.1
Ethiopia13.0
Uzbekistan10.1
Tanzania9.9
Romania11.6
Ghana11.3
Syria10.2
Belgium10.2
80%
94%
62%
33%
89%
81%
73%
81%
67%
27%
33%
65%60%
69%
32%
43%
88%
62%
16%
37%
25%
54%
49%
51%
97%
Nigeria68.650%
UK54.090%
France46.977%
Spain33.677%
Italy39.668%
Germany62.075%
Iran48.468%
Pakistan59.336%
Cameroon
AngolaEcuador
IvoryCoast
Kazakh-stan
Cuba
Afghan-istan
Sweden
Kenya
CzechRepublic
9.5
9.38.7
8.6
8.6
8.5
7.8
7.6
7.6
7.4
Mozam-bique
HongKong
Belarus
Tunisia
Hungary
Greece
Israel
Guate-mala
Portugal
Yemen
DominicanRepublic
Bolivia
Serbia &Mont
Switzer-land
Austria
Bulgaria
Mada-gascar
Libya
Senegal
Jordan
Zimbabwe
Nepal
Denmark
Mali
Azerbaijan
Singapore
ElSalvador
Zambia
Uganda
PuertoRico
Paraguay
UAE
Benin
Norway
NewZealand
Honduras
Haiti
Nicaragua
Guinea
Finland
Uruguay
Lebanon
Somalia
Sri Lanka
Cambodia
Slovakia
Costa Rica
Palestine
Kuwait
Togo
ChadBurkina
Ireland
Croatia
Congo
Niger
Sierra Leone
Malawi
Panama
Turkmenistan
Georgia
Lithuania
Liberia
Moldova
Rwanda
Kyrgyzstan
Oman
ArmeniaBosnia
Tajikistan
CAR
Melanesia
Latvia
Mongolia
Albania
Jamaica
Macedonia
Mauritania Laos
Gabon
Botswana
Slovenia
Eritrea
Estonia
Gambia
Burundi
Papua New Guinea
NamibiaMauritius
Guinea-Bissau
Lesotho E Timor
Bhutan
Swaziland
Trinidad & Tobago
The earth reaches a momentous milestone: by next year, for the first time in history, more than half its population will be living in cities. Those 3.3 billion people are expected to grow to 5 billion by 2030 — this unique map of the world shows where those people live now
At the beginning of the 20th century, the world's urban population was only 220 million, mainly in the west
By 2030, the towns and cities of the developing world will make up 80% of urban humanity
The new urban world
Urban growth, 2005—2010
Predominantly urban75% or over
Predominantly urban50—74%
Predominantly rural25—49% urban
Predominantly rural0—24% urban
Cities over 10 million people(greater urban area)
Key
Tokyo33.4
Osaka16.6
Seoul23.2
Manila15.4
Jakarta14.9
Dacca 13.8
Bombay21.3
Delhi21.1 Calcutta
15.5
Karachi14.8
Shanghai17.3
Canton14.5
Beijing12.7
Moscow13.4
Tehran12.1
Cairo15.9
Istanbul11.7
London12.0
Lagos10.0
MexicoCity22.1
New York21.8
Sao Paulo20.4
LA17.9
Rio deJaneiro
12.2
BuenosAires13.5 3,307,950,000
The world’s urban population — from a total of 6,615.9 million SOURCE: UNFPA GRAPHIC: PAUL SCRUTONAfrica Asia Oceania Europe0.1%
Eastern Europe-0.4%
Arab StatesLatin America& Caribbean North America
3.2%2.4%
1.3%
2.8%
1.7%1.3%
Urban population is growing
Source: United Nations Population Fund, 2007

2000 2030 2050
+130%
Source: United Nations. Department of Economic and Social Affairs. Population Division, 2010 Leflaive, X., et al. (2012), "Water", in OECD, OECD Environmental Outlook to 2050: The Consequences of Inaction, OECD Publishing, Paris.
Dom
estic
water
dem
and
… and so urban water demand
41 megacities worldwide

city/district scale
TECHNOLOGICAL (e.g., water efficient devices)FINANCIAL (e.g., water price schemes, incentives)LEGISLATIVE (e.g., water usage restrictions)OPERATION & MAINTENANCE (e.g., leak detection)EDUCATION (e.g., water awareness campaigns, workshops)
Water Demand Management Strategies (WDMS)

TECHNOLOGICAL (e.g., water efficient devices)FINANCIAL (e.g., water price schemes, incentives)LEGISLATIVE (e.g., water usage restrictions)OPERATION & MAINTENANCE (e.g., leak detection)EDUCATION (e.g., water awareness campaigns, workshops)
Water Demand Management Strategies (WDMS)
customized WDMS
?


Which stakeholders will benefit from smart metering deployments?

UK_WATER SUPPLY UTILITY15 million customers2.6 Gl/day drinking water3 billion $ revenue (2013-14)
water utilities
Stakeholders involved

water utilities economy
Stakeholders involved
2014 global water meter market worth $2.6 billion 2018 increased to just over $3 billion
Smart Water Networks Can Save Utilities Worldwide up to $12.5 Billion Annually Concludes Global Survey and White Paper Released by Sensus

water utilities economy consumers
Stakeholders involved

What is the current state-of-the-art of urban Water Demand Management?

1990 1994
50
30
10
1995 1999
2000 2004
2005 2009
2010 2015
Benefits and challenges of using smart meters for advancingresidential water demand modeling and management: A review
A. Cominola a, M. Giuliani a, D. Piga b, A. Castelletti a, c, *, A.E. Rizzoli da Department of Electronics, Information, and Bioengineering, Politecnico di Milano, Milan, Italyb IMT Institute for Advanced Studies Lucca, Lucca, Italyc Institute of Environmental Engineering, ETH Zurich, Zurich, Switzerlandd Istituto Dalle Molle di Studi sull'Intelligenza Artificiale, SUPSI-USI, Lugano, Switzerland
a r t i c l e i n f o
Article history:Received 2 April 2015Received in revised form21 July 2015Accepted 21 July 2015Available online xxx
Keywords:Smart meterResidential water managementWater demand modelingWater conservation
a b s t r a c t
Over the last two decades, water smart metering programs have been launched in a number of mediumto large cities worldwide to nearly continuously monitor water consumption at the single householdlevel. The availability of data at such very high spatial and temporal resolution advanced the ability incharacterizing, modeling, and, ultimately, designing user-oriented residential water demand manage-ment strategies. Research to date has been focusing on one or more of these aspects but with limitedintegration between the specialized methodologies developed so far. This manuscript is the firstcomprehensive review of the literature in this quickly evolving water research domain. The papercontributes a general framework for the classification of residential water demand modeling studies,which allows revising consolidated approaches, describing emerging trends, and identifying potentialfuture developments. In particular, the future challenges posed by growing population demands, con-strained sources of water supply and climate change impacts are expected to require more and moreintegrated procedures for effectively supporting residential water demand modeling and management inseveral countries across the world.
© 2015 Elsevier Ltd. All rights reserved.
1. Introduction
World's urban population is expected to raise from current54%e66% in 2050 and to further increase as a consequence of theunlikely stabilization of human population by the end of the cen-tury (Gerland et al., 2014). By 2030 the number of mega-cities,namely cities with more than 10 million inhabitants, will growover 40 (UNDESA, 2010). This will boost residential water demand(Cosgrove and Cosgrove, 2012), which nowadays covers a largeportion of the public drinking water supply worldwide (e.g.,60e80% in Europe (Collins et al., 2009), 58% in the United States(Kenny et al., 2009)).
The concentration of the water demands of thousands or mil-lions of people into small areas will considerably raise the stress onfinite supplies of available freshwater (McDonald et al., 2011a).Besides, climate and land use change will further increase the
number of people facingwater shortage (McDonald et al., 2011b). Insuch context, water supply expansion through the construction ofnew infrastructures might be an option to escape water stress insome situations. Yet, geographical or financial limitations largelyrestrict such options in most countries (McDonald et al., 2014).Here, acting on the water demand management side through thepromotion of cost-effective water-saving technologies, revisedeconomic policies, appropriate national and local regulations, andeducation represents an alternative strategy for securing reliablewater supply and reduce water utilities' costs (Gleick et al., 2003).
In recent years, a variety of water demand management stra-tegies (WDMS) has been applied (for a review, see Inman andJeffrey, 2006, and references therein). However, the effectivenessof these WDMS is often context-specific and strongly depends onour understanding of the drivers inducing people to consume orsave water (Jorgensen et al., 2009). Models that quantitativelydescribe how water demand is influenced and varies in relation toexogenous uncontrolled drivers (e.g., seasonality, climatic condi-tions) and demand management actions (e.g., water restrictions,pricing schemes, education campaigns) are essential to explorewater users' response to alternative WDMS, ultimately supporting
* Corresponding author. Department of Electronics, Information, and Bioengi-neering, Politecnico di Milano, Milan, Italy.
E-mail address: [email protected] (A. Castelletti).
Contents lists available at ScienceDirect
Environmental Modelling & Software
journal homepage: www.elsevier .com/locate/envsoft
http://dx.doi.org/10.1016/j.envsoft.2015.07.0121364-8152/© 2015 Elsevier Ltd. All rights reserved.
Environmental Modelling & Software 72 (2015) 198e214
134 studies over the last 25 years
A quick journey in the literature
Benefits and challenges of using smart meters for advancingresidential water demand modeling and management: A review
A. Cominola a, M. Giuliani a, D. Piga b, A. Castelletti a, c, *, A.E. Rizzoli da Department of Electronics, Information, and Bioengineering, Politecnico di Milano, Milan, Italyb IMT Institute for Advanced Studies Lucca, Lucca, Italyc Institute of Environmental Engineering, ETH Zurich, Zurich, Switzerlandd Istituto Dalle Molle di Studi sull'Intelligenza Artificiale, SUPSI-USI, Lugano, Switzerland
a r t i c l e i n f o
Article history:Received 2 April 2015Received in revised form21 July 2015Accepted 21 July 2015Available online xxx
Keywords:Smart meterResidential water managementWater demand modelingWater conservation
a b s t r a c t
Over the last two decades, water smart metering programs have been launched in a number of mediumto large cities worldwide to nearly continuously monitor water consumption at the single householdlevel. The availability of data at such very high spatial and temporal resolution advanced the ability incharacterizing, modeling, and, ultimately, designing user-oriented residential water demand manage-ment strategies. Research to date has been focusing on one or more of these aspects but with limitedintegration between the specialized methodologies developed so far. This manuscript is the firstcomprehensive review of the literature in this quickly evolving water research domain. The papercontributes a general framework for the classification of residential water demand modeling studies,which allows revising consolidated approaches, describing emerging trends, and identifying potentialfuture developments. In particular, the future challenges posed by growing population demands, con-strained sources of water supply and climate change impacts are expected to require more and moreintegrated procedures for effectively supporting residential water demand modeling and management inseveral countries across the world.
© 2015 Elsevier Ltd. All rights reserved.
1. Introduction
World's urban population is expected to raise from current54%e66% in 2050 and to further increase as a consequence of theunlikely stabilization of human population by the end of the cen-tury (Gerland et al., 2014). By 2030 the number of mega-cities,namely cities with more than 10 million inhabitants, will growover 40 (UNDESA, 2010). This will boost residential water demand(Cosgrove and Cosgrove, 2012), which nowadays covers a largeportion of the public drinking water supply worldwide (e.g.,60e80% in Europe (Collins et al., 2009), 58% in the United States(Kenny et al., 2009)).
The concentration of the water demands of thousands or mil-lions of people into small areas will considerably raise the stress onfinite supplies of available freshwater (McDonald et al., 2011a).Besides, climate and land use change will further increase the
number of people facingwater shortage (McDonald et al., 2011b). Insuch context, water supply expansion through the construction ofnew infrastructures might be an option to escape water stress insome situations. Yet, geographical or financial limitations largelyrestrict such options in most countries (McDonald et al., 2014).Here, acting on the water demand management side through thepromotion of cost-effective water-saving technologies, revisedeconomic policies, appropriate national and local regulations, andeducation represents an alternative strategy for securing reliablewater supply and reduce water utilities' costs (Gleick et al., 2003).
In recent years, a variety of water demand management stra-tegies (WDMS) has been applied (for a review, see Inman andJeffrey, 2006, and references therein). However, the effectivenessof these WDMS is often context-specific and strongly depends onour understanding of the drivers inducing people to consume orsave water (Jorgensen et al., 2009). Models that quantitativelydescribe how water demand is influenced and varies in relation toexogenous uncontrolled drivers (e.g., seasonality, climatic condi-tions) and demand management actions (e.g., water restrictions,pricing schemes, education campaigns) are essential to explorewater users' response to alternative WDMS, ultimately supporting
* Corresponding author. Department of Electronics, Information, and Bioengi-neering, Politecnico di Milano, Milan, Italy.
E-mail address: [email protected] (A. Castelletti).
Contents lists available at ScienceDirect
Environmental Modelling & Software
journal homepage: www.elsevier .com/locate/envsoft
http://dx.doi.org/10.1016/j.envsoft.2015.07.0121364-8152/© 2015 Elsevier Ltd. All rights reserved.
Environmental Modelling & Software 72 (2015) 198e214

36%
43%
13%6%
<1%
Smart meters deployment sites worldwide

quarterly / half yearly basis readings
1 kilolitre (=1m3)
Billed-based approach
Traditional water meters

Smart meters
Smart meters resolution: 72 pulses/L (=72k pulses/m3 )Data logging resolution: 5-10 s intervalInformation on time-of-day for consumption
Smart water meters

Traditional vs Smart water meters
Oct Nov Dec
Wat
er c
onsu
mpt
ion
m3
?

Traditional vs Smart water meters
Oct
Wat
er c
onsu
mpt
ion
m3
?Nov Dec
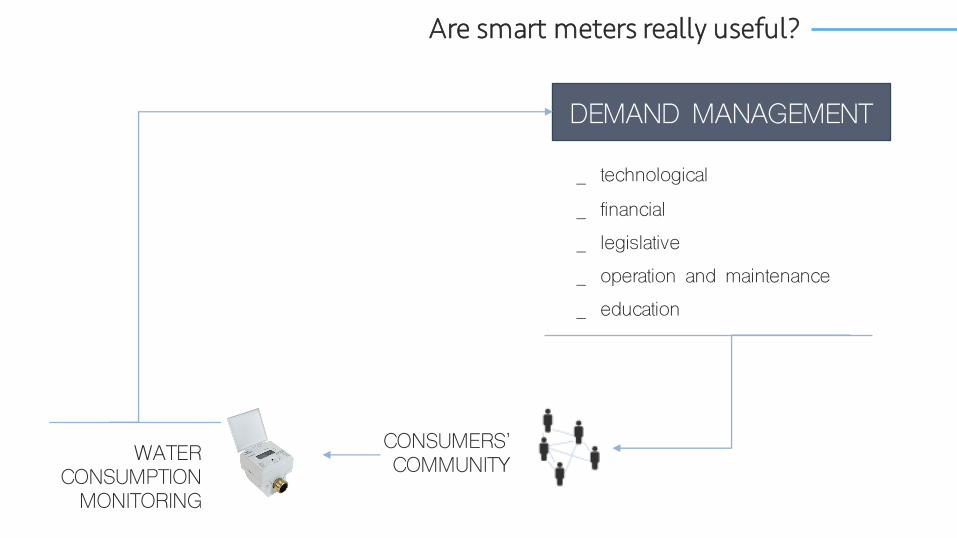
Are smart meters really useful?
DEMAND MANAGEMENT
_ technological
_ financial_ legislative_ operation and maintenance_ education
CONSUMERS’ COMMUNITYWATER
CONSUMPTION MONITORING

Including user modelling in the loop
CUSTOMIZED DEMAND MANAGEMENT
_ technological
_ financial_ legislative_ operation and maintenance_ education
CONSUMERS’ COMMUNITYWATER
CONSUMPTION MONITORING
USER MODELLING
_ WATER CONSUMPTION_ PSYCHOGRAPHIC DATA_ RESPONSE TO WDMS

Including user modelling in the loop
CUSTOMIZED DEMAND MANAGEMENTUSER MODELLING
_ WATER CONSUMPTION_ PSYCHOGRAPHIC DATA_ RESPONSE TO WDMS
AgeIncome levelEducation levelHousehold compositionWater devices efficiencyPresence of garden/swimming poolEnvironmental commitment
ToiletShower
DishwasherWashing machine
GardenSwimming pool

How do we build this model?The main challenges

Water consumption
CUSTOMIZED DEMAND MANAGEMENTUSER MODELLING
_ WATER CONSUMPTION_ PSYCHOGRAPHIC DATA_ RESPONSE TO WDMS
MAIN CHALLENGES
_ Big data management

Water consumption
CUSTOMIZED DEMAND MANAGEMENT
MAIN CHALLENGES
_ Big data management -> Data resolution
47%
12%
8%
7%
25%
001 minute
55%
1%7%
9%
28%
005 minutes
37%
16% 7%
10%
30%
015 minutes
28%
26% 10%
9%
27%
030 minutes
31%
21% 11%
9%
27%
060 minutes
HPE
CDE CDE CDE CDE CDE CDE CDE
HPE HPE HPE HPE HPE HPEhighest contribution
lowest contribution
47%
12%
9%
8%
23%
Groundtruth
HPE
CDE CDE CDE CDE CDE CDE CDE
HPE HPE HPE HPE HPE HPEhighest contribution
lowest contribution
CDE (clothes dryer)
FRE (Furnace)HPE (Heat pump)
FGE (Fridge)EQE (Security/Network)
HPE
CDE CDE CDE CDE CDE CDE CDE
HPE HPE HPE HPE HPE HPEhighest contribution
lowest contribution

End-use water consumption characterization
CUSTOMIZED DEMAND MANAGEMENTUSER MODELLING
_ WATER CONSUMPTION_ PSYCHOGRAPHIC DATA_ RESPONSE TO WDMS
ToiletShower
DishwasherWashing machine
GardenSwimming pool
MAIN CHALLENGES
_ Big data management -> Data resolution_ Intrusiveness (single-point VS on-device sensors)

End-use water consumption characterization
CUSTOMIZED DEMAND MANAGEMENTUSER MODELLING
_ WATER CONSUMPTION_ PSYCHOGRAPHIC DATA_ RESPONSE TO WDMS
ToiletShower
DishwasherWashing machine
GardenSwimming pool
MAIN CHALLENGES
_ Big data management -> Data resolution_ Intrusiveness (single-point VS on-device sensors)_ Costs_ Privacy

Users’ psychographics
CUSTOMIZED DEMAND MANAGEMENTUSER MODELLING
_ WATER CONSUMPTION_ PSYCHOGRAPHIC DATA_ RESPONSE TO WDMS
AgeIncome levelEducation levelHousehold compositionWater devices efficiencyPresence of garden/swimming poolEnvironmental commitment

Users’ psychographics
CUSTOMIZED DEMAND MANAGEMENTUSER MODELLING
_ WATER CONSUMPTION_ PSYCHOGRAPHIC DATA_ RESPONSE TO WDMS
AgeIncome levelEducation levelHousehold compositionWater devices efficiencyPresence of garden/swimming poolEnvironmental commitment
SURVEYS CAMPAIGNS – MAIN CHALLENGES:
_ Intrusiveness_ Data update in time -> temporary occupancy, devices upgrades, …

Users’ response to external stimuli and WDMS
CUSTOMIZED DEMAND MANAGEMENTUSER MODELLING
_ WATER CONSUMPTION_ PSYCHOGRAPHIC DATA_ RESPONSE TO WDMS

meter type data resolution end-usedisaggregation user profiling WDMS and program
duration
Users’ response to external stimuli and WDMS

meter type end-usedisaggregationdata resolution
WDMS and program duration
Users’ response to external stimuli and WDMS
MAIN CHALLENGES
_ Few studies experimenting/testing WDMS

meter type end-usedisaggregationdata resolution
WDMS and program duration
Users’ response to external stimuli and WDMS
MAIN CHALLENGES
_ Few studies experimenting/testing WDMS
_ Short term experiments -> No rebound effect

SINGLE-POINT Smart meters

SINGLE-POINT Smart meters
Consumption dataREPOSITORY• Privacy• Security

SmartH2O
SINGLE-POINT Smart meters
Consumption dataREPOSITORY• Privacy• Security
WATER DATA END-USE ANALYTICS

SmartH2O
SINGLE-POINT Smart meters
Consumption dataREPOSITORY• Privacy• Security
WATER DATA END-USE ANALYTICS
CONSUMERS PORTAL
CUSTOMER SEGMENTATION

SmartH2O
SINGLE-POINT Smart meters
Consumption dataREPOSITORY• Privacy• Security
WATER DATA END-USE ANALYTICS
CONSUMERS PORTALENGAGEMENT AND BEHAVIOURAL CHANGE
CUSTOMER SEGMENTATION

LONDON | UKThames Water water supply utility
15 million customers served3 Million smart meters installed by 2030
LOCARNO | CHSocietà Elettrica Sopracenerina
multi-utility smart metering (water, energy, gas)
400 smart water meters installed
VALENCIA | ESEMIVASA water supply utility 2 million customers served
490,000 water smart meters currently installed650,000 water smart meters installed by end 2015
The use cases

Discussion
_ To which extent are smart meters useful?
_ Are utilities really interested in saving water?
_ Is social influence relevant for water efficient behaviours?
_ How to monitor WDMS effect on the long term?
_ Water price elasticity?
_ Water and energy nexus?
_ Can gamification support behavioural change?

http://www.smarth2o-fp7.eu/
Andrea [email protected]
Politecnico di MilanoDepartment of Electronics,
Information and Bioengineering
@smartH2Oproject #SmartH2O@NRMPolimi@AndreaCominola
thank you


![Modelling web applications WebML versus UML829008/FULLTEXT01.pdf · crucial. UML is a response to the emerging needs, a visual modelling language for building systems [OMG01]. 2.2](https://img.pdfslide.net/doc/110x75/5e92d2716a1aea0a96649bc7/modelling-web-applications-webml-versus-829008fulltext01pdf-crucial-uml-is.jpg)