Embed Size (px)
Citation preview
GIS: ArcMAP 10.1
The City University of New YorkArchitectural Technology Dept.
written by Alihan Polat & Andrea GarridoBasics in GIS
April 14, 2015
This material is based upon work supported by the National Science Foundation under Grant Numbers 1141234.
Any opinions, findings, and conclusions or recommendations expressed in this material are those of the author(s) and do not necessarily reflect the views of the National Science Foundation.
GIS: ArcMAP 10.13
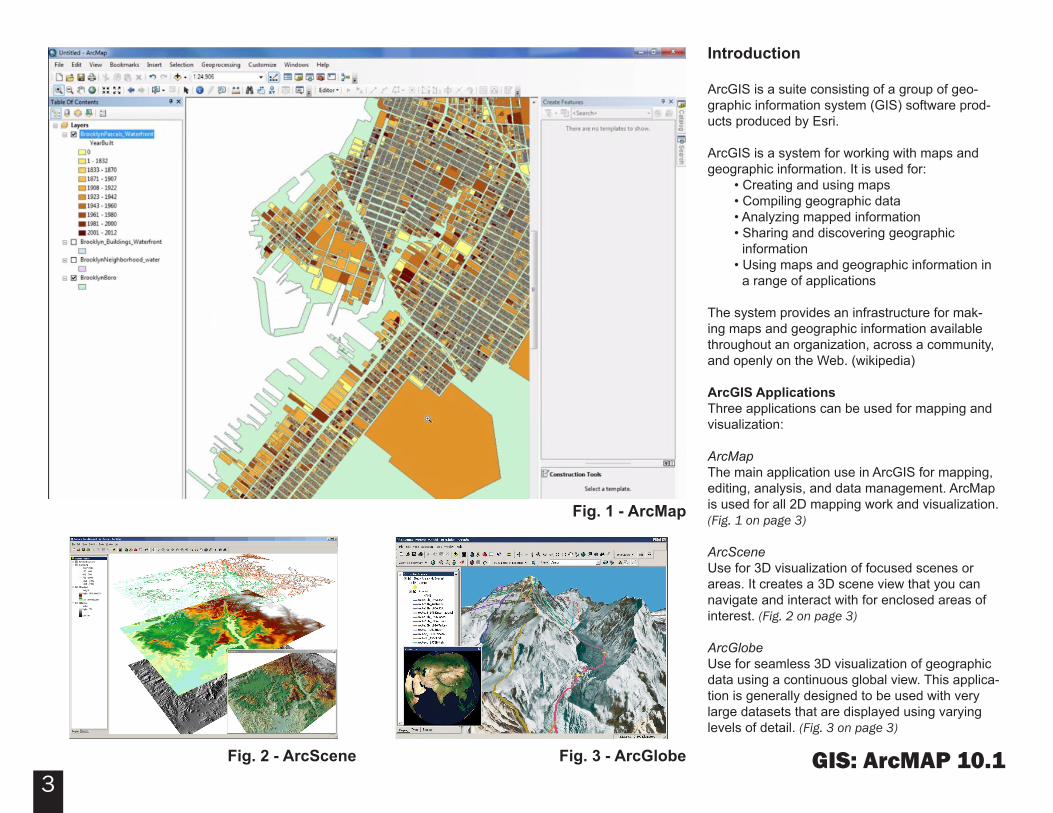
Fig. 1 - ArcMap
Fig. 2 - ArcScene Fig. 3 - ArcGlobe
Introduction
ArcGIS is a suite consisting of a group of geo-graphic information system (GIS) software prod-ucts produced by Esri.
ArcGIS is a system for working with maps and geographic information. It is used for:
• Creating and using maps• Compiling geographic data• Analyzing mapped information• Sharing and discovering geographic
information• Using maps and geographic information in
a range of applications
The system provides an infrastructure for mak-ing maps and geographic information available throughout an organization, across a community,and openly on the Web. (wikipedia)
ArcGIS ApplicationsThree applications can be used for mapping and visualization:
ArcMap The main application use in ArcGIS for mapping, editing, analysis, and data management. ArcMap is used for all 2D mapping work and visualization.(Fig. 1 on page 3)
ArcSceneUse for 3D visualization of focused scenes or areas. It creates a 3D scene view that you can navigate and interact with for enclosed areas of interest. (Fig. 2 on page 3)
ArcGlobeUse for seamless 3D visualization of geographic data using a continuous global view. This applica-tion is generally designed to be used with very large datasets that are displayed using varying levels of detail. (Fig. 3 on page 3)
GIS: ArcMAP 10.14
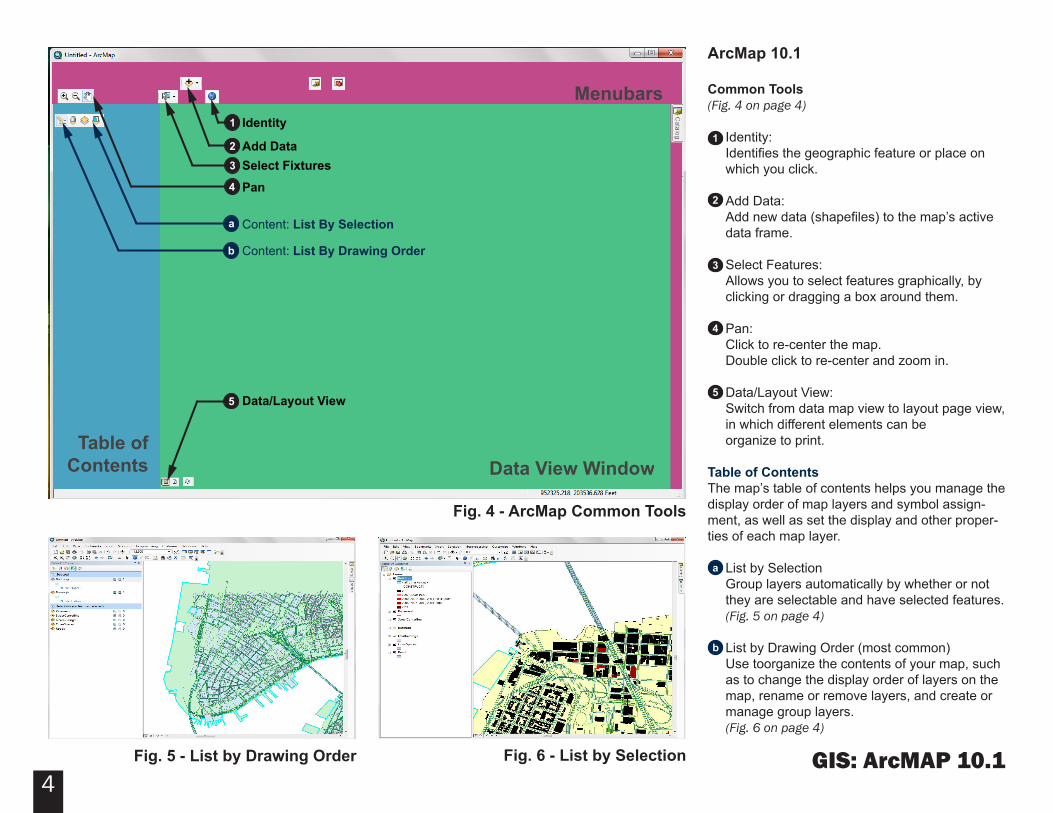
Fig. 4 - ArcMap Common Tools
Fig. 5 - List by Drawing Order Fig. 6 - List by Selection
ArcMap 10.1
Common Tools (Fig. 4 on page 4)
Identity: Identifies the geographic feature or place on which you click. Add Data: Add new data (shapefiles) to the map’s active data frame.
Select Features: Allows you to select features graphically, by clicking or dragging a box around them.
Pan: Click to re-center the map. Double click to re-center and zoom in.
Data/Layout View: Switch from data map view to layout page view, in which different elements can be organize to print.
Table of ContentsThe map’s table of contents helps you manage the display order of map layers and symbol assign-ment, as well as set the display and other proper-ties of each map layer.
List by SelectionGroup layers automatically by whether or not they are selectable and have selected features. (Fig. 5 on page 4)
List by Drawing Order (most common)Use toorganize the contents of your map, such as to change the display order of layers on the map, rename or remove layers, and create or manage group layers. (Fig. 6 on page 4)
Data View WindowTable of
Contents
Menubars
Add Data
Identity
Select FixturesPan
Data/Layout View
Content: List By Selection
Content: List By Drawing Order
1
2
3
4
5
a
b
1
3
2
4
a
5
b
GIS: ArcMAP 10.15
Fig. 8 - ArcCatalog Fig. 9 - ArcToolbox
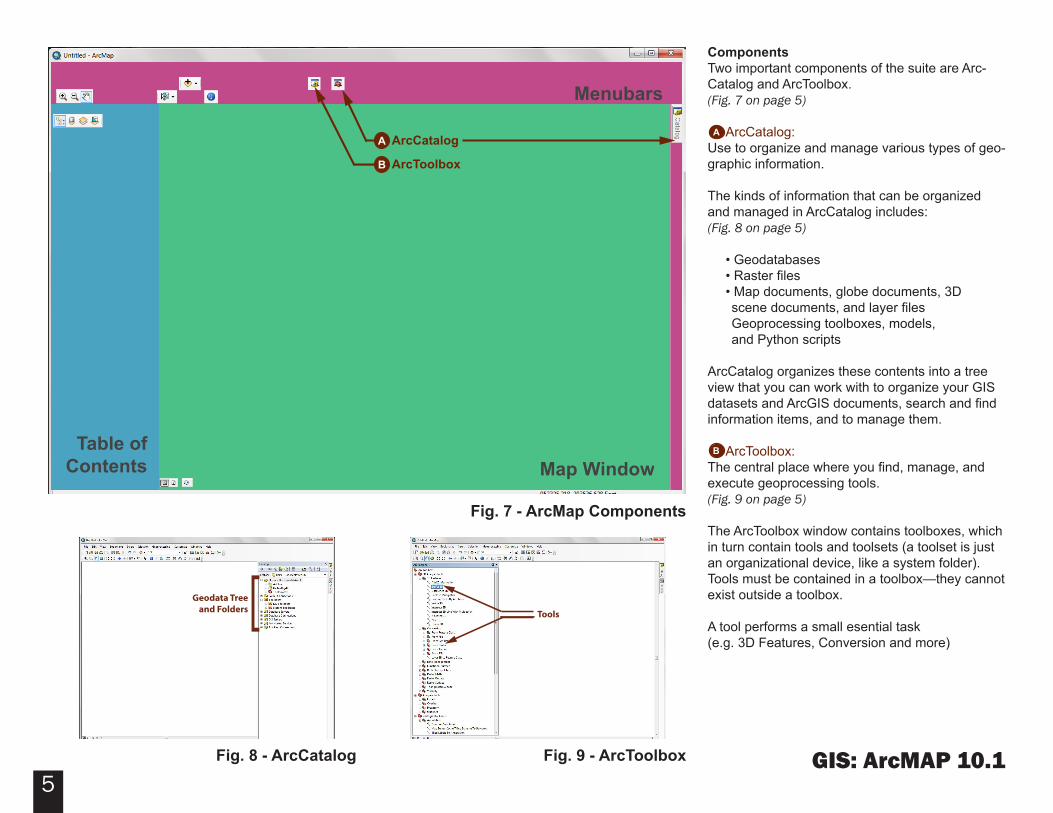
Fig. 7 - ArcMap Components
Tools[Geodata Treeand Folders
Map WindowTable of
Contents
Menubars
ArcCatalog
ArcToolbox
A
B
Components Two important components of the suite are Arc-Catalog and ArcToolbox.(Fig. 7 on page 5)
ArcCatalog: Use to organize and manage various types of geo-graphic information.
The kinds of information that can be organized and managed in ArcCatalog includes:(Fig. 8 on page 5)
• Geodatabases • Raster files • Map documents, globe documents, 3D scene documents, and layer files Geoprocessing toolboxes, models, and Python scripts
ArcCatalog organizes these contents into a tree view that you can work with to organize your GIS datasets and ArcGIS documents, search and find information items, and to manage them.
ArcToolbox: The central place where you find, manage, and execute geoprocessing tools. (Fig. 9 on page 5)
The ArcToolbox window contains toolboxes, which in turn contain tools and toolsets (a toolset is just an organizational device, like a system folder). Tools must be contained in a toolbox—they cannot exist outside a toolbox.
A tool performs a small esential task (e.g. 3D Features, Conversion and more)
A
B
GIS: ArcMAP 10.16
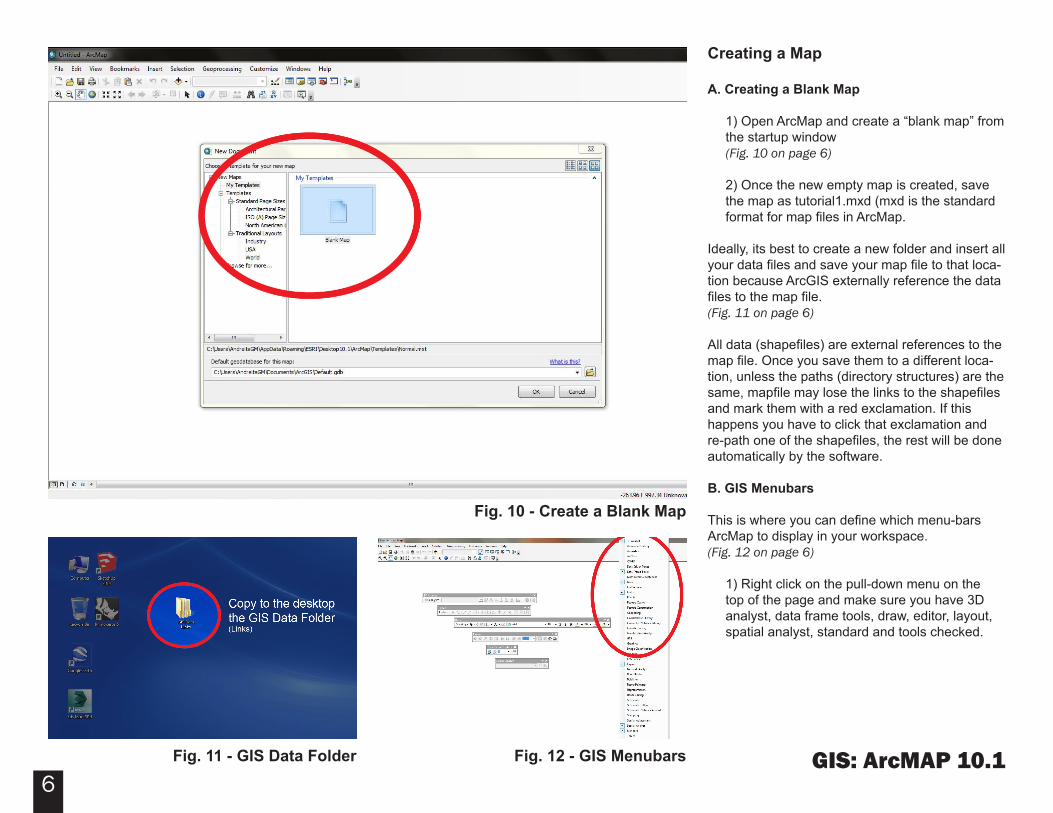
Fig. 10 - Create a Blank Map
Fig. 11 - GIS Data Folder Fig. 12 - GIS Menubars
Creating a Map
A. Creating a Blank Map
1) Open ArcMap and create a “blank map” from the startup window (Fig. 10 on page 6)
2) Once the new empty map is created, save the map as tutorial1.mxd (mxd is the standard format for map files in ArcMap.
Ideally, its best to create a new folder and insert all your data files and save your map file to that loca-tion because ArcGIS externally reference the data files to the map file. (Fig. 11 on page 6)
All data (shapefiles) are external references to the map file. Once you save them to a different loca-tion, unless the paths (directory structures) are the same, mapfile may lose the links to the shapefiles and mark them with a red exclamation. If this happens you have to click that exclamation and re-path one of the shapefiles, the rest will be done automatically by the software.
B. GIS Menubars
This is where you can define which menu-bars ArcMap to display in your workspace. (Fig. 12 on page 6)
1) Right click on the pull-down menu on the top of the page and make sure you have 3D analyst, data frame tools, draw, editor, layout, spatial analyst, standard and tools checked.
GIS: ArcMAP 10.17
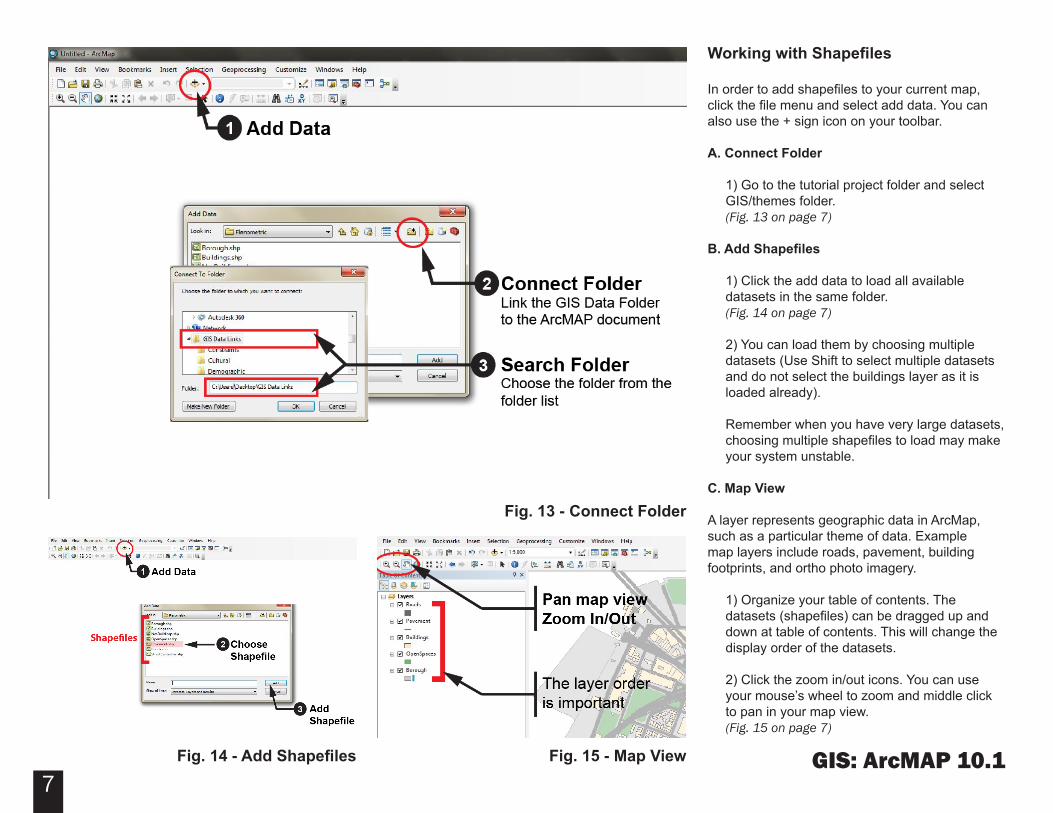
Fig. 13 - Connect Folder
Fig. 14 - Add Shapefiles Fig. 15 - Map View
Working with Shapefiles
In order to add shapefiles to your current map, click the file menu and select add data. You can also use the + sign icon on your toolbar.
A. Connect Folder
1) Go to the tutorial project folder and select GIS/themes folder. (Fig. 13 on page 7)
B. Add Shapefiles
1) Click the add data to load all available datasets in the same folder. (Fig. 14 on page 7)
2) You can load them by choosing multiple datasets (Use Shift to select multiple datasets and do not select the buildings layer as it is loaded already).
Remember when you have very large datasets, choosing multiple shapefiles to load may make your system unstable.
C. Map View
A layer represents geographic data in ArcMap, such as a particular theme of data. Example map layers include roads, pavement, building footprints, and ortho photo imagery.
1) Organize your table of contents. The datasets (shapefiles) can be dragged up and down at table of contents. This will change the display order of the datasets.
2) Click the zoom in/out icons. You can use your mouse’s wheel to zoom and middle click to pan in your map view. (Fig. 15 on page 7)
GIS: ArcMAP 10.18
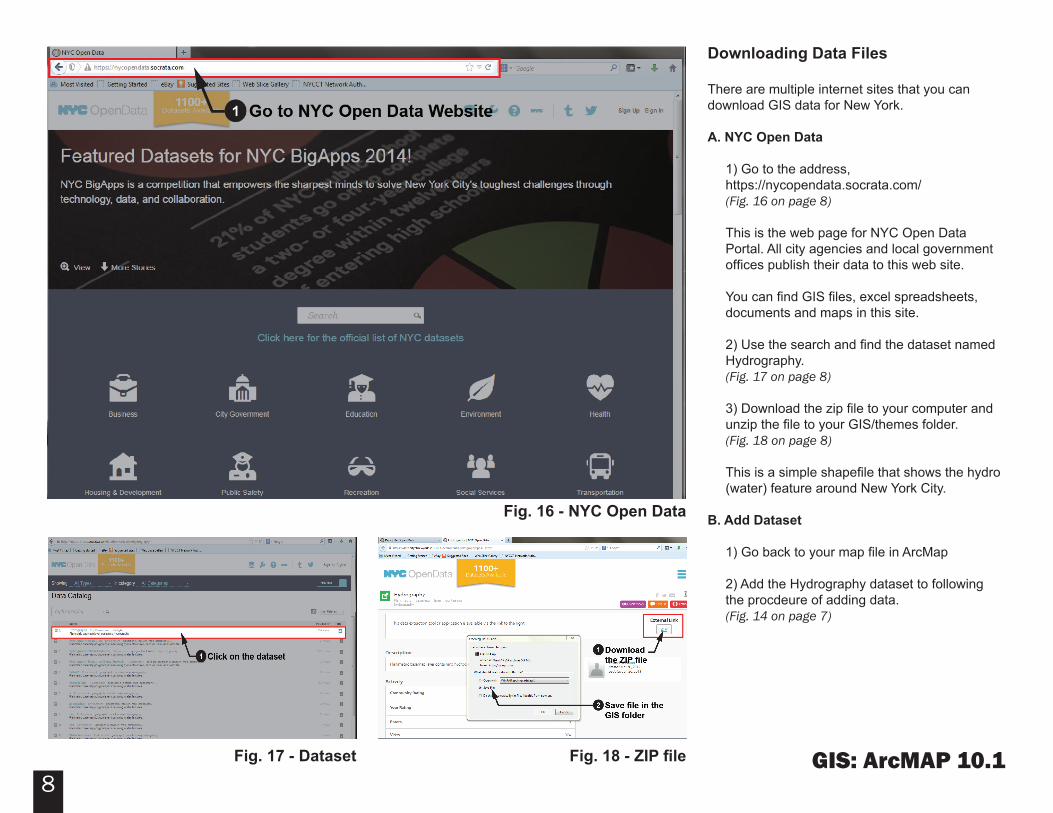
Fig. 16 - NYC Open Data
Fig. 17 - Dataset Fig. 18 - ZIP file
Downloading Data Files
There are multiple internet sites that you can download GIS data for New York.
A. NYC Open Data
1) Go to the address,https://nycopendata.socrata.com/(Fig. 16 on page 8)
This is the web page for NYC Open Data Portal. All city agencies and local government offices publish their data to this web site.
You can find GIS files, excel spreadsheets, documents and maps in this site.
2) Use the search and find the dataset named Hydrography. (Fig. 17 on page 8)
3) Download the zip file to your computer and unzip the file to your GIS/themes folder. (Fig. 18 on page 8)
This is a simple shapefile that shows the hydro (water) feature around New York City.
B. Add Dataset
1) Go back to your map file in ArcMap
2) Add the Hydrography dataset to following the procdeure of adding data.(Fig. 14 on page 7)
GIS: ArcMAP 10.19
Fig. 19 - Open Attribute Table
Fig. 20 - Attribute Table Fig. 21 - Selected Records
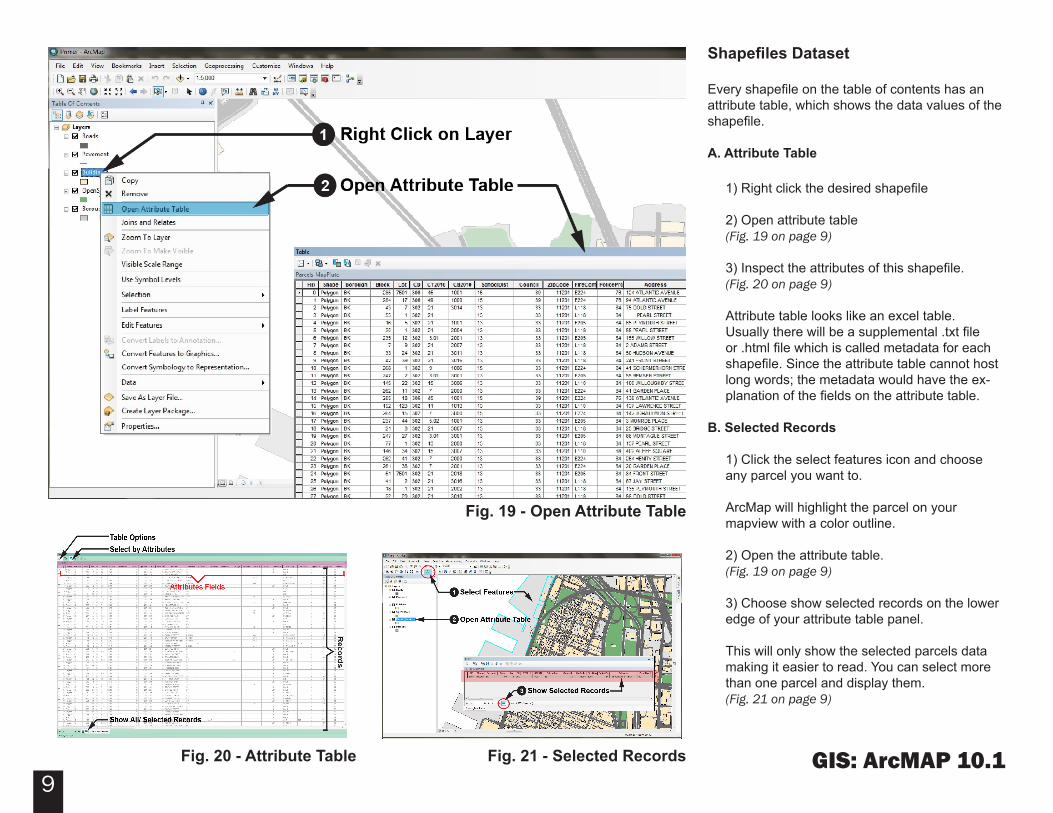
Shapefiles Dataset
Every shapefile on the table of contents has an attribute table, which shows the data values of the shapefile.
A. Attribute Table
1) Right click the desired shapefile
2) Open attribute table(Fig. 19 on page 9)
3) Inspect the attributes of this shapefile.(Fig. 20 on page 9)
Attribute table looks like an excel table. Usually there will be a supplemental .txt file or .html file which is called metadata for each shapefile. Since the attribute table cannot host long words; the metadata would have the ex-planation of the fields on the attribute table.
B. Selected Records
1) Click the select features icon and choose any parcel you want to.
ArcMap will highlight the parcel on your mapview with a color outline.
2) Open the attribute table.(Fig. 19 on page 9)
3) Choose show selected records on the lower edge of your attribute table panel.
This will only show the selected parcels data making it easier to read. You can select more than one parcel and display them. (Fig. 21 on page 9)
GIS: ArcMAP 10.110
Fig. 22 - Selection Types
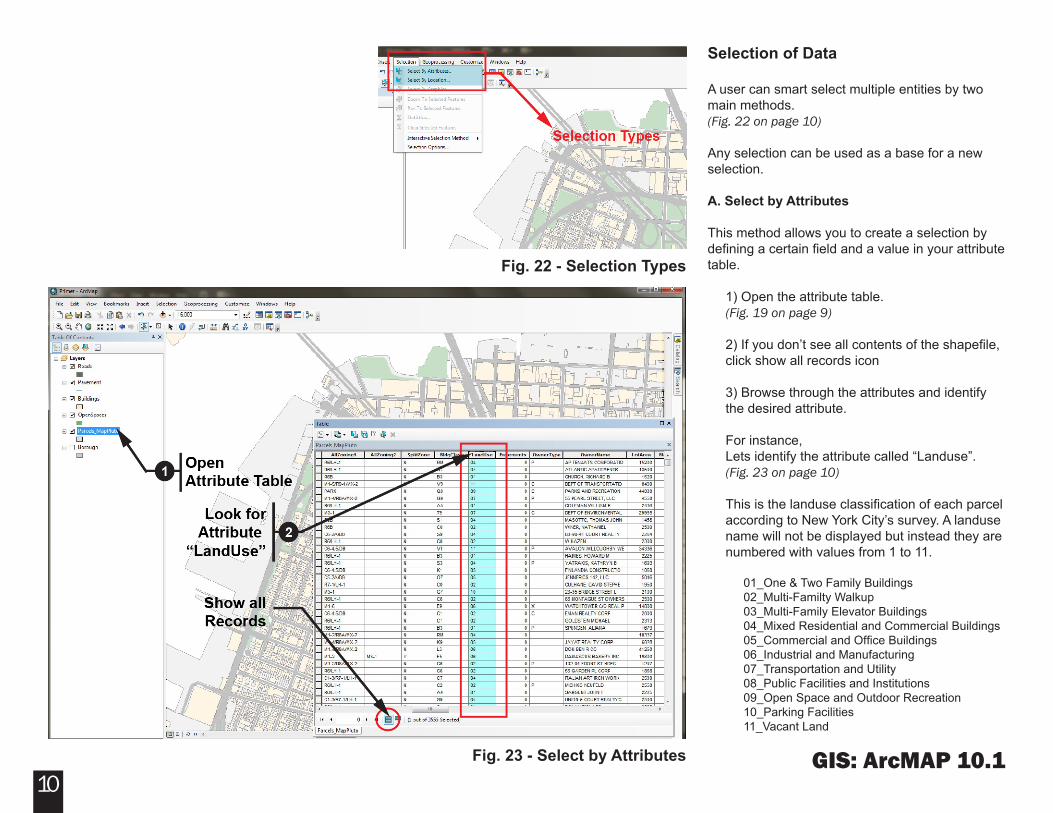
Selection of Data
A user can smart select multiple entities by two main methods. (Fig. 22 on page 10)
Any selection can be used as a base for a new selection.
A. Select by Attributes
This method allows you to create a selection by defining a certain field and a value in your attribute table.
1) Open the attribute table. (Fig. 19 on page 9)
2) If you don’t see all contents of the shapefile, click show all records icon
3) Browse through the attributes and identify the desired attribute.
For instance, Lets identify the attribute called “Landuse”. (Fig. 23 on page 10)
This is the landuse classification of each parcel according to New York City’s survey. A landuse name will not be displayed but instead they are numbered with values from 1 to 11.
01_One & Two Family Buildings 02_Multi-Familty Walkup03_Multi-Family Elevator Buildings04_Mixed Residential and Commercial Buildings05_Commercial and Office Buildings06_Industrial and Manufacturing07_Transportation and Utility08_Public Facilities and Institutions09_Open Space and Outdoor Recreation10_Parking Facilities11_Vacant Land
Fig. 23 - Select by Attributes
GIS: ArcMAP 10.111
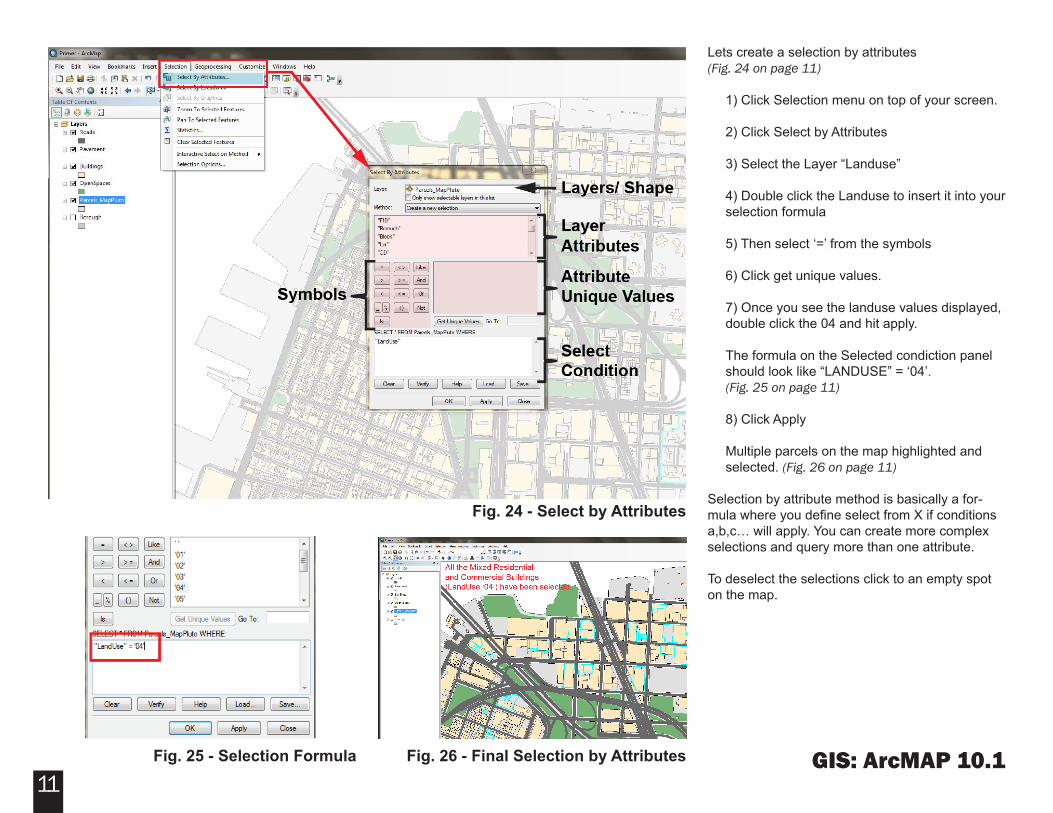
Lets create a selection by attributes(Fig. 24 on page 11)
1) Click Selection menu on top of your screen.
2) Click Select by Attributes
3) Select the Layer “Landuse”
4) Double click the Landuse to insert it into your selection formula
5) Then select ‘=’ from the symbols
6) Click get unique values.
7) Once you see the landuse values displayed, double click the 04 and hit apply.
The formula on the Selected condiction panel should look like “LANDUSE” = ‘04’.(Fig. 25 on page 11)
8) Click Apply
Multiple parcels on the map highlighted and selected. (Fig. 26 on page 11)
Selection by attribute method is basically a for-mula where you define select from X if conditions a,b,c… will apply. You can create more complex selections and query more than one attribute.
To deselect the selections click to an empty spot on the map.
Fig. 24 - Select by Attributes
Fig. 25 - Selection Formula Fig. 26 - Final Selection by Attributes
GIS: ArcMAP 10.112
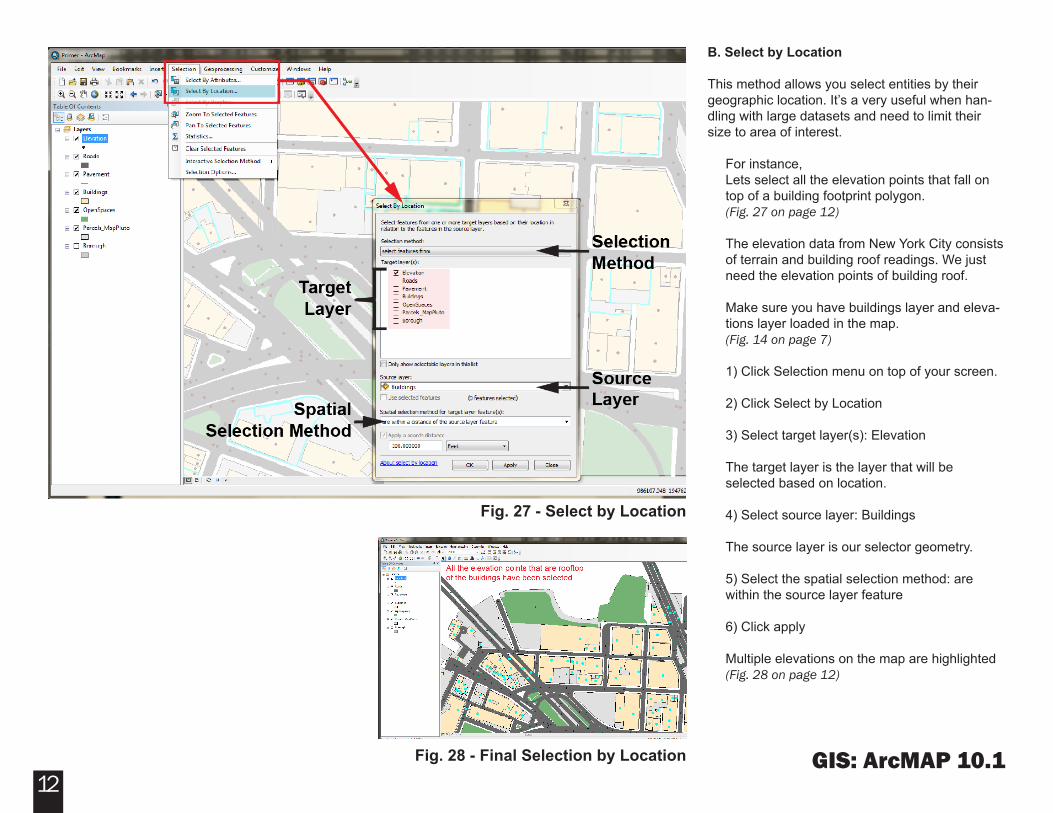
B. Select by Location
This method allows you select entities by their geographic location. It’s a very useful when han-dling with large datasets and need to limit their size to area of interest.
For instance,Lets select all the elevation points that fall on top of a building footprint polygon. (Fig. 27 on page 12)
The elevation data from New York City consists of terrain and building roof readings. We just need the elevation points of building roof.
Make sure you have buildings layer and eleva-tions layer loaded in the map. (Fig. 14 on page 7)
1) Click Selection menu on top of your screen.
2) Click Select by Location
3) Select target layer(s): Elevation
The target layer is the layer that will be selected based on location.
4) Select source layer: Buildings
The source layer is our selector geometry.
5) Select the spatial selection method: are within the source layer feature
6) Click apply
Multiple elevations on the map are highlighted(Fig. 28 on page 12)
Fig. 27 - Select by Location
Fig. 28 - Final Selection by Location
GIS: ArcMAP 10.113
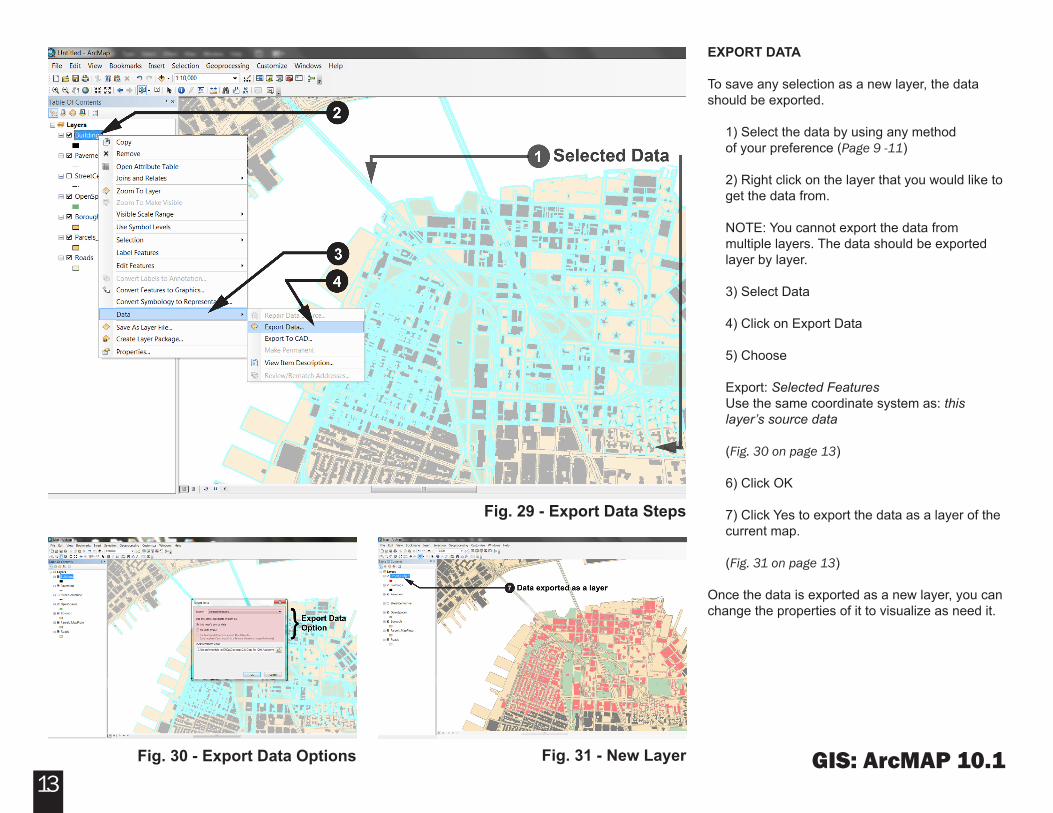
EXPORT DATA
To save any selection as a new layer, the data should be exported.
1) Select the data by using any method of your preference (Page 9 -11)
2) Right click on the layer that you would like to get the data from.
NOTE: You cannot export the data from multiple layers. The data should be exported layer by layer.
3) Select Data
4) Click on Export Data
5) Choose
Export: Selected Features Use the same coordinate system as: this layer’s source data
(Fig. 30 on page 13)
6) Click OK
7) Click Yes to export the data as a layer of the current map.
(Fig. 31 on page 13)
Once the data is exported as a new layer, you can change the properties of it to visualize as need it.
Fig. 29 - Export Data Steps
Fig. 30 - Export Data Options Fig. 31 - New Layer
GIS: ArcMAP 10.114
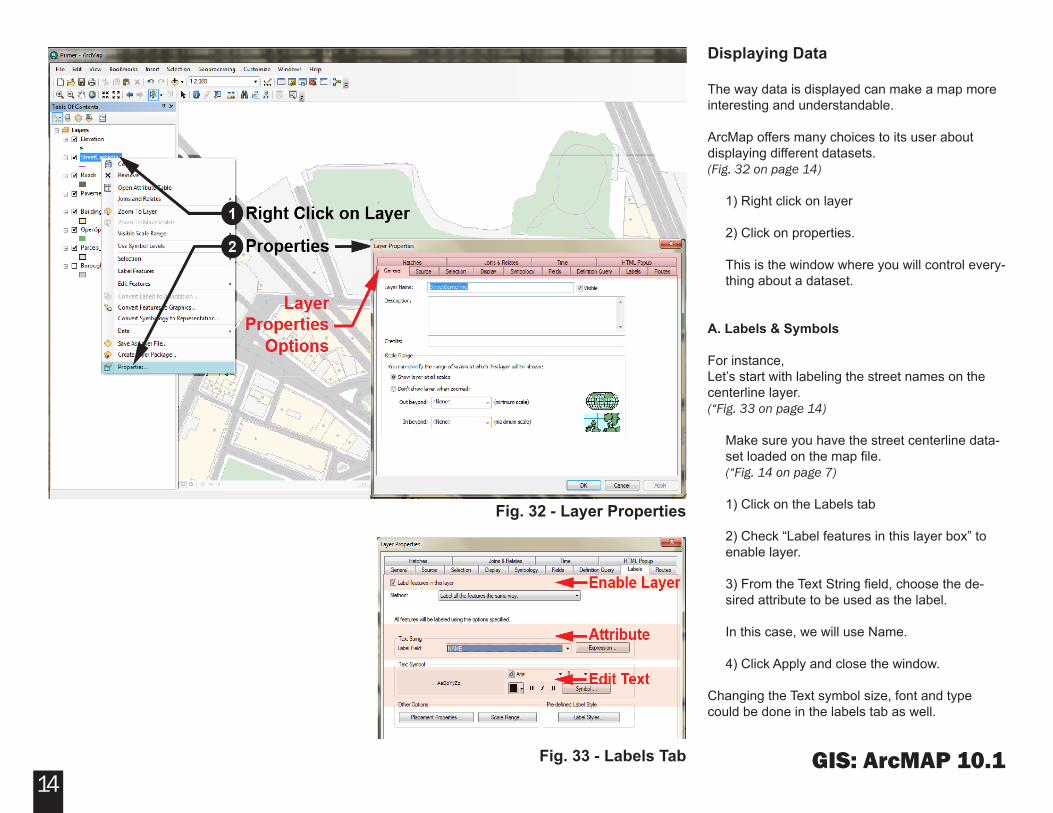
Displaying Data
The way data is displayed can make a map more interesting and understandable.
ArcMap offers many choices to its user about displaying different datasets. (Fig. 32 on page 14)
1) Right click on layer
2) Click on properties.
This is the window where you will control every-thing about a dataset.
A. Labels & Symbols
For instance,Let’s start with labeling the street names on the centerline layer. (“Fig. 33 on page 14)
Make sure you have the street centerline data-set loaded on the map file. (“Fig. 14 on page 7)
1) Click on the Labels tab
2) Check “Label features in this layer box” to enable layer.
3) From the Text String field, choose the de-sired attribute to be used as the label.
In this case, we will use Name.
4) Click Apply and close the window.
Changing the Text symbol size, font and type could be done in the labels tab as well.
Fig. 32 - Layer Properties
Fig. 33 - Labels Tab
GIS: ArcMAP 10.115
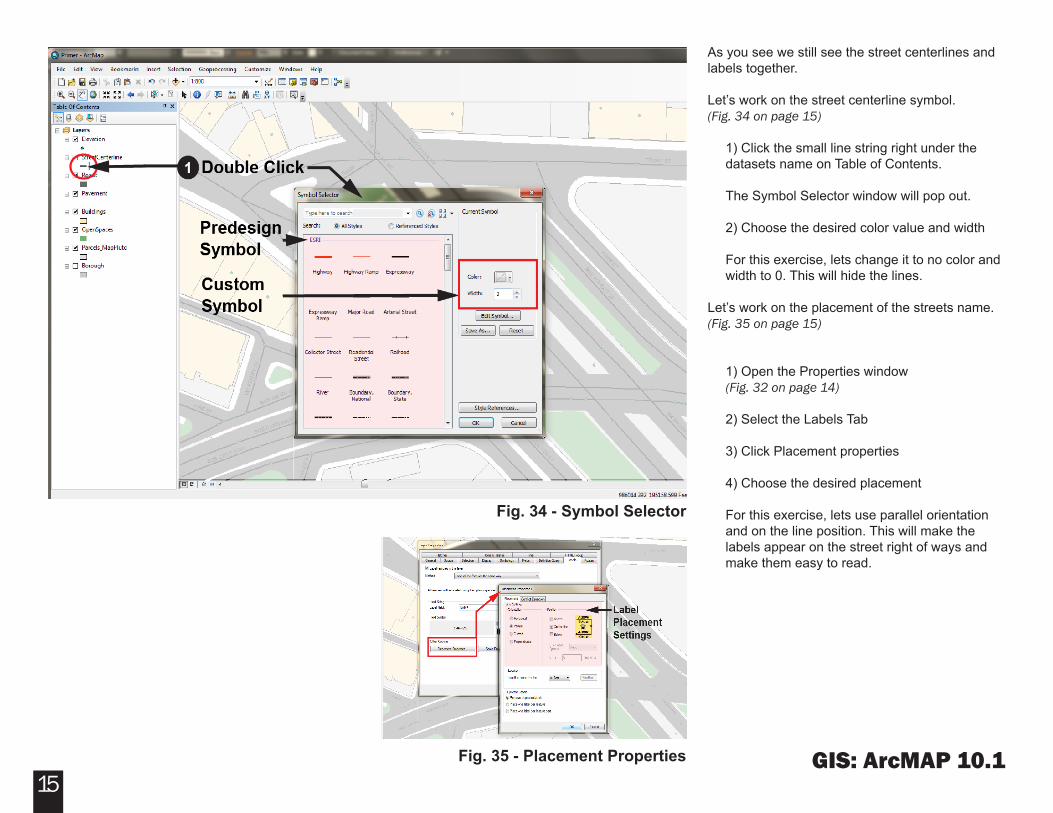
As you see we still see the street centerlines and labels together.
Let’s work on the street centerline symbol.(Fig. 34 on page 15)
1) Click the small line string right under the datasets name on Table of Contents.
The Symbol Selector window will pop out.
2) Choose the desired color value and width
For this exercise, lets change it to no color and width to 0. This will hide the lines.
Let’s work on the placement of the streets name.(Fig. 35 on page 15)
1) Open the Properties window(Fig. 32 on page 14)
2) Select the Labels Tab
3) Click Placement properties
4) Choose the desired placement
For this exercise, lets use parallel orientation and on the line position. This will make the labels appear on the street right of ways and make them easy to read.
Fig. 34 - Symbol Selector
Fig. 35 - Placement Properties
GIS: ArcMAP 10.116
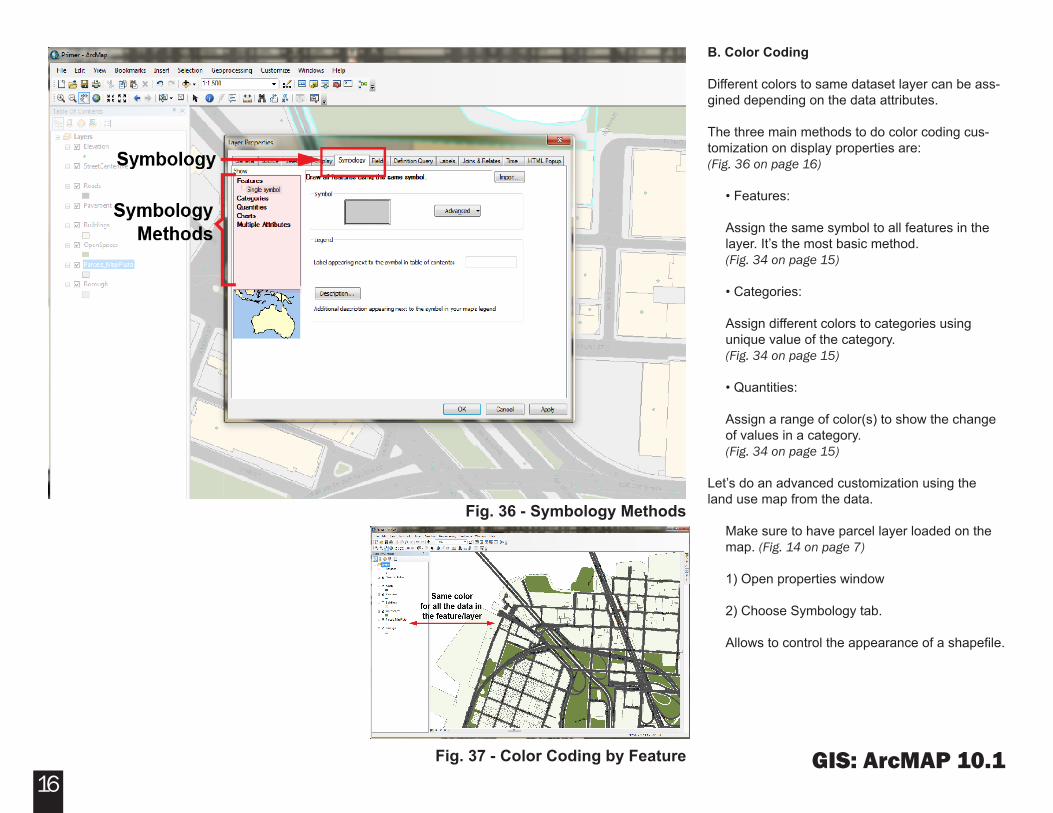
B. Color Coding
Different colors to same dataset layer can be ass-gined depending on the data attributes.
The three main methods to do color coding cus-tomization on display properties are: (Fig. 36 on page 16)
• Features:
Assign the same symbol to all features in the layer. It’s the most basic method.(Fig. 34 on page 15)
• Categories:
Assign different colors to categories using unique value of the category.(Fig. 34 on page 15)
• Quantities:
Assign a range of color(s) to show the change of values in a category. (Fig. 34 on page 15)
Let’s do an advanced customization using the land use map from the data.
Make sure to have parcel layer loaded on the map. (Fig. 14 on page 7)
1) Open properties window
2) Choose Symbology tab.
Allows to control the appearance of a shapefile.
Fig. 36 - Symbology Methods
Fig. 37 - Color Coding by Feature
GIS: ArcMAP 10.117
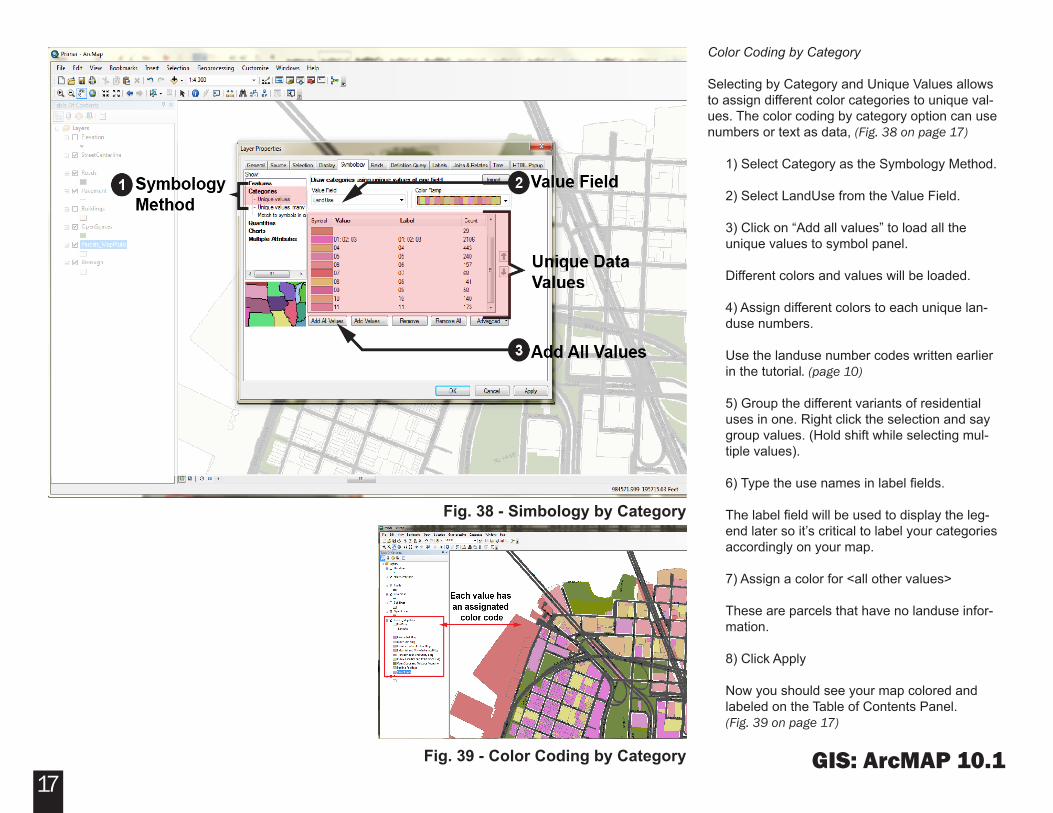
Color Coding by Category
Selecting by Category and Unique Values allows to assign different color categories to unique val-ues. The color coding by category option can use numbers or text as data, (Fig. 38 on page 17)
1) Select Category as the Symbology Method.
2) Select LandUse from the Value Field.
3) Click on “Add all values” to load all the unique values to symbol panel.
Different colors and values will be loaded.
4) Assign different colors to each unique lan-duse numbers.
Use the landuse number codes written earlier in the tutorial. (page 10)
5) Group the different variants of residential uses in one. Right click the selection and say group values. (Hold shift while selecting mul-tiple values).
6) Type the use names in label fields.
The label field will be used to display the leg-end later so it’s critical to label your categories accordingly on your map.
7) Assign a color for <all other values>
These are parcels that have no landuse infor-mation.
8) Click Apply
Now you should see your map colored and labeled on the Table of Contents Panel.(Fig. 39 on page 17)
Fig. 38 - Simbology by Category
Fig. 39 - Color Coding by Category
GIS: ArcMAP 10.118
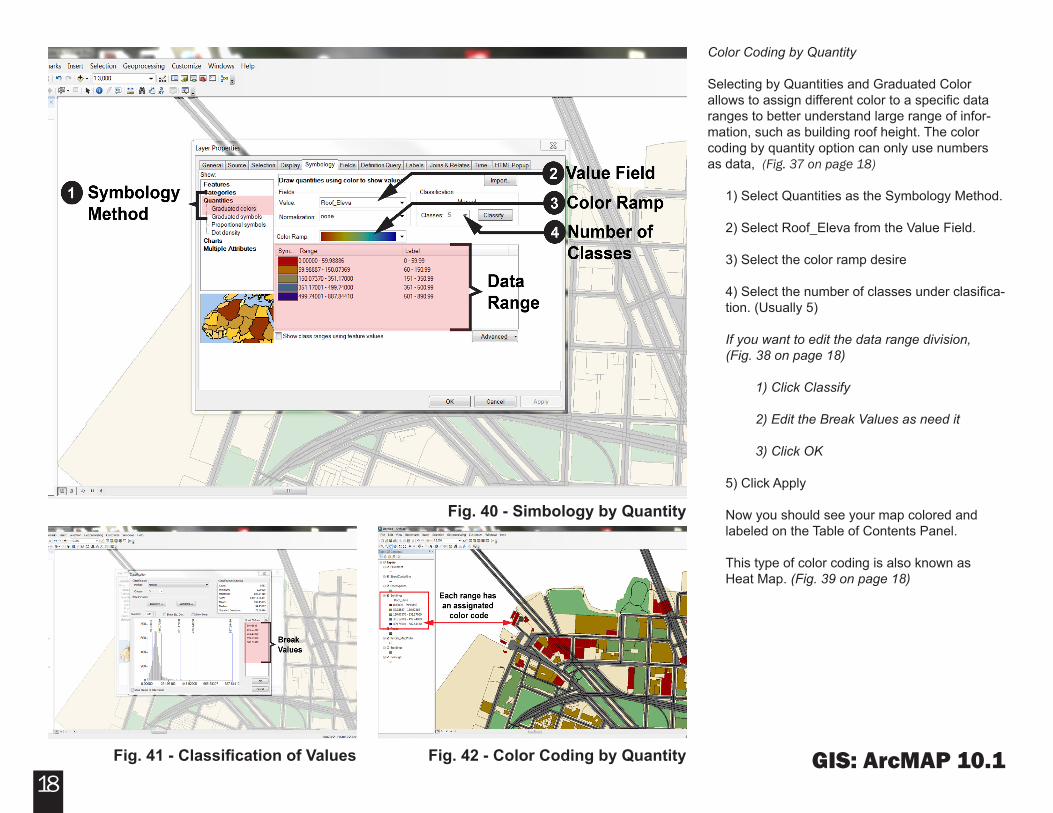
Color Coding by Quantity
Selecting by Quantities and Graduated Color allows to assign different color to a specific data ranges to better understand large range of infor-mation, such as building roof height. The color coding by quantity option can only use numbers as data, (Fig. 37 on page 18)
1) Select Quantities as the Symbology Method.
2) Select Roof_Eleva from the Value Field.
3) Select the color ramp desire
4) Select the number of classes under clasifica-tion. (Usually 5)
If you want to edit the data range division, (Fig. 38 on page 18)
1) Click Classify
2) Edit the Break Values as need it
3) Click OK
5) Click Apply
Now you should see your map colored and labeled on the Table of Contents Panel.
This type of color coding is also known as Heat Map. (Fig. 39 on page 18)
Fig. 40 - Simbology by Quantity
Fig. 41 - Classification of Values Fig. 42 - Color Coding by Quantity
GIS: ArcMAP 10.119
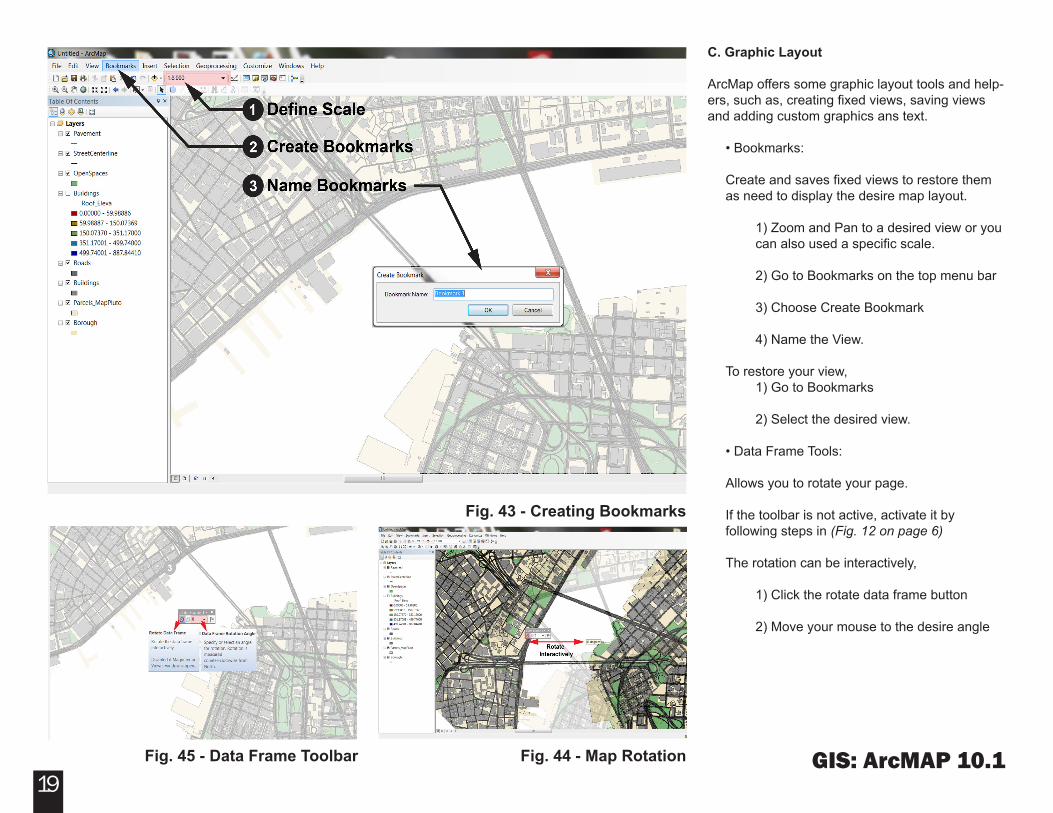
C. Graphic Layout
ArcMap offers some graphic layout tools and help-ers, such as, creating fixed views, saving views and adding custom graphics ans text.
• Bookmarks:
Create and saves fixed views to restore them as need to display the desire map layout.
1) Zoom and Pan to a desired view or you can also used a specific scale.
2) Go to Bookmarks on the top menu bar 3) Choose Create Bookmark
4) Name the View.
To restore your view, 1) Go to Bookmarks 2) Select the desired view.
• Data Frame Tools:
Allows you to rotate your page.
If the toolbar is not active, activate it byfollowing steps in (Fig. 12 on page 6)
The rotation can be interactively,
1) Click the rotate data frame button 2) Move your mouse to the desire angle
Fig. 43 - Creating Bookmarks
Fig. 44 - Map RotationFig. 45 - Data Frame Toolbar
GIS: ArcMAP 10.120
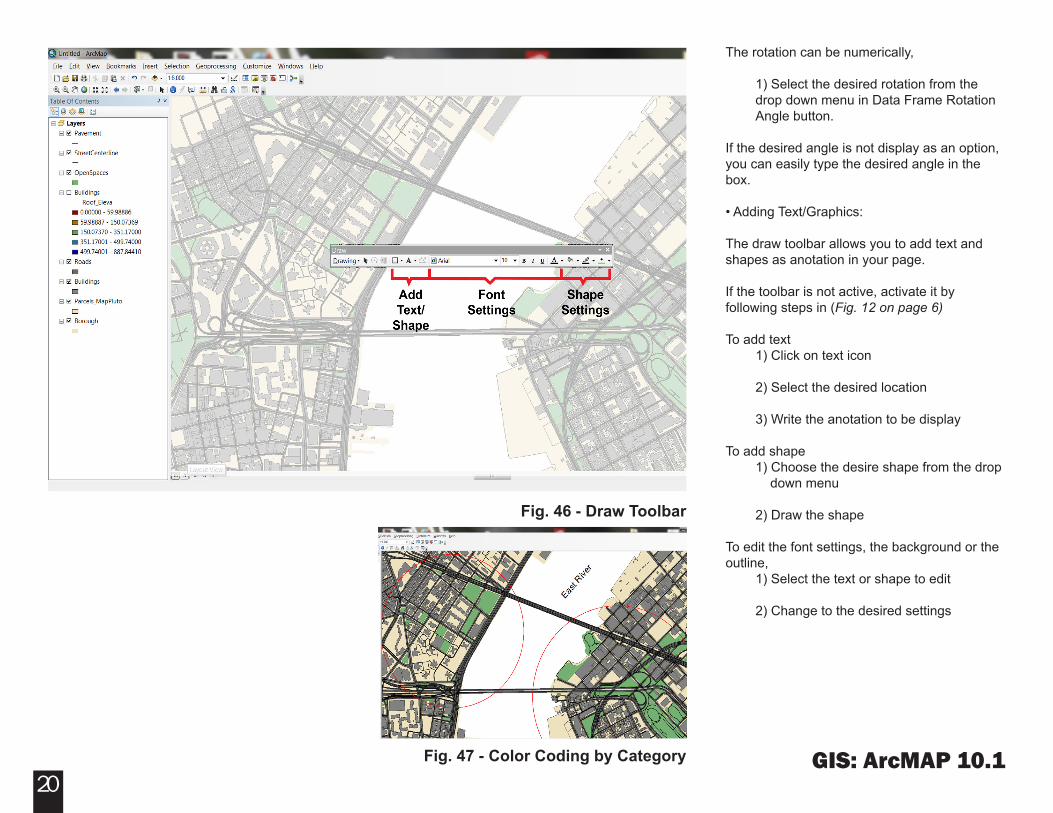
The rotation can be numerically,
1) Select the desired rotation from the drop down menu in Data Frame Rotation Angle button.
If the desired angle is not display as an option, you can easily type the desired angle in the box.
• Adding Text/Graphics:
The draw toolbar allows you to add text and shapes as anotation in your page.
If the toolbar is not active, activate it byfollowing steps in (Fig. 12 on page 6)
To add text 1) Click on text icon 2) Select the desired location 3) Write the anotation to be display
To add shape 1) Choose the desire shape from the drop down menu 2) Draw the shape
To edit the font settings, the background or the outline, 1) Select the text or shape to edit 2) Change to the desired settings
Fig. 46 - Draw Toolbar
Fig. 47 - Color Coding by Category
GIS: ArcMAP 10.121
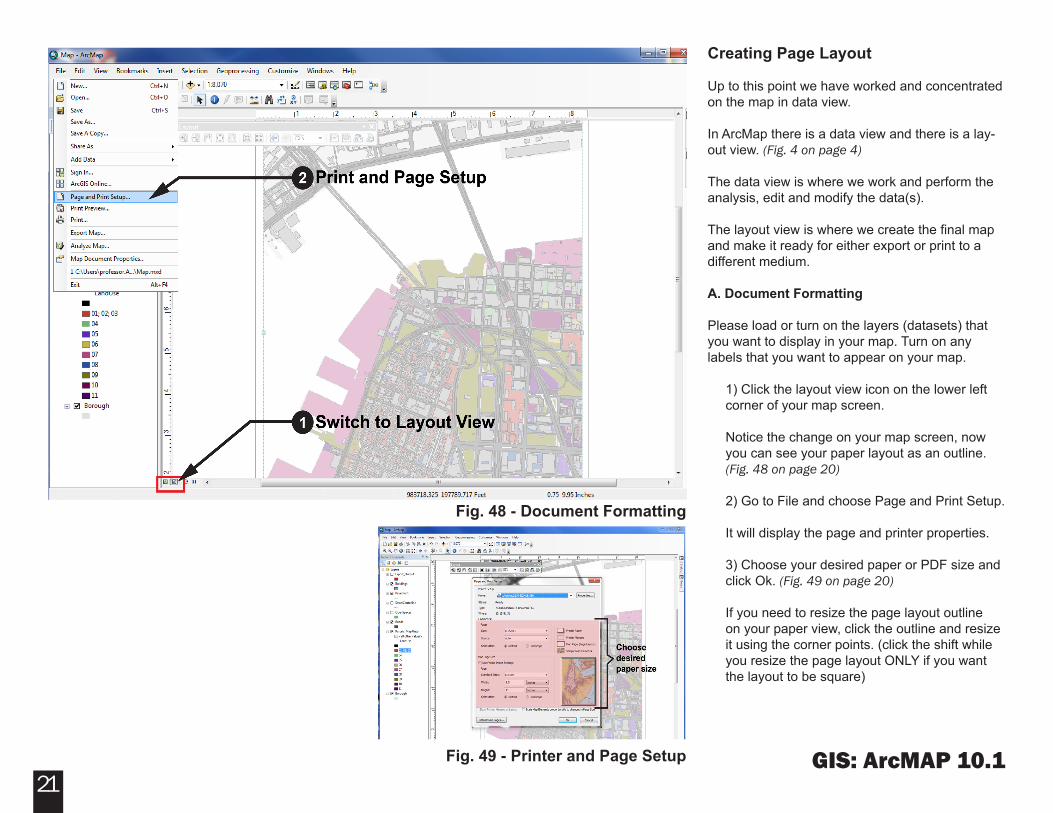
Creating Page Layout
Up to this point we have worked and concentrated on the map in data view.
In ArcMap there is a data view and there is a lay-out view. (Fig. 4 on page 4)
The data view is where we work and perform the analysis, edit and modify the data(s).
The layout view is where we create the final map and make it ready for either export or print to a different medium.
A. Document Formatting
Please load or turn on the layers (datasets) that you want to display in your map. Turn on any labels that you want to appear on your map.
1) Click the layout view icon on the lower left corner of your map screen.
Notice the change on your map screen, now you can see your paper layout as an outline. (Fig. 48 on page 20)
2) Go to File and choose Page and Print Setup.
It will display the page and printer properties.
3) Choose your desired paper or PDF size and click Ok. (Fig. 49 on page 20)
If you need to resize the page layout outline on your paper view, click the outline and resize it using the corner points. (click the shift while you resize the page layout ONLY if you want the layout to be square)
Fig. 48 - Document Formatting
Fig. 49 - Printer and Page Setup
GIS: ArcMAP 10.122
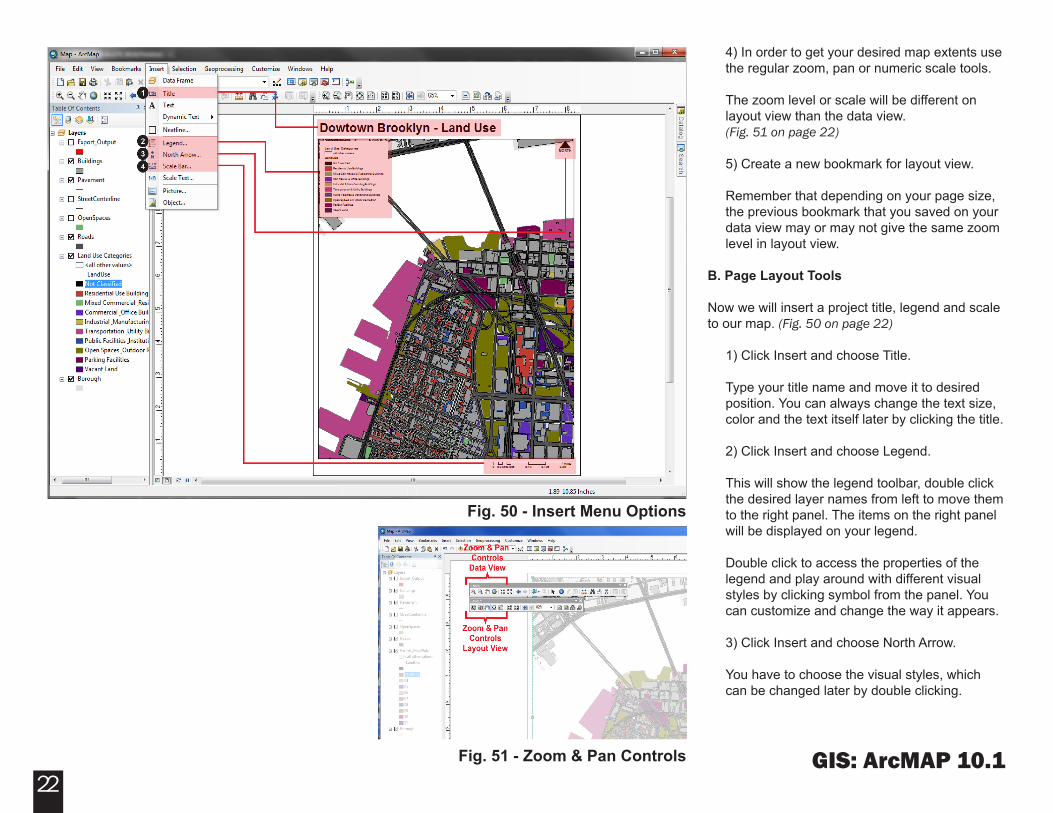
4) In order to get your desired map extents use the regular zoom, pan or numeric scale tools.
The zoom level or scale will be different on layout view than the data view. (Fig. 51 on page 22)
5) Create a new bookmark for layout view.
Remember that depending on your page size, the previous bookmark that you saved on your data view may or may not give the same zoom level in layout view.
B. Page Layout Tools
Now we will insert a project title, legend and scale to our map. (Fig. 50 on page 22)
1) Click Insert and choose Title.
Type your title name and move it to desired position. You can always change the text size, color and the text itself later by clicking the title.
2) Click Insert and choose Legend.
This will show the legend toolbar, double click the desired layer names from left to move them to the right panel. The items on the right panel will be displayed on your legend.
Double click to access the properties of the legend and play around with different visual styles by clicking symbol from the panel. You can customize and change the way it appears.
3) Click Insert and choose North Arrow.
You have to choose the visual styles, which can be changed later by double clicking.
Fig. 50 - Insert Menu Options
Fig. 51 - Zoom & Pan Controls
GIS: ArcMAP 10.123
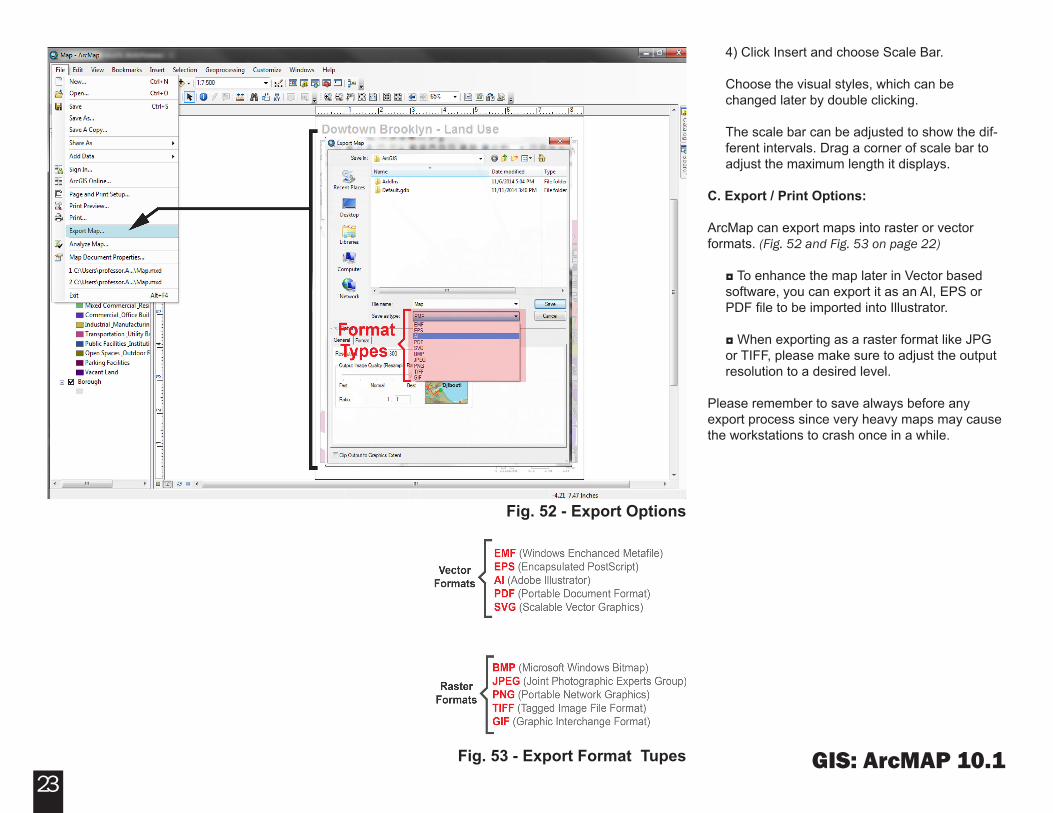
4) Click Insert and choose Scale Bar.
Choose the visual styles, which can be changed later by double clicking.
The scale bar can be adjusted to show the dif-ferent intervals. Drag a corner of scale bar to adjust the maximum length it displays.
C. Export / Print Options:
ArcMap can export maps into raster or vector formats. (Fig. 52 and Fig. 53 on page 22)
◘ To enhance the map later in Vector based software, you can export it as an AI, EPS or PDF file to be imported into Illustrator.
◘ When exporting as a raster format like JPG or TIFF, please make sure to adjust the output resolution to a desired level.
Please remember to save always before any export process since very heavy maps may cause the workstations to crash once in a while.
Fig. 52 - Export Options
Fig. 53 - Export Format Tupes