Embed Size (px)
Citation preview
© Tasktop 2017
Modular Toolchains that Enable Digital Transformations
Optimizing Innovation:
© Tasktop 2017
• Lean practices for software delivery
• Digital transformation and innovation
• Failure to execute opens the door to disruption.
• See the flow of business value in real-time
• Value Stream Integration and Networks
• How to create a modular framework enabling end-to-end
business value flow, at any scale.
Am I at the correct Webinar?
© Tasktop 2017
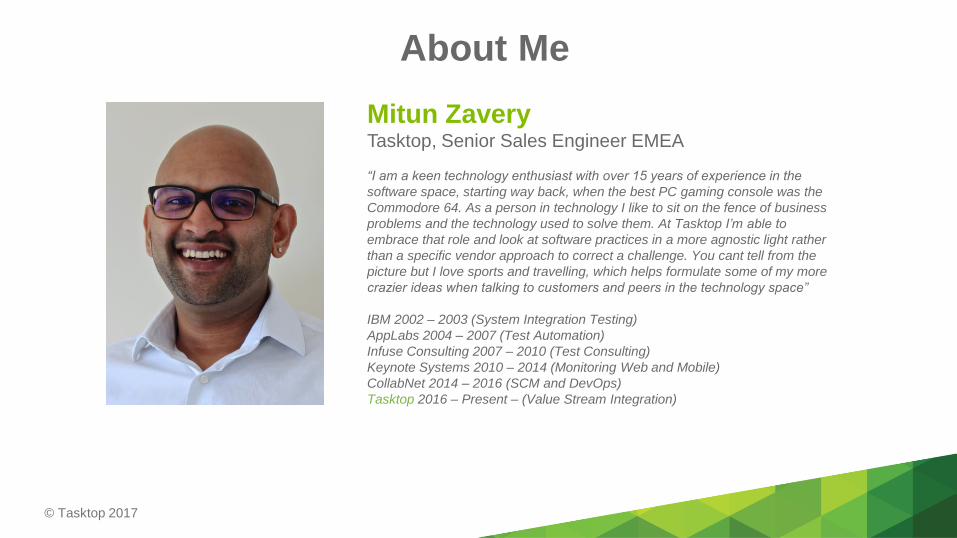
About Me
Mitun ZaveryTasktop, Senior Sales Engineer EMEA
“I am a keen technology enthusiast with over 15 years of experience in the
software space, starting way back, when the best PC gaming console was the
Commodore 64. As a person in technology I like to sit on the fence of business
problems and the technology used to solve them. At Tasktop I’m able to
embrace that role and look at software practices in a more agnostic light rather
than a specific vendor approach to correct a challenge. You cant tell from the
picture but I love sports and travelling, which helps formulate some of my more
crazier ideas when talking to customers and peers in the technology space”
IBM 2002 – 2003 (System Integration Testing)
AppLabs 2004 – 2007 (Test Automation)
Infuse Consulting 2007 – 2010 (Test Consulting)
Keynote Systems 2010 – 2014 (Monitoring Web and Mobile)
CollabNet 2014 – 2016 (SCM and DevOps)
Tasktop 2016 – Present – (Value Stream Integration)
© Tasktop 2017
What’s the Problem?
© Tasktop 2017
• Org charts and software architecture are the best representation of value
creation we have.
• Software investment and staffing decisions are made anecdotally, using
static and stale slivers of data.
• No visibility of outcome for business initiatives.
• Tools and Team targeted for lack of productivity.
Problem
© Tasktop 2017
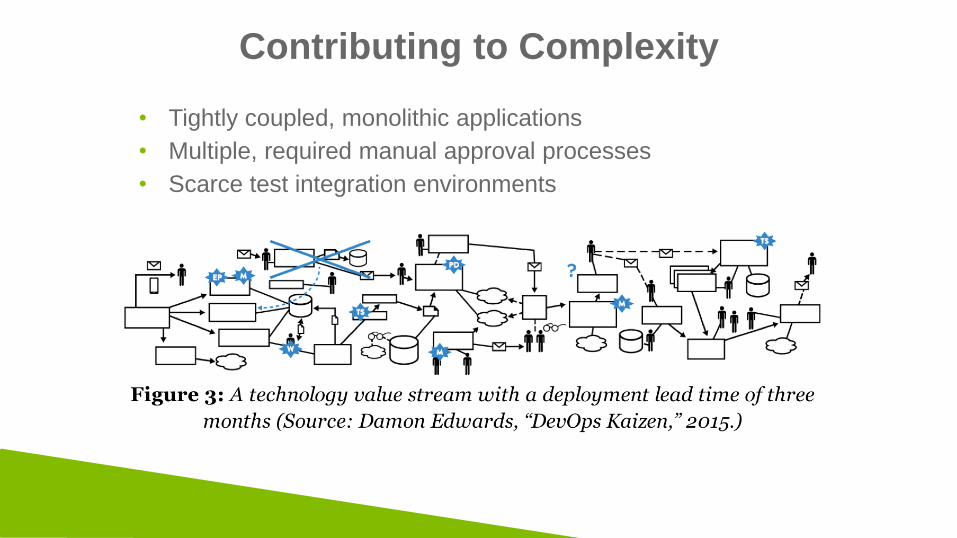
Contributing to Complexity
• Tightly coupled, monolithic applications
• Multiple, required manual approval processes
• Scarce test integration environments
© Tasktop 2017
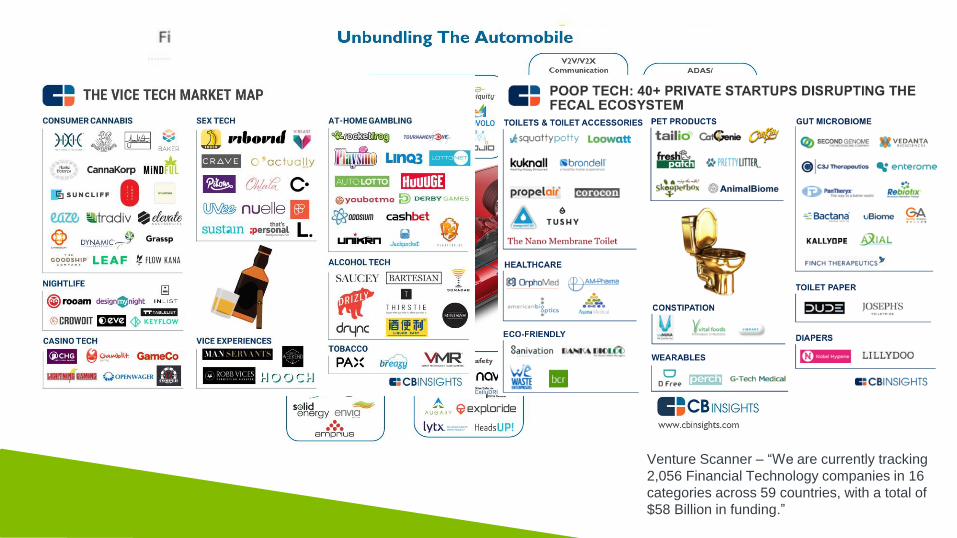
Venture Scanner – “We are currently tracking
2,056 Financial Technology companies in 16
categories across 59 countries, with a total of
$58 Billion in funding.”
© Tasktop 2017
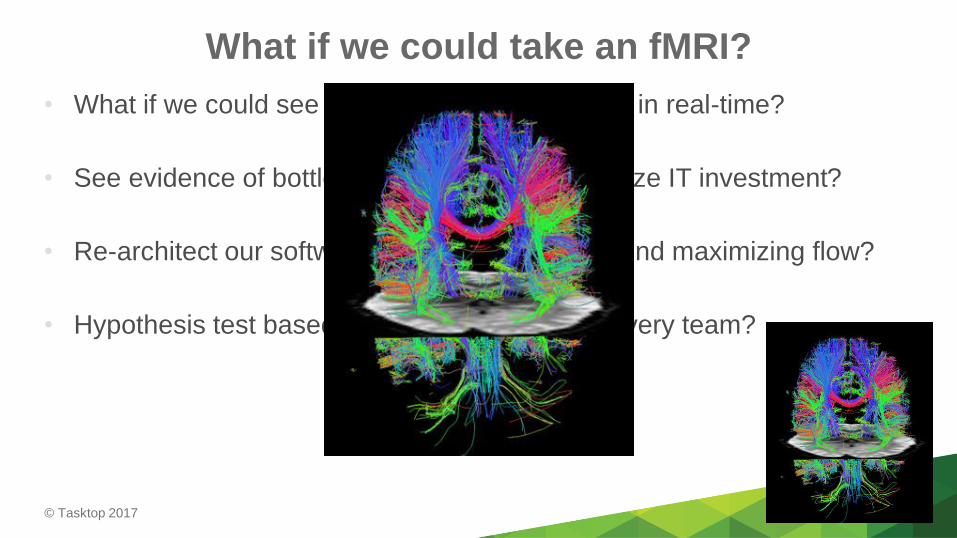
• What if we could see the flow of business value in real-time?
• See evidence of bottlenecks use them to prioritize IT investment?
• Re-architect our software and organization around maximizing flow?
• Hypothesis test based on real-time data from every team?
What if we could take an fMRI?

© Tasktop 2017
Organisational Disruptors
© Tasktop 2017
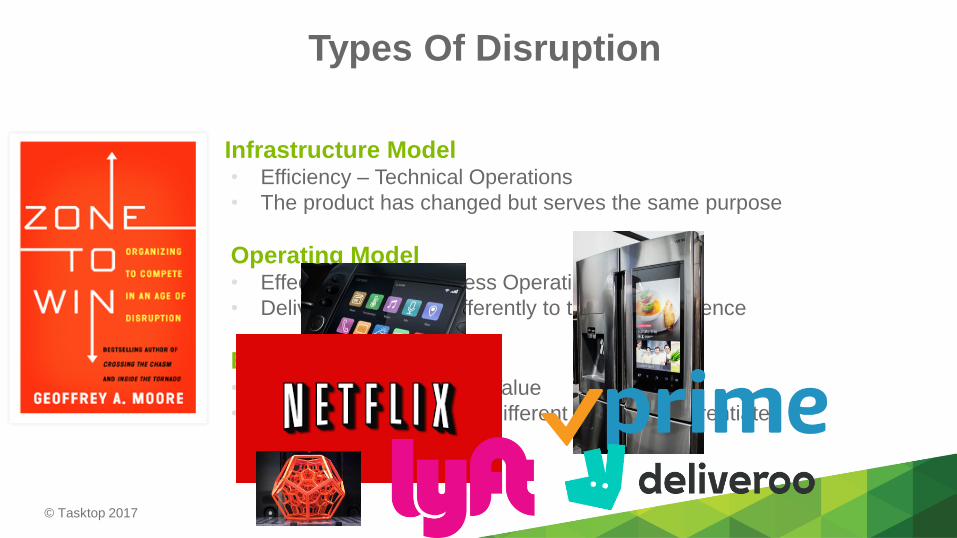
Types Of Disruption
Infrastructure Model• Efficiency – Technical Operations
• The product has changed but serves the same purpose
Operating Model• Effectiveness – Business Operations
• Deliver the product differently to the same audience
Business Model• Competitive – Business Value
• Provide the product in a different way that differentiates

© Tasktop 2017
Software InnovationSoftware Innovation - OffensiveSoftware Innovation - Defensive
© Tasktop 2017
Value Stream Integration – Modularity
© Tasktop 2017
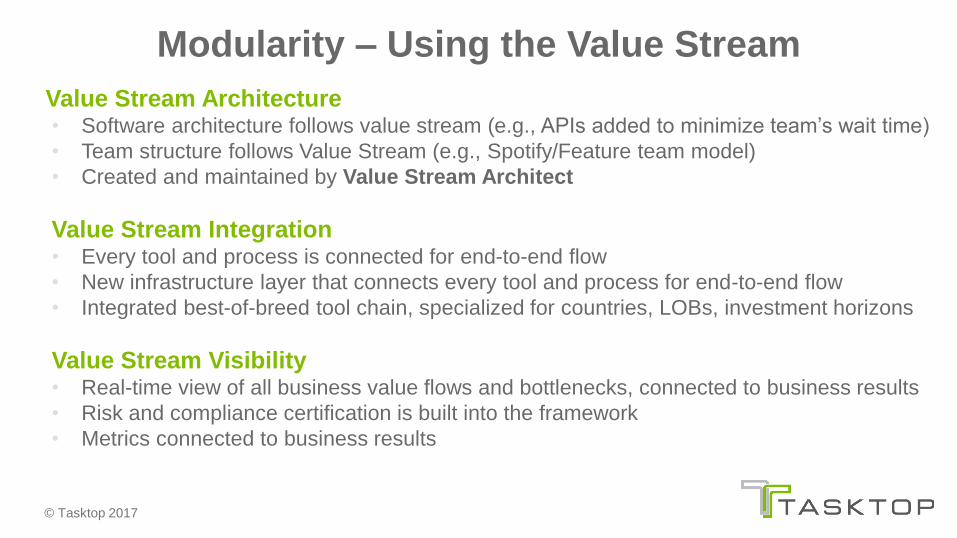
Value Stream Architecture• Software architecture follows value stream (e.g., APIs added to minimize team’s wait time)
• Team structure follows Value Stream (e.g., Spotify/Feature team model)
• Created and maintained by Value Stream Architect
Value Stream Integration• Every tool and process is connected for end-to-end flow
• New infrastructure layer that connects every tool and process for end-to-end flow
• Integrated best-of-breed tool chain, specialized for countries, LOBs, investment horizons
Value Stream Visibility• Real-time view of all business value flows and bottlenecks, connected to business results
• Risk and compliance certification is built into the framework
• Metrics connected to business results
Modularity – Using the Value Stream
© Tasktop 2017
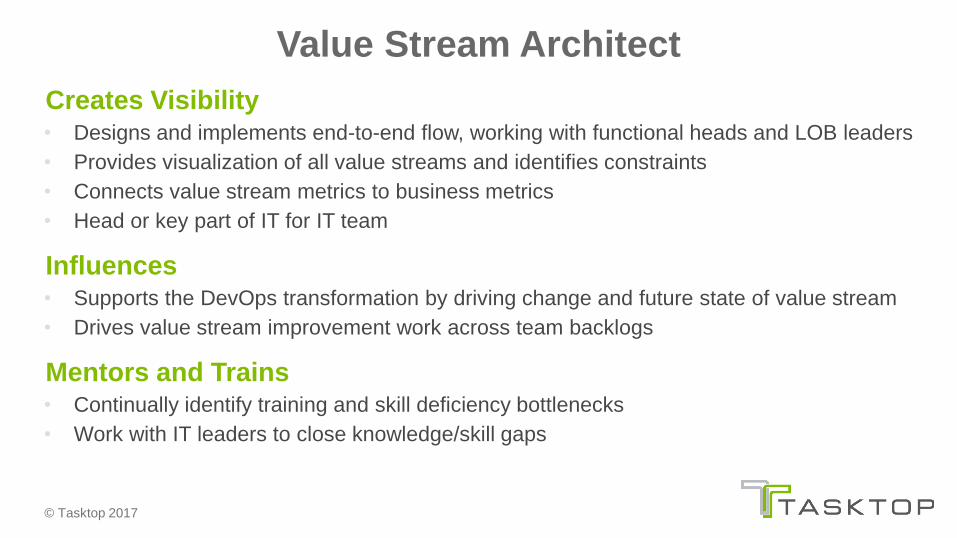
Creates Visibility• Designs and implements end-to-end flow, working with functional heads and LOB leaders
• Provides visualization of all value streams and identifies constraints
• Connects value stream metrics to business metrics
• Head or key part of IT for IT team
Influences• Supports the DevOps transformation by driving change and future state of value stream
• Drives value stream improvement work across team backlogs
Mentors and Trains• Continually identify training and skill deficiency bottlenecks
• Work with IT leaders to close knowledge/skill gaps
Value Stream Architect
Project
Managers
Business
AnalystsDevelopers Testers
Business Customers
Operations
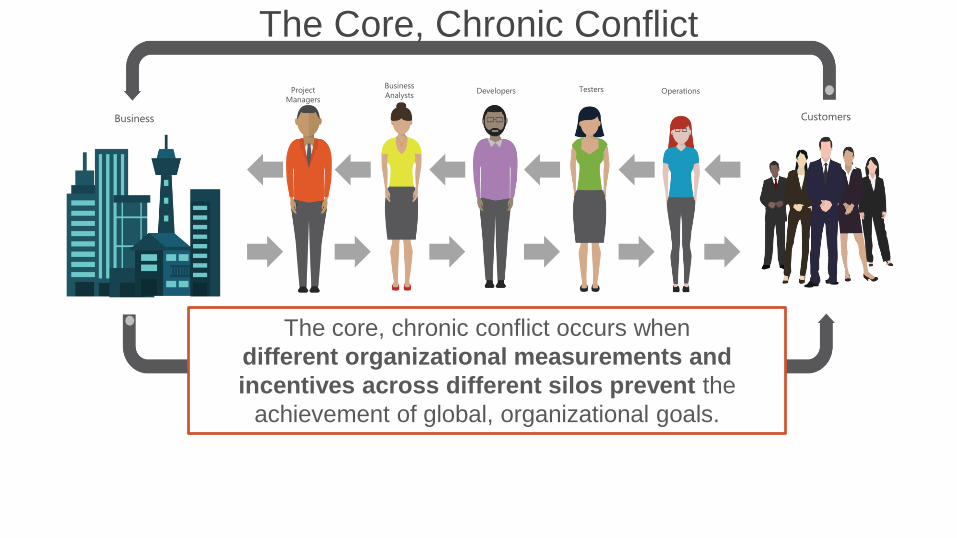
The Core, Chronic Conflict
The core, chronic conflict occurs when
different organizational measurements and
incentives across different silos prevent the
achievement of global, organizational goals.
© Tasktop 2017
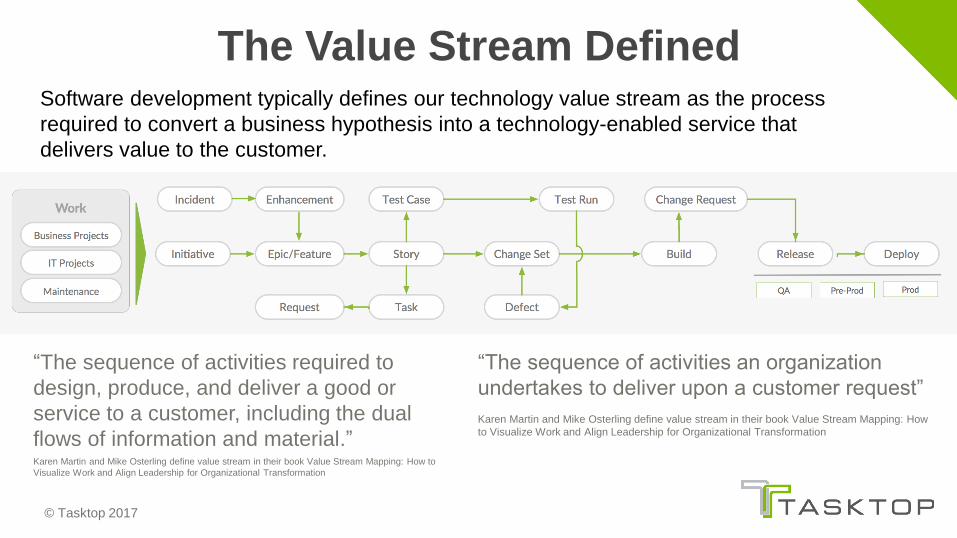
The Value Stream Defined
“The sequence of activities an organization
undertakes to deliver upon a customer request”
Karen Martin and Mike Osterling define value stream in their book Value Stream Mapping: How
to Visualize Work and Align Leadership for Organizational Transformation
“The sequence of activities required to
design, produce, and deliver a good or
service to a customer, including the dual
flows of information and material.”Karen Martin and Mike Osterling define value stream in their book Value Stream Mapping: How to
Visualize Work and Align Leadership for Organizational Transformation
Software development typically defines our technology value stream as the process
required to convert a business hypothesis into a technology-enabled service that
delivers value to the customer.
© Tasktop 2017
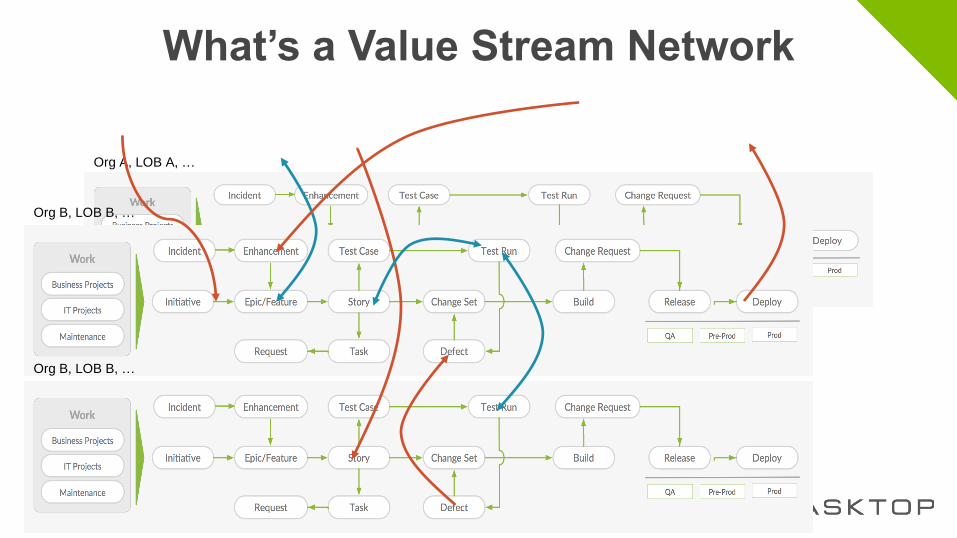
What’s a Value Stream Network
Org A, LOB A, …
Org B, LOB B, …
Org B, LOB B, …
© Tasktop 2017
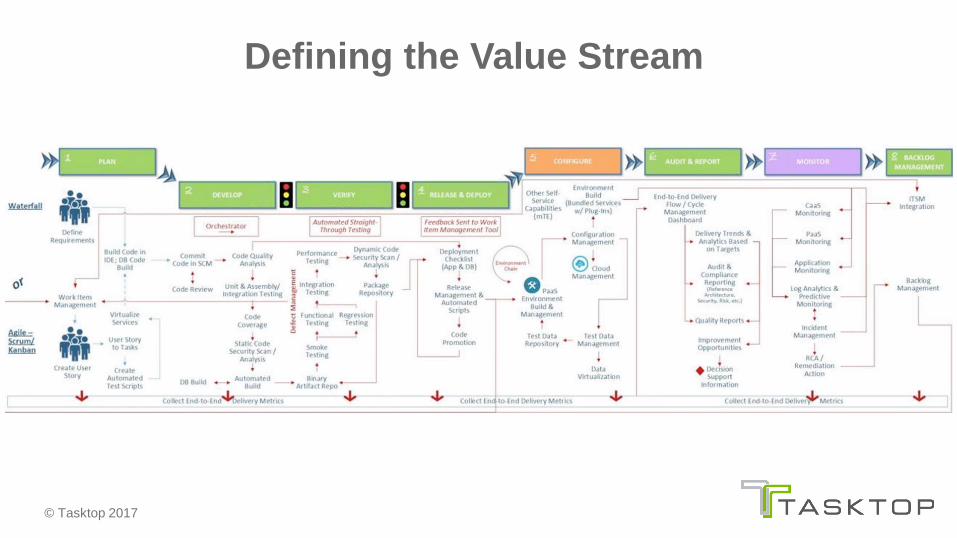
Defining the Value Stream

© Tasktop 2017
Top Performing Companies
X% higher market
capitalization over three years
Over $X million in savings on rework
Over $X million in savings
on tool upgrades and migrations
Twice as likely to exceed
profitability, market share and
productivity goals
Deployed code X times more
frequently
Maximize developer productivity
Enable organizational learning
Create high employee satisfaction
Win in the marketplace
© Tasktop 2017
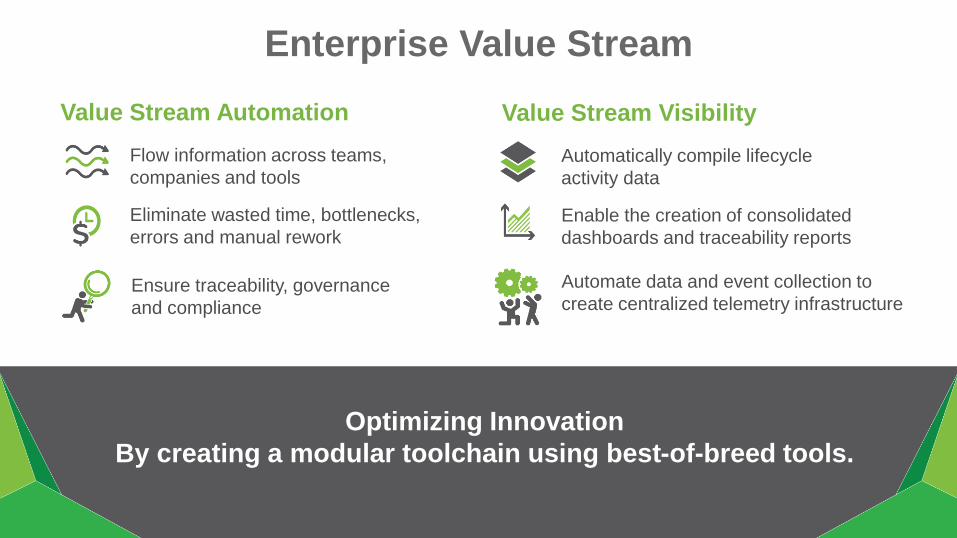
Enterprise Value Stream
Optimizing Innovation
By creating a modular toolchain using best-of-breed tools.
Value Stream Automation
Flow information across teams,
companies and tools
Eliminate wasted time, bottlenecks,
errors and manual rework
Ensure traceability, governance
and compliance
Value Stream Visibility
Automatically compile lifecycle
activity data
Enable the creation of consolidated
dashboards and traceability reports
Automate data and event collection to
create centralized telemetry infrastructure
© Tasktop 2017
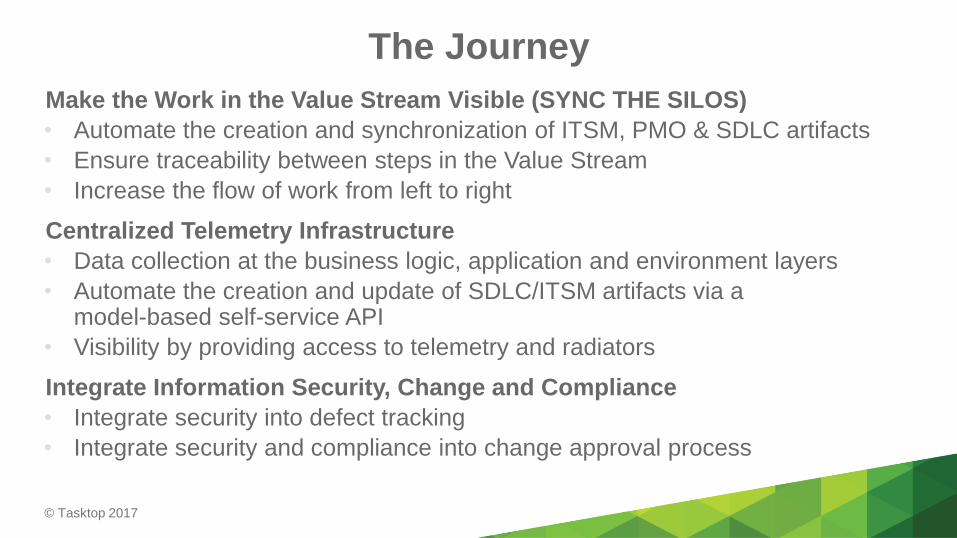
The Journey
Make the Work in the Value Stream Visible (SYNC THE SILOS)
• Automate the creation and synchronization of ITSM, PMO & SDLC artifacts
• Ensure traceability between steps in the Value Stream
• Increase the flow of work from left to right
Centralized Telemetry Infrastructure
• Data collection at the business logic, application and environment layers
• Automate the creation and update of SDLC/ITSM artifacts via a model-based self-service API
• Visibility by providing access to telemetry and radiators
Integrate Information Security, Change and Compliance
• Integrate security into defect tracking
• Integrate security and compliance into change approval process
© Tasktop 2017
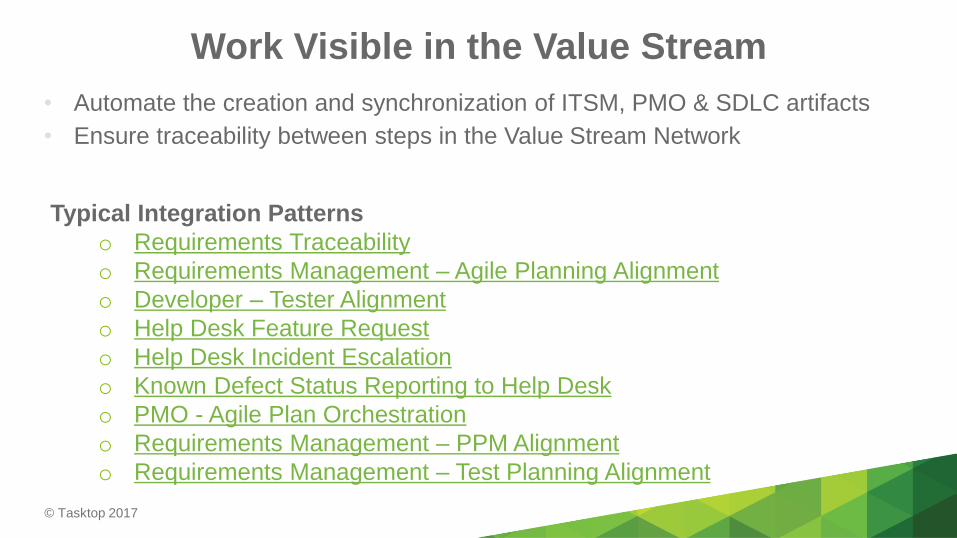
Work Visible in the Value Stream
• Automate the creation and synchronization of ITSM, PMO & SDLC artifacts
• Ensure traceability between steps in the Value Stream Network
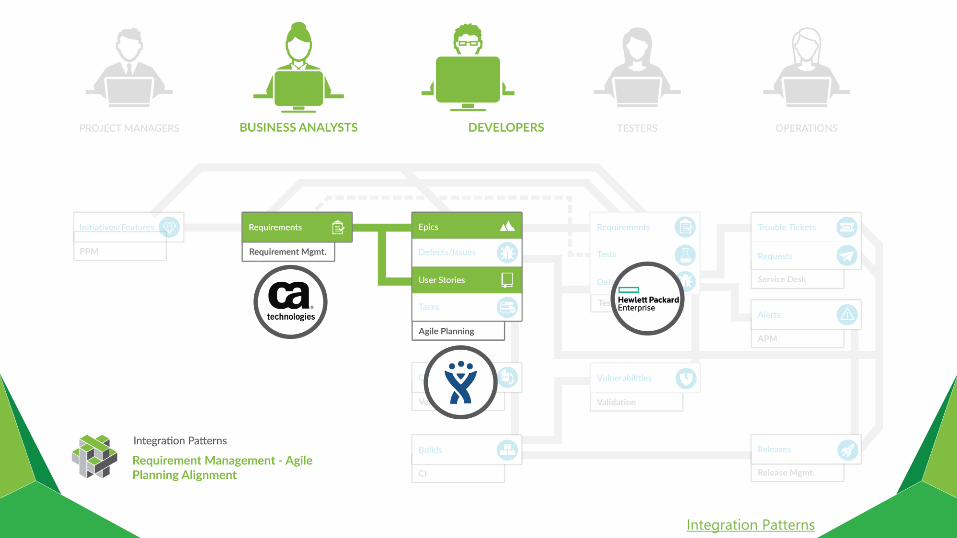
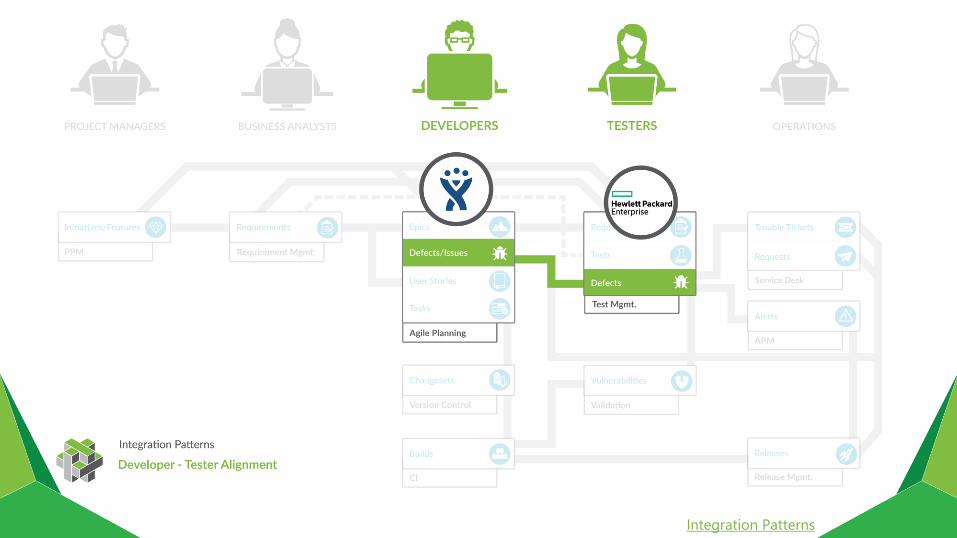
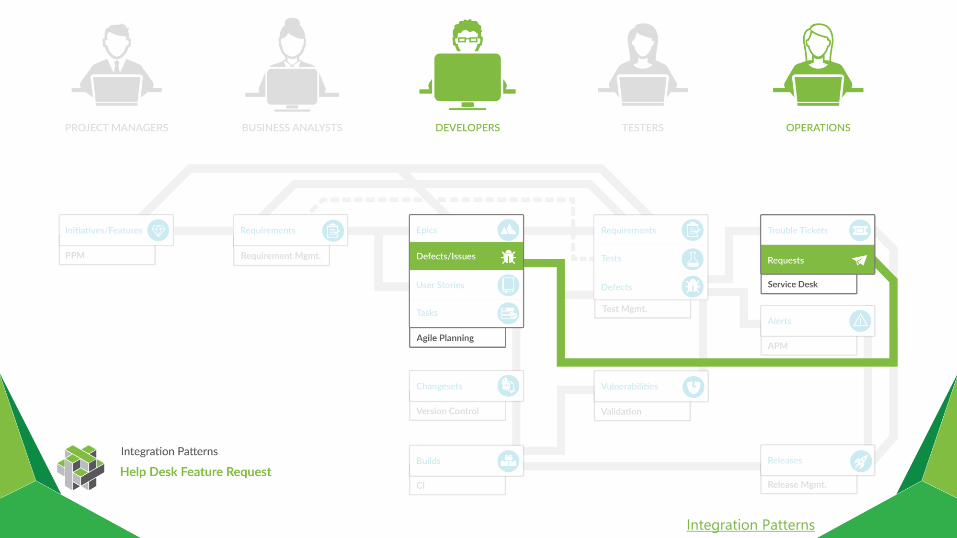
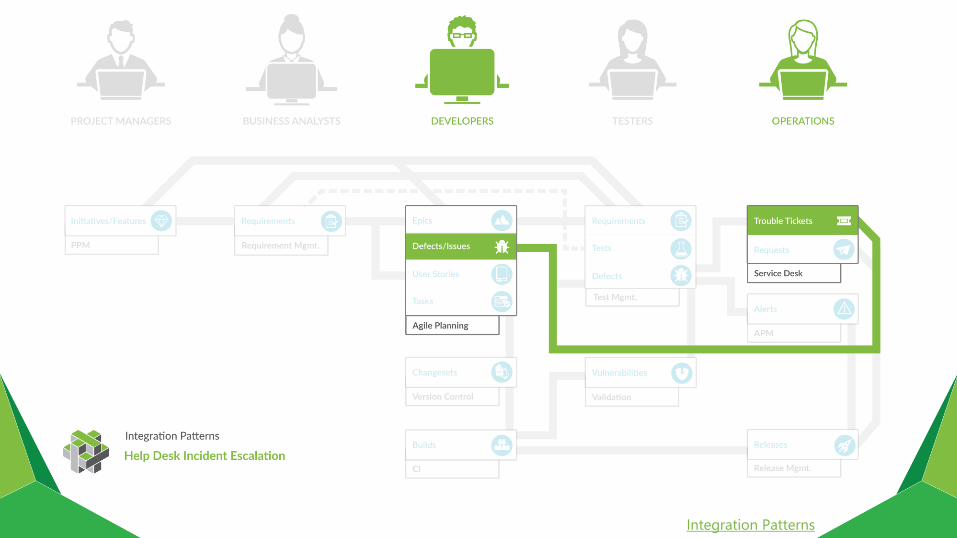
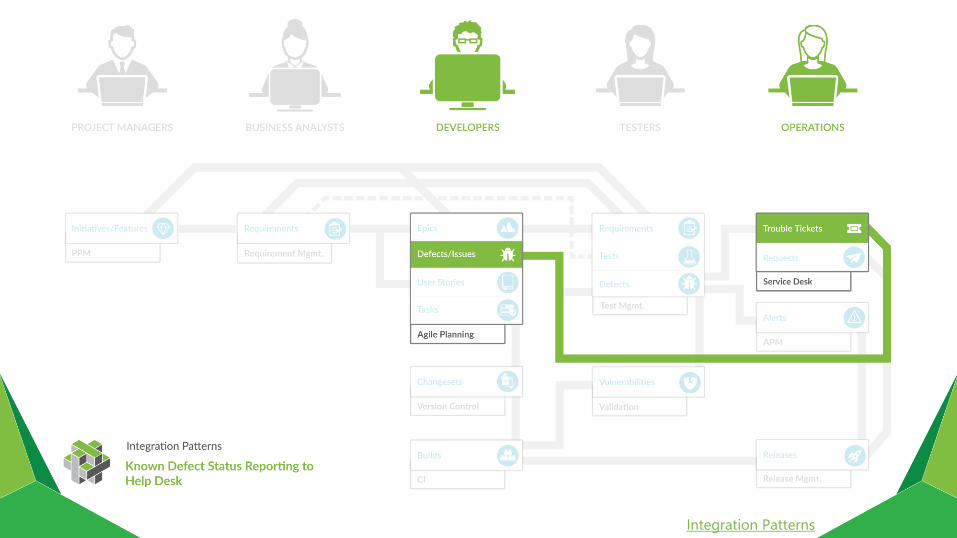
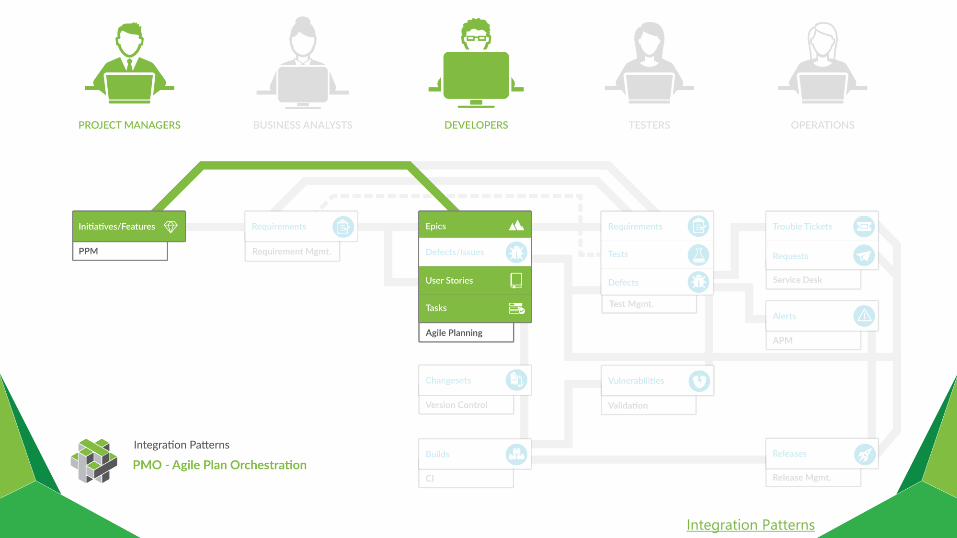
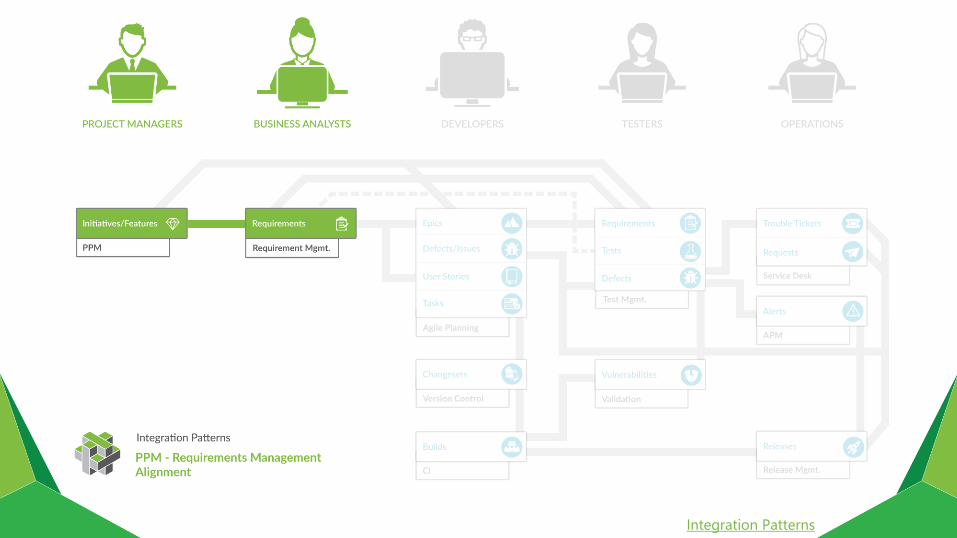
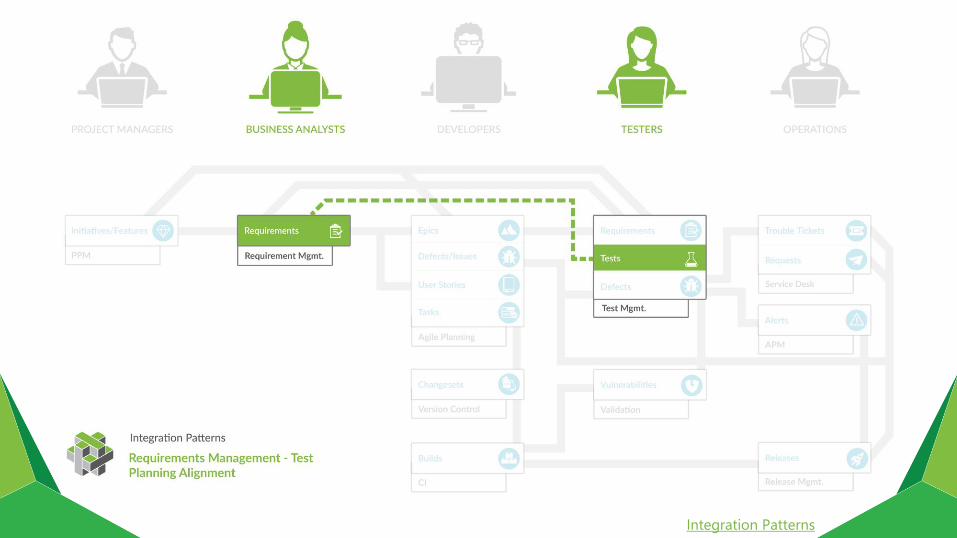
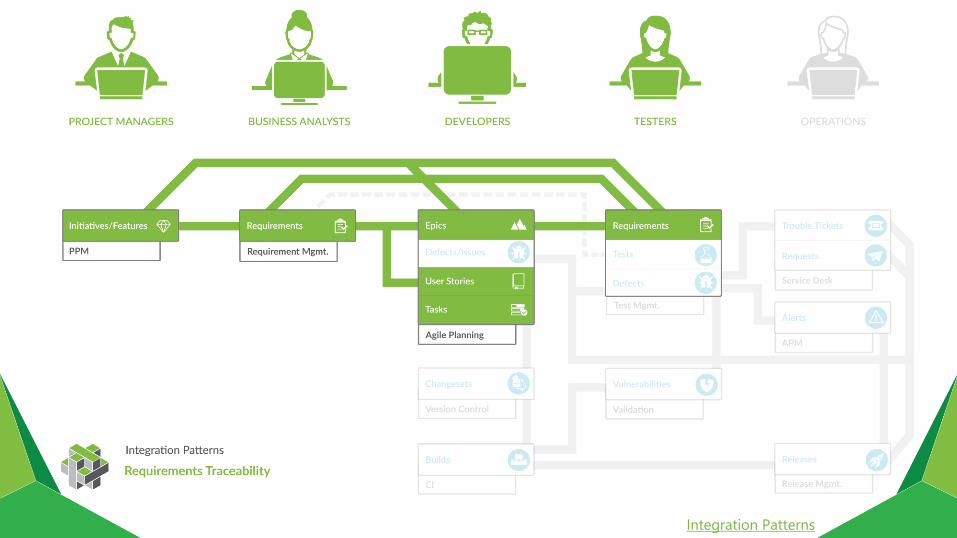
Typical Integration Patterns
o Requirements Traceability
o Requirements Management – Agile Planning Alignment
o Developer – Tester Alignment
o Help Desk Feature Request
o Help Desk Incident Escalation
o Known Defect Status Reporting to Help Desk
o PMO - Agile Plan Orchestration
o Requirements Management – PPM Alignment
o Requirements Management – Test Planning Alignment
© Tasktop 2017
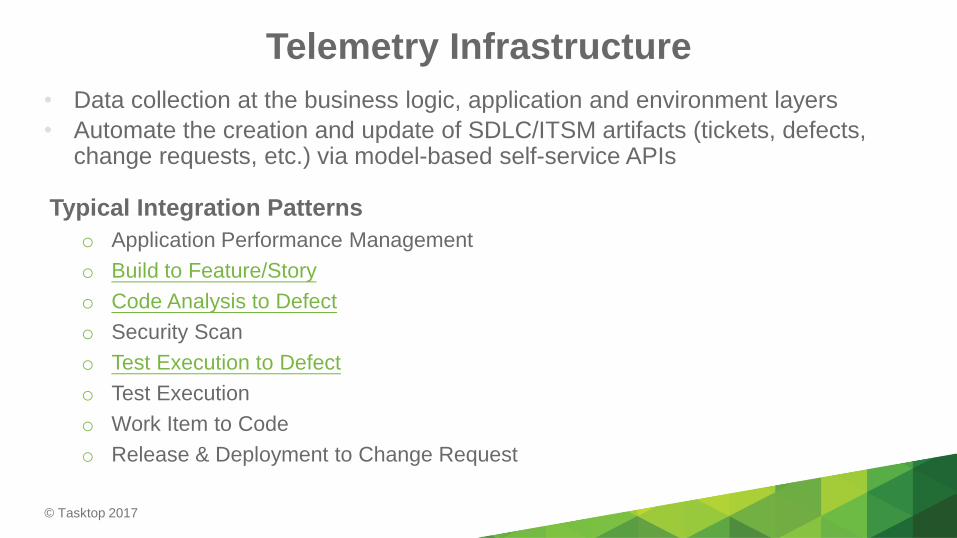
Telemetry Infrastructure
• Data collection at the business logic, application and environment layers
• Automate the creation and update of SDLC/ITSM artifacts (tickets, defects, change requests, etc.) via model-based self-service APIs
Typical Integration Patterns
o Application Performance Management
o Build to Feature/Story
o Code Analysis to Defect
o Security Scan
o Test Execution to Defect
o Test Execution
o Work Item to Code
o Release & Deployment to Change Request
© Tasktop 2017
What? and How? to Measure Success
© Tasktop 2017
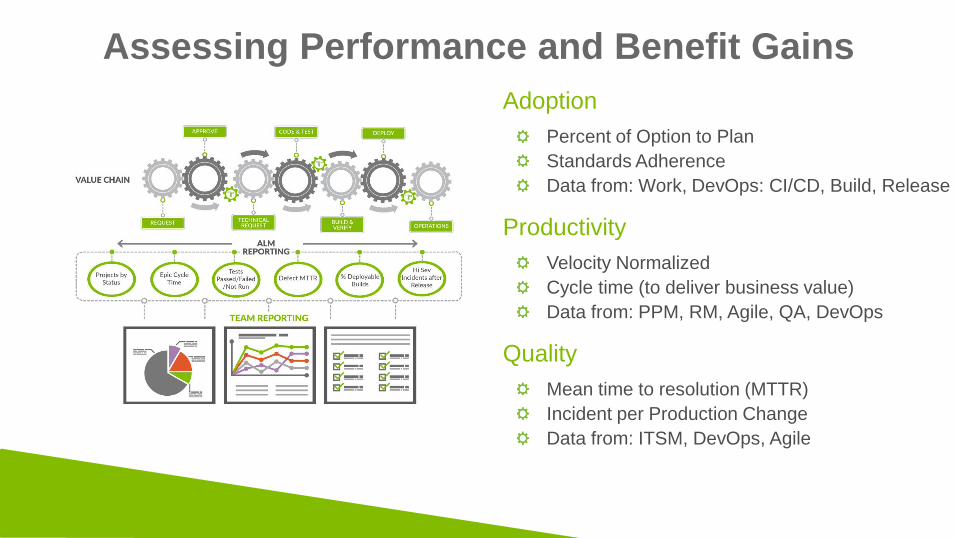
Quality
Mean time to resolution (MTTR)
Incident per Production Change
Data from: ITSM, DevOps, Agile
Adoption
Percent of Option to Plan
Standards Adherence
Data from: Work, DevOps: CI/CD, Build, Release
Productivity
Velocity Normalized
Cycle time (to deliver business value)
Data from: PPM, RM, Agile, QA, DevOps
Assessing Performance and Benefit Gains
© Tasktop 2017
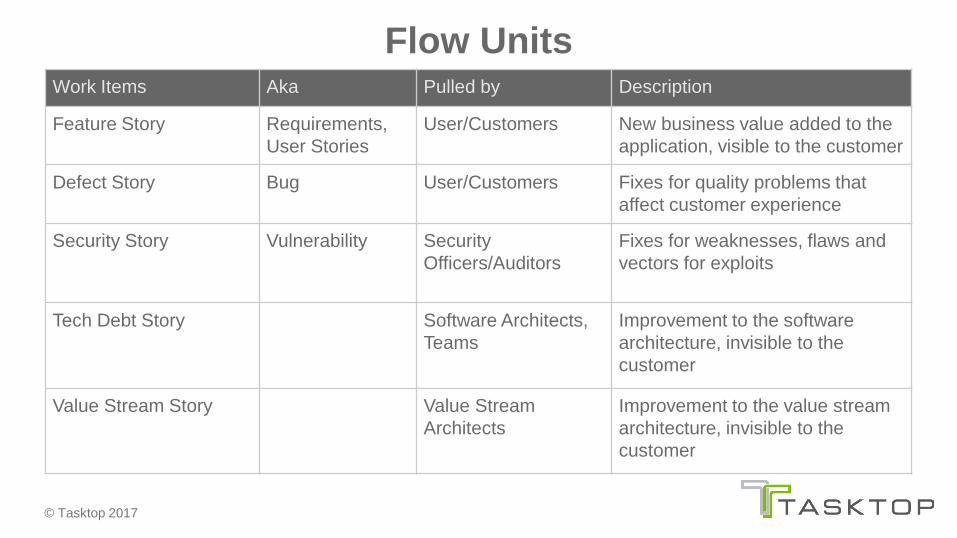
Flow UnitsWork Items Aka Pulled by Description
Feature Story Requirements,
User Stories
User/Customers New business value added to the
application, visible to the customer
Defect Story Bug User/Customers Fixes for quality problems that
affect customer experience
Security Story Vulnerability Security
Officers/Auditors
Fixes for weaknesses, flaws and
vectors for exploits
Tech Debt Story Software Architects,
Teams
Improvement to the software
architecture, invisible to the
customer
Value Stream Story Value Stream
Architects
Improvement to the value stream
architecture, invisible to the
customer
© Tasktop 2017
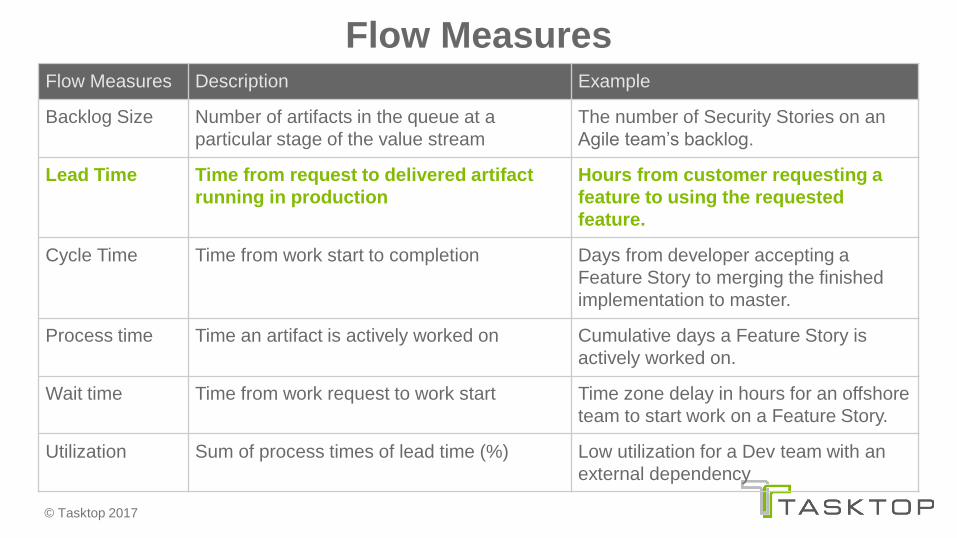
Flow MeasuresFlow Measures Description Example
Backlog Size Number of artifacts in the queue at a
particular stage of the value stream
The number of Security Stories on an
Agile team’s backlog.
Lead Time Time from request to delivered artifact
running in production
Hours from customer requesting a
feature to using the requested
feature.
Cycle Time Time from work start to completion Days from developer accepting a
Feature Story to merging the finished
implementation to master.
Process time Time an artifact is actively worked on Cumulative days a Feature Story is
actively worked on.
Wait time Time from work request to work start Time zone delay in hours for an offshore
team to start work on a Feature Story.
Utilization Sum of process times of lead time (%) Low utilization for a Dev team with an
external dependency
© Tasktop 2017
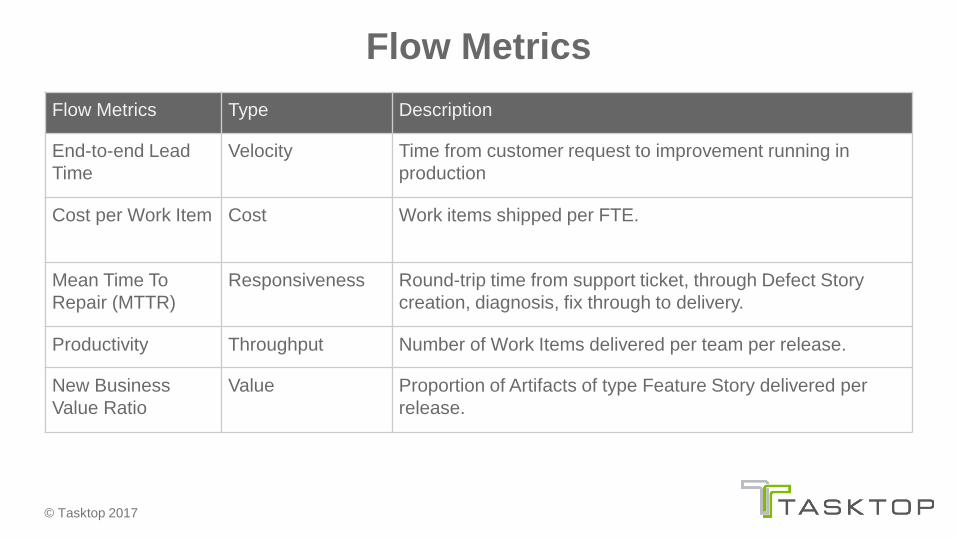
Flow Metrics
Flow Metrics Type Description
End-to-end Lead
Time
Velocity Time from customer request to improvement running in
production
Cost per Work Item Cost Work items shipped per FTE.
Mean Time To
Repair (MTTR)
Responsiveness Round-trip time from support ticket, through Defect Story
creation, diagnosis, fix through to delivery.
Productivity Throughput Number of Work Items delivered per team per release.
New Business
Value Ratio
Value Proportion of Artifacts of type Feature Story delivered per
release.
© Tasktop 2017
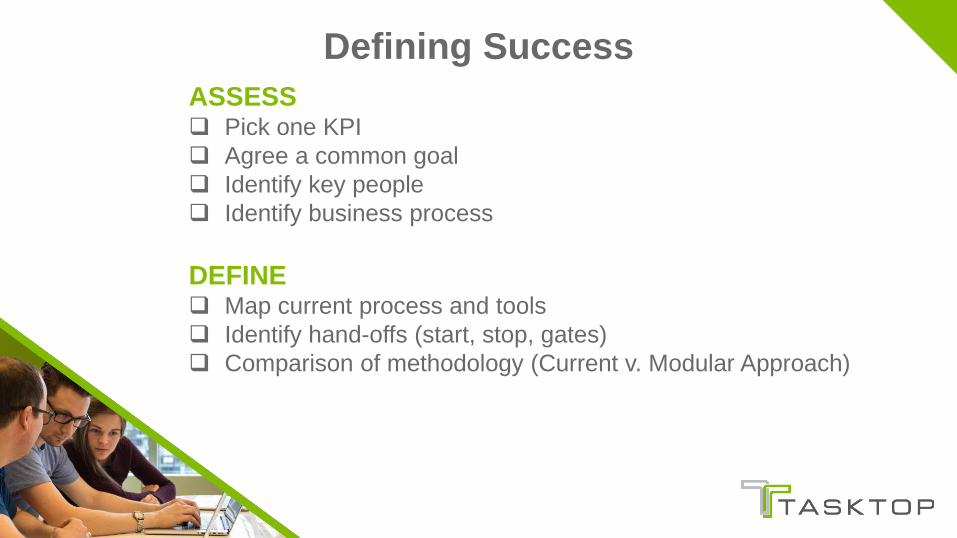
Defining Success
ASSESS Pick one KPI
Agree a common goal
Identify key people
Identify business process
DEFINE Map current process and tools
Identify hand-offs (start, stop, gates)
Comparison of methodology (Current v. Modular Approach)

© Tasktop 2017
About Tasktop
© Tasktop 2017
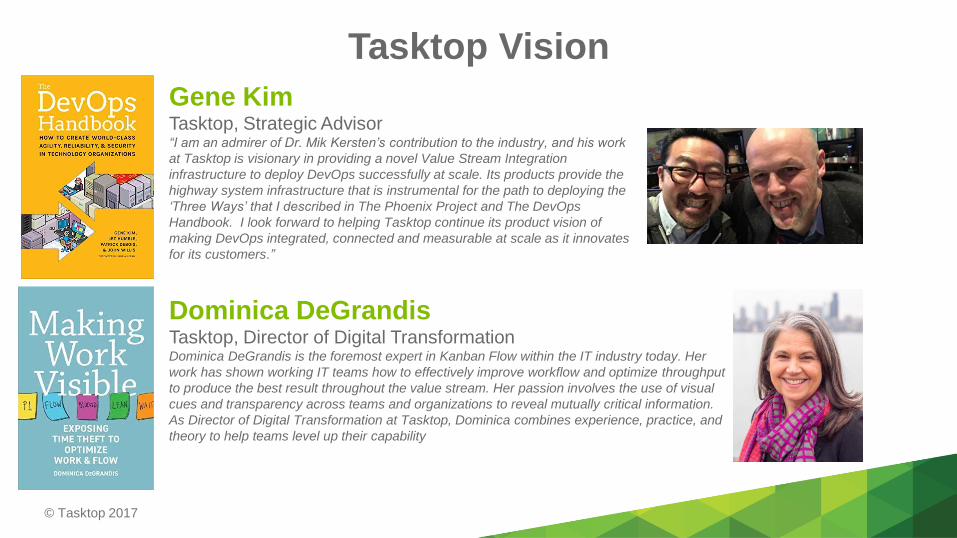
Tasktop Vision
Gene Kim Tasktop, Strategic Advisor“I am an admirer of Dr. Mik Kersten’s contribution to the industry, and his work
at Tasktop is visionary in providing a novel Value Stream Integration
infrastructure to deploy DevOps successfully at scale. Its products provide the
highway system infrastructure that is instrumental for the path to deploying the
‘Three Ways’ that I described in The Phoenix Project and The DevOps
Handbook. I look forward to helping Tasktop continue its product vision of
making DevOps integrated, connected and measurable at scale as it innovates
for its customers.”
Dominica DeGrandisTasktop, Director of Digital TransformationDominica DeGrandis is the foremost expert in Kanban Flow within the IT industry today. Her
work has shown working IT teams how to effectively improve workflow and optimize throughput
to produce the best result throughout the value stream. Her passion involves the use of visual
cues and transparency across teams and organizations to reveal mutually critical information.
As Director of Digital Transformation at Tasktop, Dominica combines experience, practice, and
theory to help teams level up their capability
© Tasktop 2017
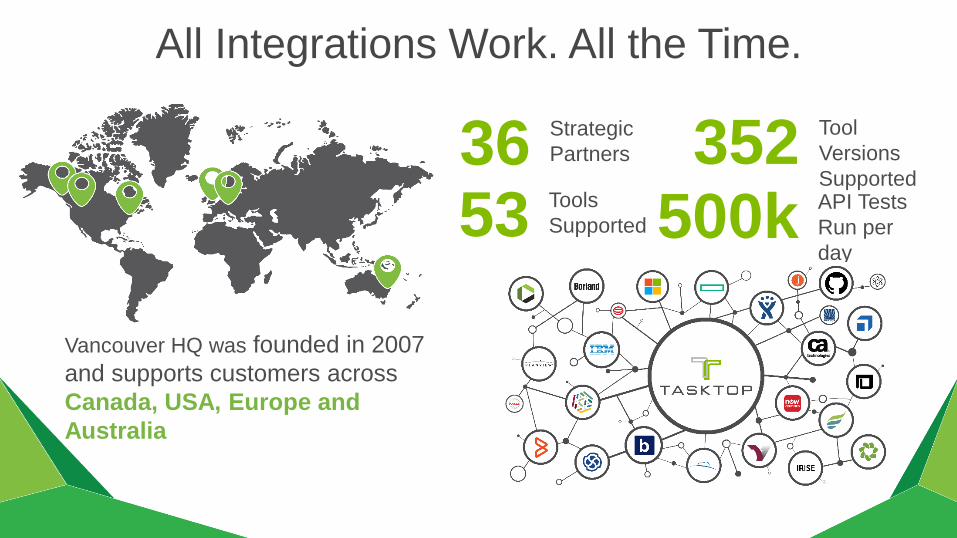
Vancouver HQ was founded in 2007
and supports customers across
Canada, USA, Europe and
Australia
Strategic
Partners36Tools
Supported53
Tool
Versions
Supported352
API Tests
Run per
day500k
All Integrations Work. All the Time.
© Tasktop 2017
© Tasktop 2017
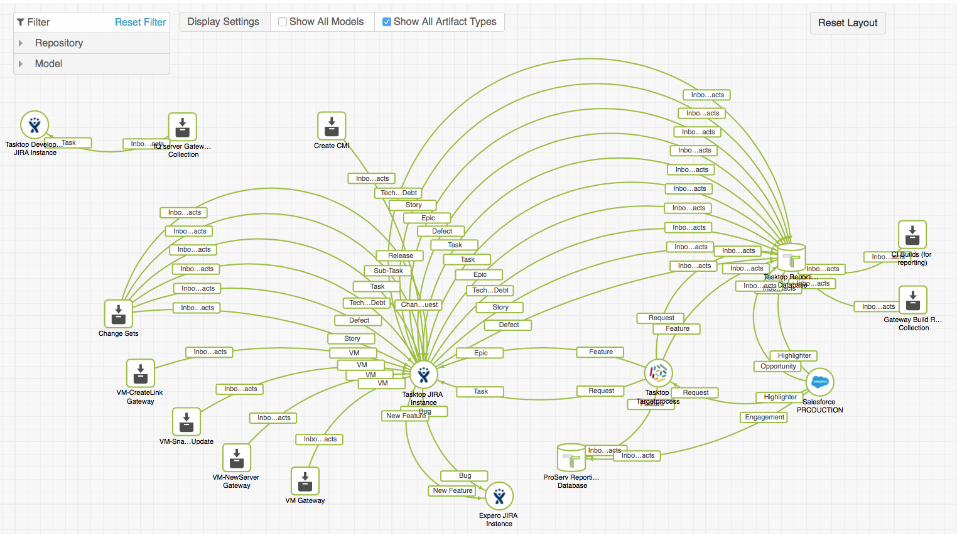
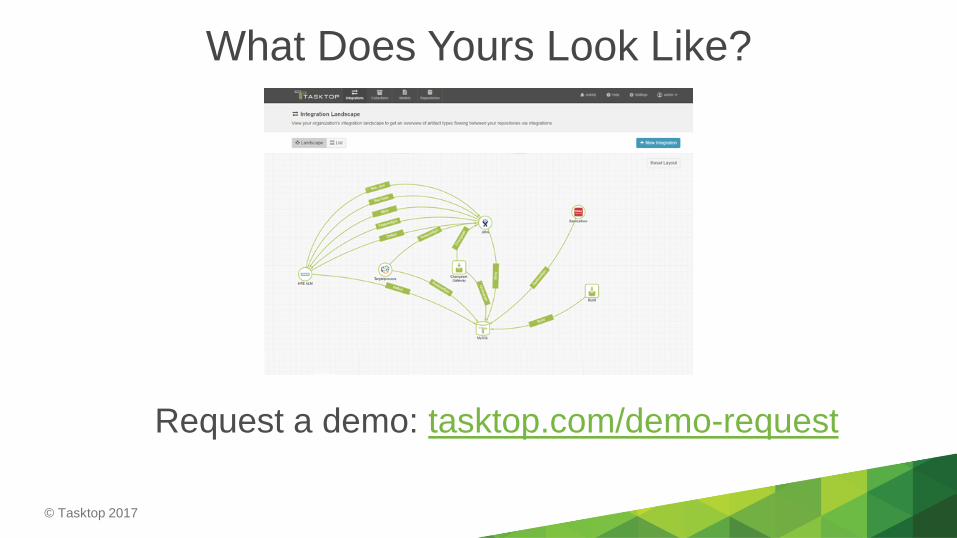
What Does Yours Look Like?
Request a demo: tasktop.com/demo-request
© Tasktop 2017
Any Questions?
Mitun Zavery
@mitunzavery
© Tasktop 2017
DevOps: Build Management
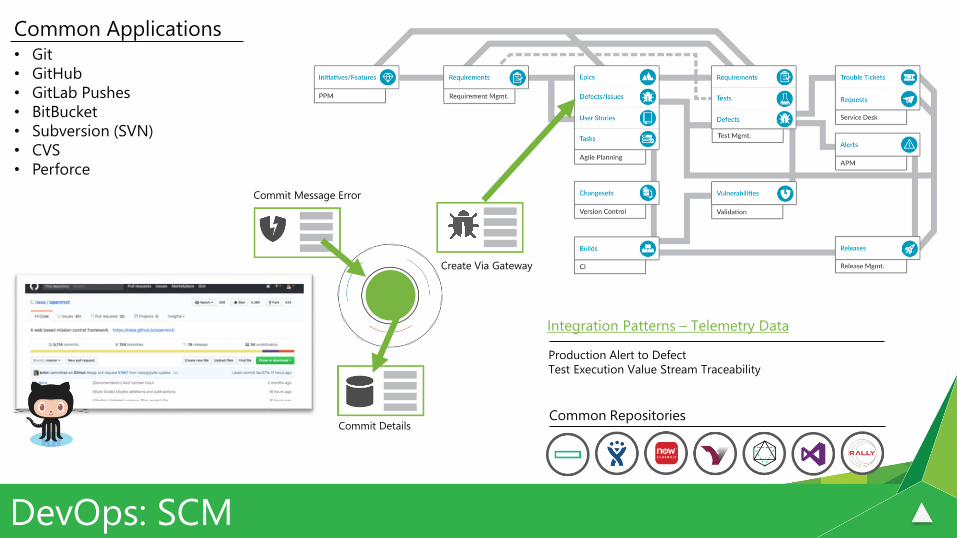
DevOps: SCM
Commit Details
Create Via Gateway
Commit Message Error
Common Repositories
Production Alert to Defect
Test Execution Value Stream Traceability
Common Applications• Git
• GitHub
• GitLab Pushes
• BitBucket
• Subversion (SVN)
• CVS
• Perforce
Integration Patterns – Telemetry Data

© Tasktop 2017
DevOps: Build Management
DevOps: Build Management
Enterprise Data Stream
Create Via Gateway
Build Failure
Common Repositories
Build Failure to Defect
Build Status Value Stream Traceability
Common Applications• Jenkins
• UrbanCode Build
• Ant
• Maven
• Snap
• Grunt
Integration Patterns – Telemetry Data
© Tasktop 2017
Have repeat of problem
slide showing how
we’ve fixed the issues?
Integration Patterns
© Tasktop 2017Integration Patterns
© Tasktop 2017Integration Patterns
© Tasktop 2017Integration Patterns
© Tasktop 2017Integration Patterns
© Tasktop 2017Integration Patterns
© Tasktop 2017Integration Patterns
© Tasktop 2017Integration Patterns
© Tasktop 2017Integration Patterns


![Numerical modeling of diffusion-controlled phase ......transformations have to be controlled in order to obtain the volume fraction of phases optimizing the mechanical properties [1,2];](https://img.pdfslide.net/doc/110x75/60bfc24f5927f74b31254bee/numerical-modeling-of-diffusion-controlled-phase-transformations-have-to.jpg)