Embed Size (px)
Citation preview

Understanding Key Indicators in the IMS Performance
Analyzer Report
Gary Wicks
June 2009
IMS Worldwide Technical Support
2
e- bus
i ness powered byIMS
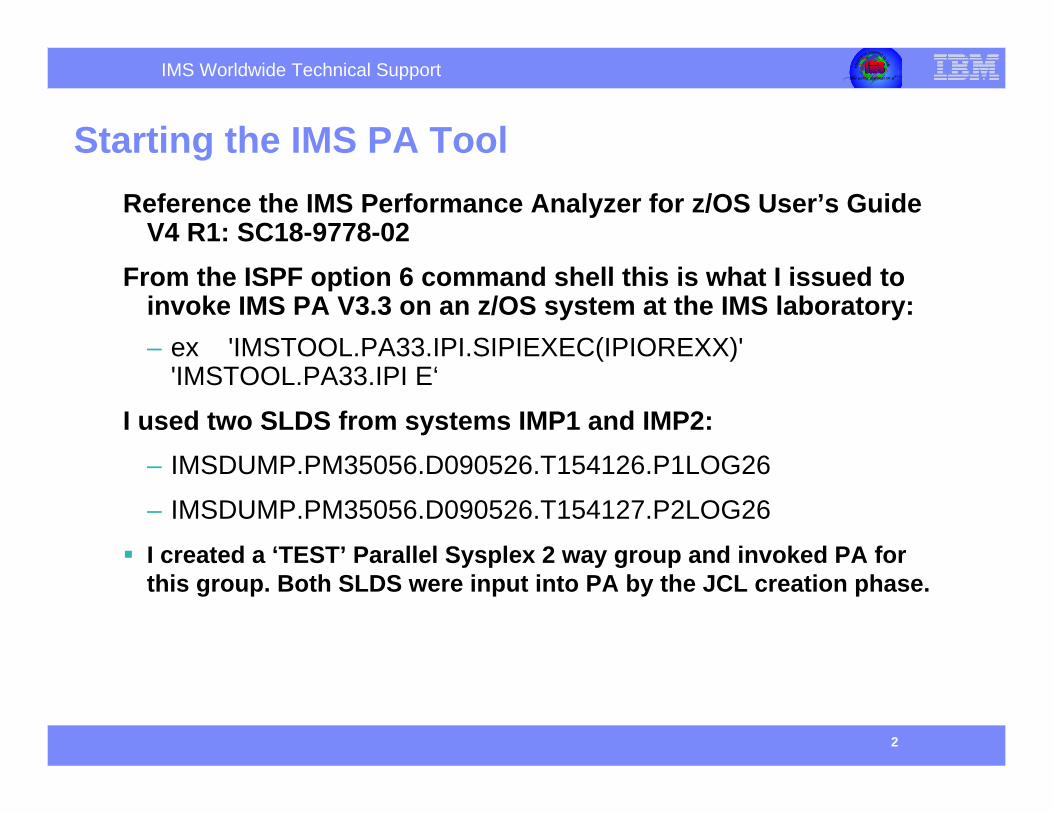
Starting the IMS PA ToolReference the IMS Performance Analyzer for z/OS User’s Guide
V4 R1: SC18-9778-02From the ISPF option 6 command shell this is what I issued to
invoke IMS PA V3.3 on an z/OS system at the IMS laboratory:– ex 'IMSTOOL.PA33.IPI.SIPIEXEC(IPIOREXX)'
'IMSTOOL.PA33.IPI E‘
I used two SLDS from systems IMP1 and IMP2:– IMSDUMP.PM35056.D090526.T154126.P1LOG26
– IMSDUMP.PM35056.D090526.T154127.P2LOG26I created a ‘TEST’ Parallel Sysplex 2 way group and invoked PA for this group. Both SLDS were input into PA by the JCL creation phase.
IMS Worldwide Technical Support
3
e- bus
i ness powered byIMS
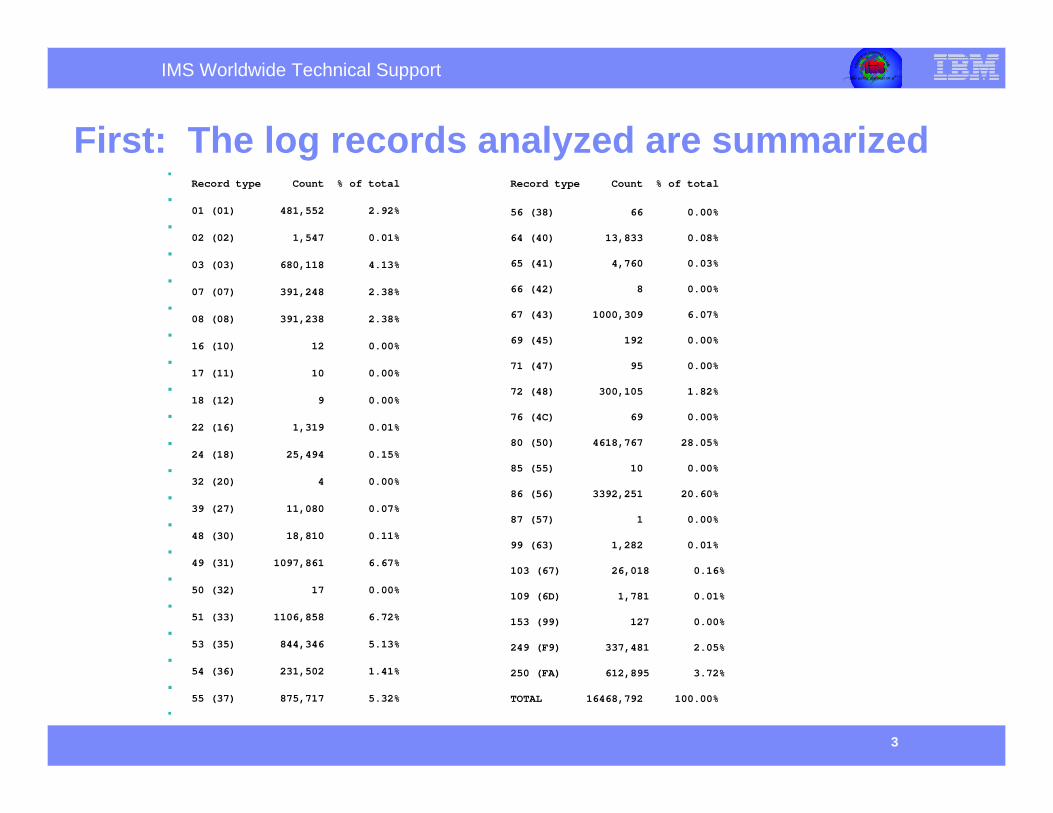
First: The log records analyzed are summarizedRecord type Count % of total
01 (01) 481,552 2.92%
02 (02) 1,547 0.01%
03 (03) 680,118 4.13%
07 (07) 391,248 2.38%
08 (08) 391,238 2.38%
16 (10) 12 0.00%
17 (11) 10 0.00%
18 (12) 9 0.00%
22 (16) 1,319 0.01%
24 (18) 25,494 0.15%
32 (20) 4 0.00%
39 (27) 11,080 0.07%
48 (30) 18,810 0.11%
49 (31) 1097,861 6.67%
50 (32) 17 0.00%
51 (33) 1106,858 6.72%
53 (35) 844,346 5.13%
54 (36) 231,502 1.41%
55 (37) 875,717 5.32%
56 (38) 66 0.00%
64 (40) 13,833 0.08%
65 (41) 4,760 0.03%
66 (42) 8 0.00%
67 (43) 1000,309 6.07%
69 (45) 192 0.00%
71 (47) 95 0.00%
72 (48) 300,105 1.82%
76 (4C) 69 0.00%
80 (50) 4618,767 28.05%
85 (55) 10 0.00%
86 (56) 3392,251 20.60%
87 (57) 1 0.00%
99 (63) 1,282 0.01%
103 (67) 26,018 0.16%
109 (6D) 1,781 0.01%
153 (99) 127 0.00%
249 (F9) 337,481 2.05%
250 (FA) 612,895 3.72%
TOTAL 16468,792 100.00%
Record type Count % of total
IMS Worldwide Technical Support
4
e- bus
i ness powered byIMS
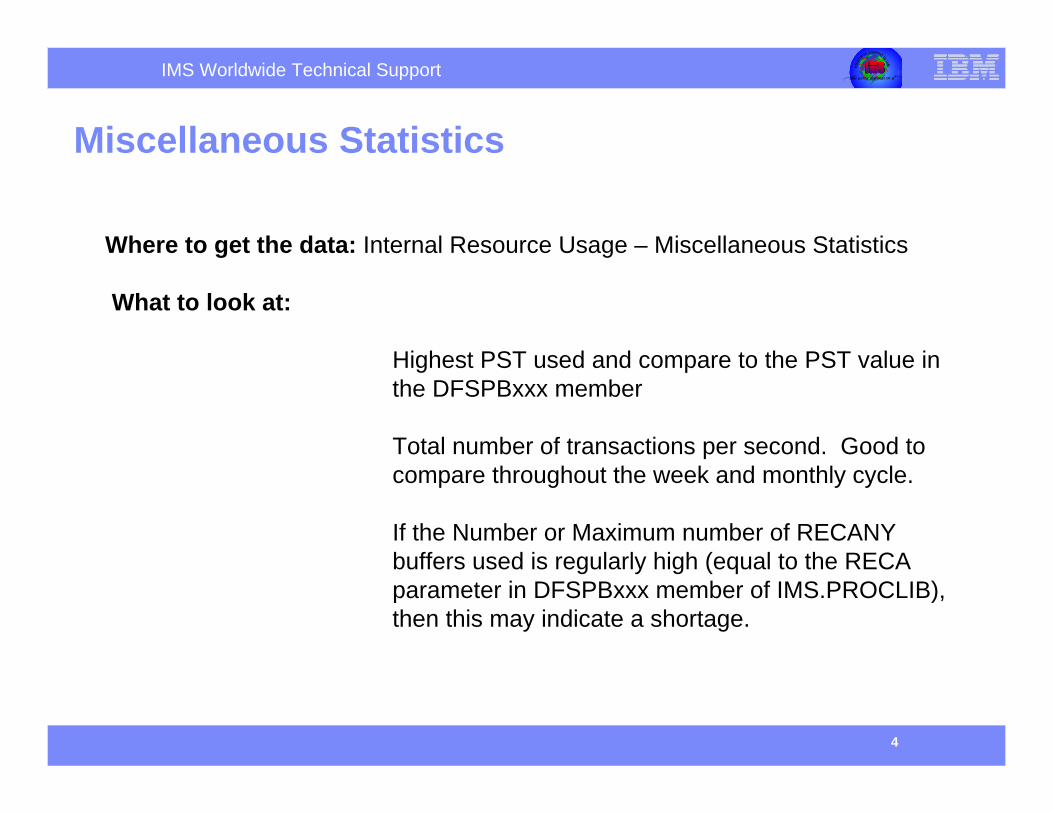
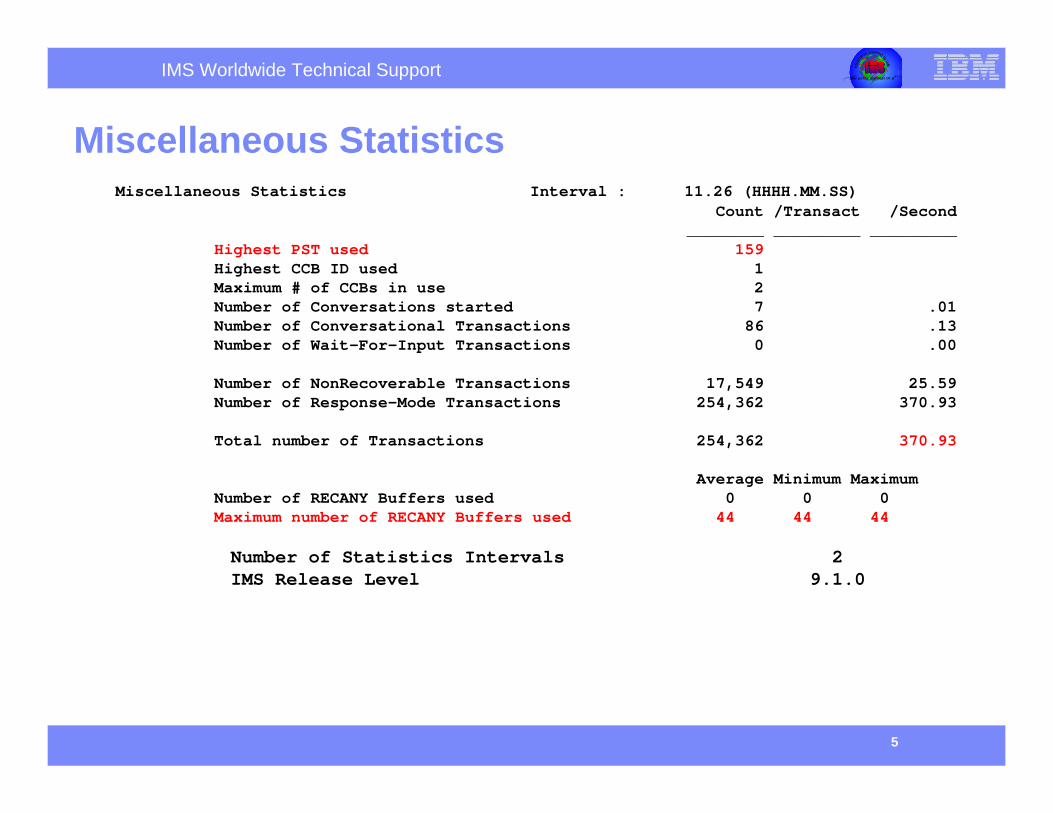
Miscellaneous Statistics
Where to get the data: Internal Resource Usage – Miscellaneous Statistics
What to look at:
Highest PST used and compare to the PST value in the DFSPBxxx member
Total number of transactions per second. Good to compare throughout the week and monthly cycle.
If the Number or Maximum number of RECANY buffers used is regularly high (equal to the RECA parameter in DFSPBxxx member of IMS.PROCLIB), then this may indicate a shortage.
IMS Worldwide Technical Support
5
e- bus
i ness powered byIMS
Miscellaneous StatisticsMiscellaneous Statistics Interval : 11.26 (HHHH.MM.SS)
Count /Transact /Second________ _________ _________
Highest PST used 159Highest CCB ID used 1Maximum # of CCBs in use 2Number of Conversations started 7 .01Number of Conversational Transactions 86 .13Number of Wait-For-Input Transactions 0 .00
Number of NonRecoverable Transactions 17,549 25.59Number of Response-Mode Transactions 254,362 370.93
Total number of Transactions 254,362 370.93
Average Minimum MaximumNumber of RECANY Buffers used 0 0 0Maximum number of RECANY Buffers used 44 44 44
Number of Statistics Intervals 2IMS Release Level 9.1.0
IMS Worldwide Technical Support
6
e- bus
i ness powered byIMS
Message Queue Pool Statistics
Where to get the data: Internal Resource Usage – Message Queue Pool Statistics
What to look at:
‘Writes done for space’ should be zero. If not zero increase the number of message queue buffers
The NUMBER OF WRITE REQUESTS(TOTAL) should be approximately = NUMBER OF WRITES DONE BY PURGE (the purge here is done by system checkpoint, not application syncpoint) If not =, increase the number of message queue buffers.
IMS Worldwide Technical Support
7
e- bus
i ness powered byIMS
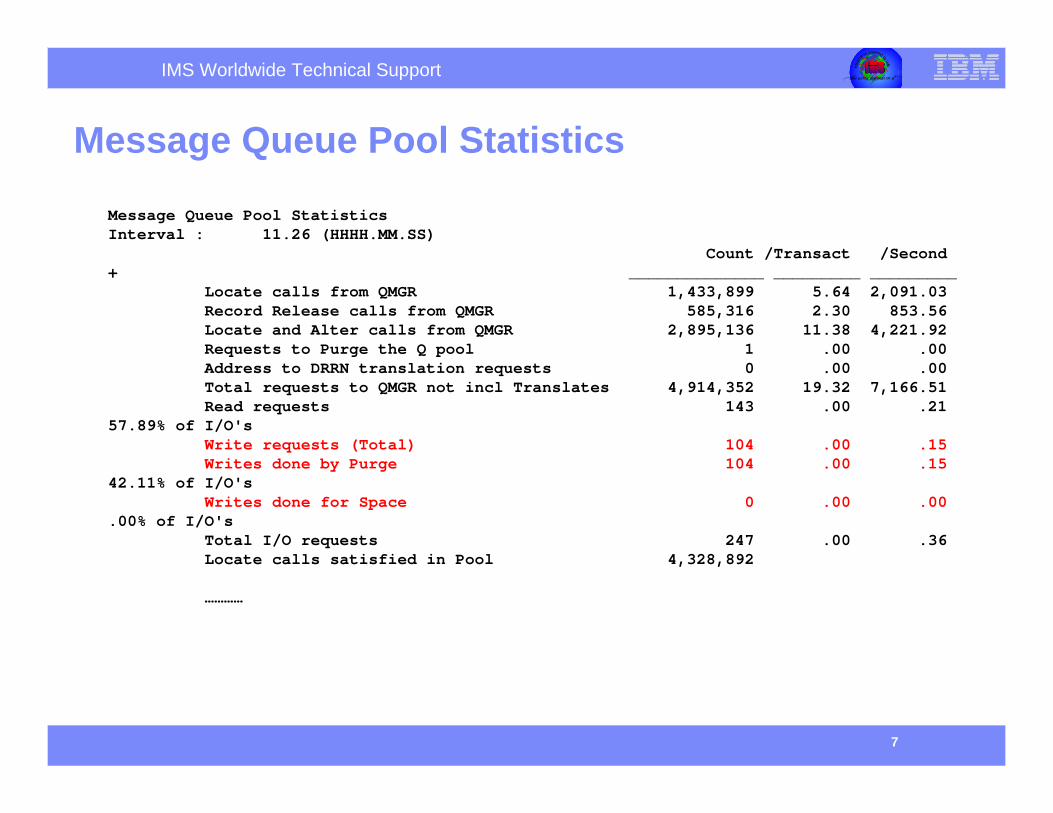
Message Queue Pool Statistics
Message Queue Pool Statistics Interval : 11.26 (HHHH.MM.SS)
Count /Transact /Second+ ______________ _________ _________
Locate calls from QMGR 1,433,899 5.64 2,091.03Record Release calls from QMGR 585,316 2.30 853.56Locate and Alter calls from QMGR 2,895,136 11.38 4,221.92Requests to Purge the Q pool 1 .00 .00Address to DRRN translation requests 0 .00 .00Total requests to QMGR not incl Translates 4,914,352 19.32 7,166.51Read requests 143 .00 .21
57.89% of I/O'sWrite requests (Total) 104 .00 .15Writes done by Purge 104 .00 .15
42.11% of I/O'sWrites done for Space 0 .00 .00
.00% of I/O'sTotal I/O requests 247 .00 .36Locate calls satisfied in Pool 4,328,892
…………
IMS Worldwide Technical Support
8
e- bus
i ness powered byIMS
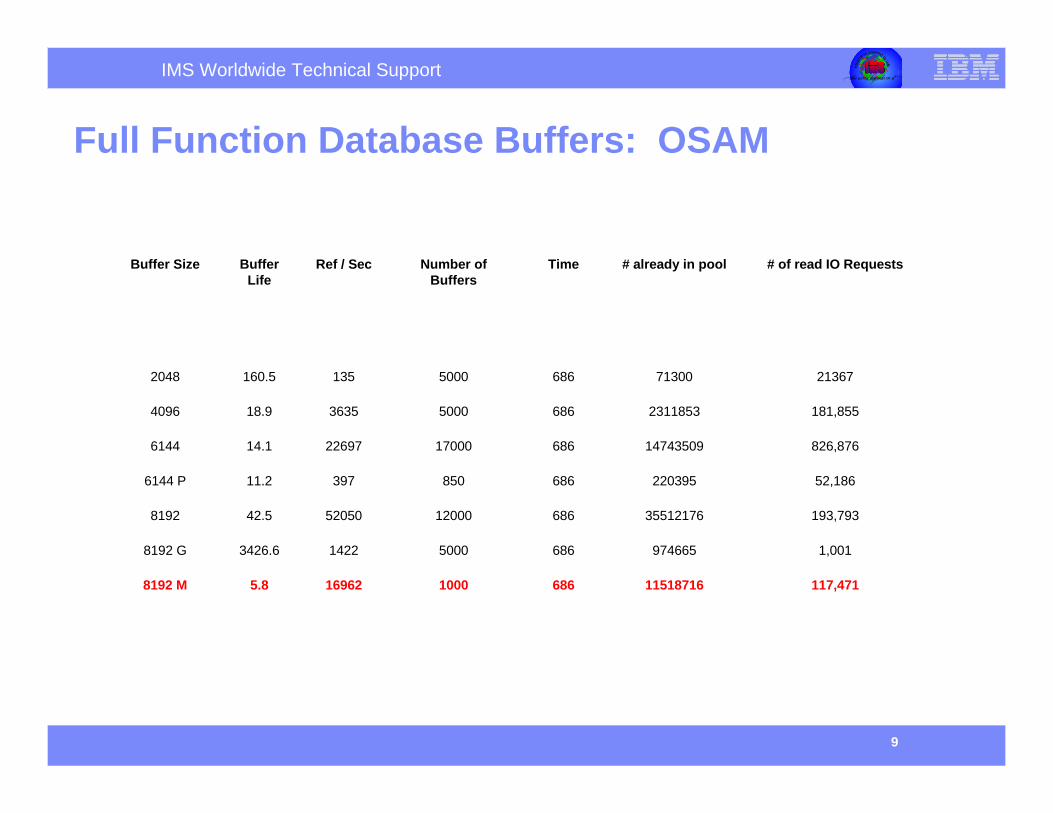
Full Function Database Buffers: OSAMWhere to get the data: Internal Resource Usage – Enhanced OSAM
Buffer Pool Statistics. Create a spread sheet from the data in the report.
What to look at:
The buffer life must be greater than the operator think time period and the time between each BMP checkpoint
When a buffer subpool is recording zero references per second, the subpool should be examined to see if any database are still using it. If not return the storage back forother subpools to use.
If it is possible to fix the buffers and control blocks, do so.
IMS Worldwide Technical Support
9
e- bus
i ness powered byIMS
Full Function Database Buffers: OSAM
117,471115187166861000169625.88192 M
1,001974665686500014223426.68192 G
193,79335512176686120005205042.58192
52,18622039568685039711.26144 P
826,87614743509686170002269714.16144
181,85523118536865000363518.94096
21367713006865000135160.52048
# of read IO Requests# already in poolTime Number of Buffers
Ref / SecBuffer Life
Buffer Size
IMS Worldwide Technical Support
10
e- bus
i ness powered byIMS
Full Function Database Buffers: VSAMWhere to get the data: Internal Resource Usage – Enhanced VSAM
Buffer Pool Statistics
What to look at:
The buffer life must be greater than the operator think time period and the time between each BMP checkpoint
When a buffer subpool is recording zero references per second, the subpool should be examined to see if any database are still using it. If not, return the storage back for other subpools to use.
If it is possible to fix the buffers and control blocks, do so.
IMS Worldwide Technical Support
11
e- bus
i ness powered byIMS
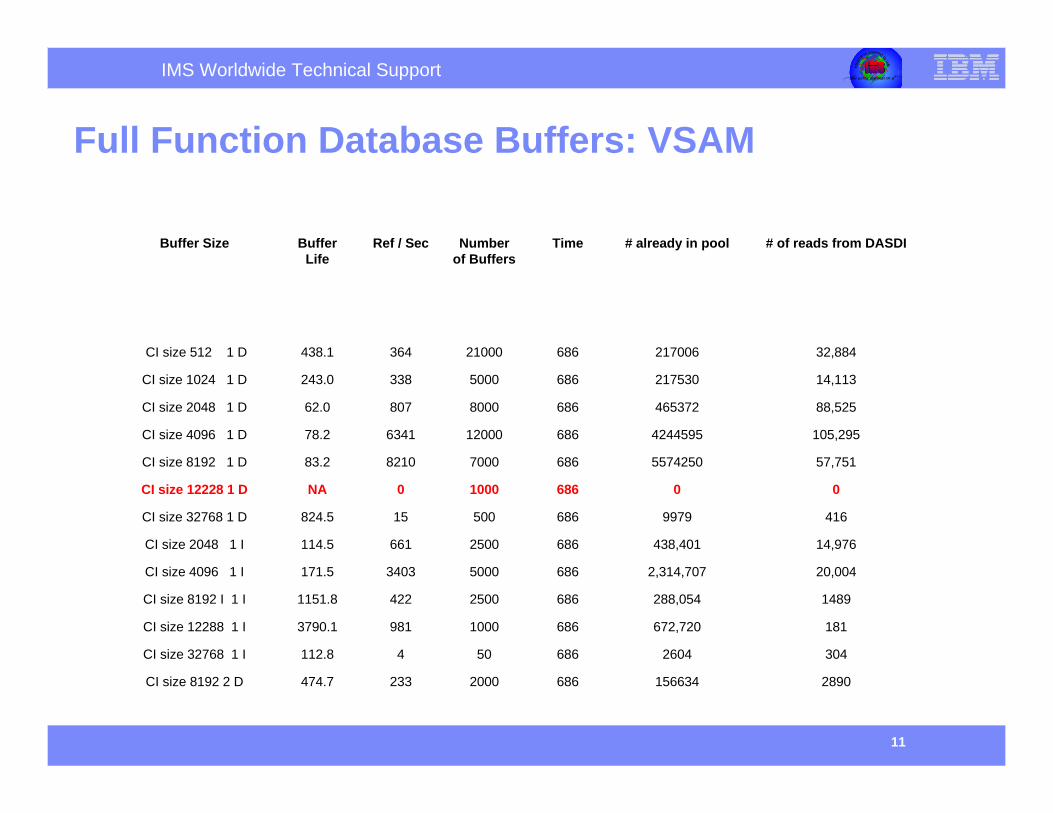
Full Function Database Buffers: VSAM
28901566346862000233474.7CI size 8192 2 D
3042604686504112.8CI size 32768 1 I
181672,72068610009813790.1CI size 12288 1 I
1489288,05468625004221151.8CI size 8192 I 1 I
20,0042,314,70768650003403171.5CI size 4096 1 I
14,976438,4016862500661114.5CI size 2048 1 I
416997968650015824.5CI size 32768 1 D
0068610000NACI size 12228 1 D
57,75155742506867000821083.2CI size 8192 1 D
105,295424459568612000634178.2CI size 4096 1 D
88,525465372686800080762.0CI size 2048 1 D
14,1132175306865000338243.0CI size 1024 1 D
32,88421700668621000364438.1CI size 512 1 D
# of reads from DASDI# already in poolTime Number of Buffers
Ref / SecBuffer Life
Buffer Size
IMS Worldwide Technical Support
12
e- bus
i ness powered byIMS
Variable IMS Pool Statistics
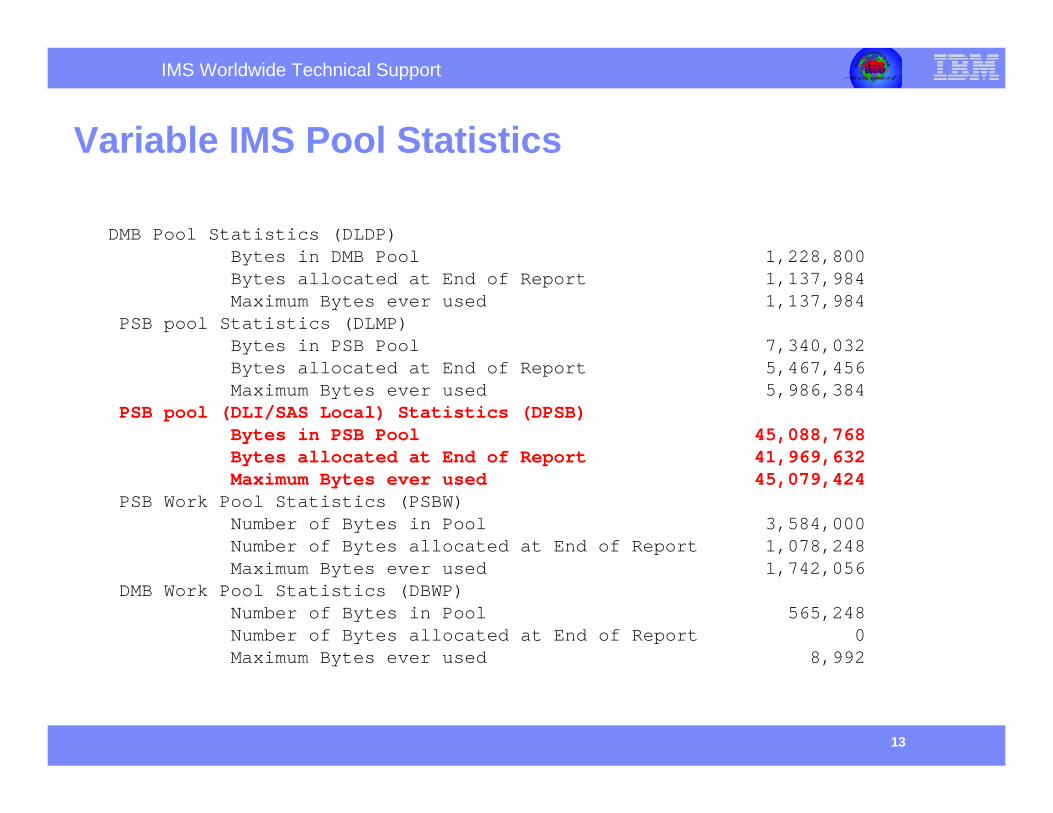
Where to get the data: Internal Resource Usage – Variable Pool Statistics
What to look at:
The variable IMS pool statistics present the initial, final, and maximum number bytes utilized for each pool.
If the maximum number of bytes utilized is close to the initial value AND there were instances of a number of control blocks cast out to make room for new structures, then the pool size should be increased and then monitored via the use of IMS PA.
IMS Worldwide Technical Support
13
e- bus
i ness powered byIMS
Variable IMS Pool Statistics
DMB Pool Statistics (DLDP)Bytes in DMB Pool 1,228,800Bytes allocated at End of Report 1,137,984Maximum Bytes ever used 1,137,984
PSB pool Statistics (DLMP)Bytes in PSB Pool 7,340,032Bytes allocated at End of Report 5,467,456Maximum Bytes ever used 5,986,384
PSB pool (DLI/SAS Local) Statistics (DPSB)Bytes in PSB Pool 45,088,768Bytes allocated at End of Report 41,969,632Maximum Bytes ever used 45,079,424
PSB Work Pool Statistics (PSBW)Number of Bytes in Pool 3,584,000Number of Bytes allocated at End of Report 1,078,248Maximum Bytes ever used 1,742,056
DMB Work Pool Statistics (DBWP)Number of Bytes in Pool 565,248Number of Bytes allocated at End of Report 0Maximum Bytes ever used 8,992
IMS Worldwide Technical Support
14
e- bus
i ness powered byIMS
Variable IMS Pool Statistics
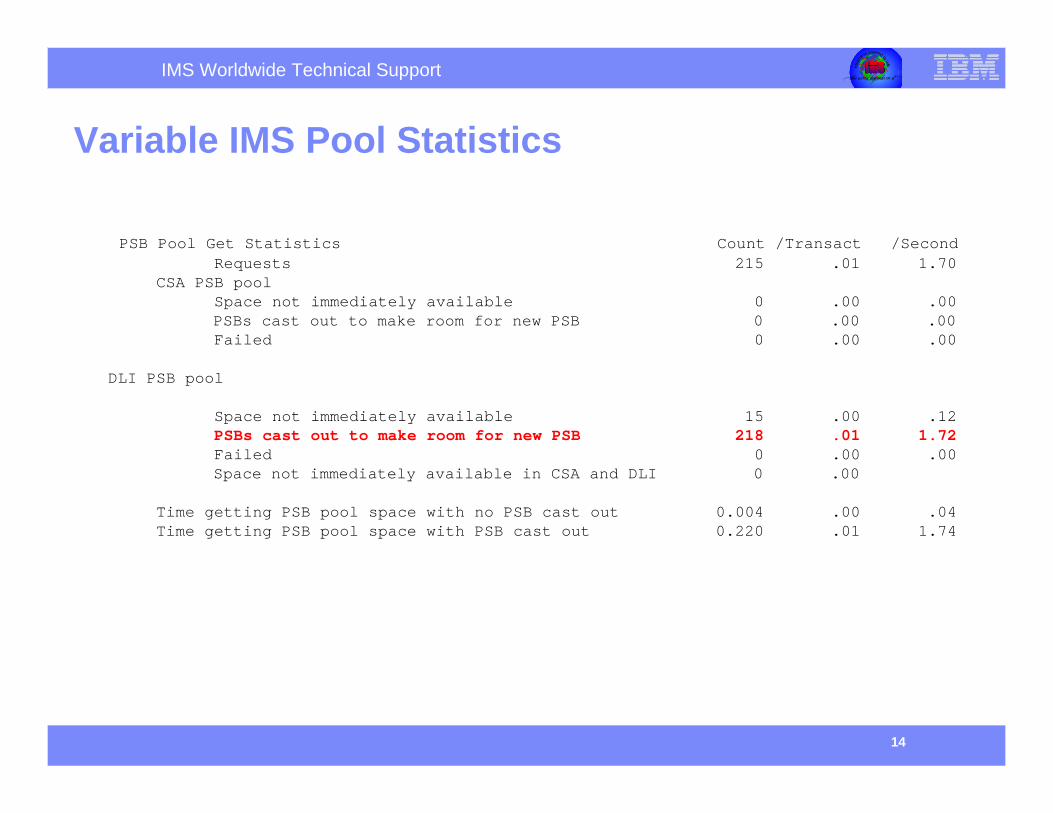
PSB Pool Get Statistics Count /Transact /Second Requests 215 .01 1.70
CSA PSB poolSpace not immediately available 0 .00 .00PSBs cast out to make room for new PSB 0 .00 .00Failed 0 .00 .00
DLI PSB pool
Space not immediately available 15 .00 .12PSBs cast out to make room for new PSB 218 .01 1.72Failed 0 .00 .00Space not immediately available in CSA and DLI 0 .00
Time getting PSB pool space with no PSB cast out 0.004 .00 .04Time getting PSB pool space with PSB cast out 0.220 .01 1.74
IMS Worldwide Technical Support
15
e- bus
i ness powered byIMS
Resource Availability
Where to get the data: Search on Resource Availability
What to look at:
Review the number of WFI regions to determine if the environment is adequately resourced.
If regions have very low occupancy values there may be opportunities for re classification of transactions or merging of started regions.
IMS Worldwide Technical Support
16
e- bus
i ness powered byIMS
Resource Availability
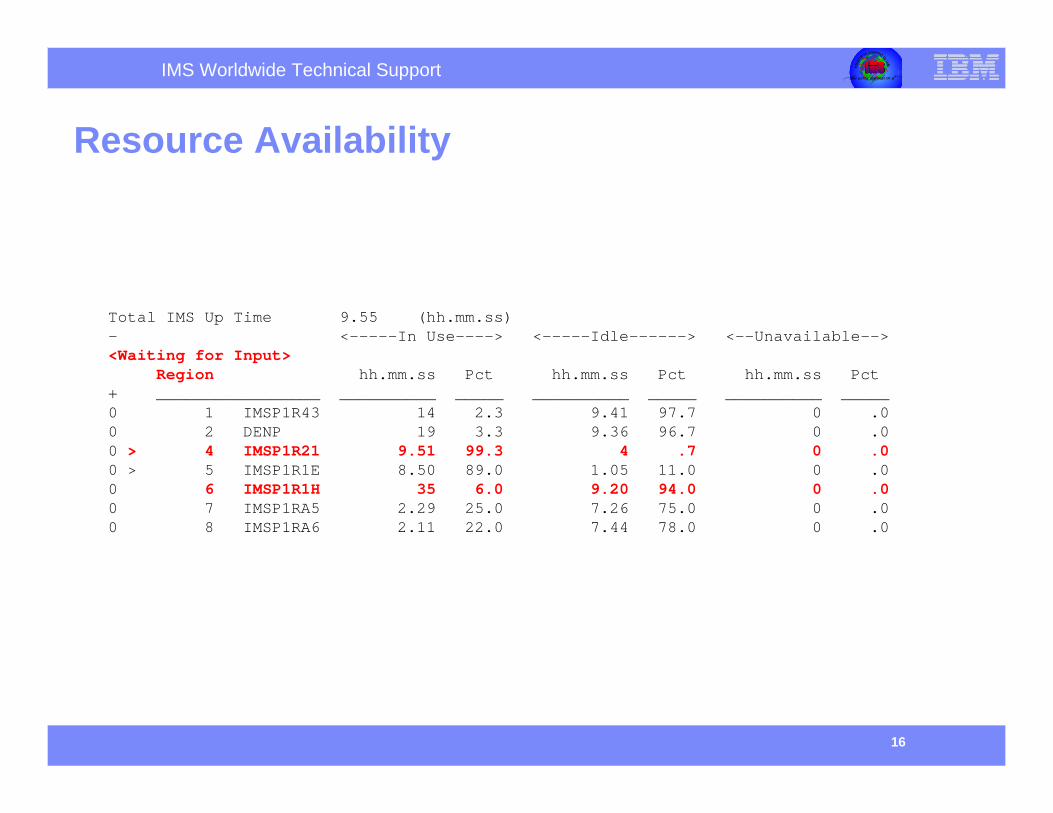
Total IMS Up Time 9.55 (hh.mm.ss)- <-----In Use----> <-----Idle------> <--Unavailable--> <Waiting for Input>
Region hh.mm.ss Pct hh.mm.ss Pct hh.mm.ss Pct + _________________ __________ _____ __________ _____ __________ _____ 0 1 IMSP1R43 14 2.3 9.41 97.7 0 .00 2 DENP 19 3.3 9.36 96.7 0 .00 > 4 IMSP1R21 9.51 99.3 4 .7 0 .00 > 5 IMSP1R1E 8.50 89.0 1.05 11.0 0 .0 0 6 IMSP1R1H 35 6.0 9.20 94.0 0 .00 7 IMSP1RA5 2.29 25.0 7.26 75.0 0 .00 8 IMSP1RA6 2.11 22.0 7.44 78.0 0 .0
IMS Worldwide Technical Support
17
e- bus
i ness powered byIMS
Latch Conflict Statistics
Where to get the data: Internal Resource Usage – Latch Conflict Statistics
What to look at:
Latching is an internal IMS code serialization methodology that normally does not affect the throughput through IMS.
But if the LOGR latch reflects a very high value per second (above 100 per second for example) then this could result in a recommendation to increase the IMS OLDS buffer allocation in the DFSVSMxx member.
Also the WADS dataset may have to be increased in size if the number of OLDS buffer has to be increased dramatically.
IMS Worldwide Technical Support
18
e- bus
i ness powered byIMS
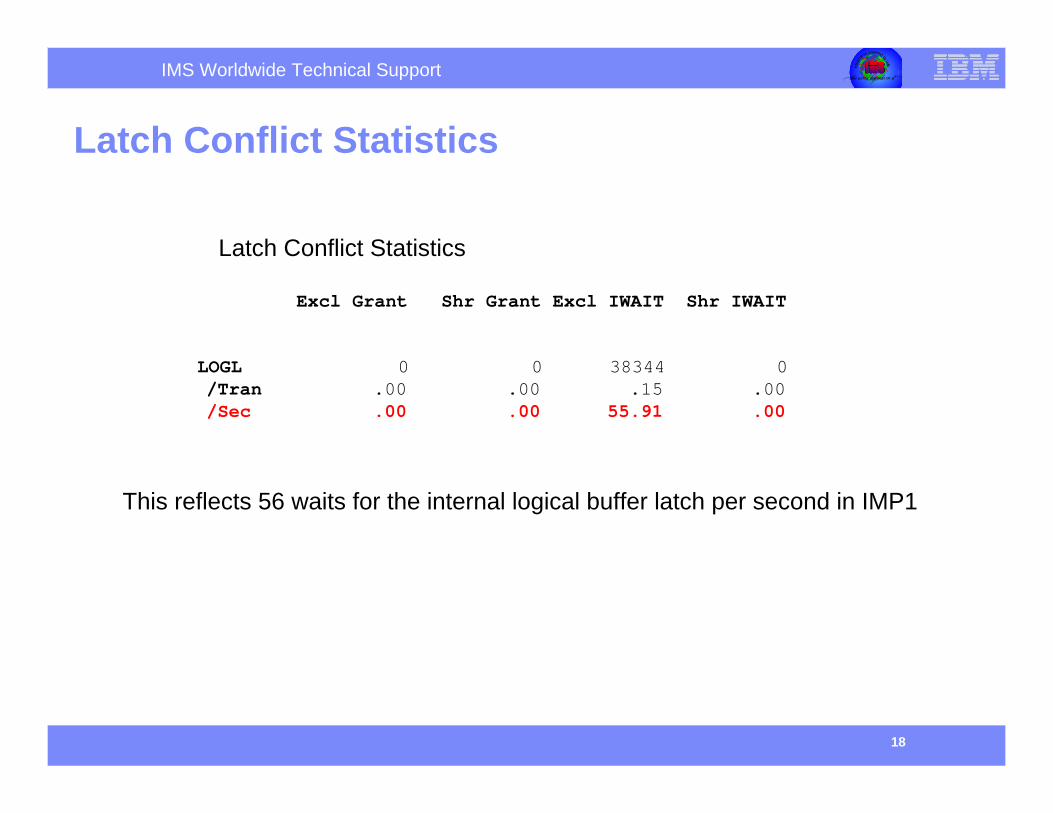
Latch Conflict Statistics
LOGL 0 0 38344 0 /Tran .00 .00 .15 .00 /Sec .00 .00 55.91 .00
Latch Conflict Statistics
Excl Grant Shr Grant Excl IWAIT Shr IWAIT
This reflects 56 waits for the internal logical buffer latch per second in IMP1
IMS Worldwide Technical Support
19
e- bus
i ness powered byIMS
Logger Statistics
Where to get the data: Internal Resource Usage – Logger Statistics
What to look at:
The buffer waits for non – checkpoint invokers should be zero. When a checkpoint occurs, all the OLDS buffers are purged to disk so it is not unusual to experience a wait for buffers at that time.
The amount of data being written to the WADS can be calculated by multiplying the number of 2K segment writes initiated per second by 2048. It provides an indication of how quickly log records are being externalized.
IMS Worldwide Technical Support
20
e- bus
i ness powered byIMS
Logger Statistics
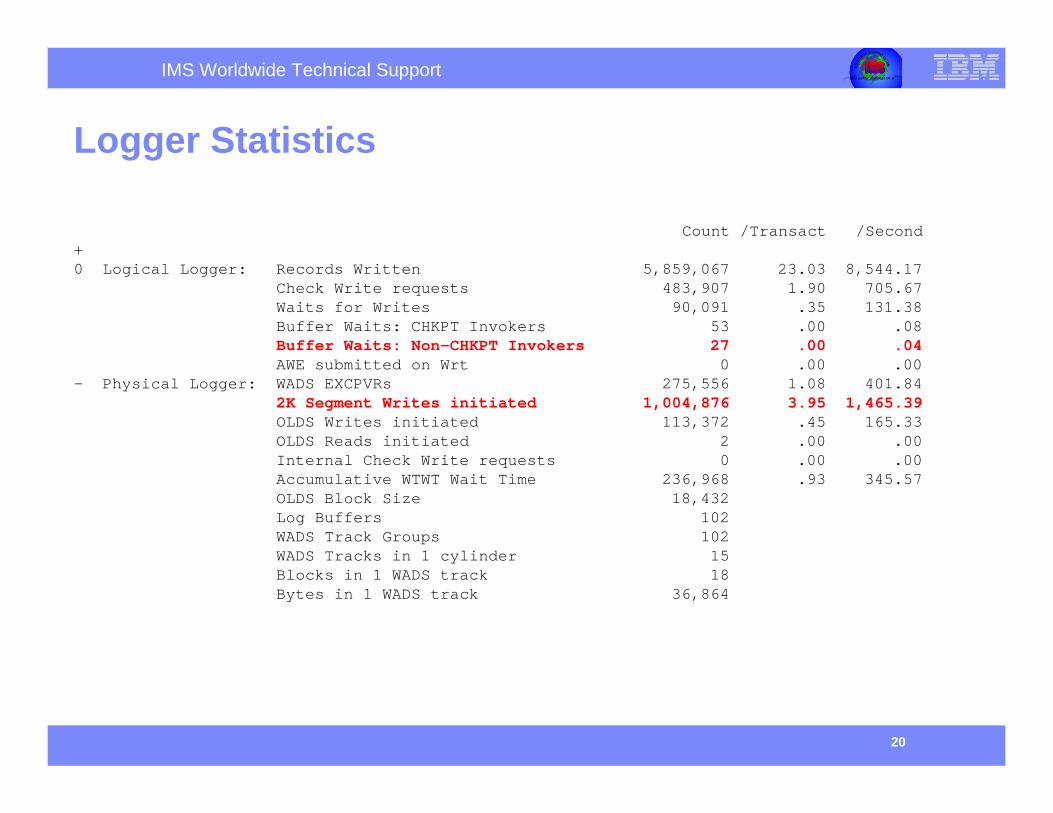
Count /Transact /Second+ 0 Logical Logger: Records Written 5,859,067 23.03 8,544.17
Check Write requests 483,907 1.90 705.67Waits for Writes 90,091 .35 131.38Buffer Waits: CHKPT Invokers 53 .00 .08Buffer Waits: Non-CHKPT Invokers 27 .00 .04AWE submitted on Wrt 0 .00 .00
- Physical Logger: WADS EXCPVRs 275,556 1.08 401.842K Segment Writes initiated 1,004,876 3.95 1,465.39OLDS Writes initiated 113,372 .45 165.33OLDS Reads initiated 2 .00 .00Internal Check Write requests 0 .00 .00Accumulative WTWT Wait Time 236,968 .93 345.57OLDS Block Size 18,432Log Buffers 102WADS Track Groups 102WADS Tracks in 1 cylinder 15Blocks in 1 WADS track 18Bytes in 1 WADS track 36,864
IMS Worldwide Technical Support
21
e- bus
i ness powered byIMS
Scheduling Statistics
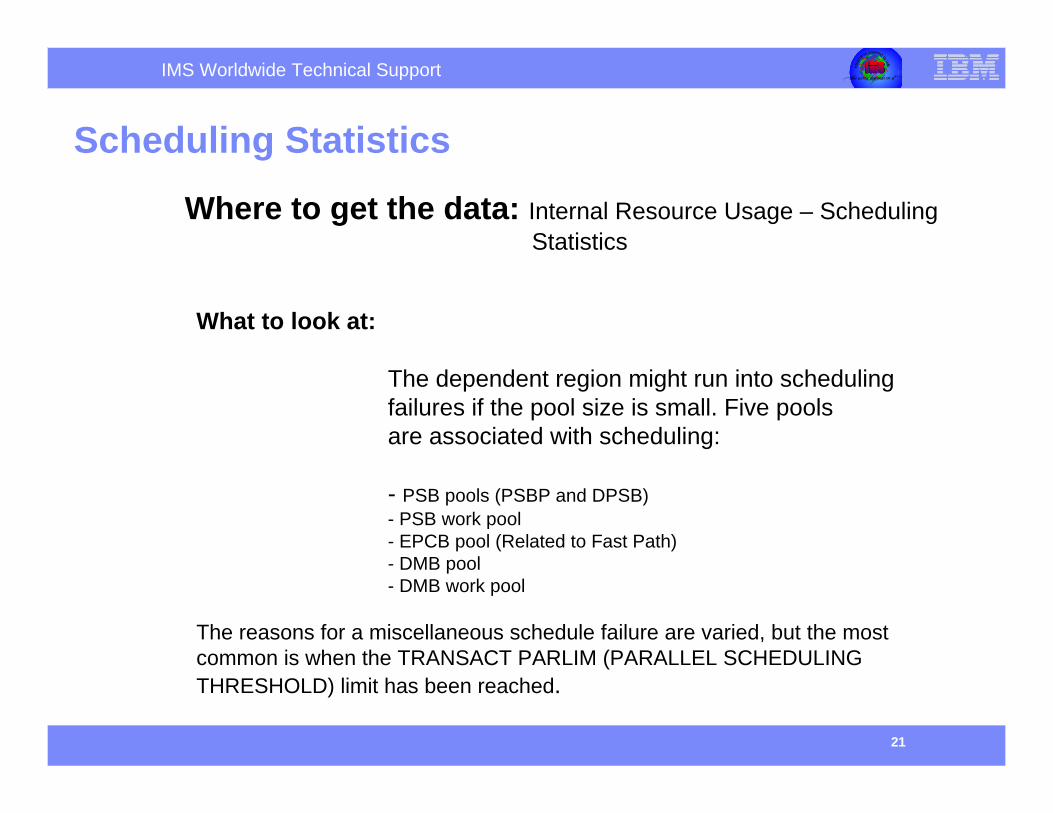
Where to get the data: Internal Resource Usage – Scheduling Statistics
What to look at:
The dependent region might run into scheduling failures if the pool size is small. Five poolsare associated with scheduling:
- PSB pools (PSBP and DPSB)- PSB work pool- EPCB pool (Related to Fast Path)- DMB pool- DMB work pool
The reasons for a miscellaneous schedule failure are varied, but the most common is when the TRANSACT PARLIM (PARALLEL SCHEDULING THRESHOLD) limit has been reached.
IMS Worldwide Technical Support
22
e- bus
i ness powered byIMS
Scheduling Statistics
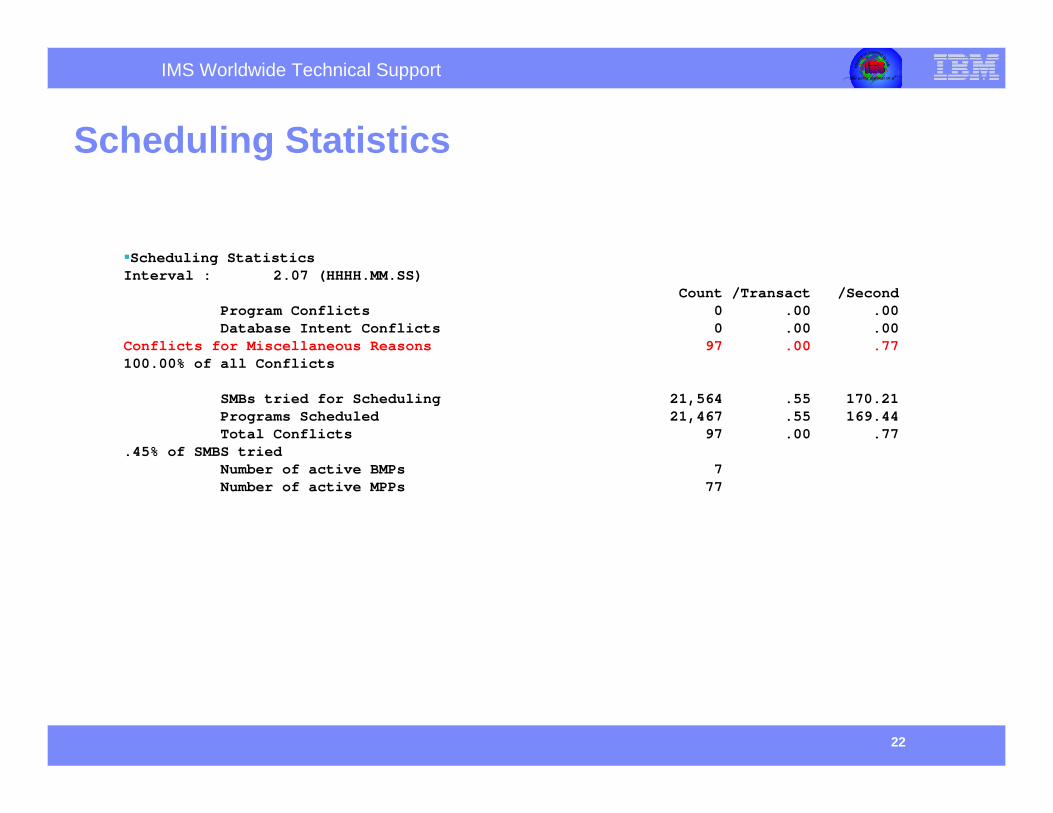
Scheduling Statistics Interval : 2.07 (HHHH.MM.SS)
Count /Transact /SecondProgram Conflicts 0 .00 .00Database Intent Conflicts 0 .00 .00
Conflicts for Miscellaneous Reasons 97 .00 .77100.00% of all Conflicts
SMBs tried for Scheduling 21,564 .55 170.21Programs Scheduled 21,467 .55 169.44Total Conflicts 97 .00 .77
.45% of SMBS triedNumber of active BMPs 7Number of active MPPs 77
IMS Worldwide Technical Support
23
e- bus
i ness powered byIMS
Conclusion
For more information refer to:
IBM IMS Performance Analyzer for z/OS,Report Reference Version 4 Release 1: SC18-9779-02
IMS Performance Analyzer for z/OS User’s Guide: SC18-9778
IMS Performance and Tuning Guide: SG24-7324-00