Embed Size (px)
Citation preview
Mark Friedman
Demand Technology Software
http://computerperformancebydesign.com
1
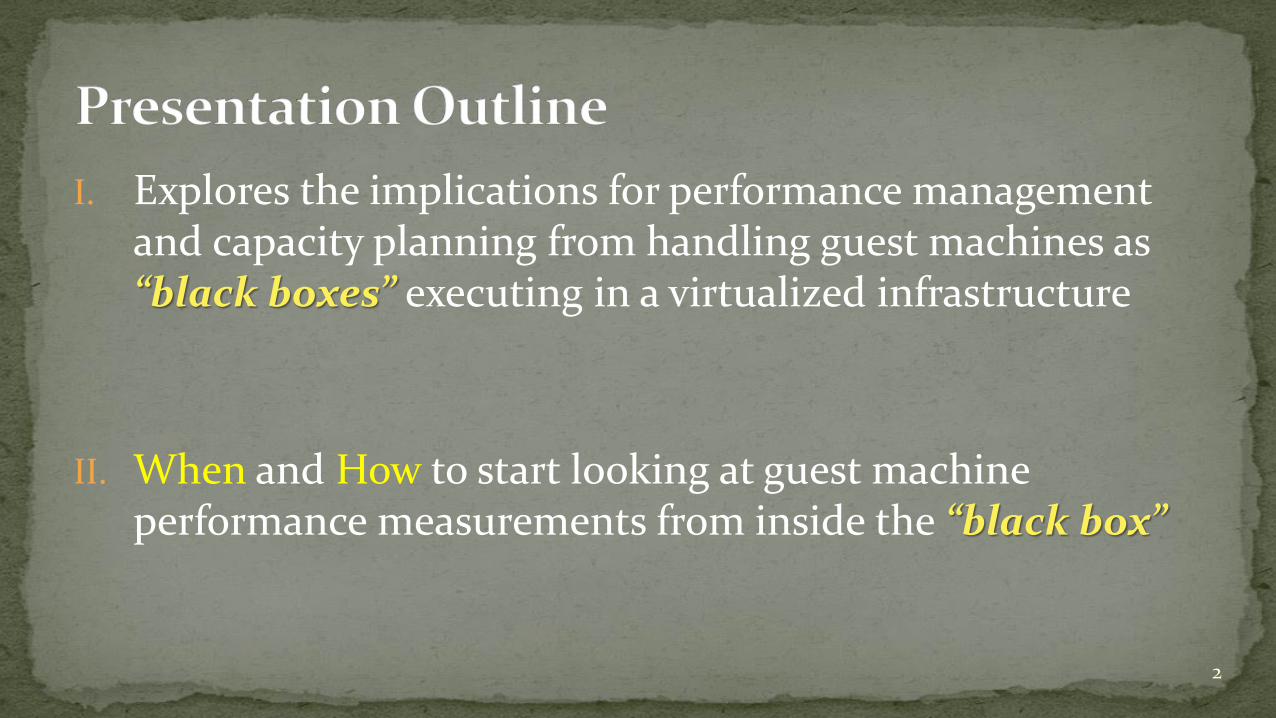
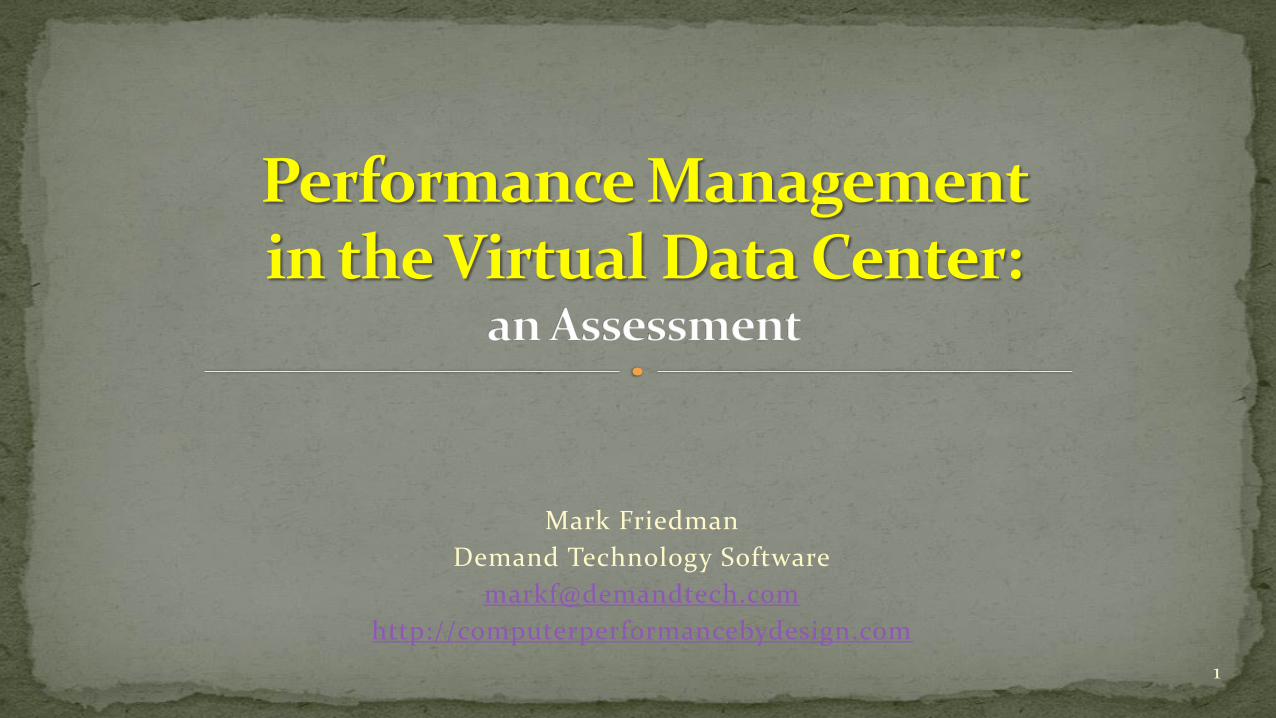
I. Explores the implications for performance management and capacity planning from handling guest machines as “black boxes” executing in a virtualized infrastructure
II. When and How to start looking at guest machine performance measurements from inside the “black box”
2
Background: the challenges virtualization brings to the traditional view of capacity planning
Virtualization Host software architecture Sources of virtualization overheads
Performance stretch factors Right-sizing guests Over-committed VM Hosts Under-provisioned Guests
Guest machine measurement anomalies due to virtualized timer and clock interrupts
3
Software virtualization is an approach to partitioning hardware to allow multiple guest machines to execute on a single hardware platform Simulate the full computing environment in a manner that is 100%
transparent to the guest OS black box approach
Fundamental requirement that any program that executes correctly in a native environment not fail when it is a running on a virtual machine & continues to produce the same output/results extends to the OS, device drivers, and applications includes emulation of hardware function like interrupts, synchronization
primitives and clocks4
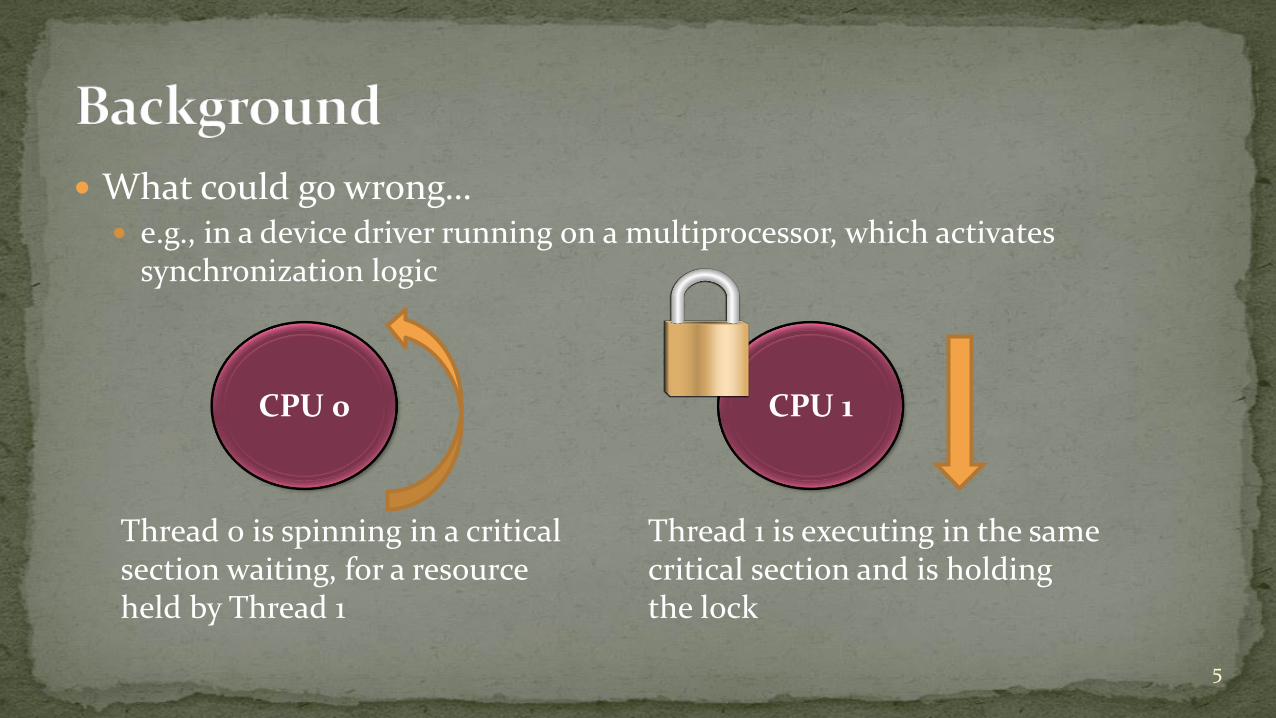
What could go wrong… e.g., in a device driver running on a multiprocessor, which activates
synchronization logic
5
CPU 0
Thread 0 is spinning in a critical section waiting, for a resource held by Thread 1
CPU 1
Thread 1 is executing in the same critical section and is holding the lock
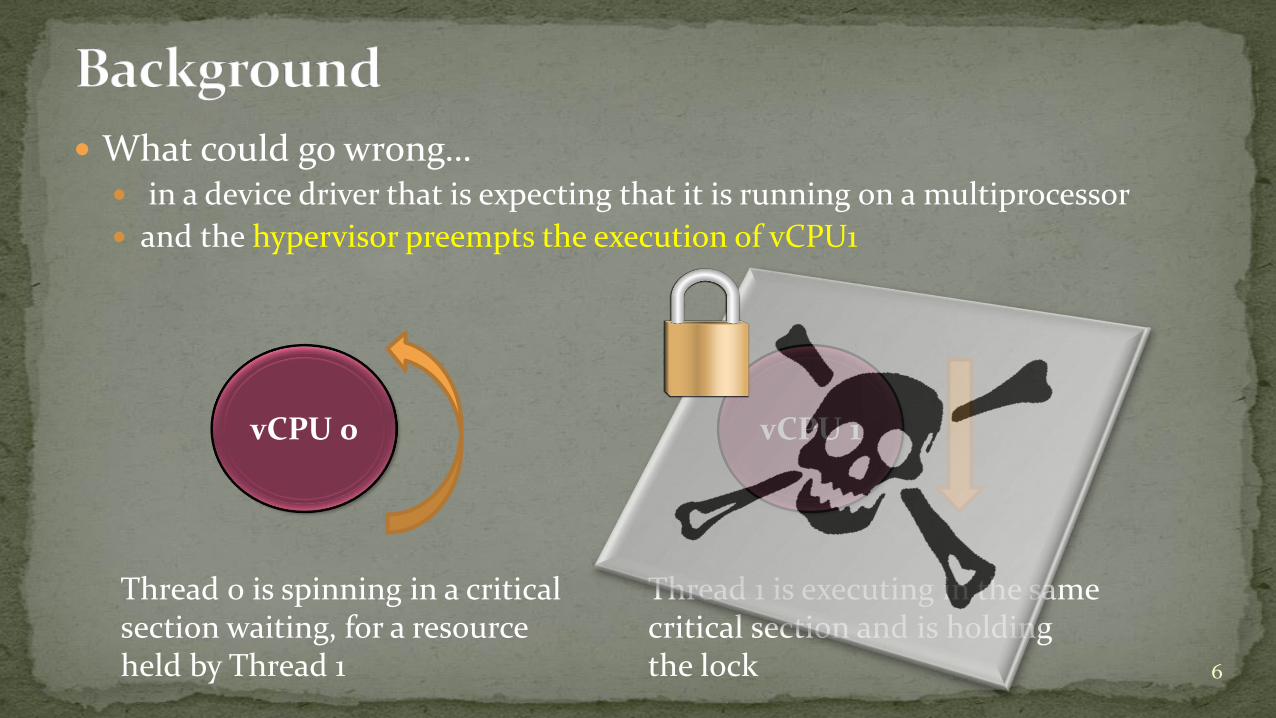
What could go wrong… in a device driver that is expecting that it is running on a multiprocessor
and the hypervisor preempts the execution of vCPU1
6
vCPU 0
Thread 0 is spinning in a critical section waiting, for a resource held by Thread 1
vCPU 1
Thread 1 is executing in the same critical section and is holding the lock
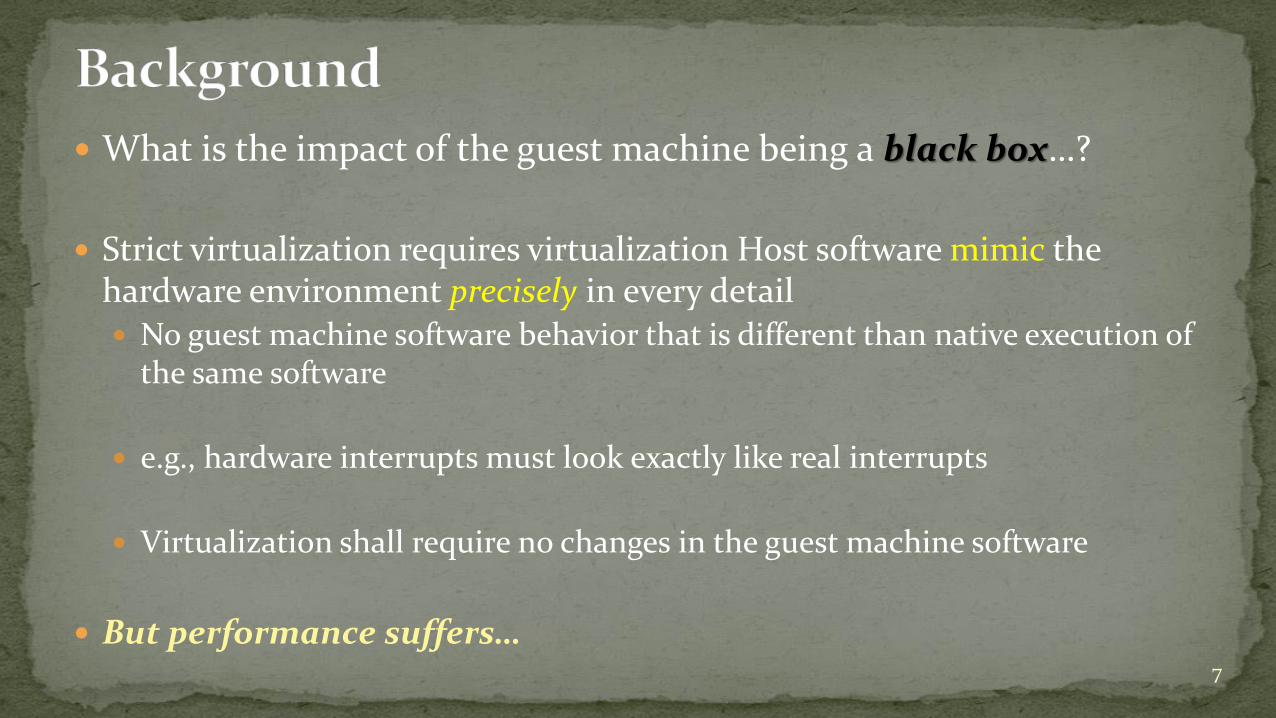
What is the impact of the guest machine being a black box…?
Strict virtualization requires virtualization Host software mimic the hardware environment precisely in every detail No guest machine software behavior that is different than native execution of
the same software
e.g., hardware interrupts must look exactly like real interrupts
Virtualization shall require no changes in the guest machine software
But performance suffers…7
8
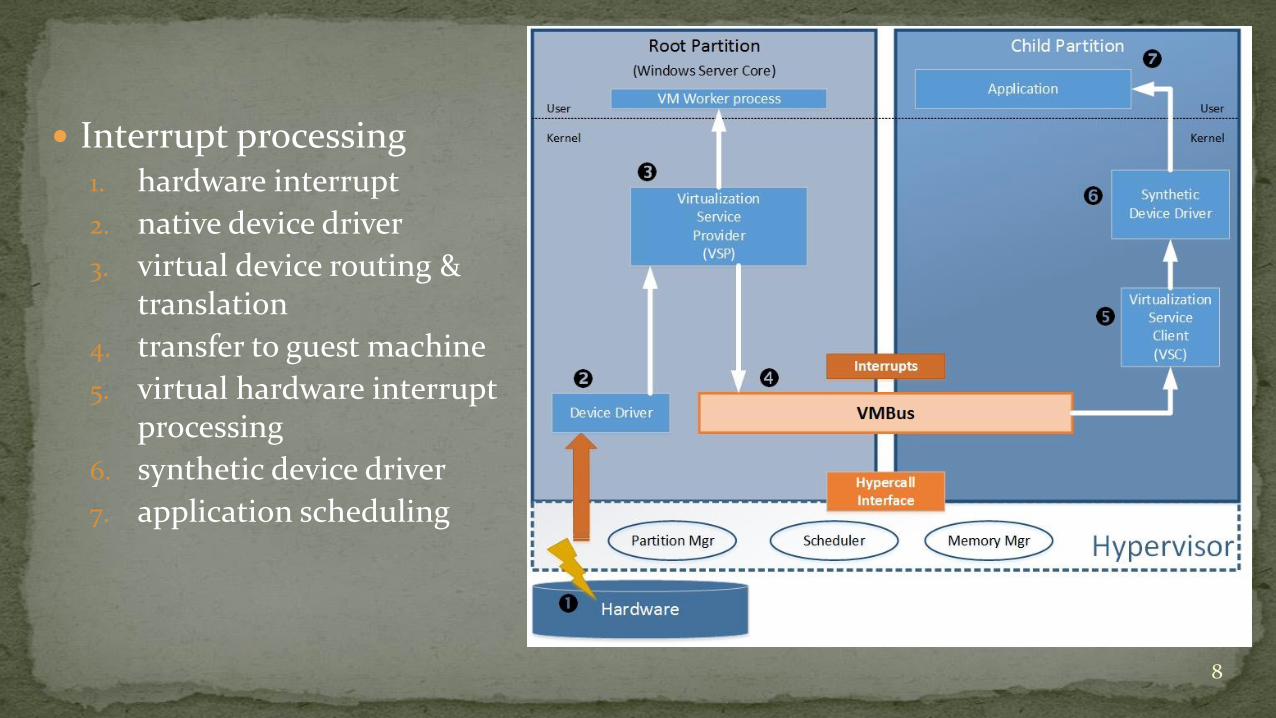
Interrupt processing1. hardware interrupt
2. native device driver
3. virtual device routing & translation
4. transfer to guest machine
5. virtual hardware interrupt processing
6. synthetic device driver
7. application scheduling
9
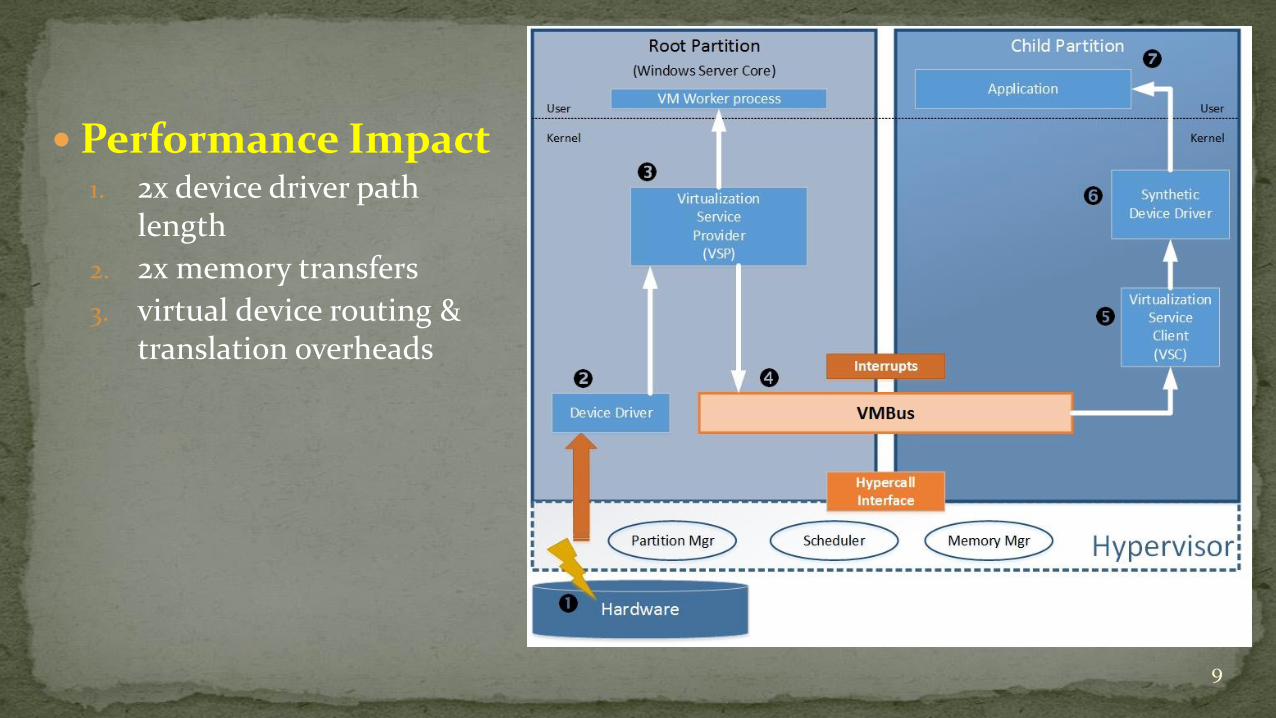
Performance Impact1. 2x device driver path
length
2. 2x memory transfers
3. virtual device routing & translation overheads
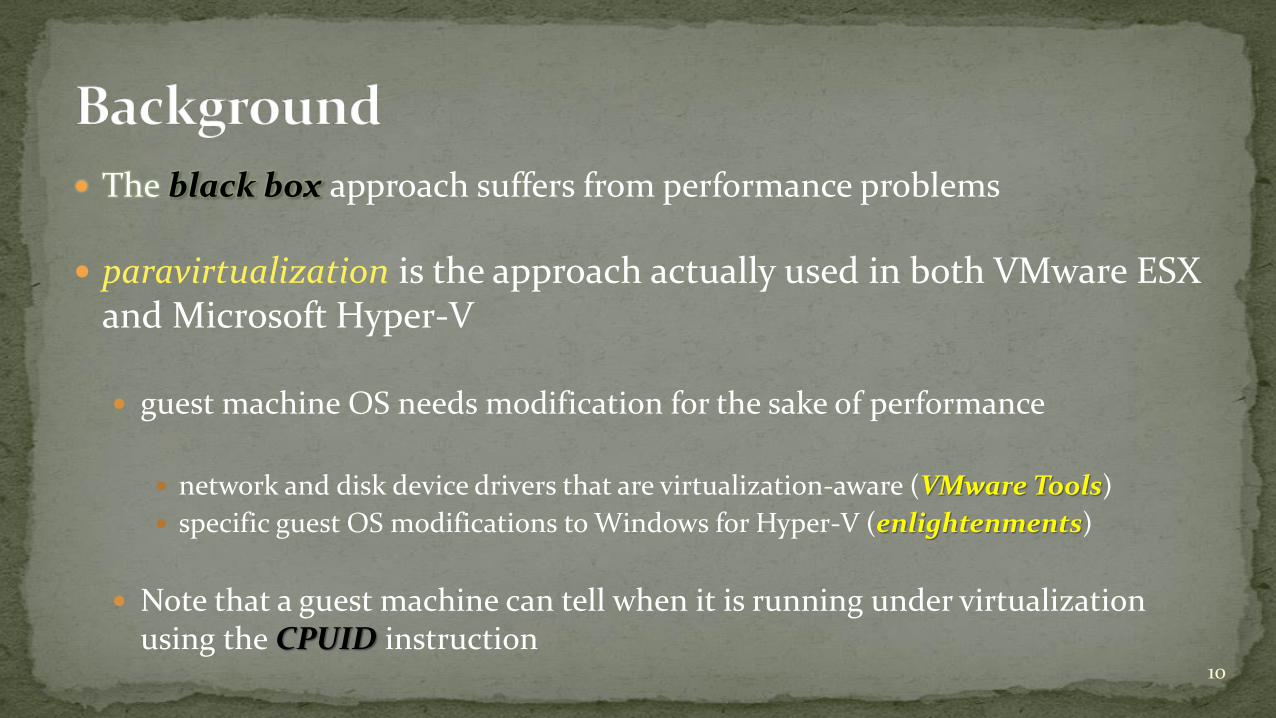
The black box approach suffers from performance problems
paravirtualization is the approach actually used in both VMware ESX and Microsoft Hyper-V
guest machine OS needs modification for the sake of performance
network and disk device drivers that are virtualization-aware (VMware Tools)
specific guest OS modifications to Windows for Hyper-V (enlightenments)
Note that a guest machine can tell when it is running under virtualization using the CPUID instruction
10
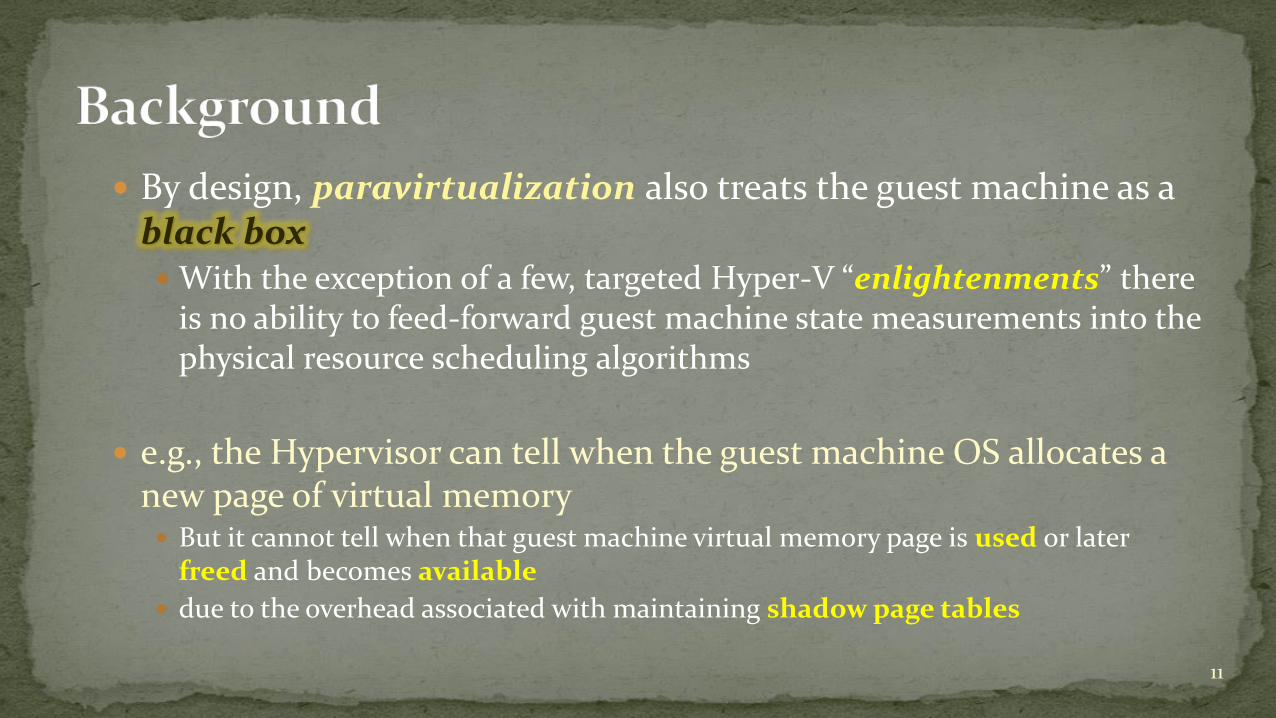
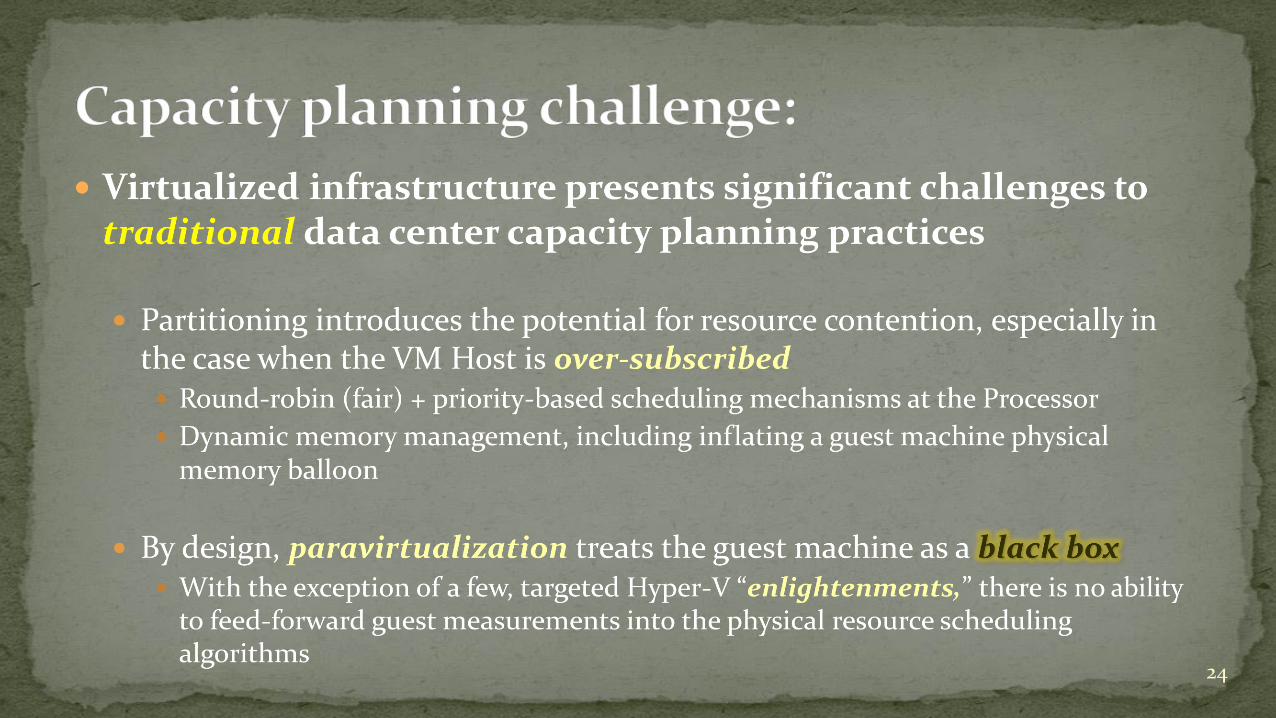
By design, paravirtualization also treats the guest machine as a black box With the exception of a few, targeted Hyper-V “enlightenments” there
is no ability to feed-forward guest machine state measurements into the physical resource scheduling algorithms
e.g., the Hypervisor can tell when the guest machine OS allocates a new page of virtual memory But it cannot tell when that guest machine virtual memory page is used or later
freed and becomes available
due to the overhead associated with maintaining shadow page tables
11
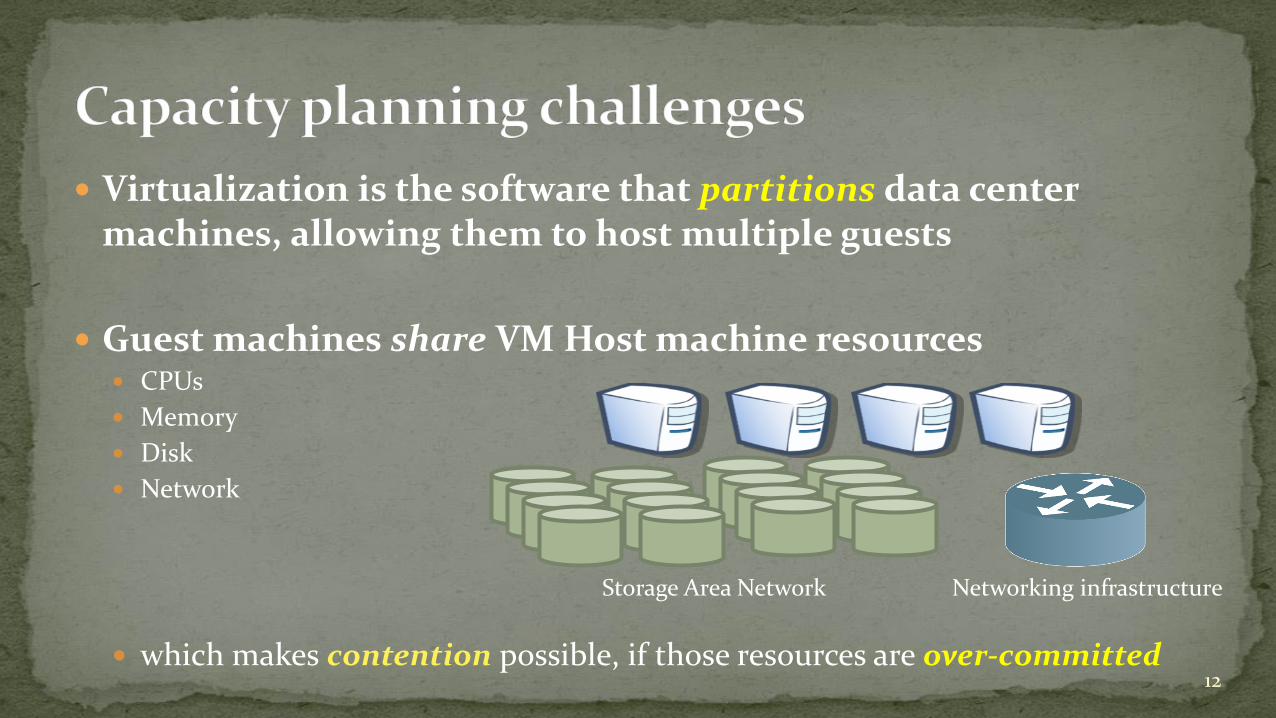
Virtualization is the software that partitions data center machines, allowing them to host multiple guests
Guest machines share VM Host machine resources CPUs
Memory
Disk
Network
which makes contention possible, if those resources are over-committed12
Storage Area Network Networking infrastructure
Windows Server machines are often run under virtualization Usually VMware or Hyper-V
On premises or in the Cloud
Windows Server machines are usually dedicated to running a single application Web server, SQL Server, Exchange Server, etc.
Most of these guest machines require far fewer hardware resources than typical data center machines possess
13
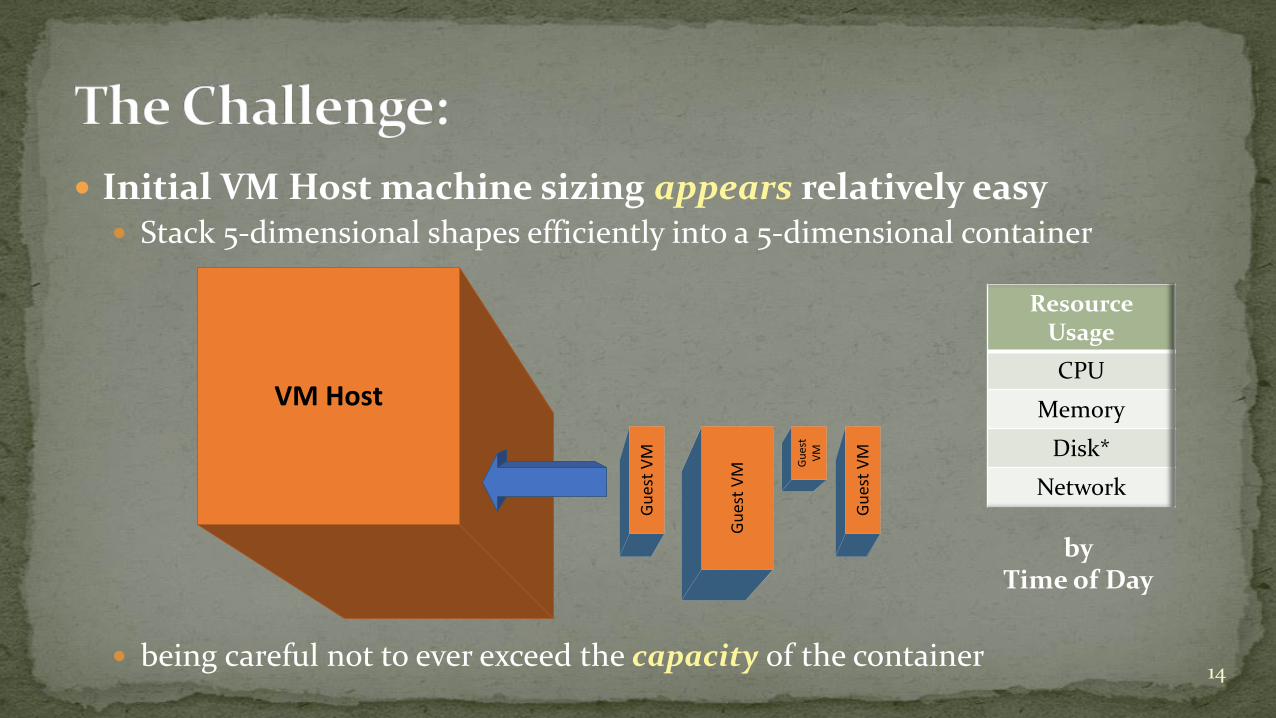
Initial VM Host machine sizing appears relatively easy Stack 5-dimensional shapes efficiently into a 5-dimensional container
being careful not to ever exceed the capacity of the container14
VM Host
Gu
est
VM
Gu
est
VM
Gu
est
VM
Gu
est
VM
ResourceUsage
CPU
Memory
Disk*
Network
by Time of Day
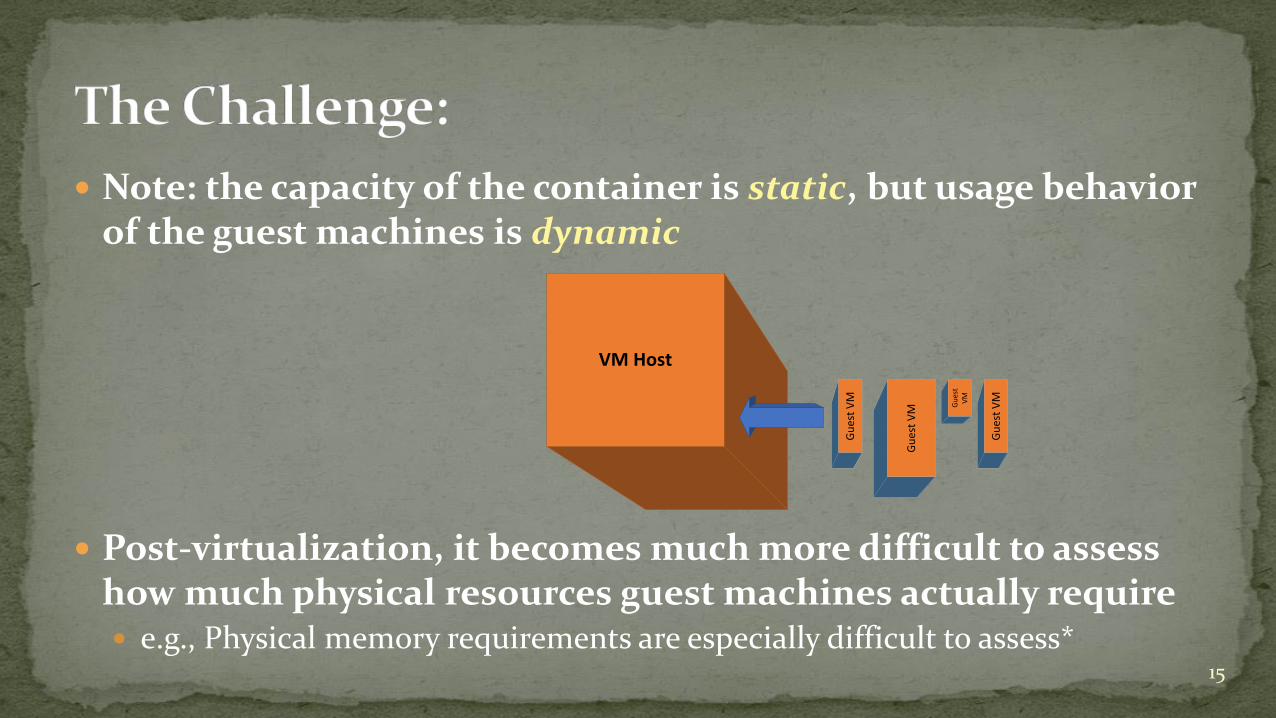
Note: the capacity of the container is static, but usage behavior of the guest machines is dynamic
Post-virtualization, it becomes much more difficult to assess how much physical resources guest machines actually require e.g., Physical memory requirements are especially difficult to assess*
15
VM Host
Gu
est
VM
Gu
est
VM
Gu
est
VM
Gu
est
VM
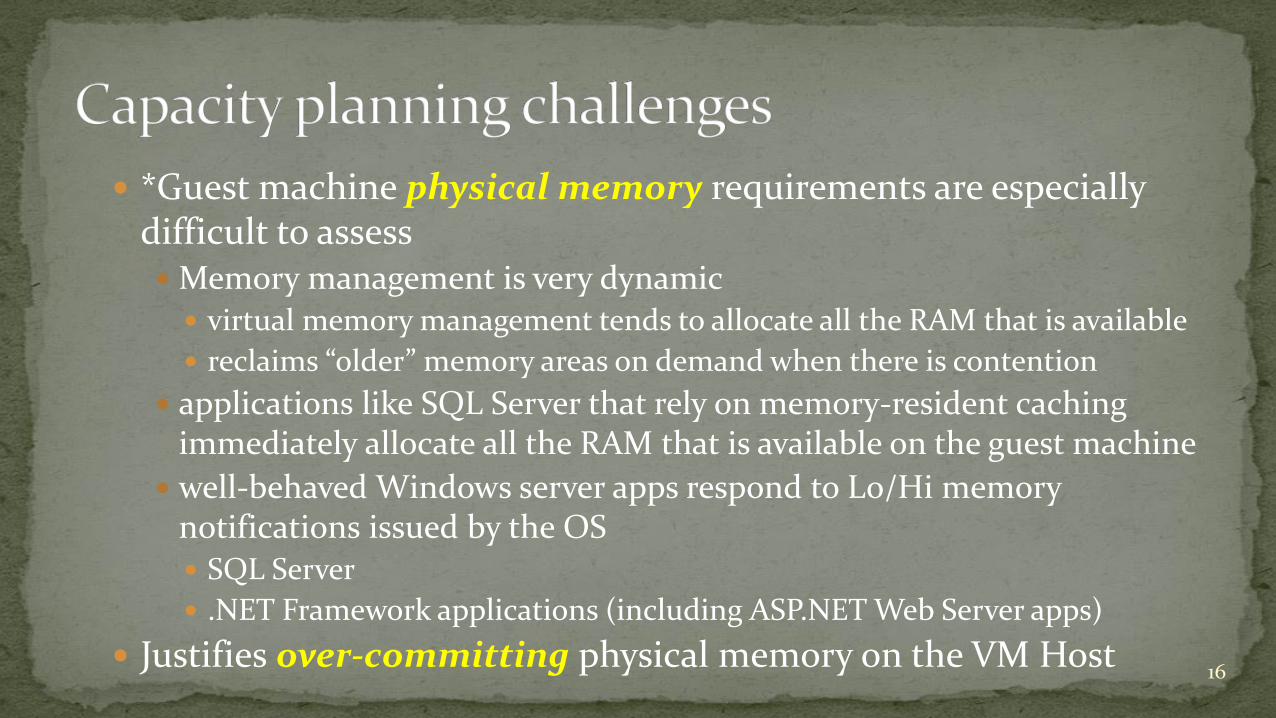
*Guest machine physical memory requirements are especially difficult to assess Memory management is very dynamic
virtual memory management tends to allocate all the RAM that is available
reclaims “older” memory areas on demand when there is contention
applications like SQL Server that rely on memory-resident caching immediately allocate all the RAM that is available on the guest machine
well-behaved Windows server apps respond to Lo/Hi memory notifications issued by the OS SQL Server
.NET Framework applications (including ASP.NET Web Server apps)
Justifies over-committing physical memory on the VM Host16
Managing a large, virtualized computing infrastructure mainly involves load-balancing of the hardware and rapid provisioning of new guest machines that execute in an application cluster when they begin to encounter constraints.
This mode of operation is reactive, rather than proactive, which flies in the face of 40 years of effective data center capacity planning. Note: the mega-datacenters that are devoted to servicing a small number of
huge, monolithic application suites do not face this problem e.g., Google, Facebook, AWS, Microsoft Azure
But the traditional corporate IT datacenters, trying to support a heterogeneous mix of applications, do!
17
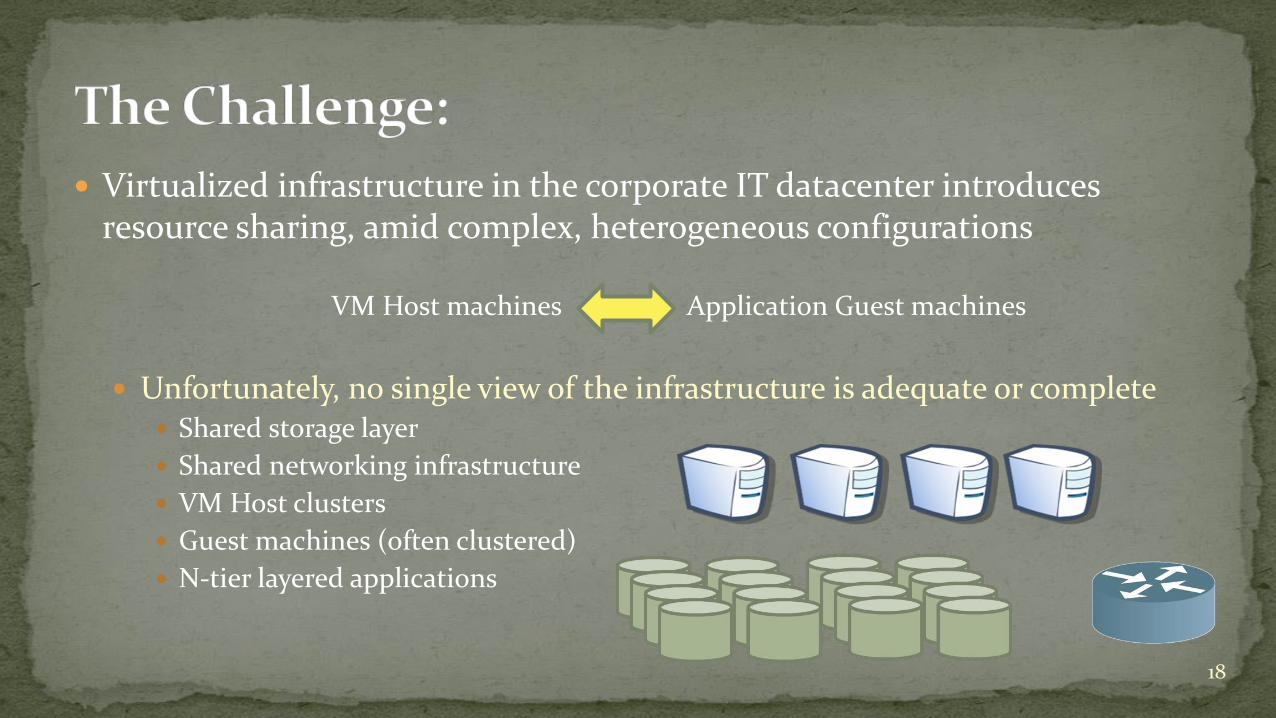
Virtualized infrastructure in the corporate IT datacenter introduces resource sharing, amid complex, heterogeneous configurations
VM Host machines Application Guest machines
Unfortunately, no single view of the infrastructure is adequate or complete Shared storage layer
Shared networking infrastructure
VM Host clusters
Guest machines (often clustered)
N-tier layered applications
18
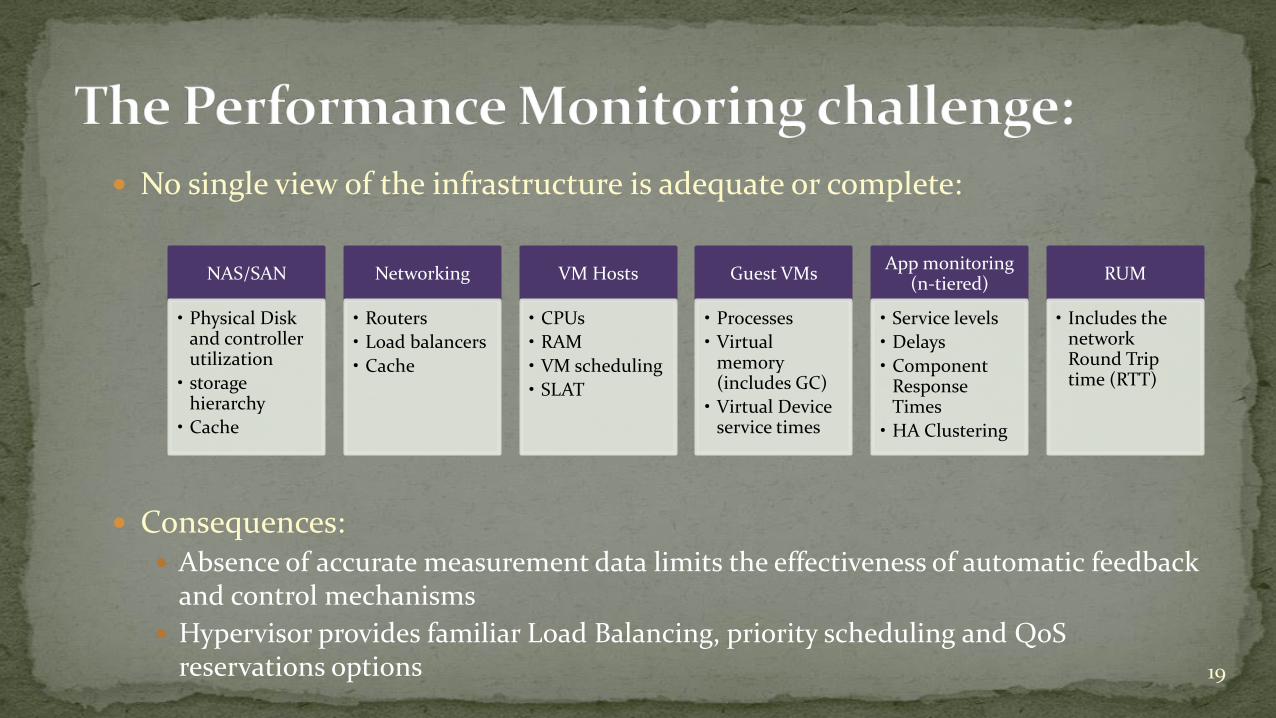
No single view of the infrastructure is adequate or complete:
Consequences: Absence of accurate measurement data limits the effectiveness of automatic feedback
and control mechanisms
Hypervisor provides familiar Load Balancing, priority scheduling and QoSreservations options 19
NAS/SAN
• Physical Disk and controller utilization
• storage hierarchy
• Cache
Networking
• Routers
• Load balancers
• Cache
VM Hosts
• CPUs
• RAM
• VM scheduling
• SLAT
Guest VMs
• Processes
• Virtual memory (includes GC)
• Virtual Device service times
App monitoring (n-tiered)
• Service levels
• Delays
• Component Response Times
• HA Clustering
RUM
• Includes the network Round Trip time (RTT)
Virtualized infrastructure presents significant challenges to traditional data center capacity planning practices
Virtualization has only a minor impact on guest machine performance so long as the resources of a massively over-provisioned VM Host machine are not over-committed
But, when over-commitment occurs, the performance impact can be severe as a consequence of the black box approach
Plus, untangling the root cause of the performance problems is difficult due to the complexity of the environment and the limited vision of the tools
20
Virtualized infrastructure presents significant challenges to traditional data center capacity planning practices
The potential for resource contention is minimized when the VM Host machine’s resources are underutilized, but that sacrifices efficiency
Goal: run hardware systems that are balanced and guest machines that are right-sized Note that dynamic load balancing (e.g., vMotion) is potentially disruptive
21
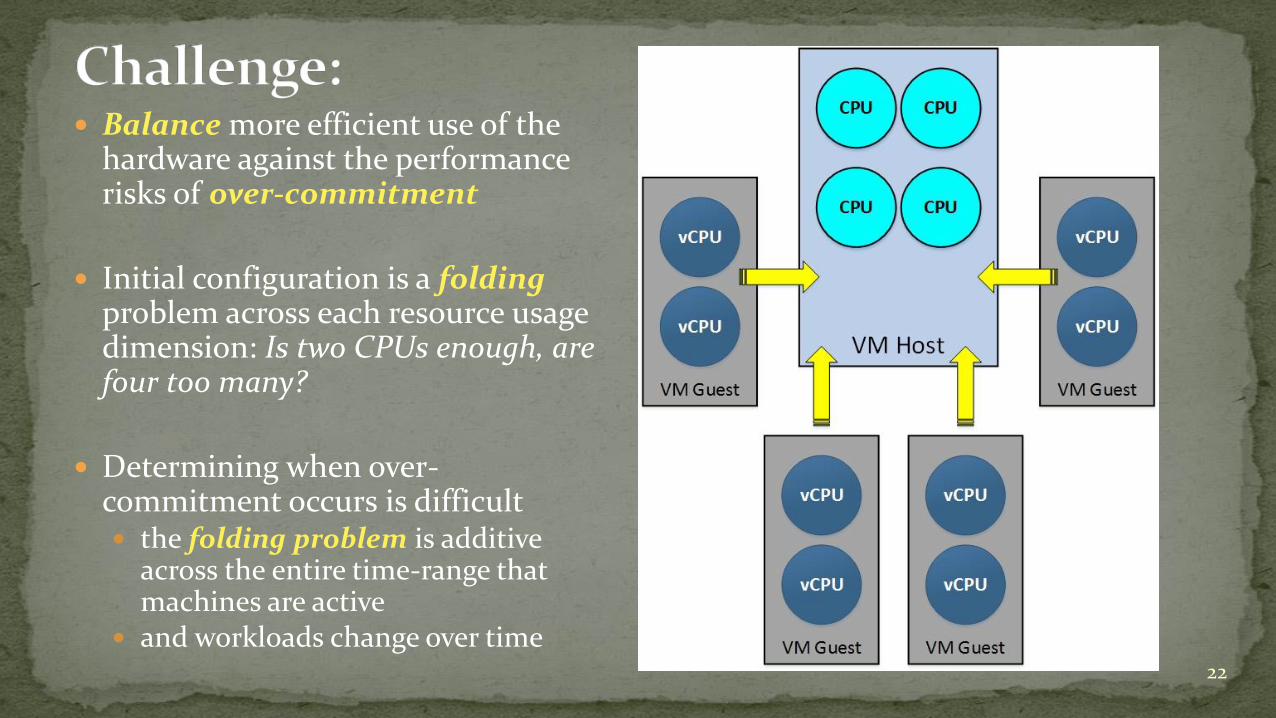
Balance more efficient use of the hardware against the performance risks of over-commitment
Initial configuration is a foldingproblem across each resource usage dimension: Is two CPUs enough, are four too many?
Determining when over-commitment occurs is difficult the folding problem is additive
across the entire time-range that machines are active
and workloads change over time22
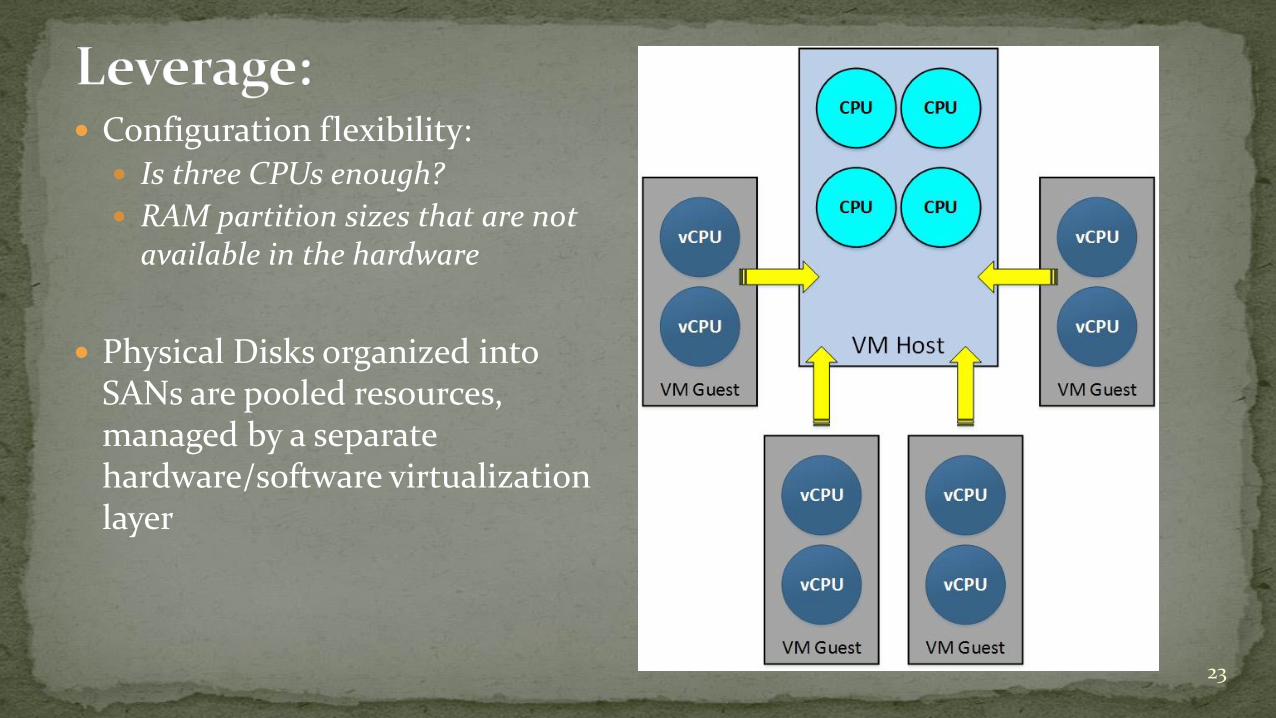
Configuration flexibility: Is three CPUs enough?
RAM partition sizes that are not available in the hardware
Physical Disks organized into SANs are pooled resources, managed by a separate hardware/software virtualization layer
23
24
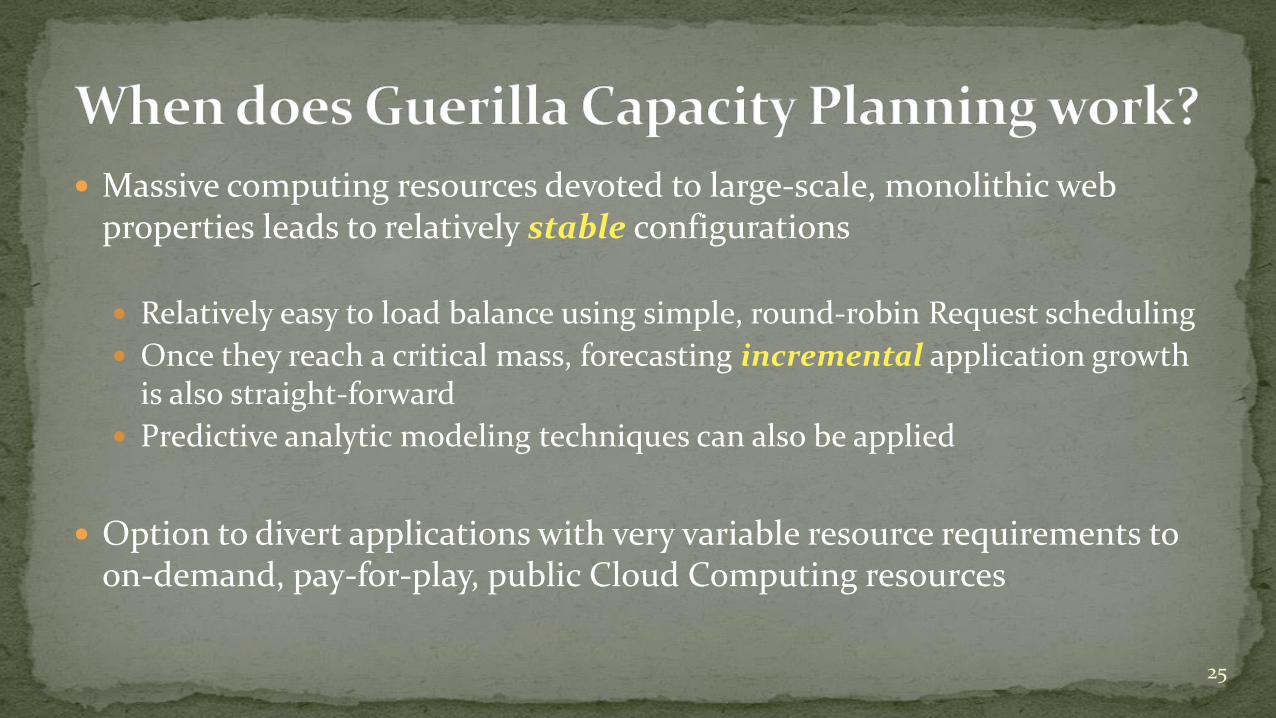
Massive computing resources devoted to large-scale, monolithic web properties leads to relatively stable configurations
Relatively easy to load balance using simple, round-robin Request scheduling
Once they reach a critical mass, forecasting incremental application growth is also straight-forward
Predictive analytic modeling techniques can also be applied
Option to divert applications with very variable resource requirements to on-demand, pay-for-play, public Cloud Computing resources
25

Virtualized infrastructure presents significant challenges to traditional data center capacity planning practices Many current industry Best Practices are based on experience with very large
scale, monolithic web sites & services
However, in most corporate data centers, the IT department must manage a diverse portfolio of application workloads
Result: the VMs residing on a given VM Host represent a complex, heterogeneous, and combustible mixture With many different server applications running on each VM Host and sharing its
physical resources 26
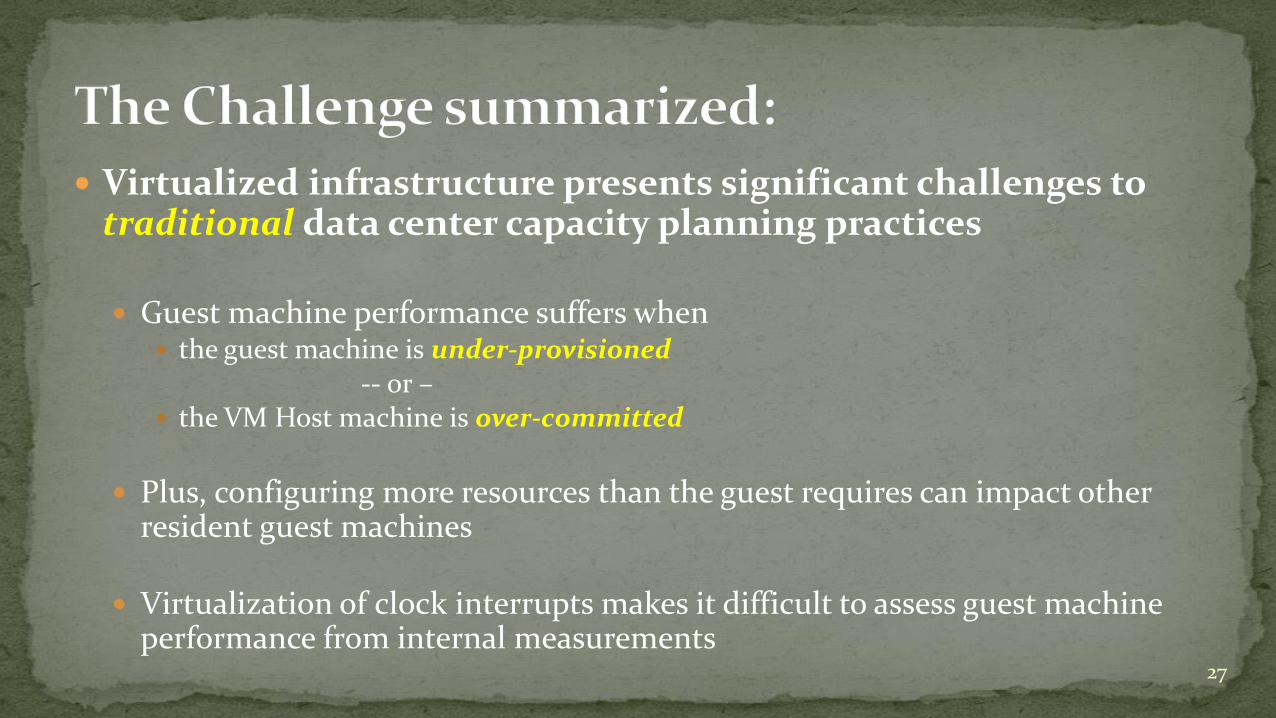
Virtualized infrastructure presents significant challenges to traditional data center capacity planning practices
Guest machine performance suffers when the guest machine is under-provisioned
-- or – the VM Host machine is over-committed
Plus, configuring more resources than the guest requires can impact other resident guest machines
Virtualization of clock interrupts makes it difficult to assess guest machine performance from internal measurements
27
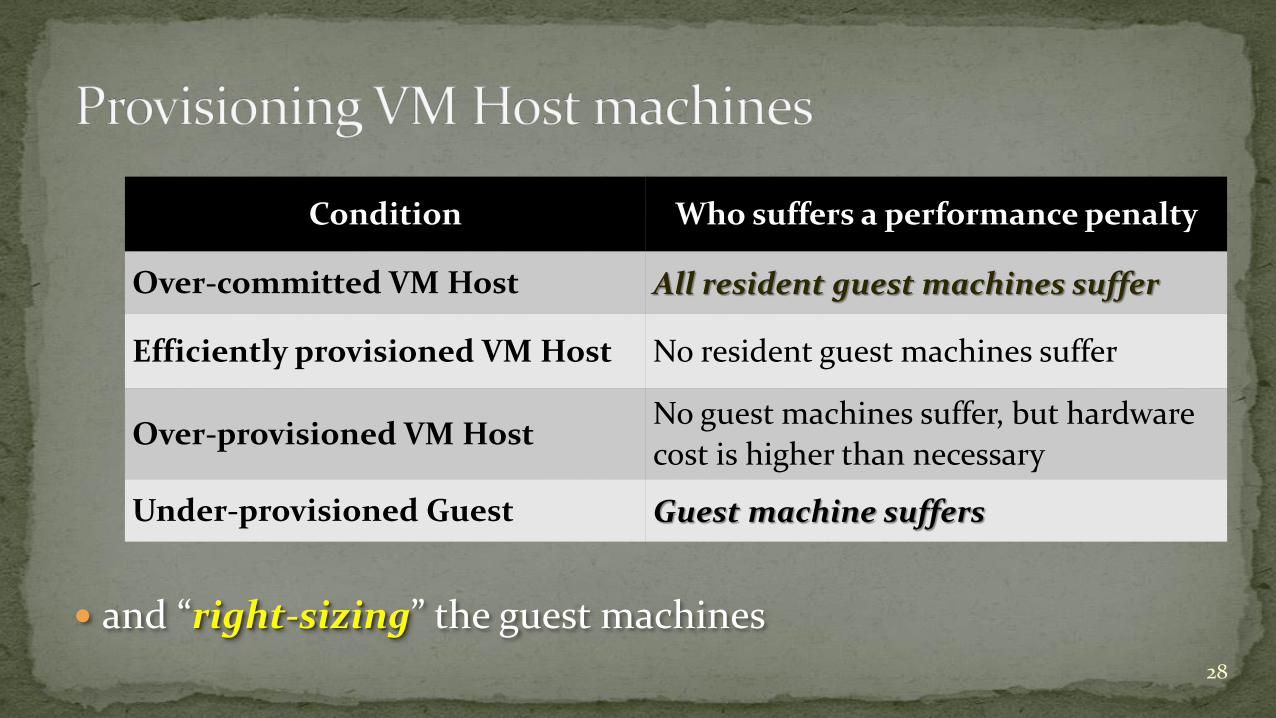
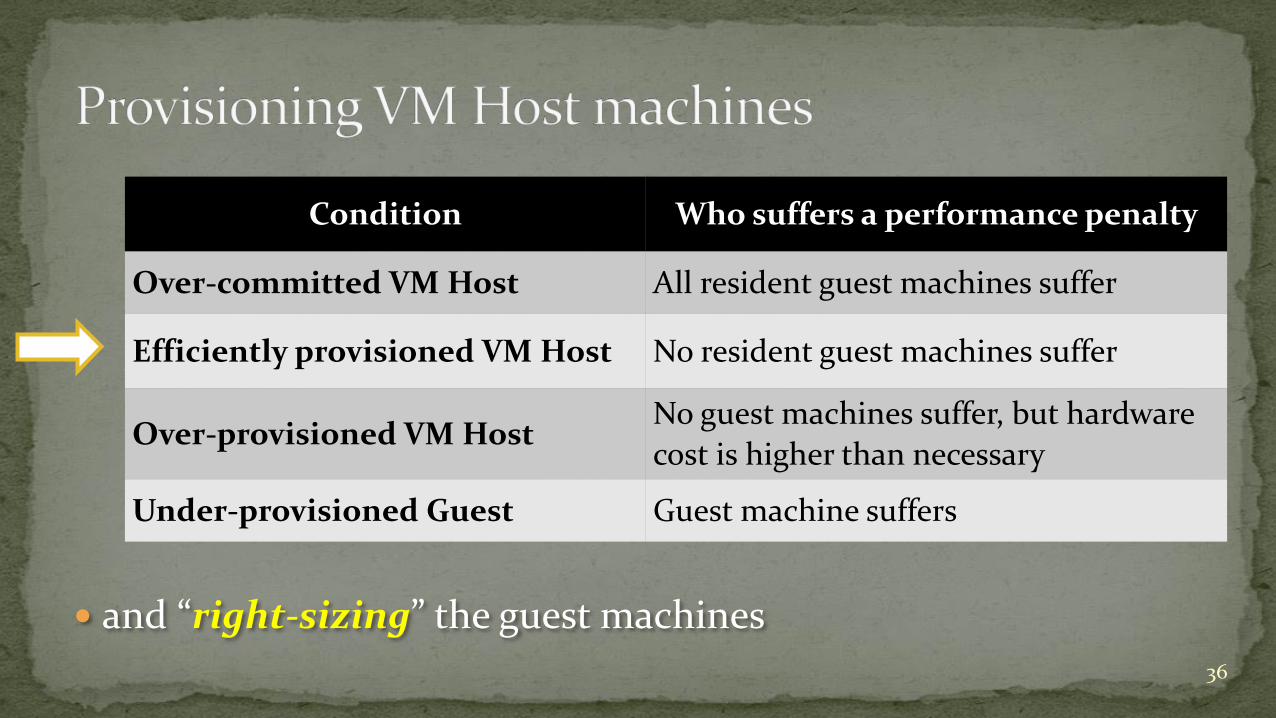
and “right-sizing” the guest machines
28
Condition Who suffers a performance penalty
Over-committed VM Host All resident guest machines suffer
Efficiently provisioned VM Host No resident guest machines suffer
Over-provisioned VM HostNo guest machines suffer, but hardware
cost is higher than necessary
Under-provisioned Guest Guest machine suffers
29
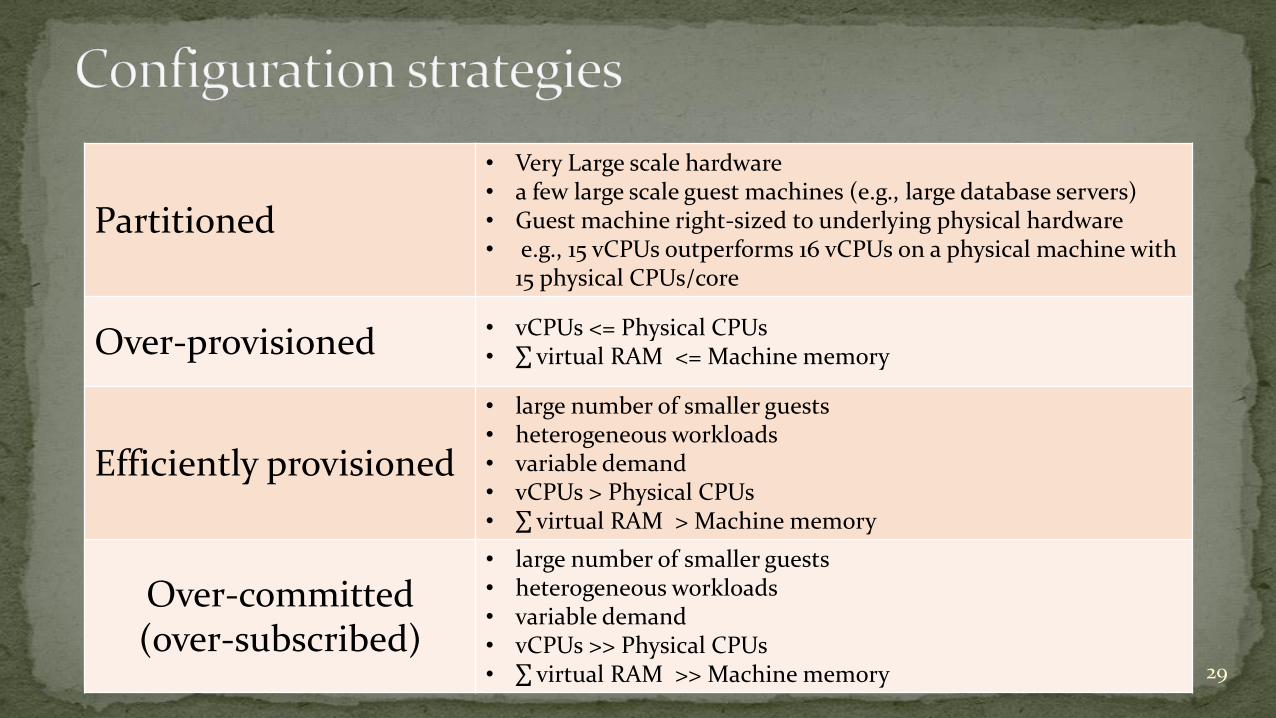
Partitioned
• Very Large scale hardware• a few large scale guest machines (e.g., large database servers)• Guest machine right-sized to underlying physical hardware• e.g., 15 vCPUs outperforms 16 vCPUs on a physical machine with
15 physical CPUs/core
Over-provisioned• vCPUs <= Physical CPUs• virtual RAM <= Machine memory
Efficiently provisioned
• large number of smaller guests• heterogeneous workloads• variable demand • vCPUs > Physical CPUs• virtual RAM > Machine memory
Over-committed(over-subscribed)
• large number of smaller guests• heterogeneous workloads• variable demand • vCPUs >> Physical CPUs• virtual RAM >> Machine memory
30
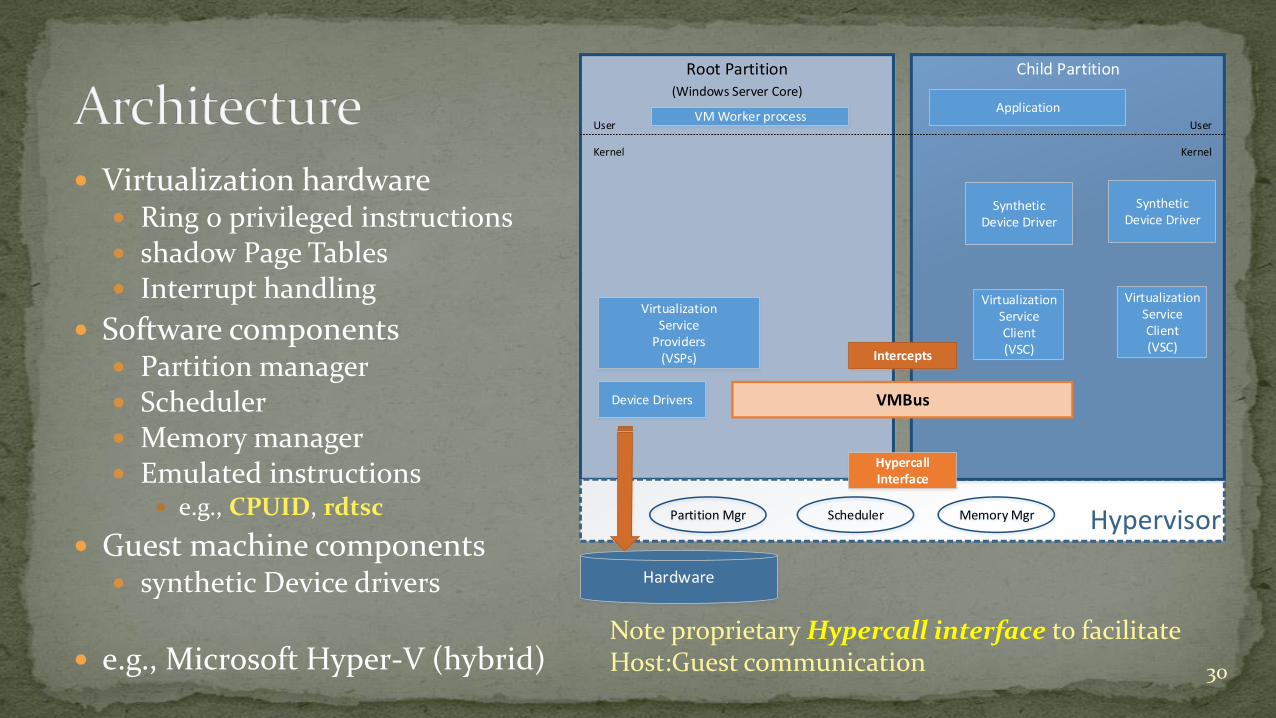
Virtualization hardware Ring 0 privileged instructions shadow Page Tables Interrupt handling
Software components Partition manager Scheduler Memory manager Emulated instructions
e.g., CPUID, rdtsc
Guest machine components synthetic Device drivers
e.g., Microsoft Hyper-V (hybrid)
Root Partition(Windows Server Core)
Hypervisor
Child Partition
VMBus
Hardware
HypercallInterface
Intercepts
Kernel
User
Kernel
User
Scheduler Memory Mgr
VirtualizationService
Providers(VSPs)
VirtualizationServiceClient(VSC)
Device Drivers
SyntheticDevice Driver
ApplicationVM Worker process
Partition Mgr
VirtualizationServiceClient(VSC)
SyntheticDevice Driver
Note proprietary Hypercall interface to facilitate Host:Guest communication
31
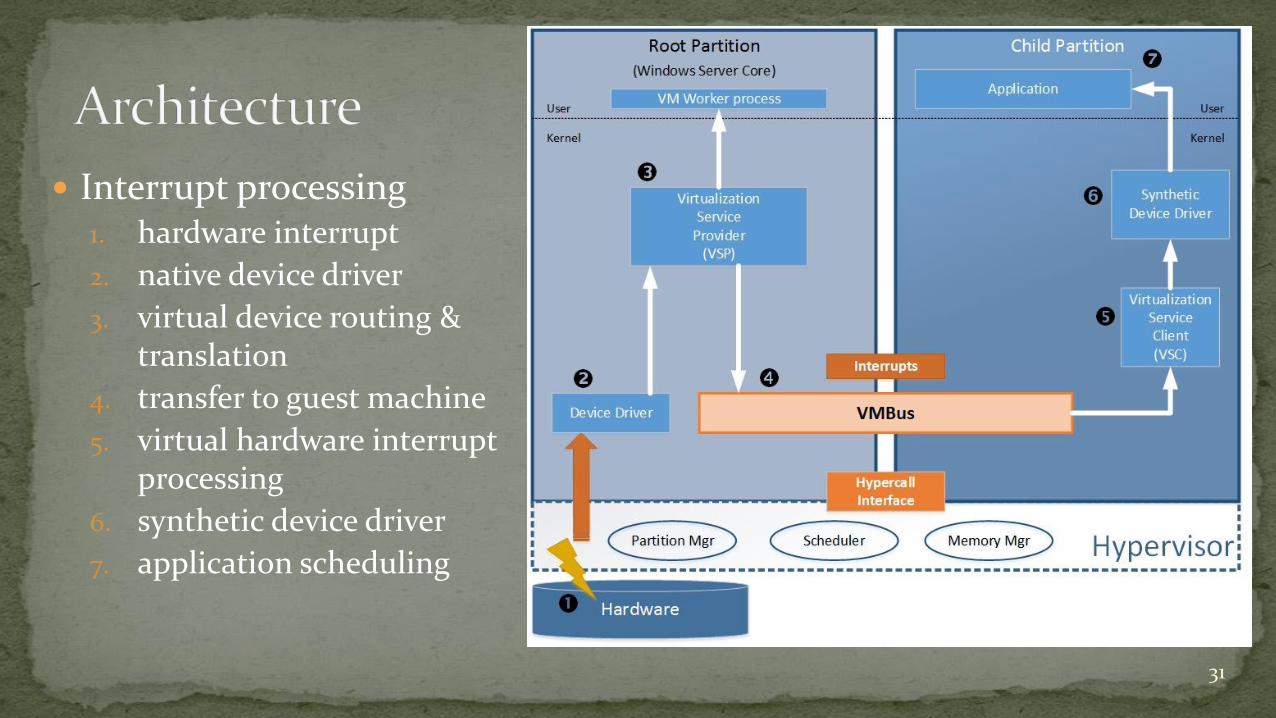
Interrupt processing1. hardware interrupt
2. native device driver
3. virtual device routing & translation
4. transfer to guest machine
5. virtual hardware interrupt processing
6. synthetic device driver
7. application scheduling
32
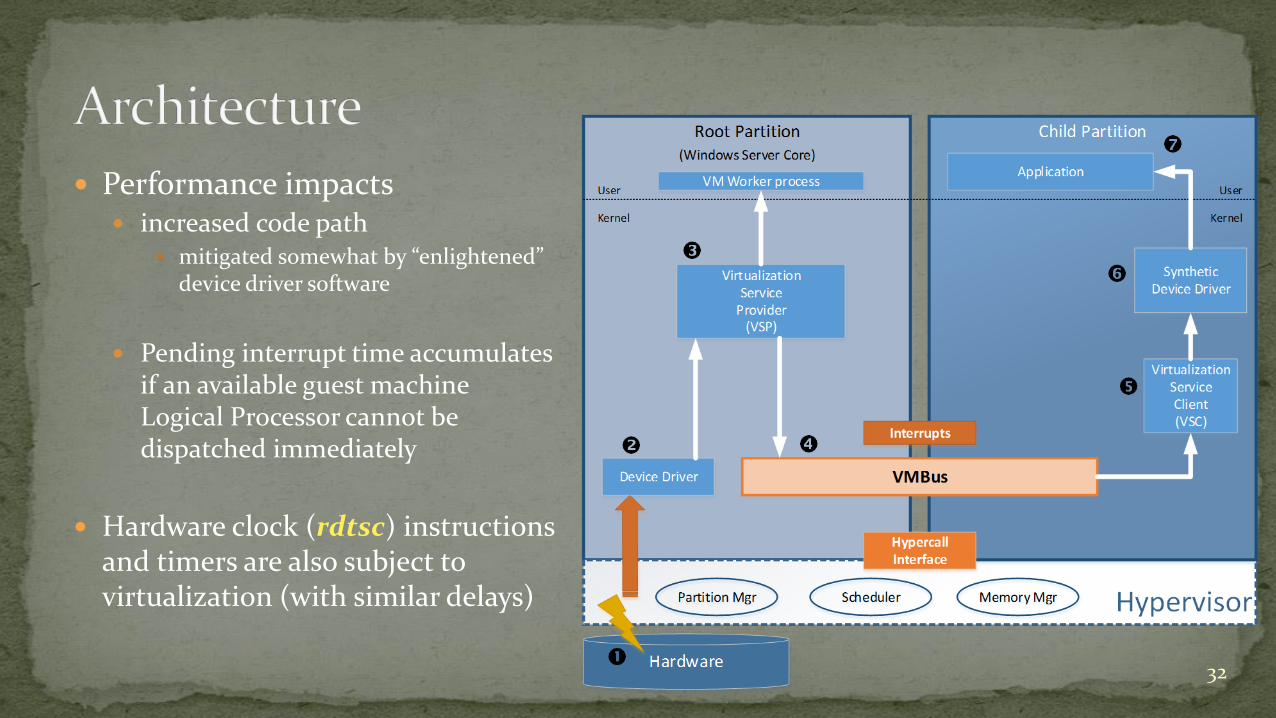
Performance impacts increased code path
mitigated somewhat by “enlightened” device driver software
Pending interrupt time accumulates if an available guest machine Logical Processor cannot be dispatched immediately
Hardware clock (rdtsc) instructions and timers are also subject to virtualization (with similar delays)
Minor performance impact so long as the VM Host is not over-committed
5-15% stretch factor due to: Instruction emulation Guest VM Scheduler overheads Virtual interrupt processing
However, expect a major performance impact when the VM Host machine is over-committed e.g., Guest Machine Memory ballooning
33
Instruction emulation Whenever the guest machine (usually the guest OS) executes restricted
instructions that must be trapped by the VM Host layer and then emulated CPUID
OS accessing MSRs
accessing IO ports
invalid operations (page faults, attempts to divide by zero)
rdtsc
34
35
and “right-sizing” the guest machines
36
Condition Who suffers a performance penalty
Over-committed VM Host All resident guest machines suffer
Efficiently provisioned VM Host No resident guest machines suffer
Over-provisioned VM HostNo guest machines suffer, but hardware
cost is higher than necessary
Under-provisioned Guest Guest machine suffers

CPU stress benchmark results multi-threaded CPU-bound synthetic workload
Configurations: Native machine Hyper-V Root Partition isolated Guest machine (over-provisioned Host)
Under-provisioned Guest machine right-sized Guest machines Over-committed Host machine
37
38
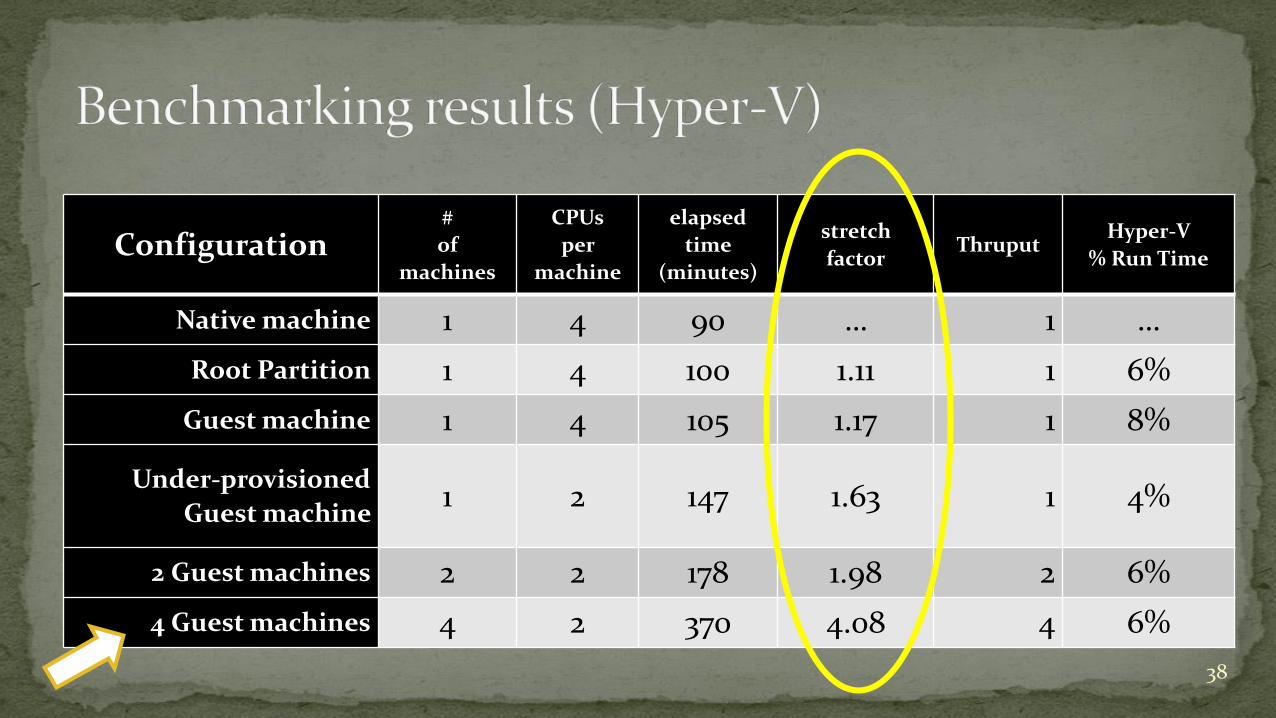
Configuration#
of
machines
CPUs
per
machine
elapsed
time
(minutes)
stretch
factorThruput
Hyper-V
% Run Time
Native machine 1 4 90 … 1 …
Root Partition 1 4 100 1.11 1 6%
Guest machine 1 4 105 1.17 1 8%
Under-provisioned
Guest machine 1 2 147 1.63 1 4%
2 Guest machines 2 2 178 1.98 2 6%
4 Guest machines 4 2 370 4.08 4 6%
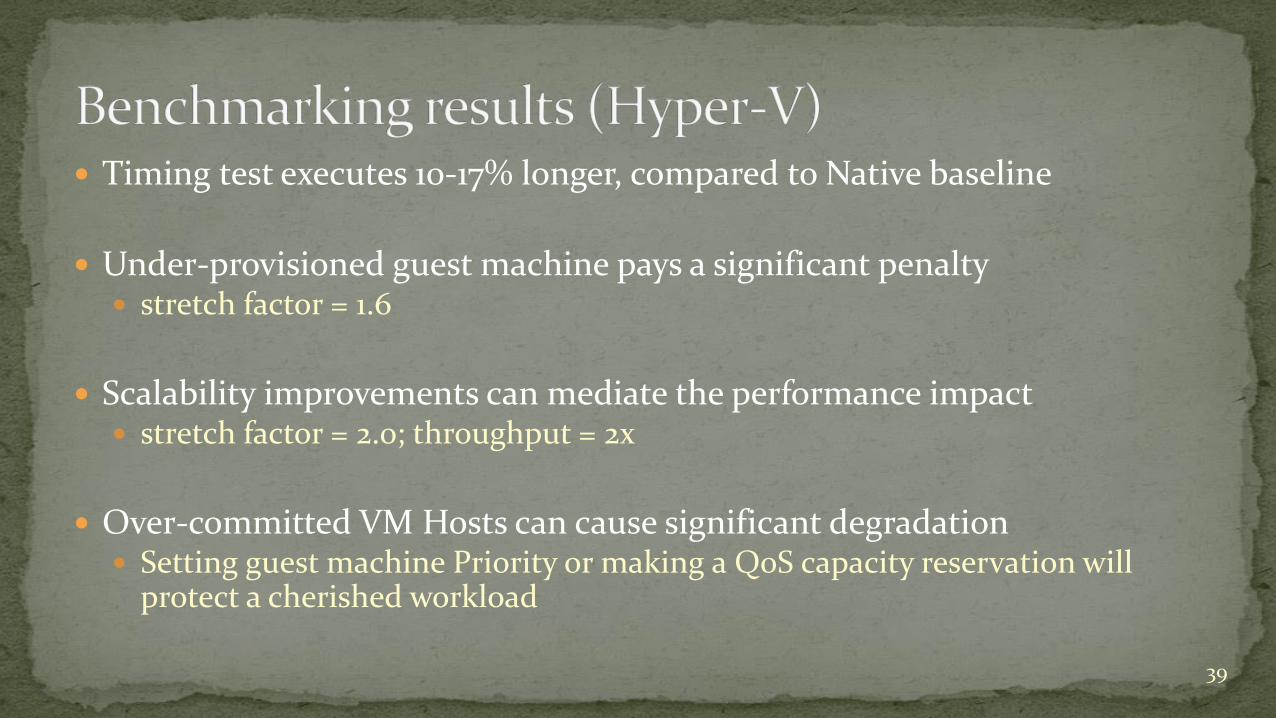
Timing test executes 10-17% longer, compared to Native baseline
Under-provisioned guest machine pays a significant penalty stretch factor = 1.6
Scalability improvements can mediate the performance impact stretch factor = 2.0; throughput = 2x
Over-committed VM Hosts can cause significant degradation Setting guest machine Priority or making a QoS capacity reservation will
protect a cherished workload
39

Over-committed VM Hosts can cause significant degradation Setting guest machine Priority or making a QoS capacity reservation will
protect a cherished workload
40
Configuration#
guest
machines
CPUs
per
machine
Best case
elapsed
time
stretch
factor
Native machine … 4 90 …
4 Guest machines (no priority) 4 2 370 4.08
4 Guest machines with Relative Weights 4 2 230 2.56
4 Guest machines with Reservations 4 2 270 3.00
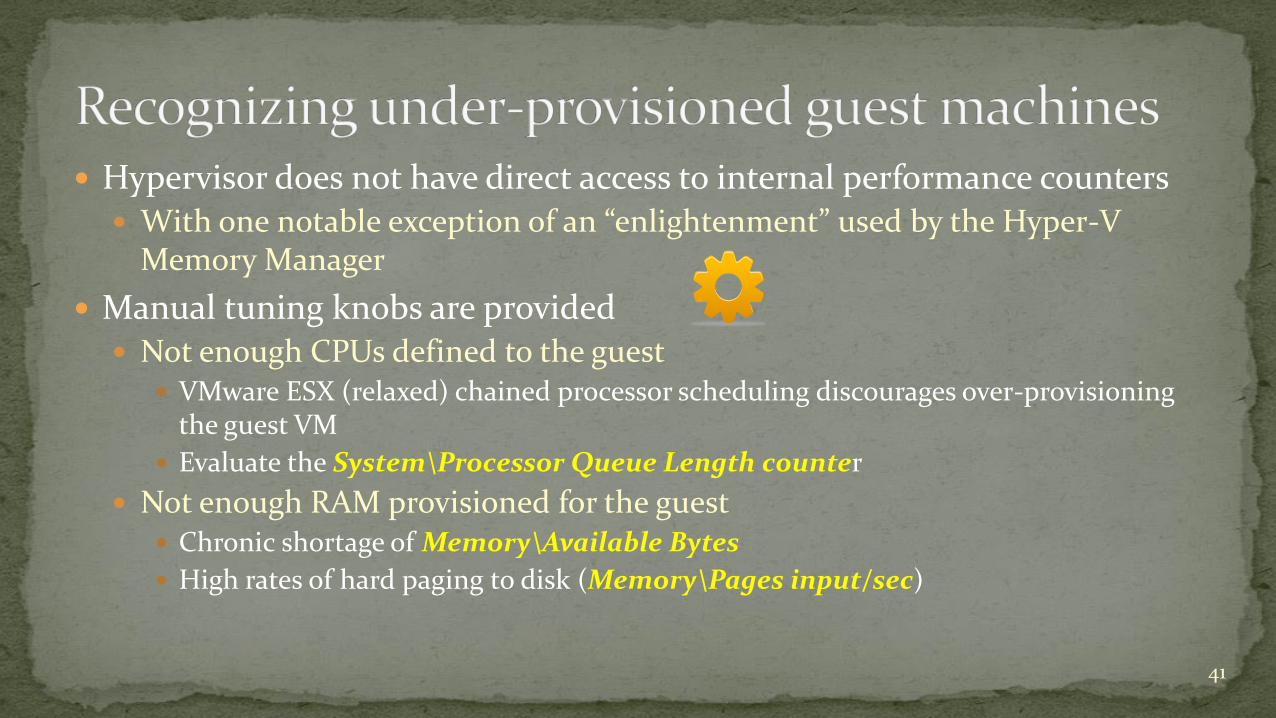
Hypervisor does not have direct access to internal performance counters With one notable exception of an “enlightenment” used by the Hyper-V
Memory Manager
Manual tuning knobs are provided Not enough CPUs defined to the guest
VMware ESX (relaxed) chained processor scheduling discourages over-provisioning the guest VM
Evaluate the System\Processor Queue Length counter
Not enough RAM provisioned for the guest Chronic shortage of Memory\Available Bytes
High rates of hard paging to disk (Memory\Pages input/sec)
41
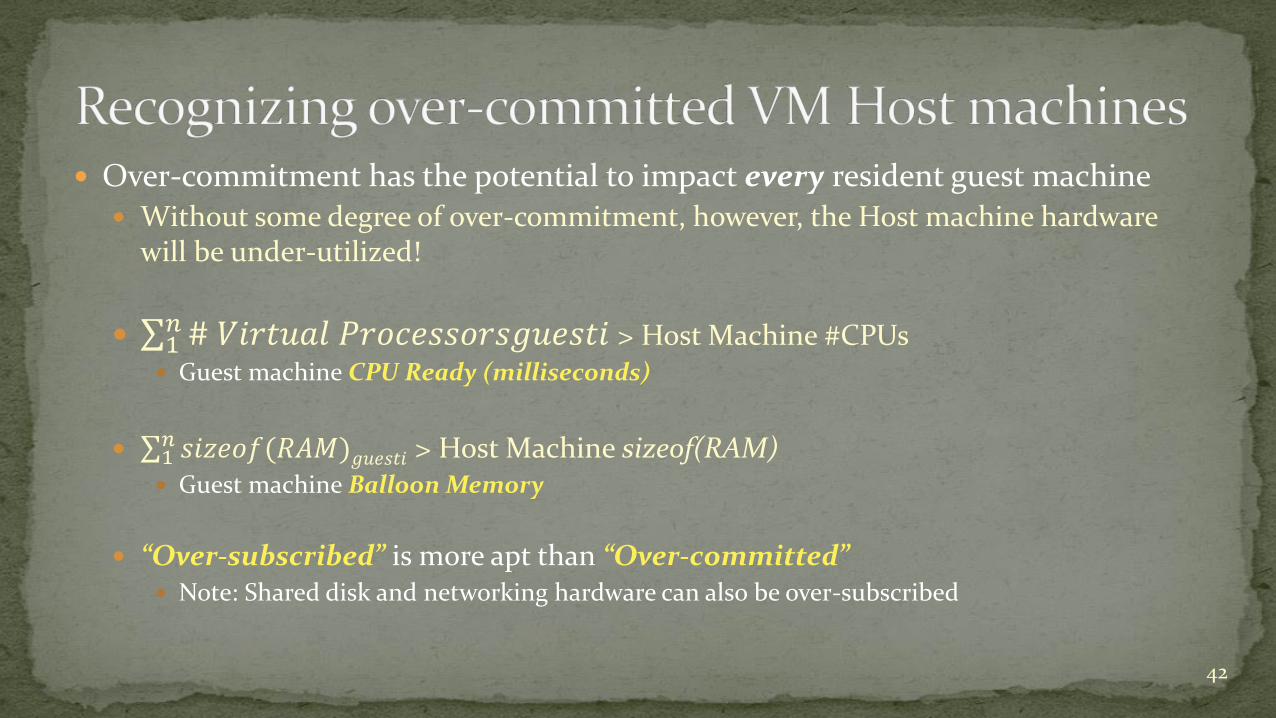
Over-commitment has the potential to impact every resident guest machine Without some degree of over-commitment, however, the Host machine hardware
will be under-utilized!
1𝑛# 𝑉𝑖𝑟𝑡𝑢𝑎𝑙 𝑃𝑟𝑜𝑐𝑒𝑠𝑠𝑜𝑟𝑠𝑔𝑢𝑒𝑠𝑡𝑖 > Host Machine #CPUs Guest machine CPU Ready (milliseconds)
1𝑛 𝑠𝑖𝑧𝑒𝑜𝑓(𝑅𝐴𝑀)𝑔𝑢𝑒𝑠𝑡𝑖 > Host Machine sizeof(RAM) Guest machine Balloon Memory
“Over-subscribed” is more apt than “Over-committed” Note: Shared disk and networking hardware can also be over-subscribed
42
Over-commitment has the potential to impact every resident guest machine
Automatic load balancing using active migration of guest VMs e.g., vMotion But, without an understanding of the guest machine application state, vMotion is
potentially disruptive, and Hypervisor does not have direct access to internal performance counters to assist in
its decision-making
So, manual tuning knobs are provided Scheduling Priority settings QoS Reservations and Limits
43
Hypervisor does not have direct access to guest machine internal performance indicators With one notable exception of a proprietary “enlightenment” used by the
Hyper-V Memory Manager
Manual tuning knobs are provided Scheduling priority settings
QoS reservations and limits
Crude controls that are difficult to implement (trial & error)
Given the size and complexity of the configurations SysAdmins must manage, these tuning options are poor alternatives to goal-oriented control systems that have access to guest machine feedback
44
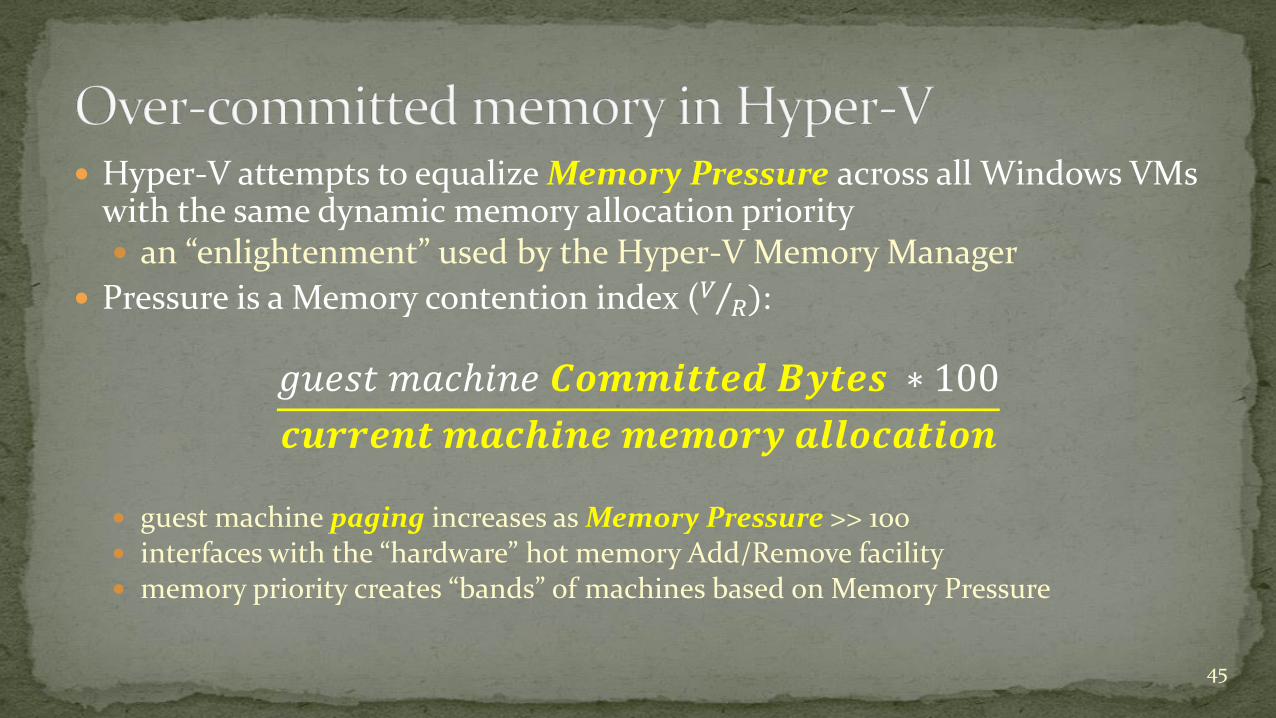
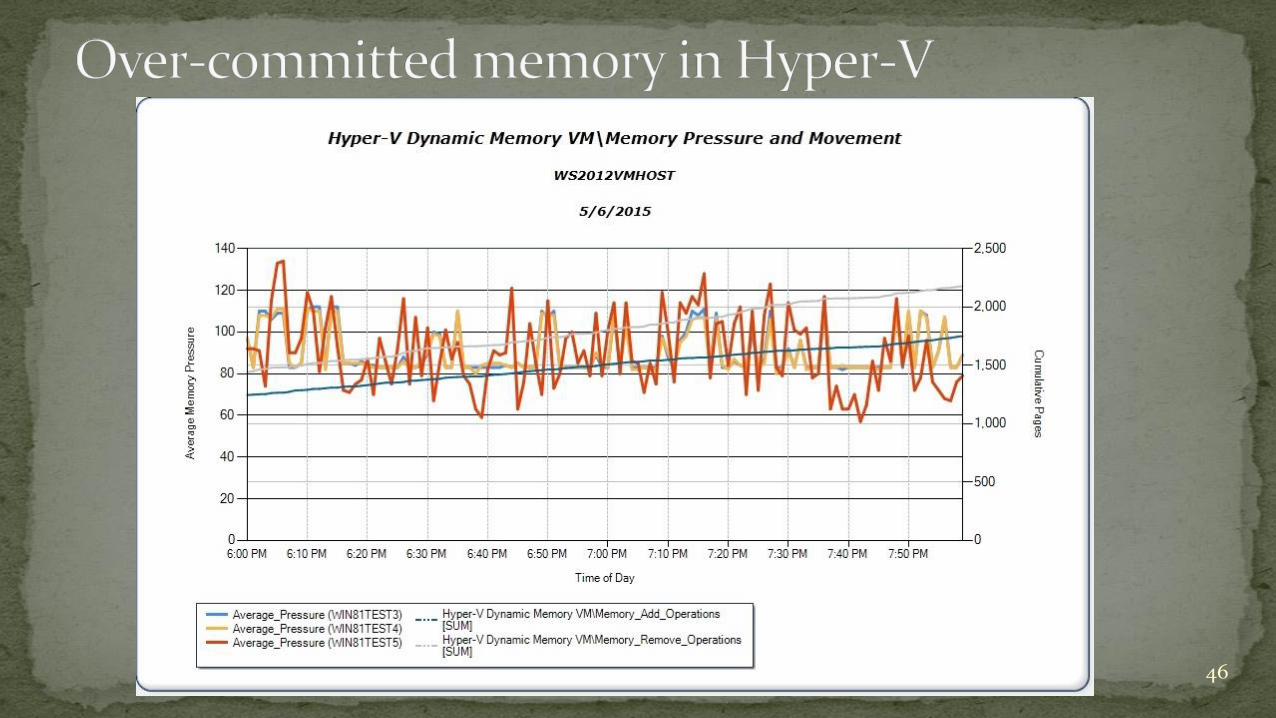
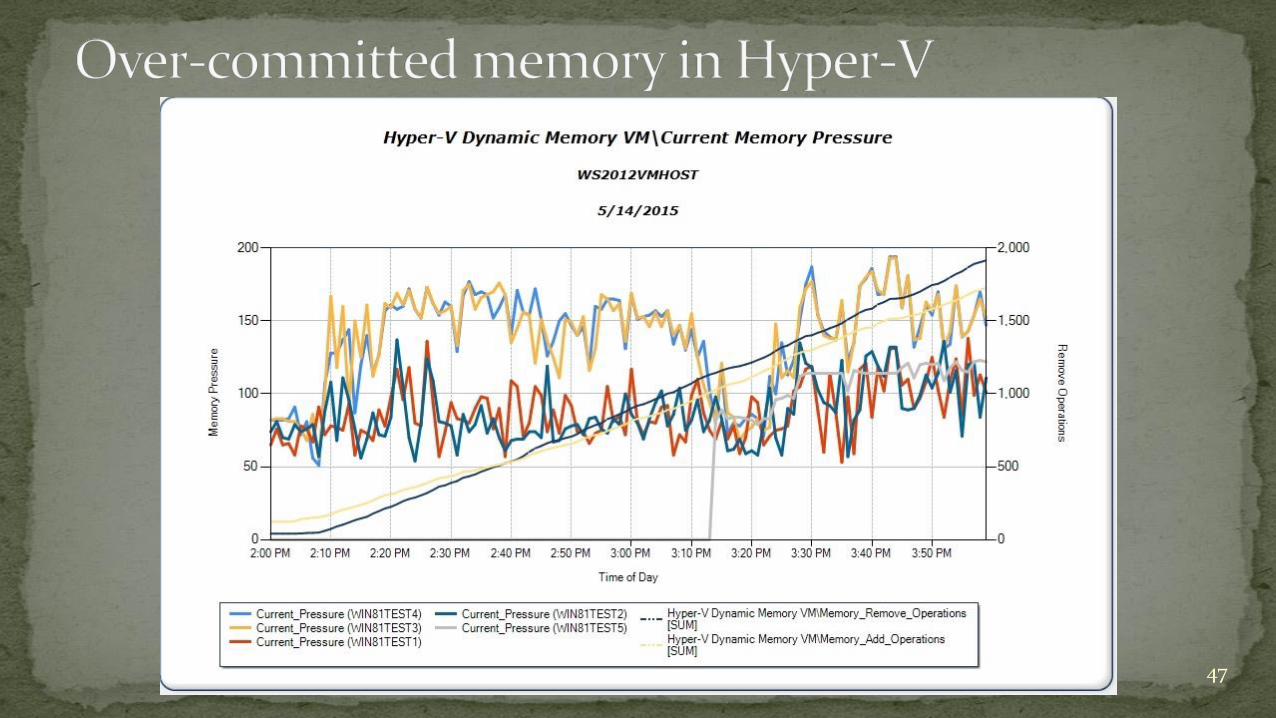
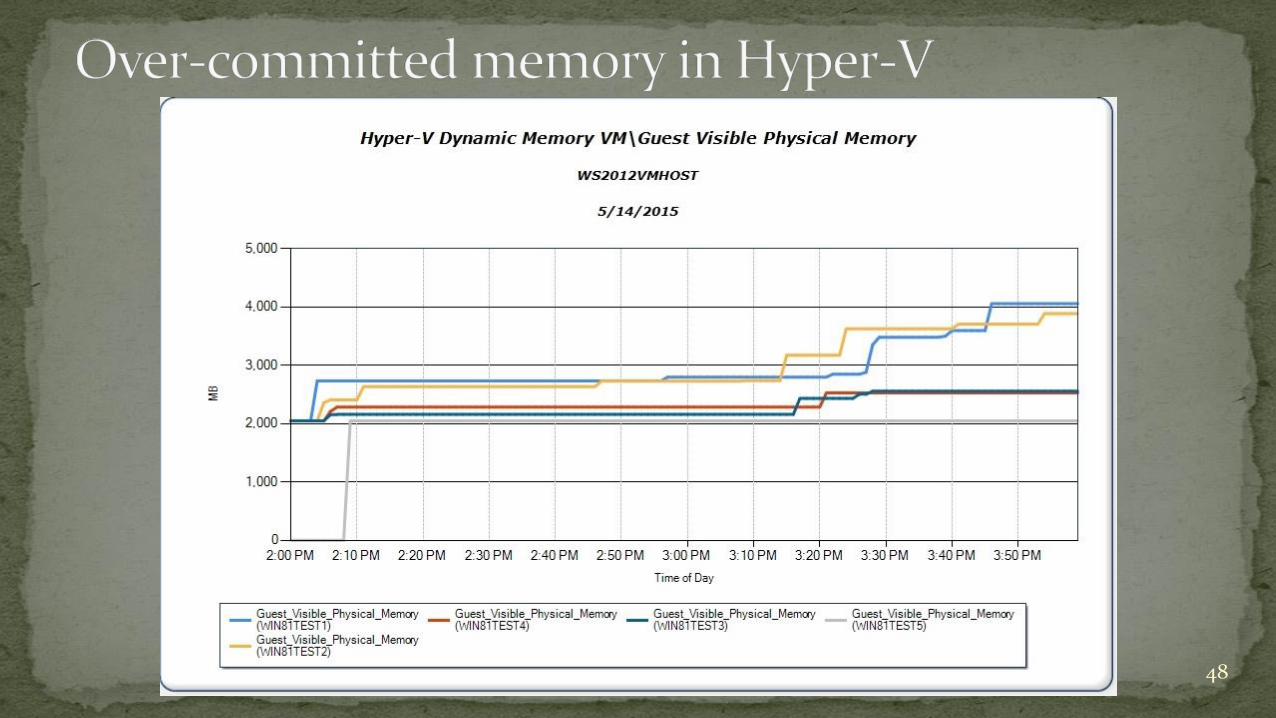
Hyper-V attempts to equalize Memory Pressure across all Windows VMs with the same dynamic memory allocation priority an “enlightenment” used by the Hyper-V Memory Manager
Pressure is a Memory contention index ( 𝑉 𝑅):
𝑔𝑢𝑒𝑠𝑡 𝑚𝑎𝑐ℎ𝑖𝑛𝑒 𝑪𝒐𝒎𝒎𝒊𝒕𝒕𝒆𝒅 𝑩𝒚𝒕𝒆𝒔 ∗ 100
𝒄𝒖𝒓𝒓𝒆𝒏𝒕 𝒎𝒂𝒄𝒉𝒊𝒏𝒆 𝒎𝒆𝒎𝒐𝒓𝒚 𝒂𝒍𝒍𝒐𝒄𝒂𝒕𝒊𝒐𝒏
guest machine paging increases as Memory Pressure >> 100 interfaces with the “hardware” hot memory Add/Remove facility memory priority creates “bands” of machines based on Memory Pressure
45
46
47
48
Committed Bytes is not always a reliable indicator of actual memory requirements on a Windows machine SQL Server immediately allocates all available RAM
Uses a manual setting to override the default policy
well-behaved Windows apps that respond to Lo/Hi memory notifications issued by the OS e.g., Lo/Hi memory notification trigger garbage collection by the .NET Framework
Common Language Runtime (CLR)
Would access to additional guest machine metrics improve the Hyper-V dynamic memory management routines? access to Lo/Hi memory notifications balance physical memory to minimize demand paging
49
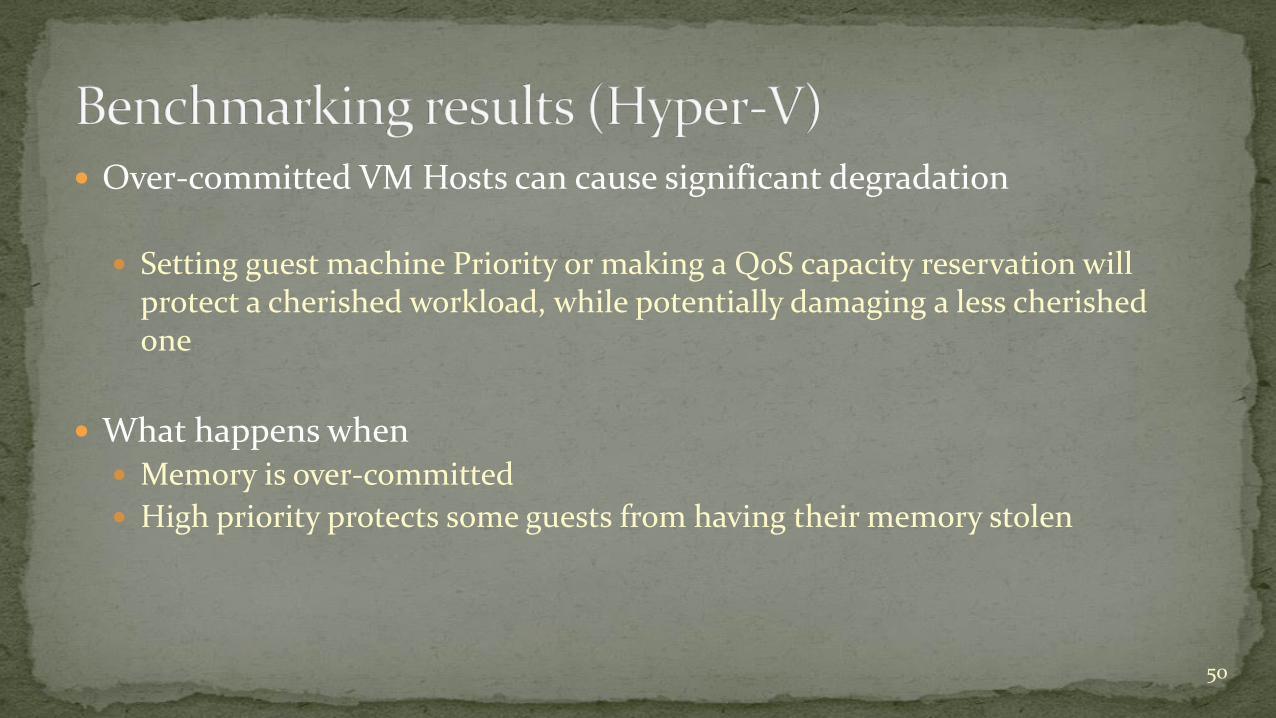
Over-committed VM Hosts can cause significant degradation
Setting guest machine Priority or making a QoS capacity reservation will protect a cherished workload, while potentially damaging a less cherished one
What happens when Memory is over-committed
High priority protects some guests from having their memory stolen
50

51
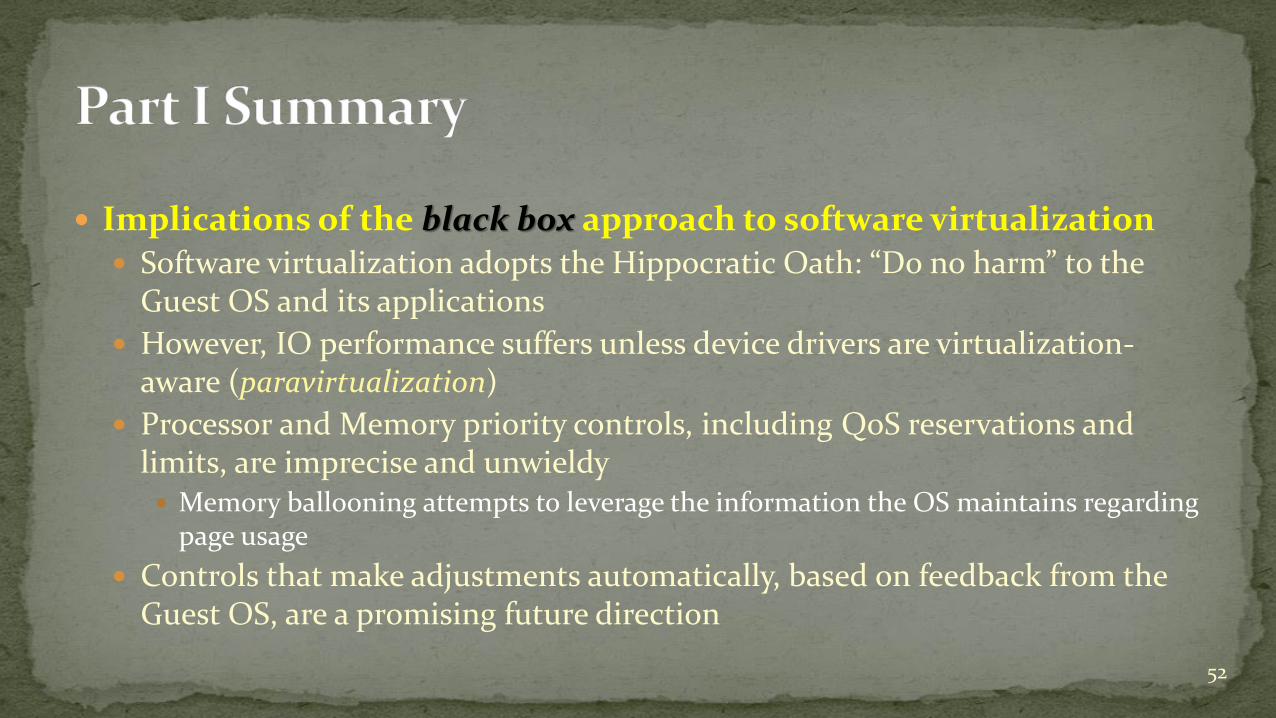
Implications of the black box approach to software virtualization Software virtualization adopts the Hippocratic Oath: “Do no harm” to the
Guest OS and its applications
However, IO performance suffers unless device drivers are virtualization-aware (paravirtualization)
Processor and Memory priority controls, including QoS reservations and limits, are imprecise and unwieldy Memory ballooning attempts to leverage the information the OS maintains regarding
page usage
Controls that make adjustments automatically, based on feedback from the Guest OS, are a promising future direction
52

53
Performance investigation where it is necessary to look inside the “black box”
Guest machine measurement anomalies due to virtualized timer and clock interrupts
How Windows counters are affected
54
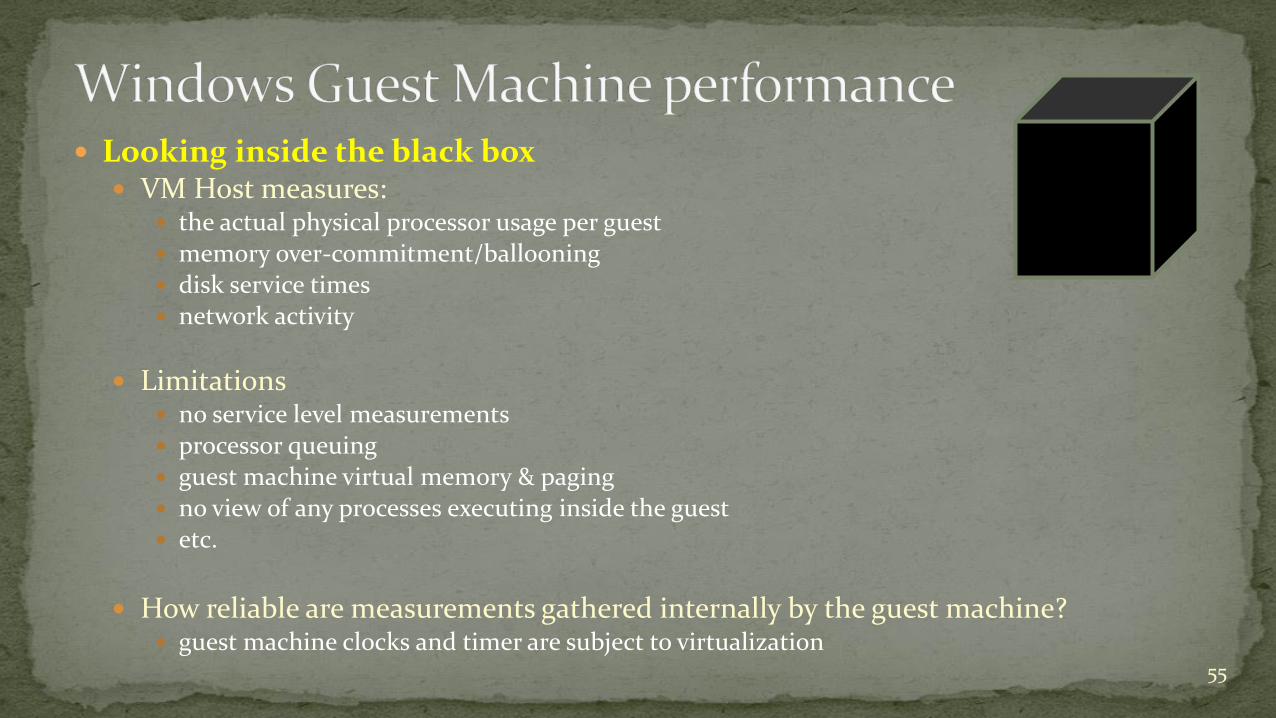
Looking inside the black box VM Host measures:
the actual physical processor usage per guest memory over-commitment/ballooning disk service times network activity
Limitations no service level measurements processor queuing guest machine virtual memory & paging no view of any processes executing inside the guest etc.
How reliable are measurements gathered internally by the guest machine? guest machine clocks and timer are subject to virtualization
55
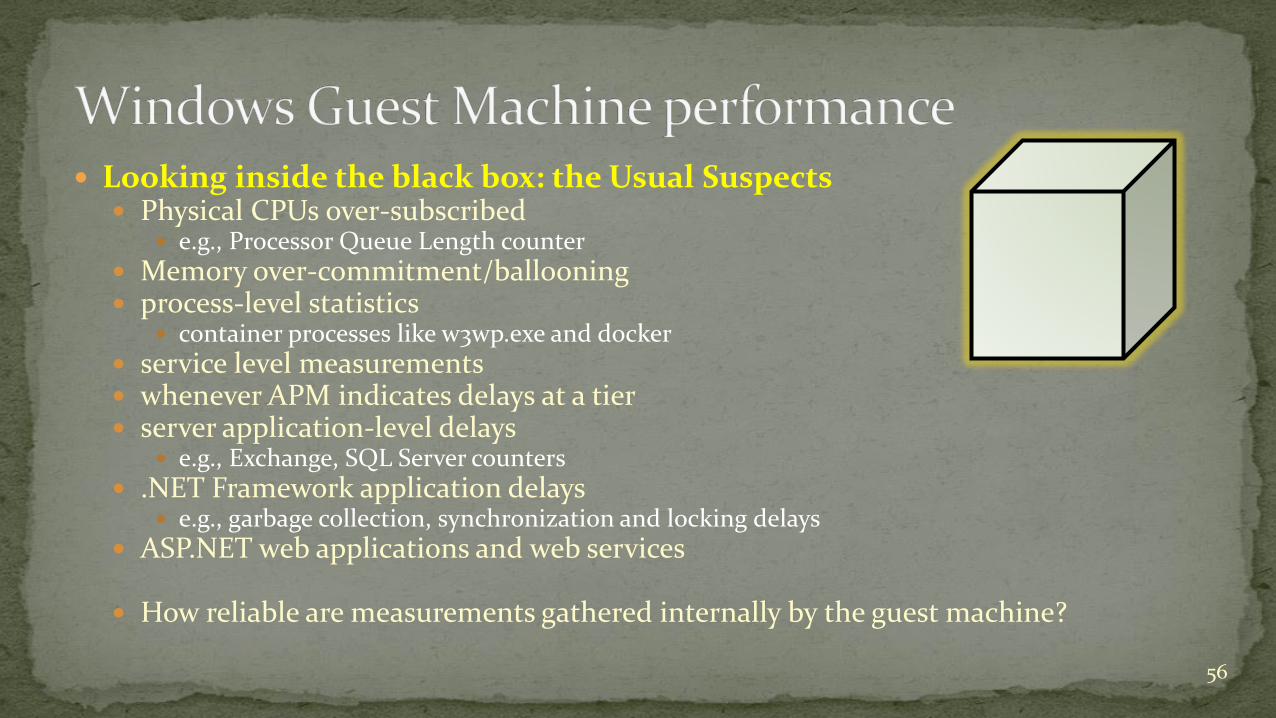
Looking inside the black box: the Usual Suspects Physical CPUs over-subscribed
e.g., Processor Queue Length counter Memory over-commitment/ballooning process-level statistics
container processes like w3wp.exe and docker service level measurements whenever APM indicates delays at a tier server application-level delays
e.g., Exchange, SQL Server counters .NET Framework application delays
e.g., garbage collection, synchronization and locking delays ASP.NET web applications and web services
How reliable are measurements gathered internally by the guest machine?
56
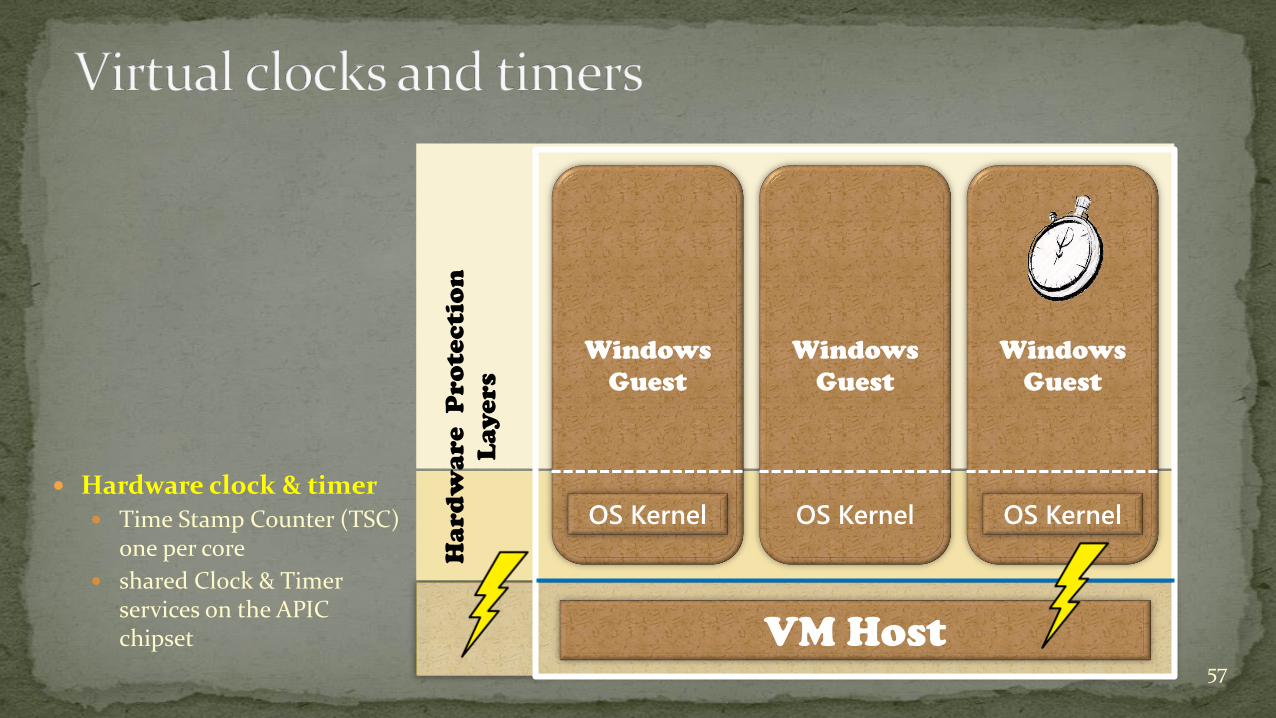
Hardware clock & timer
Time Stamp Counter (TSC) one per core
shared Clock & Timer services on the APIC chipset
57
VM Host
Windows
Guest
OS Kernel
Windows
Guest
OS Kernel
Windows
Guest
OS Kernel
Ha
rd
wa
re
P
ro
te
ctio
n
La
ye
rs

System clock (normalized to 100 nanosecond units) maintained by the OS based on the periodic clock interrupt programmed to generate 64 clock interrupts/sec a clock tick 15.6 ms. (aka, the quantum)
rdtsc instruction returns the value of the hardware Time Stamp Counter (TSC) Not synchronized across processor sockets
QueryPerformanceCounter() Originally, an OS wrapper around rdtsc (introduced inWin2K)
Both timer interrupts and rdtsc instructions are subject to virtualization58
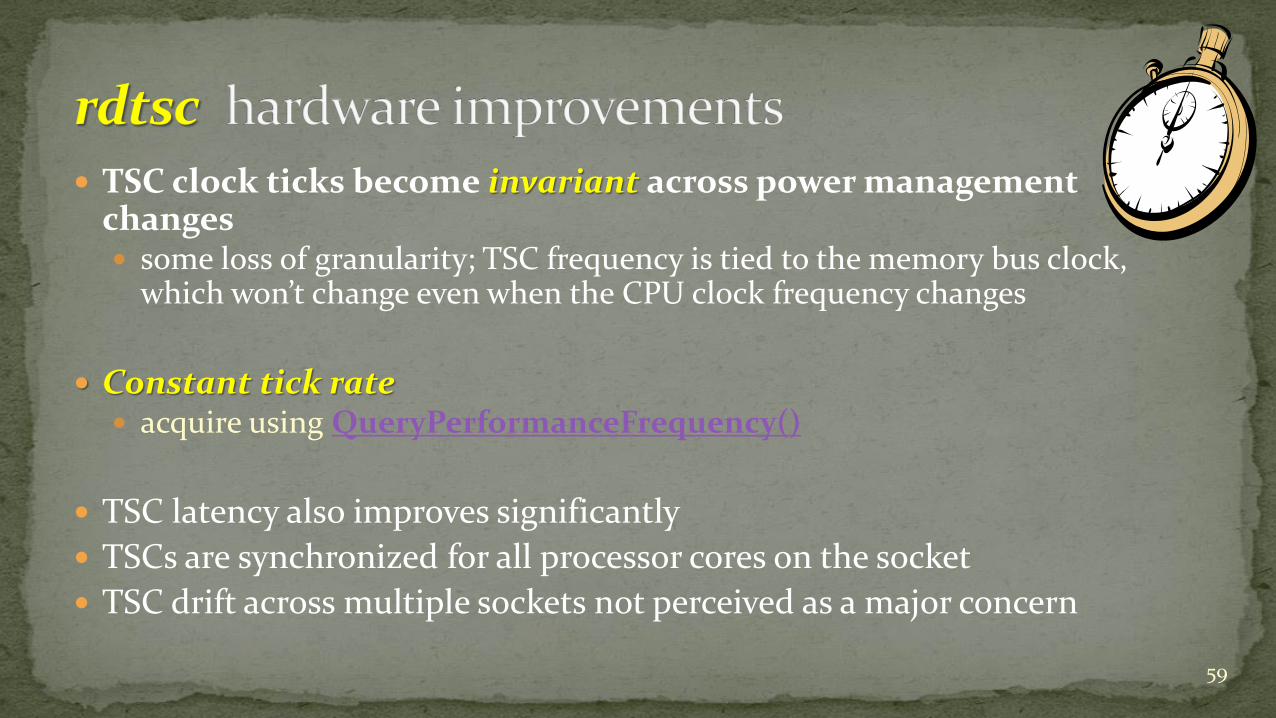
TSC clock ticks become invariant across power management changes some loss of granularity; TSC frequency is tied to the memory bus clock,
which won’t change even when the CPU clock frequency changes
Constant tick rate acquire using QueryPerformanceFrequency()
TSC latency also improves significantly
TSCs are synchronized for all processor cores on the socket
TSC drift across multiple sockets not perceived as a major concern
59
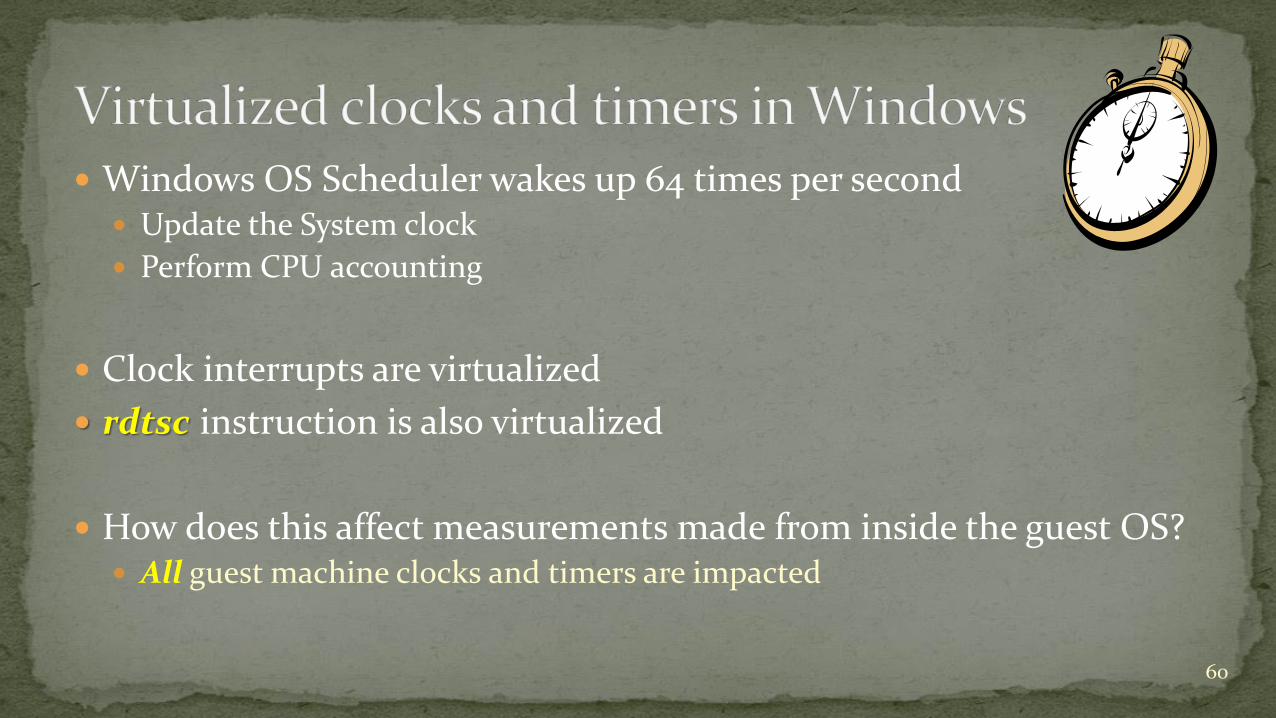
Windows OS Scheduler wakes up 64 times per second Update the System clock
Perform CPU accounting
Clock interrupts are virtualized
rdtsc instruction is also virtualized
How does this affect measurements made from inside the guest OS? All guest machine clocks and timers are impacted
60
VMware responds to guest machine time requests using apparent time Ensures the guest sees logically consistent, monotonically increasing clocks,
whose values approach the “real” time Provides consistent clock values across multiple logical CPUs synchronize to VM Host clock using VMTools
All guest machine timers are impacted e.g., OS Scheduler periodic timer interrupts are not received at regular 15.6
ms quantum intervals some intervals may be delayed when the Guest is accumulating Ready time some timer interrupts are dropped entirely, if the dispatching of the Guest
machine is delayed long enough
61
% Processor Time measurements
Processor (and process and thread) CPU usage accounting is based on a Timer interrupt that samples the state of the processor fires 64 times/second (the Windows quantum) determines whether the CPU is busy with some process/thread or Idle
Under virtualization, these counters are distorted Time between samples is no longer guaranteed to be uniform Potentially, fewer CPU time usage samples are gathered each performance
monitoring interval due to timer interrupt delays
This clock “jitter” can also impact sampling accuracy of the % Processor Timecalculations, if there aren’t enough samples.
62
To correct for this distortion, replace internal processor level measurements with Aggregate Guest CPU Usage metric from VMware
At the process level, sampling data should still accurately reflect the relative proportion of the CPU time used by the individual processes
Re-calculate Process and Thread level % Processor Time measurements by computing a correction factor:
w = Aggregate Guest CPU Usage %𝑷𝒓𝒐𝒄𝒆𝒔𝒔𝒐𝒓 𝒕𝒊𝒎𝒆
and multiply each Process\% Processor time instance by the correction factor, w
63
Re-calculate process and thread level % Processor Time measurements:
w = Aggregate Guest CPU Usage %𝑷𝒓𝒐𝒄𝒆𝒔𝒔𝒐𝒓 𝒕𝒊𝒎𝒆
Example: internal % Processor Time measurements in 2 vCPU guest = 80%
actual Aggregate Guest CPU usage reported = 120%
calculate w = 120 / 80 = 1.5
Multiply each Process\% Processor Time instance by the correction factor
64
You can replace Windows processor level measurements with Aggregate Guest CPU Usage metric from VMware reliably only if the two measurement sources are in sync
synchronization is also affected by guest machine dispatching delays
Series of experiments running a load generator on the Windows guest
comparing actual guest CPU usage from ESXTop utility
to the VMTools performance counter, VM Processor\% Processor Time
taking care to synchronize the ESX data source to the Windows guest
65

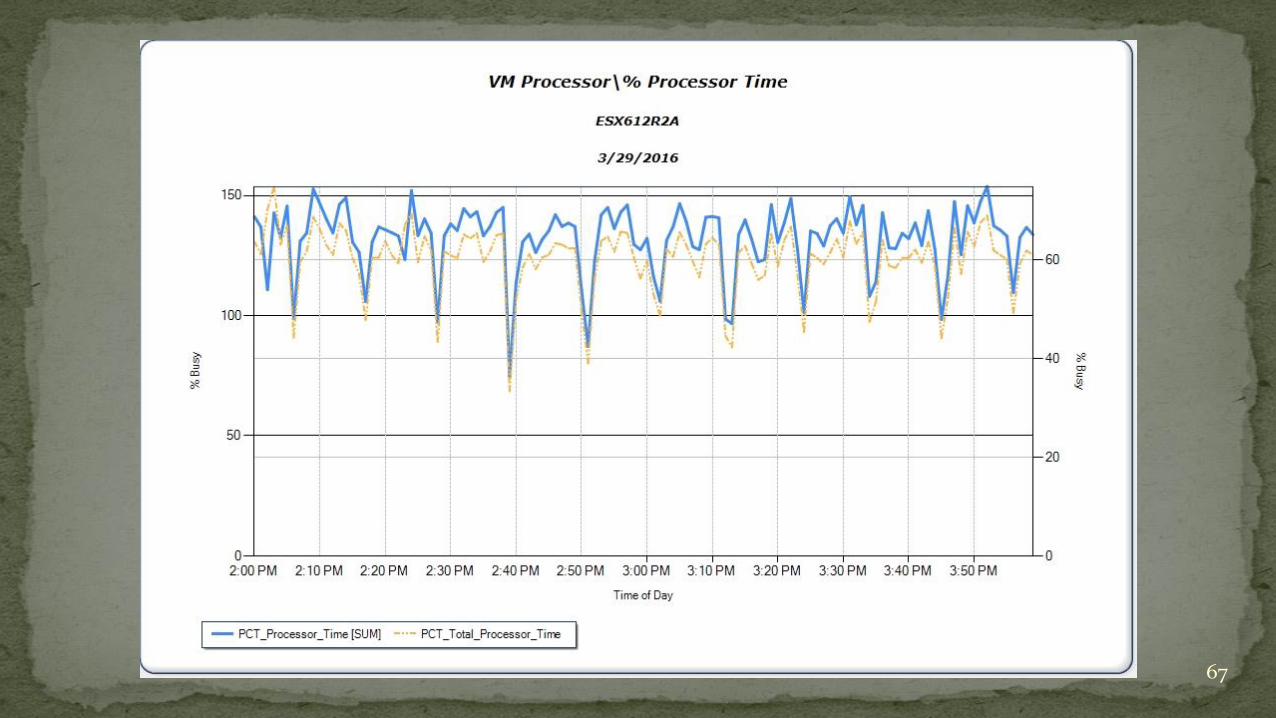
Replace Windows processor level measurements with VMTools VM Processor\% processor Time counter
Acquire VM Host statistics using the Guest Programming API VMGuestLib_GetCpuUsedMs
VMGuestLib_GetMemBalloonedMB
exposes Windows performance counters
66
VM Host
Windows Guest
OS Kernel
GuestAPI
WMI
Perfmon
VM
Gu
estLib
_G
etCp
uU
sedM
s
67
68
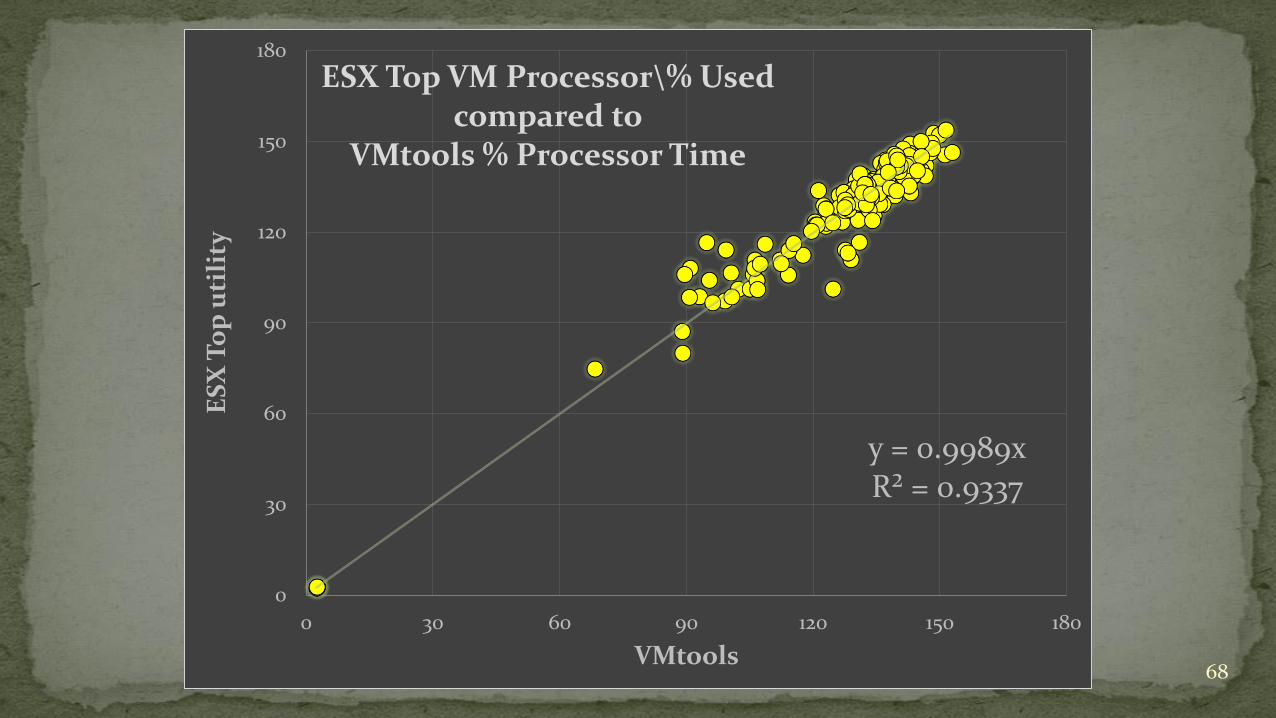
y = 0.9989xR² = 0.9337
0
30
60
90
120
150
180
0 30 60 90 120 150 180
ES
X T
op
uti
lity
VMtools
ESX Top VM Processor\% Used compared to
VMtools % Processor Time

How are other Windows performance counters affected?
Depends on the counter type! Difference counters that report events/second
counters that utilize rdtsc to measure disk latency in Windows, TSC granularity is usually reduced to “standard” 100 nanosecond timer
units
Instantaneous counters; observations that are sampled once per measurement interval
69
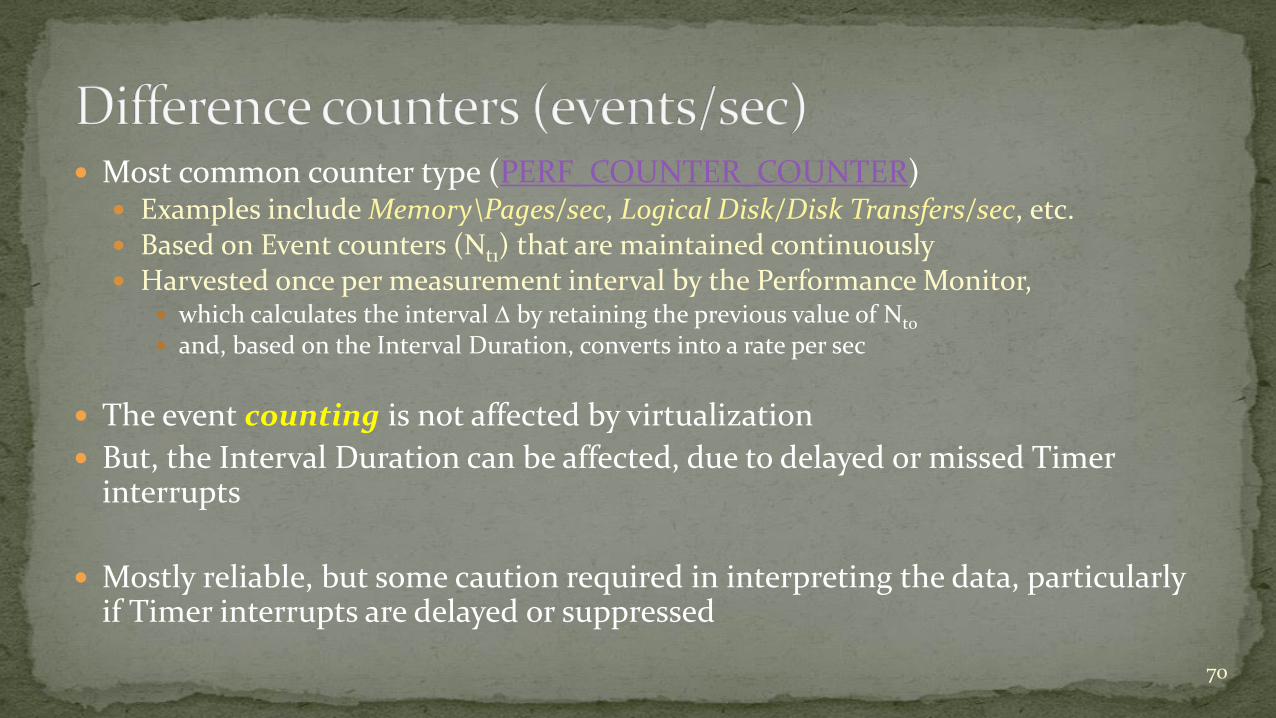
Most common counter type (PERF_COUNTER_COUNTER) Examples include Memory\Pages/sec, Logical Disk/Disk Transfers/sec, etc. Based on Event counters (Nt1) that are maintained continuously Harvested once per measurement interval by the Performance Monitor,
which calculates the interval by retaining the previous value of Nt0
and, based on the Interval Duration, converts into a rate per sec
The event counting is not affected by virtualization
But, the Interval Duration can be affected, due to delayed or missed Timer interrupts
Mostly reliable, but some caution required in interpreting the data, particularly if Timer interrupts are delayed or suppressed
70
71
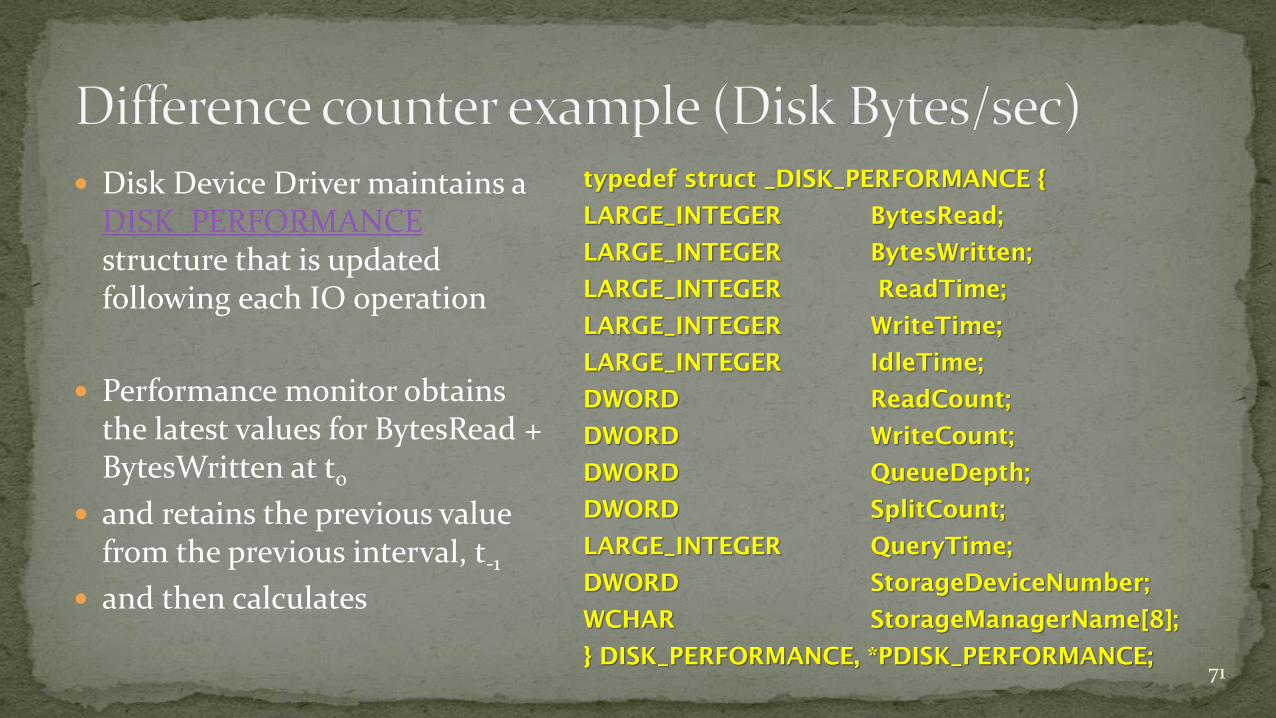
Disk Device Driver maintains a DISK_PERFORMANCEstructure that is updated following each IO operation
Performance monitor obtains the latest values for BytesRead + BytesWritten at t0
and retains the previous value from the previous interval, t-1
and then calculates
typedef struct _DISK_PERFORMANCE {
LARGE_INTEGER BytesRead;
LARGE_INTEGER BytesWritten;
LARGE_INTEGER ReadTime;
LARGE_INTEGER WriteTime;
LARGE_INTEGER IdleTime;
DWORD ReadCount;
DWORD WriteCount;
DWORD QueueDepth;
DWORD SplitCount;
LARGE_INTEGER QueryTime;
DWORD StorageDeviceNumber;
WCHAR StorageManagerName[8];
} DISK_PERFORMANCE, *PDISK_PERFORMANCE;

72
𝑫𝒊𝒔𝒌 𝑩𝒚𝒕𝒆𝒔/ 𝐬𝐞𝐜 =𝑫𝒊𝒔𝒌𝑩𝒚𝒕𝒆𝒔𝒕𝟎 −𝑫𝒊𝒔𝒌𝑩𝒚𝒕𝒆𝒔𝒕 − 𝟏
𝑻𝒊𝒎𝒆𝒔𝒕𝒂𝒎𝒑𝒕𝟎 − 𝑻𝒊𝒎𝒆𝒔𝒕𝒂𝒎𝒑𝒕 − 𝟏
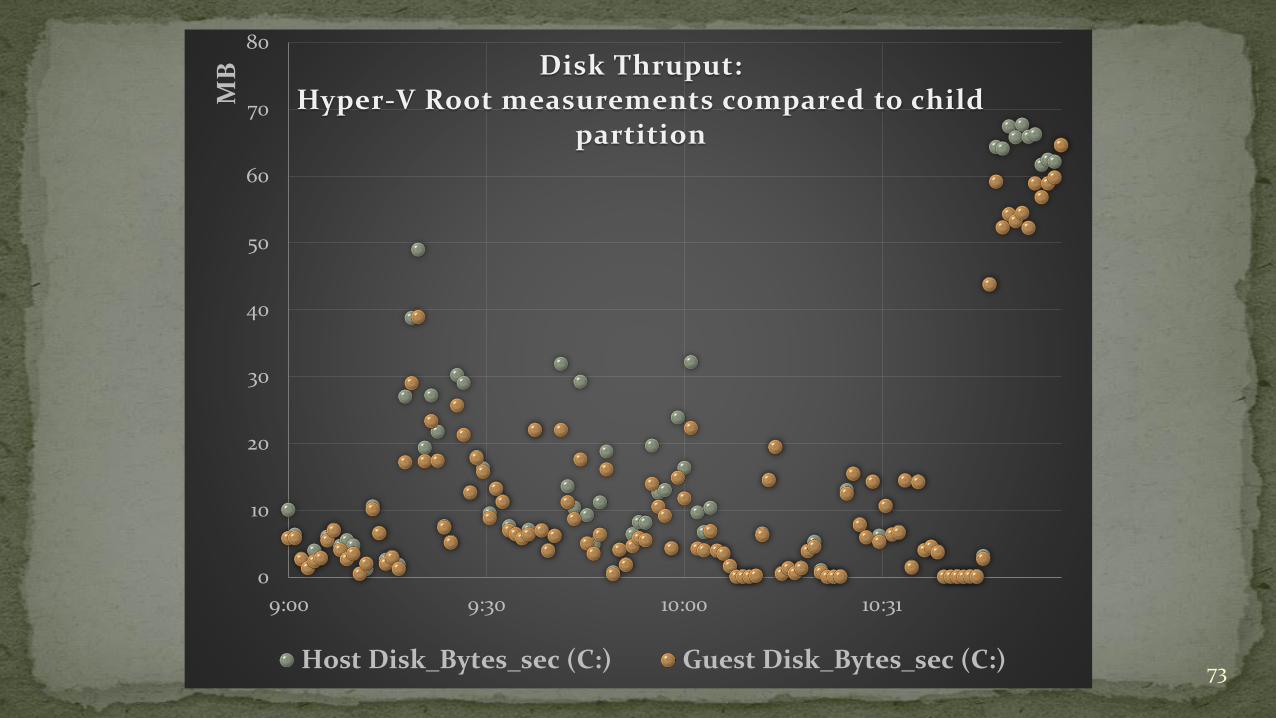
Under virtualization, DiskBytes is a valid count of the number of bytes transferred Timestamps are subject to virtual clock jitter
Compare to Hypervisor measurements (e.g., Hyper-V)
73
0
10
20
30
40
50
60
70
80
9:00 9:30 10:00 10:31
MB Disk Thruput:
Hyper-V Root measurements compared to child partition
Host Disk_Bytes_sec (C:) Guest Disk_Bytes_sec (C:)

Logical and Physical Disk counters that utilize rdtsc (inside the QPC function) to measure disk latency e.g., Ave Disk sec/Transfer
74Windows OS
Disk driver
QueryPerformanceCounter()
QueryPerformanceCounter()
start io
io complete

rdtsc is Intercepted by the VM Host and emulated Hypervisor immediately issues an rdtsc instruction, and then makes sure the apparent time returned to the guest is consistent with a
monotonically increasing hardware clock
A clock adjustment is usually not necessary:
The Hypervisor prefers scheduling the vCPU on the same physical CPUwhere it executed previously;
if that CPU is busy, then an available CPU on the same socket is preferred due to NUMA impact, scheduling the vCPU on a physical CPU on a
different socket is inhibited Note: TSCs on separate sockets are not synchronized, which is why the
Hypervisor finds virtual clock adjustments are sometimes necessary
The rdtsc Intercept adds some latency, so the virtualized rdtsc > actual rdtsc75
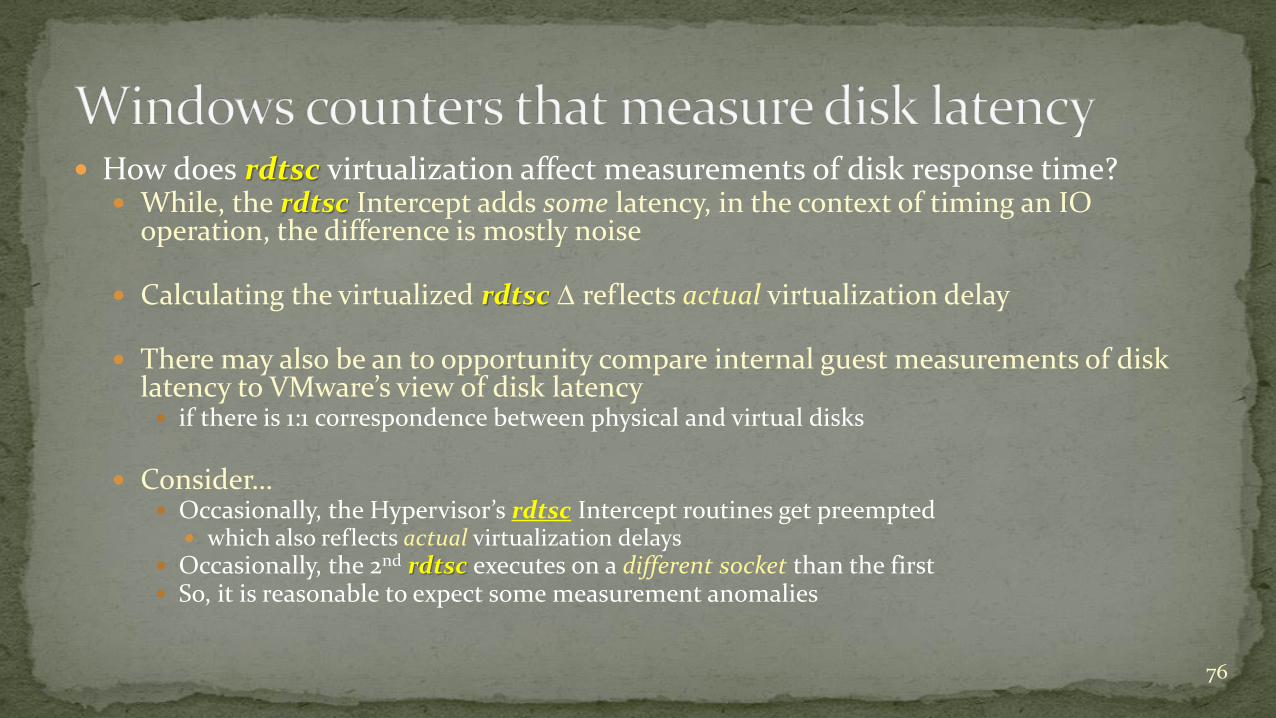
How does rdtsc virtualization affect measurements of disk response time? While, the rdtsc Intercept adds some latency, in the context of timing an IO
operation, the difference is mostly noise
Calculating the virtualized rdtsc reflects actual virtualization delay
There may also be an to opportunity compare internal guest measurements of disk latency to VMware’s view of disk latency if there is 1:1 correspondence between physical and virtual disks
Consider… Occasionally, the Hypervisor’s rdtsc Intercept routines get preempted
which also reflects actual virtualization delays Occasionally, the 2nd rdtsc executes on a different socket than the first So, it is reasonable to expect some measurement anomalies
76
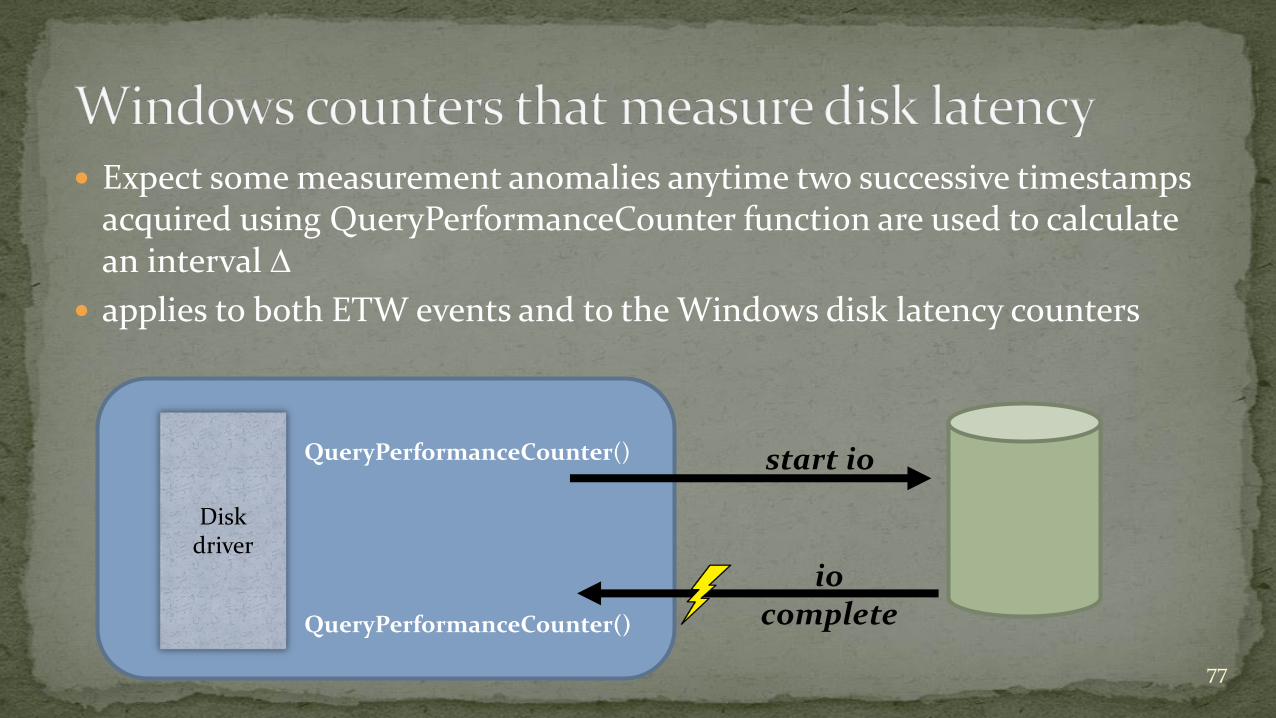
Expect some measurement anomalies anytime two successive timestamps acquired using QueryPerformanceCounter function are used to calculate an interval
applies to both ETW events and to the Windows disk latency counters
77
Disk driver
QueryPerformanceCounter()
QueryPerformanceCounter()
start io
iocomplete
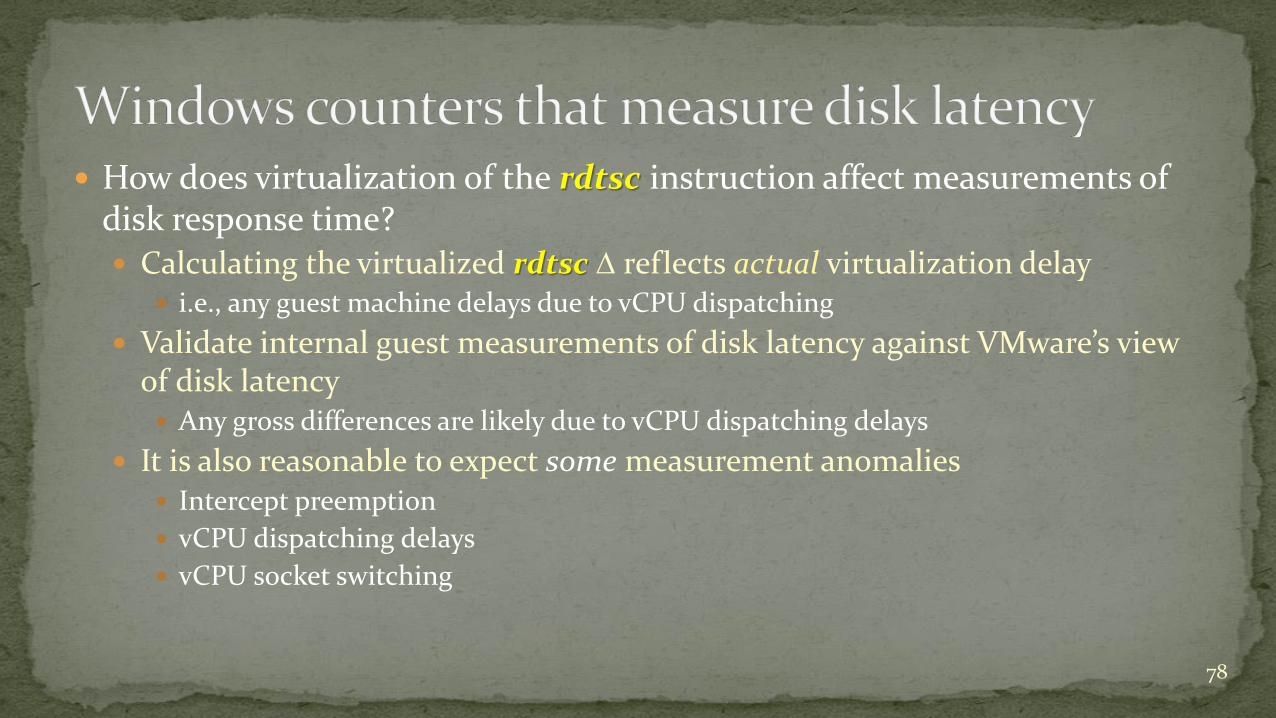
How does virtualization of the rdtsc instruction affect measurements of disk response time? Calculating the virtualized rdtsc reflects actual virtualization delay
i.e., any guest machine delays due to vCPU dispatching
Validate internal guest measurements of disk latency against VMware’s view of disk latency Any gross differences are likely due to vCPU dispatching delays
It is also reasonable to expect some measurement anomalies Intercept preemption
vCPU dispatching delays
vCPU socket switching
78
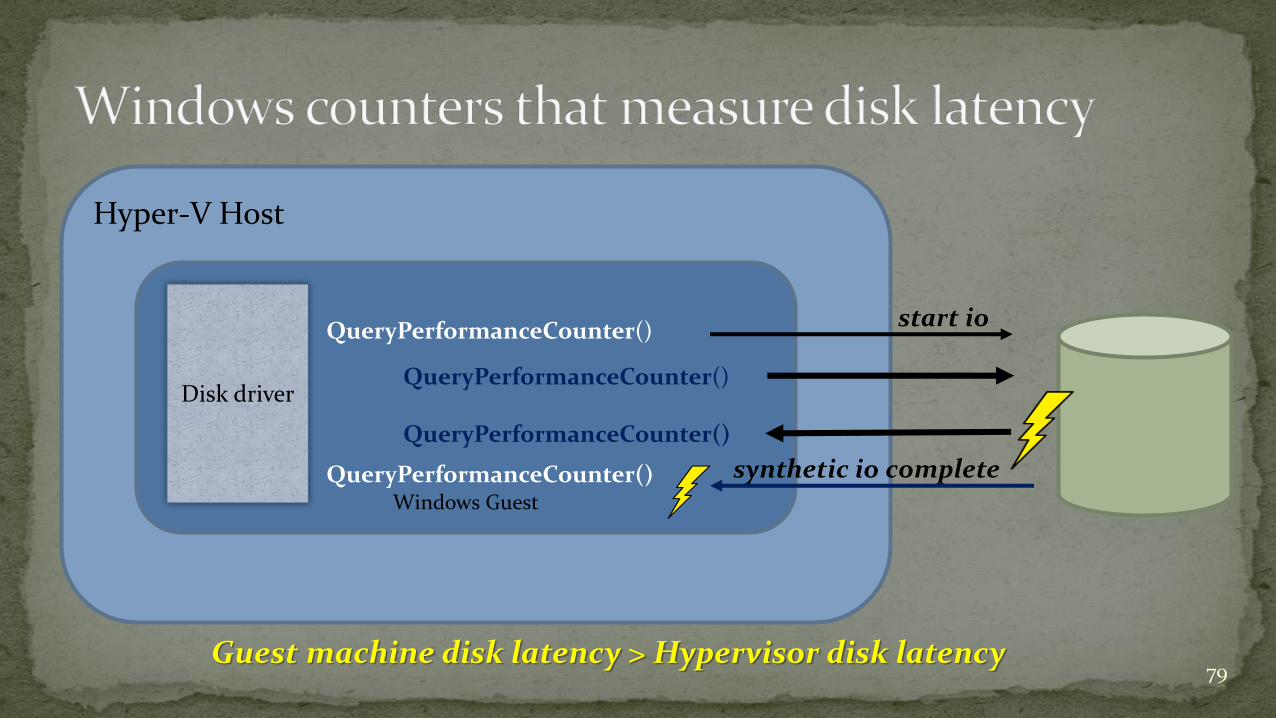
Hyper-V Host
79
Windows Guest
Disk driver
QueryPerformanceCounter()
QueryPerformanceCounter()
start io
synthetic io complete
QueryPerformanceCounter()
QueryPerformanceCounter()
Guest machine disk latency > Hypervisor disk latency
80
0.000
0.020
0.040
0.060
0.080
0.100
0.120
0.140
0.160
0.180
9:00 9:30 10:00 10:31
Dis
k R
esp
on
se T
ime
in
Se
con
ds
Time of Day
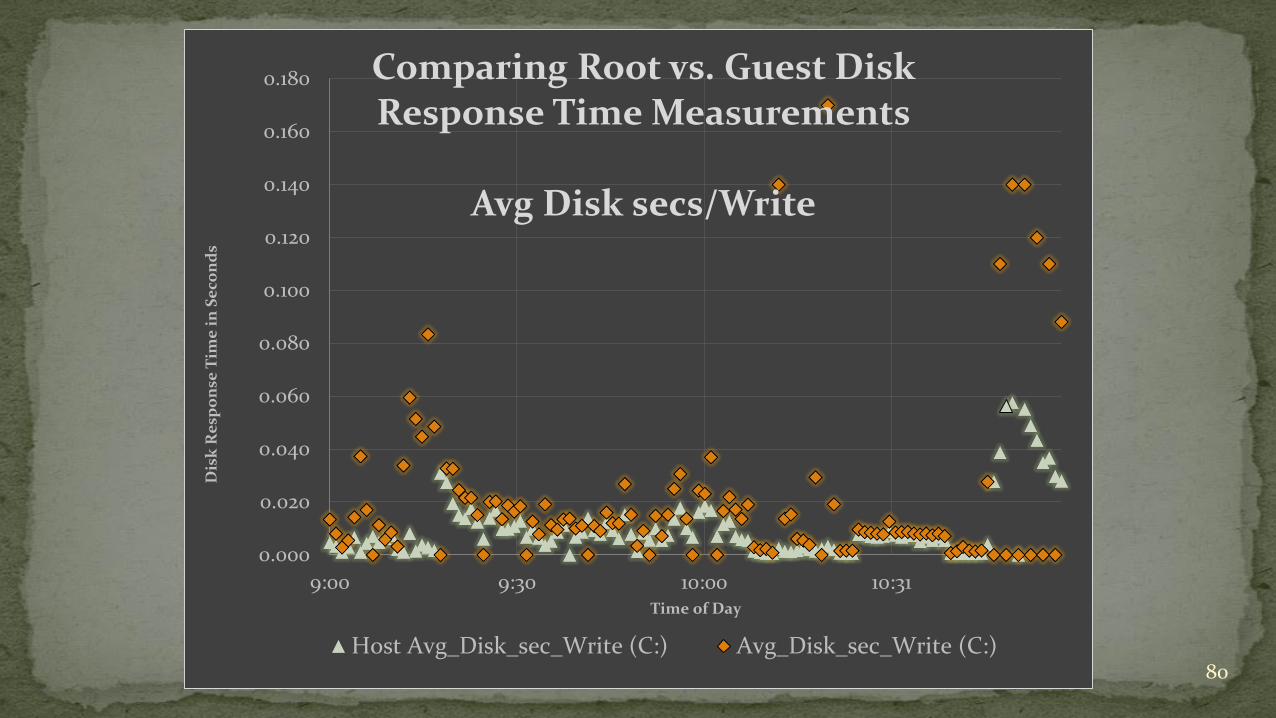
Comparing Root vs. Guest Disk Response Time Measurements
Avg Disk secs/Write
Host Avg_Disk_sec_Write (C:) Avg_Disk_sec_Write (C:)
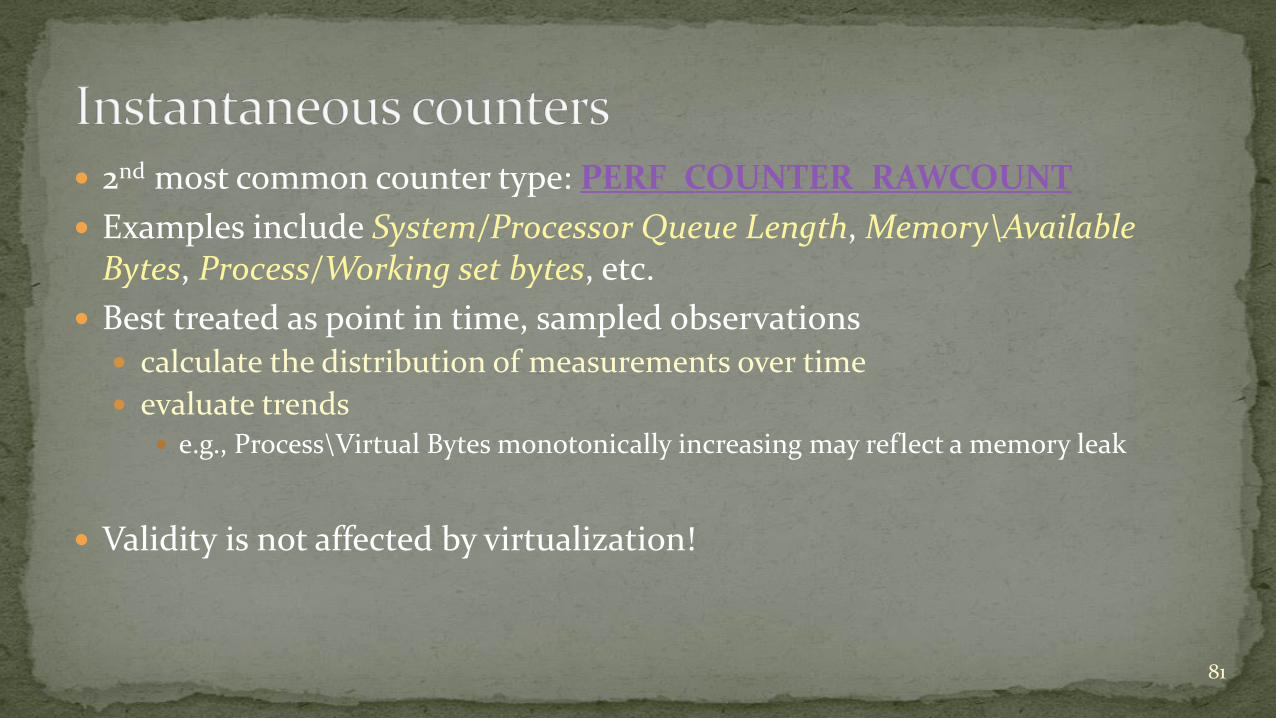
2nd most common counter type: PERF_COUNTER_RAWCOUNT
Examples include System/Processor Queue Length, Memory\Available Bytes, Process/Working set bytes, etc.
Best treated as point in time, sampled observations calculate the distribution of measurements over time
evaluate trends e.g., Process\Virtual Bytes monotonically increasing may reflect a memory leak
Validity is not affected by virtualization!
81
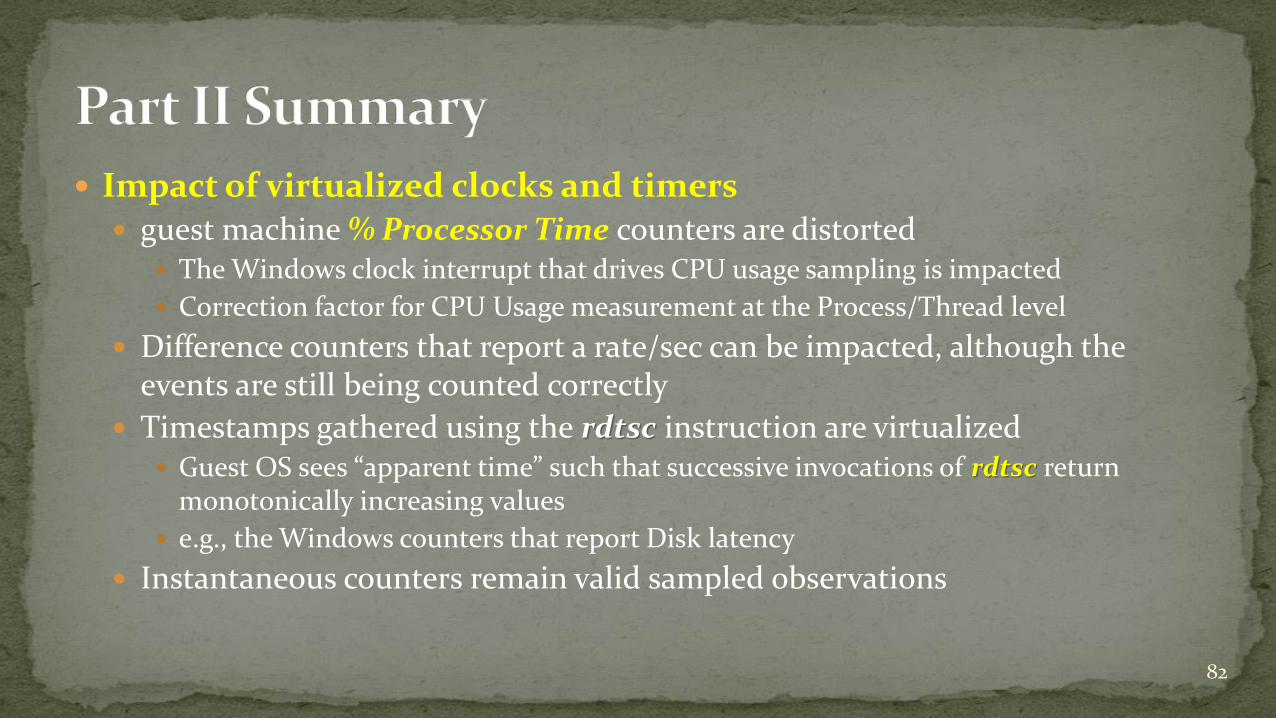
Impact of virtualized clocks and timers guest machine % Processor Time counters are distorted
The Windows clock interrupt that drives CPU usage sampling is impacted
Correction factor for CPU Usage measurement at the Process/Thread level
Difference counters that report a rate/sec can be impacted, although the events are still being counted correctly
Timestamps gathered using the rdtsc instruction are virtualized Guest OS sees “apparent time” such that successive invocations of rdtsc return
monotonically increasing values
e.g., the Windows counters that report Disk latency
Instantaneous counters remain valid sampled observations
82

83