Embed Size (px)
Citation preview

Performance VisionPerformance Vision
1. Understand network usage
2. Monitor network performance
3. Troubleshoot degraded application performance
4. Analyze transaction performance in-depth
5. Monitor VoIP and video conferencing Quality of Service
TRY IT FREE! www.securactive.net
Network and Application Performance Management
SOLVE PERFORMANCE DEGRADATIONS NOW!
Simple to Use and Efficient
IT intelligence to help you make the right investment decisions
Are you in the process of rolling out a new application or expanding services to new locations? A whole host of decisions confront as you forecast your budget. Should you increase bandwidth, upgrade your IT infrastructure or switch to a new software version? With Performance Vision on your side, you will have all the
information you need for these and other critical decision points in making your investment decisions. Managing change based on hard facts – now that is IT intelligence!
Provides the visibility you need
Performance Vision lets you create customized reports that can convey data you consider relevant in a given
situation. With our reporting features, all the information relevant for managers, administrators or technicians is delivered directly to them. From QoS trends to detailed indicators on specific cases, they get exactly the information they need for running an efficient IT operation.
Quick Setup
zz Deploys in minutes
zz Easy to configure
Lightweight software
zz Easy web interface
zz Modern HTML5/CSS3
Seamless communication
zz Reports by email
zz Alerts via SNMP
People you can trust What these customers say about Performance Vision
Performance Vision’s HTTP performance module adds high value for Indexis; this confirms that we made the right choice by switching to Performance Vision; moreover, we expect to benefit from continuous improvements to their solution!
Henrik AdriaensenAMR Manager – Indexis
…after 15 months of use, we feel strongly positive about it. I regularly recommend Perfor-mance Vision to other IT directors who are looking for good visibility on the network and want to diagnose or optimize their IT performance
Roland FUHRMANNC.I.O. – Faymonville
Performance Vision has meant a revolution for our team: we get all the performance data we need, any time we need it, for any network flow and without any prior configuration or filtering!
Christophe FORGINIT infrastructure Manager – Regional Council of Mayenne
Fast, Flexible and Cost-Effective
Straightforward and non-intrusive
SecurActive’s Performance Vision can be installed in just a few minutes on any network without impacting infrastructure: no agent, network configuration change, or traffic overhead is called for. The solution can rely on either SPAN/port mirroring or TAP to process its traffic analyses.
Scalable and distributed
In stand-alone mode, our solution consists of a single collector that analyzes traffic, collects the statistics and presents the data
through a single user interface. In distributed mode, Performance Vision captures and analyzes traffic in several physical locations using distinct appliances, which send their statistics to Performance Vision’s central collector. All the data is aggregated in one database where it can be accessed through the single interface.
Performance Vision appliances can be either physical or virtual VMware. Our solution is highly scalable: additional pollers can be installed in minutes, offering a very attractive long term solution to suit a wide range of environments.
Adapted to both physical and virtual infrastructures
Performance Vision’s virtual appliance is VMware-ready and can provide virtual traffic capture with VMware’s native network tools (Virtual Distributed Switch.)
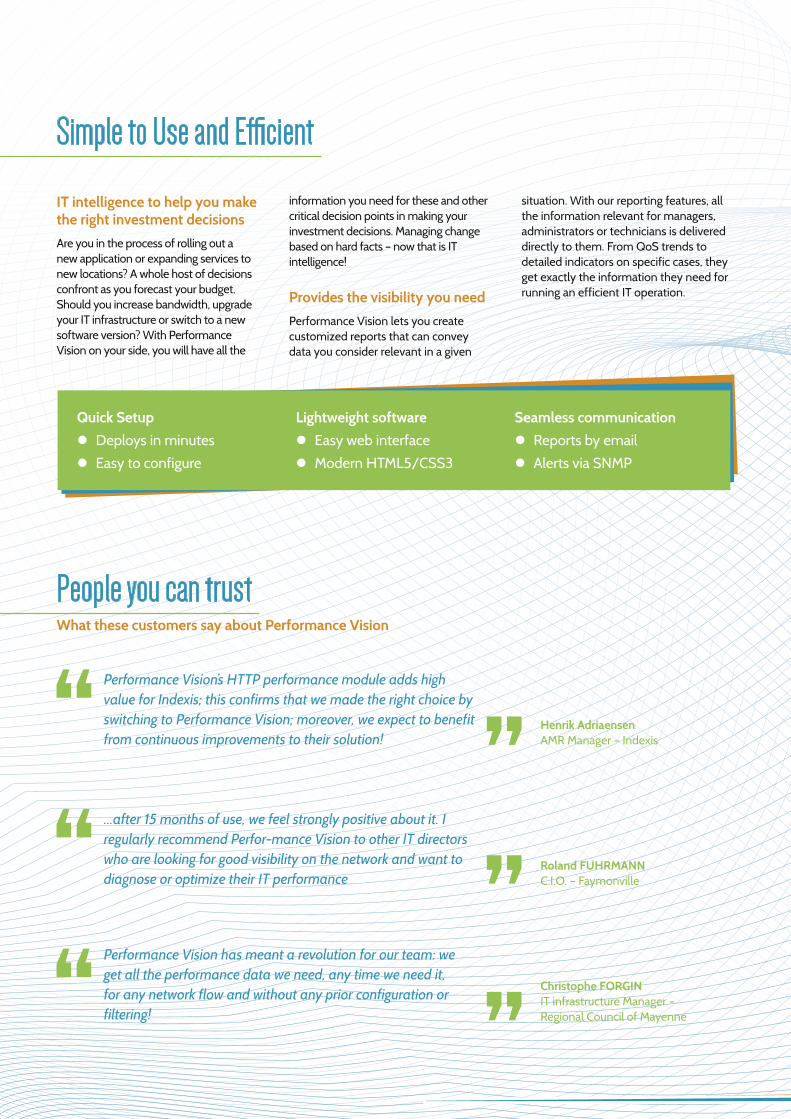
A complete range of solutions
Free Evaluation Audit Express Full Full Poller
Virtual Virtual Hardware Both
History 15 days n/a n/a 15 Days 360 days 360 days n/a
Validity 1 year 15 days > Free 15 or 30 days n/a n/a n/a n/a
Distributed - - P - P P n/a
Reporting - P watermark
P - P P n/a
SNMP - P P - P P P
Max. Flow Analyses 500K 500K 500K 20K, 500K 20K, 100K,
500K n/a n/a
Virtual PV-500 PV-1000 PV-2000 PV-4000 PV-8000
Capture Interfaces n/a 3 x 1Gbps 7 x 1Gbps 7 x 1Gbps 7 x 1Gbps 7 x 1Gbps
Storage n/a 500 GB 500 GB 1.2 TB - RAID 0 1.8 TB - RAID 0 2.4 TB - RAID 0
Network cards n/a - 1 2 3 3
Chassis n/a 1U 1U 2U 2U 2U
1. Understand Network Usage
Make the best decisions for network infrastructure
When it comes to understanding network usage, the first requirement is knowing who does what with which applications. This understanding underpins all diagnostic, optimization and decision-making processes.
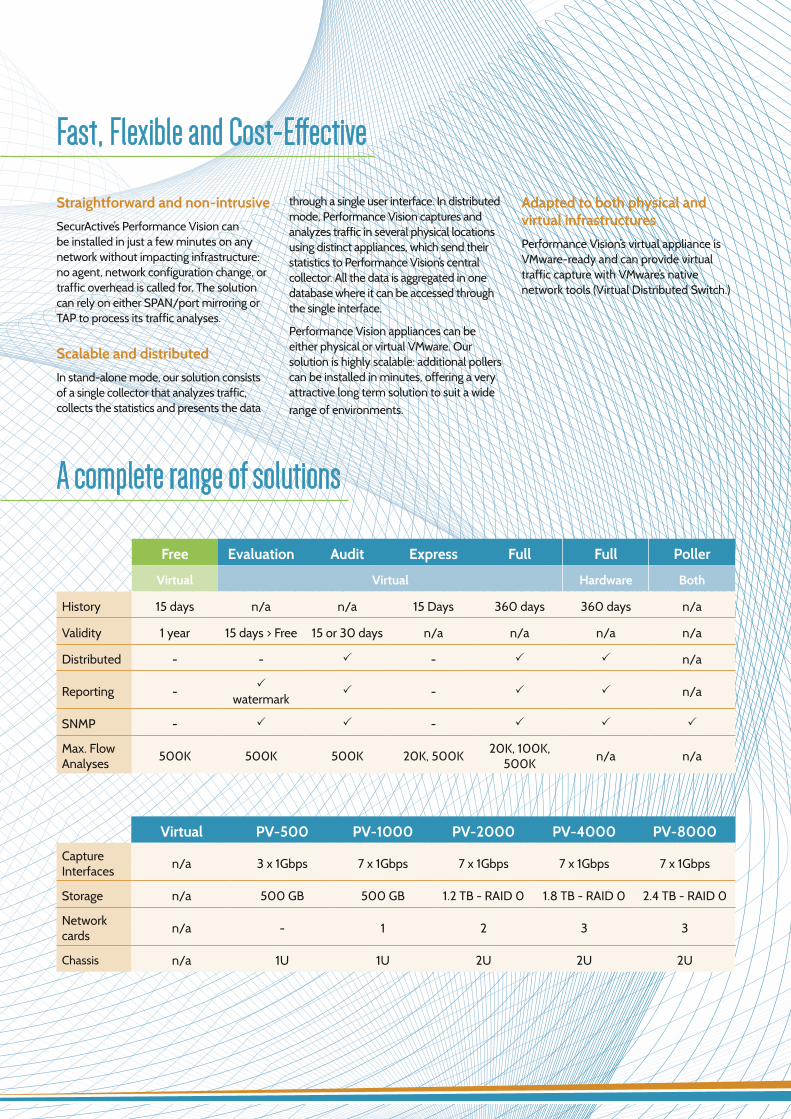
Performance Vision – Usage excels in clearly mapping network flows and showing you which network user flows and activities consume the most bandwidth.
Our application provides critical information for understanding long-term usage trends that let you anticipate your organization’s network capacity needs. You get key insights for managing capacity proactively, to avoid congestion incidents and steer clear of performance degradation.
Reduce the risks attached to upgrades and rollouts
With network monitoring capabilities that include traffic mapping, bandwidth charts and top reports, Performance Vision gives you the tools for forecasting potential congestion/degradation incidents even before user complaints escalate. You get all the relevant data you need to anticipate the changes in your network’s capacity that upgrades and new application rollouts invariably demand.
Imagine being able to quickly and easily pinpoint users that show the worst end user response times, then instantly drilling down to individual user flows with a single click to precisely answer key questions, such as: Where are my dissatisfied users for a given application? From which datacenter are they accessing a problematic application? Are they getting the same response time from different servers and from different zones? On which paths can I detect excessive packet
loss / retransmission rates? You get real-time answers for solving real-world problems.
Minimize network infrastructure costs
To make effective decisions, you also need a clear grasp of network volumes and network use patterns specific to each application. With Performance Vision – Usage you get both, so that you can optimize Quality of Service without maintaining excess network capacity and IT budget-busting costs.
Key features
zz Network traffic mapping
zz Bandwidth graphs
zz Top reports (applications, clients, servers, etc.)
zz Packet Capture
zz Netflow collection
Network traffic matrix
Usage: Bandwidth analysis
USAGE
2. Monitor Network Performance
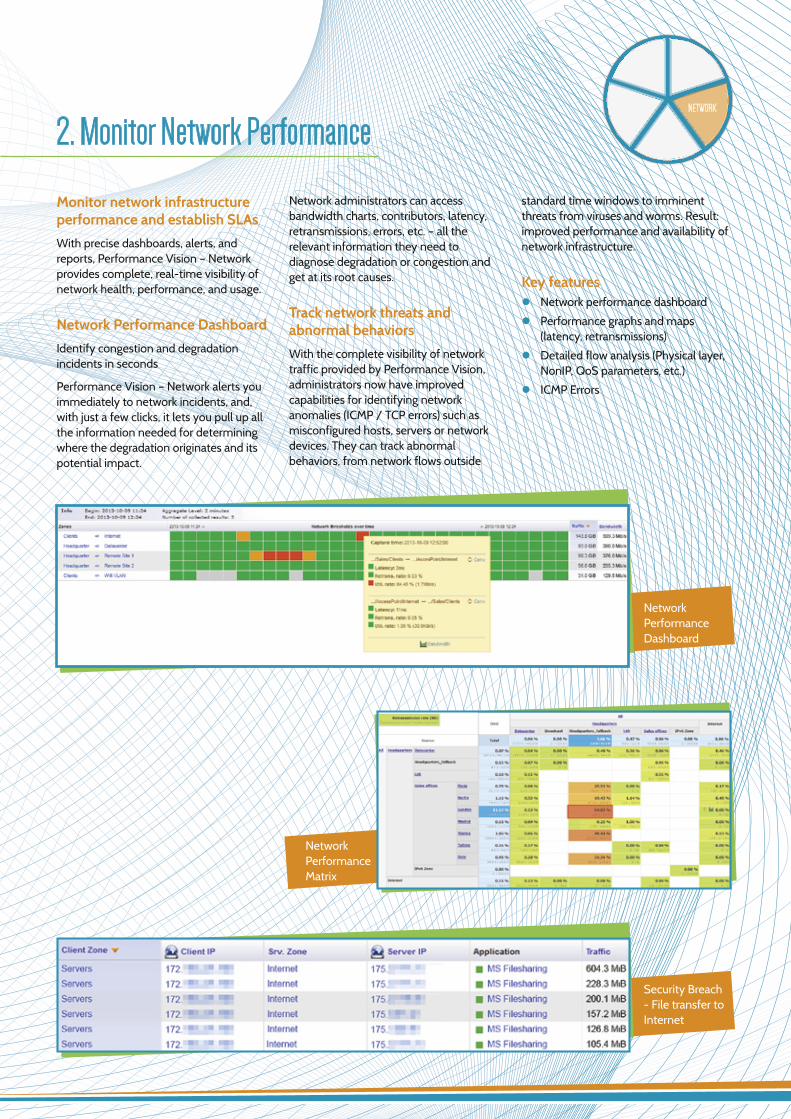
Monitor network infrastructure performance and establish SLAs
With precise dashboards, alerts, and reports, Performance Vision – Network provides complete, real-time visibility of network health, performance, and usage.
Network Performance Dashboard
Identify congestion and degradation incidents in seconds
Performance Vision – Network alerts you immediately to network incidents, and, with just a few clicks, it lets you pull up all the information needed for determining where the degradation originates and its potential impact.
Network administrators can access bandwidth charts, contributors, latency, retransmissions, errors, etc. – all the relevant information they need to diagnose degradation or congestion and get at its root causes.
Track network threats and abnormal behaviors
With the complete visibility of network traffic provided by Performance Vision, administrators now have improved capabilities for identifying network anomalies (ICMP / TCP errors) such as misconfigured hosts, servers or network devices. They can track abnormal behaviors, from network flows outside
standard time windows to imminent threats from viruses and worms. Result: improved performance and availability of network infrastructure.
Key featureszz Network performance dashboard
zz Performance graphs and maps (latency, retransmissions)
zz Detailed flow analysis (Physical layer, NonIP, QoS parameters, etc.)
zz ICMP Errors
Network Performance Dashboard
Security Breach - File transfer to Internet
Network Performance Matrix
NETWORK
3. Troubleshoot Degraded App Performance
Optimize end user experience with application performance monitoring
Performance Vision – Application’s set of indicators helps you master the behavior of business-critical applications. Track the origin of an application slowdown in seconds to speed up the incident resolution process. Gauge performance trends to anticipate and plan network and applications changes that will lead to optimum Quality of Service levels for your business users.
Improve IT team collaboration for critical application delivery
Ability to identify rapidly a problem on any link in the application performance
chain is the key to efficient, collaborative problem solving within IT departments. The information displayed in our Performance Vision dashboards and graphs lets each team (network, systems, application and database) understand application behavior and track a slowdown to its origin. Only the implicated team then needs to work on resolving it. Our solution also eases communications about network and application health issues with management and the business units, often a critical element in these situations.
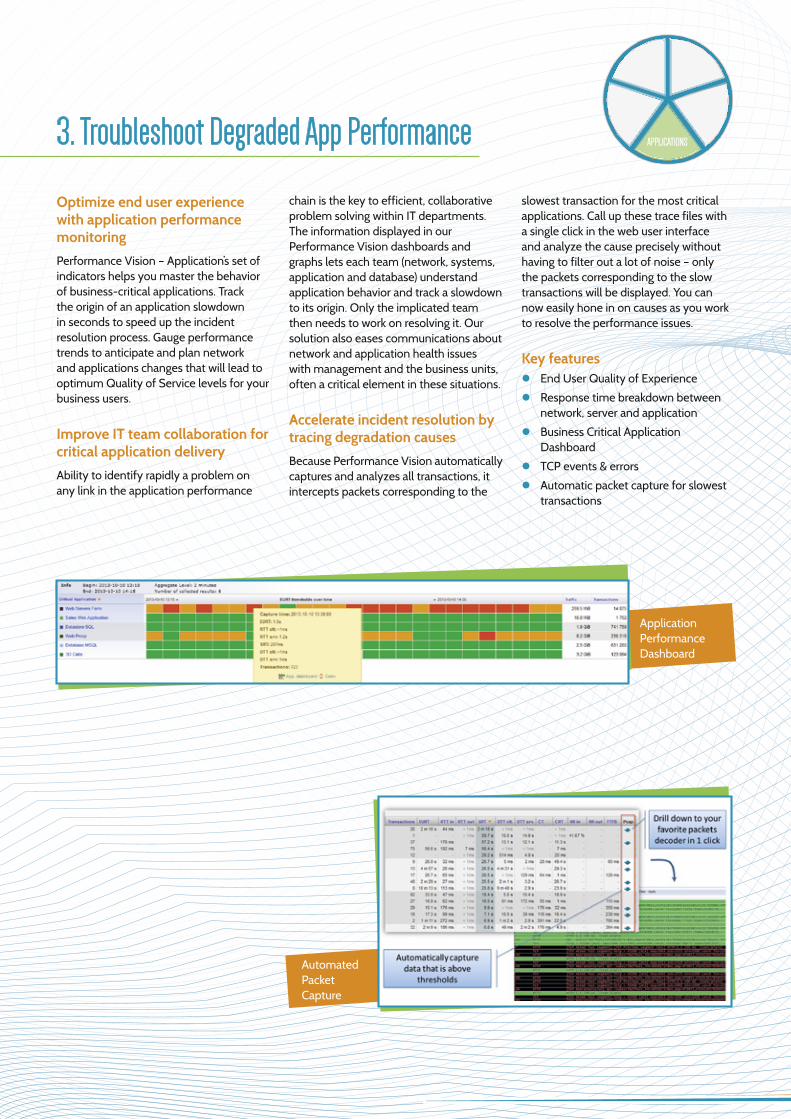
Accelerate incident resolution by tracing degradation causes
Because Performance Vision automatically captures and analyzes all transactions, it intercepts packets corresponding to the
slowest transaction for the most critical applications. Call up these trace files with a single click in the web user interface and analyze the cause precisely without having to filter out a lot of noise – only the packets corresponding to the slow transactions will be displayed. You can now easily hone in on causes as you work to resolve the performance issues.
Key featureszz End User Quality of Experience
zz Response time breakdown between network, server and application
zz Business Critical Application Dashboard
zz TCP events & errors
zz Automatic packet capture for slowest transactions
Automated Packet Capture
Application Performance Dashboard
APPLICATIONS
4. Analyze Transaction Performance in-depth
Forever change troubleshooting of your critical applications
Performance Vision measures the performance of your most critical business applications and allows you to validate that they meet the service levels expected by the end users. Performance Vision captures a wide range of performance and troubleshooting data to facilitate the diagnostic process that starts with an end user complaint and leads to detailed transaction-level analysis and to take decisions to optimize the overall performance of key applications through the infrastructure.
Analyze the performance of your HTTP/HTTPS applications
Performance Vision measures the performance of your HTTP / HTTPS applications from the end users’ perspective (page load time) and from a technical stand point (response time per transaction).
As an administrator, we now get answers to questions like these in minutes: Which pages are slow? What is slowing them down? Where do I encounter errors? Exactly which queries generate errors?
Are any pages too complex? Are any of the objects too large?
We can even record the details of queries and responses for in-depth analysis and also take advantage of advanced filtering features using a large variety of criteria such as content types, response codes, user-agent, paths, etc. All this integrates seamlessly with your network – there is no agent to deploy and no need to change your network architecture.
Master the performance of your databases
Databases may encounter delays due to non-optimized queries, error or too long processing. Performance Vision analyzes main databases on the market based on SQL, without any additional load on the server or infrastructure.
With a few clicks, administrators can visualize the state of the database, identify requests having the highest response times, errors, the commands contained in each query...
Understand the impact of name resolution on end-user experience
The impact of name resolution on services issues is often underestimated. Performance Vision captures and analyzes name resolution transactions. This feature provides you with a complete set of information, including DNS architecture, resolved domains (DNS and reverse DNS on all types of queries) query volumes and server response times. You can track the impact of DNS and determine whether end-user experience is affected by slow DNS response times.
Key features : zz HTTP Page Load Time
zz HTTP detailed transaction analysis: status, transaction time, query/response retention.
zz SSL decryption for HTTPS transaction analysis
zz Performance and detailed transaction analysis for name resolution services
zz Detailed analysis of SQL transactions
zz Transaction level analysis for file transfer and storage protocols (CIFS / SMB)
5. Monitor VoIP and Videoconferencing QoS
Analyze Voice over IP quality and speed up diagnostics
When users complain about poor-quality VOIP communications, you need precise information about VOIP traffic and quality to determine whether complaints are justified and what causes them. Performance Vision – VoIP collects
all necessary information on each call (setup, signaling, and media) to provide a synthetic MOS Quality of Service indicator.
Diagnosing degradations, whether caused by excessive latency, abnormal usage, bandwidth saturation, call server, phone, high jitter or packet loss, is a cinch with Performance Vision’s VoIP module.
Key Featureszz Call volumes and error rate
zz Overview of calls per caller/callee zone
zz Detailed statistics for each call
zz MOS, latency, jitter, and packet loss measurement
TRANSACTION
VOIP
About SecurActive
SecurActive is a leading vendor of network and application performance monitoring solutions. Our broad spectrum of innovative solutions lets you gain a global view of infrastructure, application performance, and usage. With SecurActive Performance Vision, you can monitor flows at strategic points on your network to measure end user Quality of Experience (QoE), all network traffic, and transactions processed. Join the more than 600 customers ranging across a variety of industries and countries that profit from SecurActive appliances for daily network management.
zz Year founded: 2004
zz Headquarters: Paris, France
zz Channel partners: Over 30 certified integrators / distributors
zz Customers: More than 600 on four continents
zz VMware Technology Alliance Partner
Customer ReferencesBanking & Insurance: AG2R La Mondiale, Agric Arco, Baloise Assurances, Banque Palatine, EuropAs-sistance, GIE La Française AM , Ikano Bank, Mutuelle des Motards Portima, Prévifrance,…,
Manufacturers: Air Liquide, Bolloré, Castel Frères, Doris Engineering, Faymonville, Laboratoires Anios, Laboratoires Urgo, L’Oréal, Martell, Merck Serono, Mölnlycke Healthcare, Ondeo Industrial Solutions (GDF-Suez), Patek Philippe, Pernod, Safran – Morpho, Sercel, Sharp Electronics, Sonaca, Spie Batignolles, Stryker Spine, Tubesca
Services & Utilities: Alma Consulting, Elko, Groupe Onet, Groupe E, Groupe S, Idewe, Indexis, KPMG, Sofrecom, Stallergenes, TIGF, Vinci Immobilier
Retail: Cdiscount, Crozatier, Cultura, Galeries Lafayette, Plus Retail…
Government: Ademe, Bundeswehr Informatik, CCI Côté d’Azur, Orléans, Grenoble…, Chambre des Députés du Luxembourg, COCOF, ISO (International Standard Organization), Ministry of Defense (France) – DIRISI, Préfecture de Police de Paris, and over 40 local government entities
Healthcare: over 70 hospitals. Chirec, CH de Poissy – St Germain, Creil, St Denis …, CHR Citadelle, Clinique Saint Elizabeth, CHS Cadillac, Perray-Vaucluse, Maison Blanche …, Cliniques Universitaires St Luc, Grand Hopital de Charleroi, Hôpitaux Iris Sud, Jan Yperman Zikenhuis,
Education & Research: Académies de Montpellier, Toulouse, Clermont-Ferrand, BRGM, CRP Luxem-bourg, University of Luxemburg
Performance VisionPerformance VisionSecurActive SA
56 rue Saint Georges, 75009 Paris, FranceTel: +33 1 78 09 07 00www.securactive.net | [email protected]