Embed Size (px)
DESCRIPTION
Citation preview
September 2009
Project Programming & Prioritisation Toolkit
USER MANUAL
FROM WISH LIST TO SHORT LIST: PRIORITISING URBAN INFRASTRUCTURE PROJECTS FOR LOCAL DEVELOPMENT
Cities Development Initiative for Asia
CDIA

Project Programming & Prioritisation Toolkit 2
This toolkit has been developed by the Cities Development Initiative for Asia (CDIA) to assist
cities and municipalities throughout Asia to do a better and more structured job in urban
infrastructure planning, prioritisation and programming.
The toolkit consists of this manual and an excel workbook. Both can be downloaded free of
charge from the CDIA website upon registration of the local government entity with CDIA.
CDIA is a multi-donor initiative assisting medium size cities in Asia to meet the urban
infrastructure investment challenge. CDIA offers pre-project preparation and capacity-building to
turn existing city development strategies into an urban reality.
For more information: www.cdia.asia
Project Programming & Prioritisation Toolkit 3
Moving from strategies to
bankable investment
projects
Project Programming
& Prioritisation Toolkit
USER MANUAL
Cities Development Initiative for Asia
CDIA
Project Programming & Prioritisation Toolkit 4
Published in September 2009 Copyright © by the Cities Development Initiative for Asia (CDIA) Consultant: Dr. Ester van Steekelenburg Computer Modelling: Mr. Nguyen Huu Hoa
Note: The excel file that accompanies this manual is a computer based model for on-screen use. With the exception of the summary sheet it is NOT designed to be printed.
TOOLKIT FOR PROJECT PRORAMMING & PRIORITISATION
TABLE OF CONTENTS INTRODUCTION 1 STEP 1 ANALYSIS FINANCIAL CAPACITY 8
1.1: FISCAL ASSESSMENT 9 1.2: FINANCIAL MANAGEMENT ASSESSMENT 11 1.3: INVESTMENT BUDGET FORECAST 13
STEP 2 PROJECT PRIORITISATION 19
PRIORITISING: THE SCORING METHODOLOGY 20 SECTION 1: PROJECT DESCRIPTORS 24 SECTION 2: FINANCIAL PARAMETERS 25 SECTION 3: PRIORITISATION PARAMETERS 27 SECTION 4: ADDITIONAL PROJECT DATA 32 SECTION 5: IMPACT OF PROJECT ON GOVERNMENT BUDGET 33 GUIDANCE FOR THE FACILITATOR 38
STEP 3 PROGRAMMING FOR INVESTMENT 41
WHAT IS A PRIORITY INVESTMENT PACKAGE? 41 GUIDANCE FOR THE FACILITATOR 43
EXAMPLE: PROJECT CASE STUDIES IN NEPAL 46 GLOSSARY 49 REFERENCES 50

Project Programming & Prioritisation Toolkit 1
INTRODUCTION
Project Programming & Prioritisation Toolkit 1
INTRODUCTION
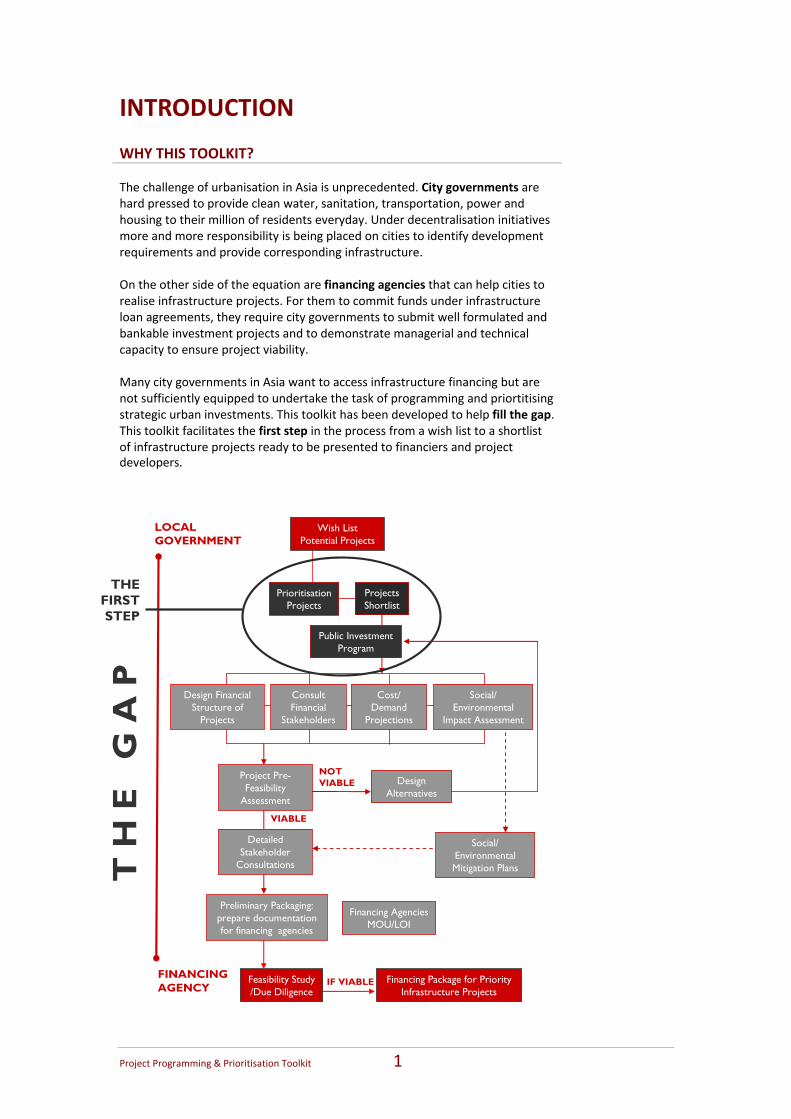
WHY THIS TOOLKIT? The challenge of urbanisation in Asia is unprecedented. City governments are hard pressed to provide clean water, sanitation, transportation, power and housing to their million of residents everyday. Under decentralisation initiatives more and more responsibility is being placed on cities to identify development requirements and provide corresponding infrastructure. On the other side of the equation are financing agencies that can help cities to realise infrastructure projects. For them to commit funds under infrastructure loan agreements, they require city governments to submit well formulated and bankable investment projects and to demonstrate managerial and technical capacity to ensure project viability. Many city governments in Asia want to access infrastructure financing but are not sufficiently equipped to undertake the task of programming and priortitising strategic urban investments. This toolkit has been developed to help fill the gap. This toolkit facilitates the first step in the process from a wish list to a shortlist of infrastructure projects ready to be presented to financiers and project developers.
LOCAL GOVERNMENT
FINANCING AGENCY
T H
E
G A
P
Feasibility Study /Due Diligence
Financing Package for Priority Infrastructure Projects
Prioritisation Projects
Public Investment Program
THE FIRST STEP
Wish List Potential Projects
Projects Shortlist
Design Financial Structure of
Projects
Cost/ Demand
Projections
Consult Financial
Stakeholders
NOT VIABLE
VIABLE
Project Pre-Feasibility
Assessment
Social/ Environmental Mitigation Plans
Social/ Environmental
Impact Assessment
Preliminary Packaging: prepare documentation for financing agencies
Detailed Stakeholder
Consultations
Design Alternatives
Financing Agencies MOU/LOI
IF VIABLE
Project Programming & Prioritisation Toolkit 2
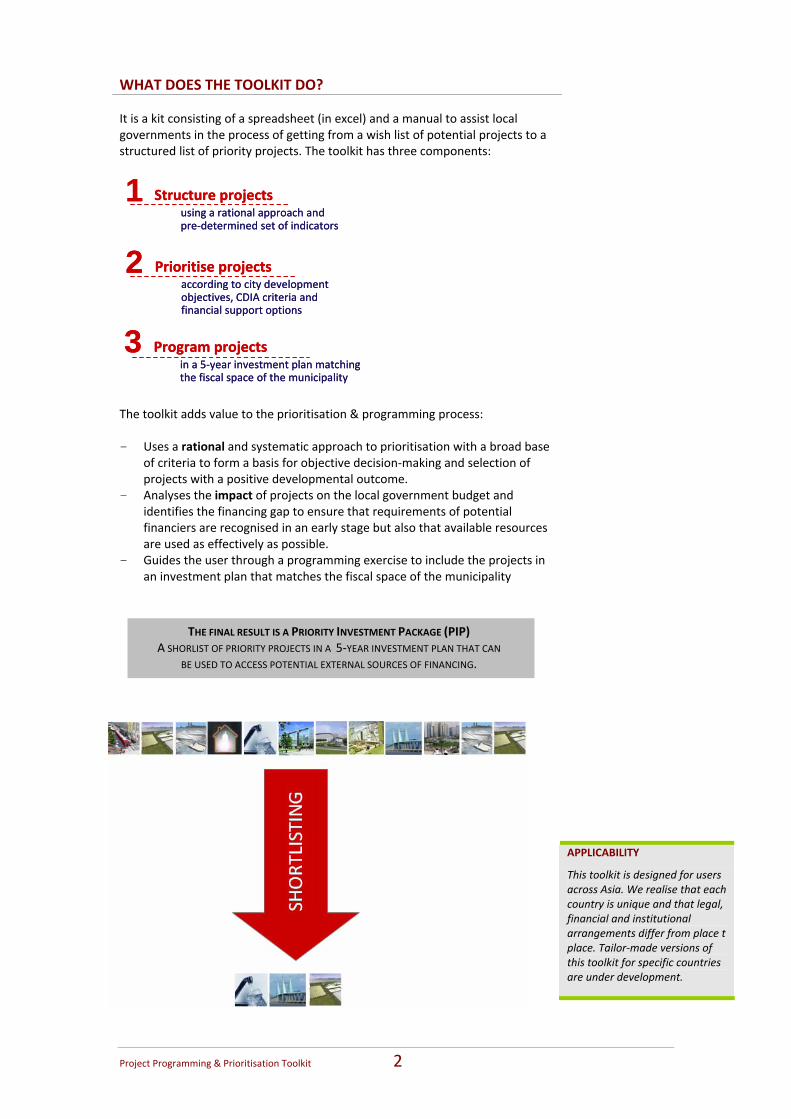
WHAT DOES THE TOOLKIT DO? It is a kit consisting of a spreadsheet (in excel) and a manual to assist local governments in the process of getting from a wish list of potential projects to a structured list of priority projects. The toolkit has three components: The toolkit adds value to the prioritisation & programming process: - Uses a rational and systematic approach to prioritisation with a broad base
of criteria to form a basis for objective decision‐making and selection of projects with a positive developmental outcome.
- Analyses the impact of projects on the local government budget and identifies the financing gap to ensure that requirements of potential financiers are recognised in an early stage but also that available resources are used as effectively as possible.
- Guides the user through a programming exercise to include the projects in an investment plan that matches the fiscal space of the municipality
APPLICABILITY
This toolkit is designed for users across Asia. We realise that each country is unique and that legal, financial and institutional arrangements differ from place t place. Tailor‐made versions of this toolkit for specific countries are under development.
Prioritise projectsaccording to city development objectives, CDIA criteria and financial support options
2 Prioritise projectsaccording to city development objectives, CDIA criteria and financial support options
2
Program projectsin a 5‐year investment plan matching the fiscal space of the municipality
3 Program projectsin a 5‐year investment plan matching the fiscal space of the municipality
3
Structure projectsusing a rational approach and pre‐determined set of indicators
1 Structure projectsusing a rational approach and pre‐determined set of indicators
1
THE FINAL RESULT IS A PRIORITY INVESTMENT PACKAGE (PIP) A SHORLIST OF PRIORITY PROJECTS IN A 5‐YEAR INVESTMENT PLAN THAT CAN
BE USED TO ACCESS POTENTIAL EXTERNAL SOURCES OF FINANCING.
Project Programming & Prioritisation Toolkit 3
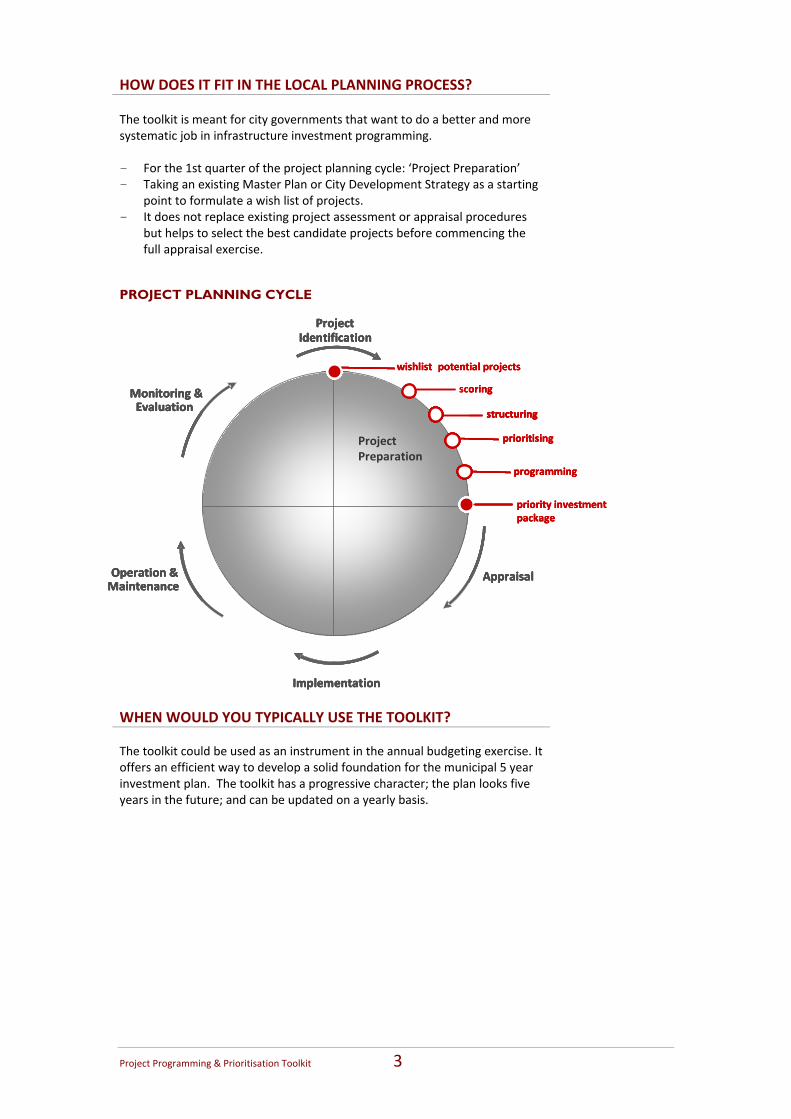
HOW DOES IT FIT IN THE LOCAL PLANNING PROCESS? The toolkit is meant for city governments that want to do a better and more systematic job in infrastructure investment programming. - For the 1st quarter of the project planning cycle: ‘Project Preparation’ - Taking an existing Master Plan or City Development Strategy as a starting
point to formulate a wish list of projects. - It does not replace existing project assessment or appraisal procedures
but helps to select the best candidate projects before commencing the full appraisal exercise.
PROJECT PLANNING CYCLE WHEN WOULD YOU TYPICALLY USE THE TOOLKIT? The toolkit could be used as an instrument in the annual budgeting exercise. It offers an efficient way to develop a solid foundation for the municipal 5 year investment plan. The toolkit has a progressive character; the plan looks five years in the future; and can be updated on a yearly basis.
Appraisal
Implementation
Monitoring & Evaluation
Project Identification
Operation & Maintenance
Appraisal
Implementation
Monitoring & Evaluation
Project Identification
Operation & Maintenance
wishlist potential projects
structuring
scoring
programming
priority investment package
prioritising Project Preparation
Appraisal
Implementation
Monitoring & Evaluation
Project Identification
Operation & Maintenance
Appraisal
Implementation
Monitoring & Evaluation
Project Identification
Operation & Maintenance
wishlist potential projectswishlist potential projects
structuringstructuringstructuring
scoringscoring
programmingprogramming
priority investment packagepriority investment package
prioritising prioritising Project Preparation
Project Programming & Prioritisation Toolkit 4
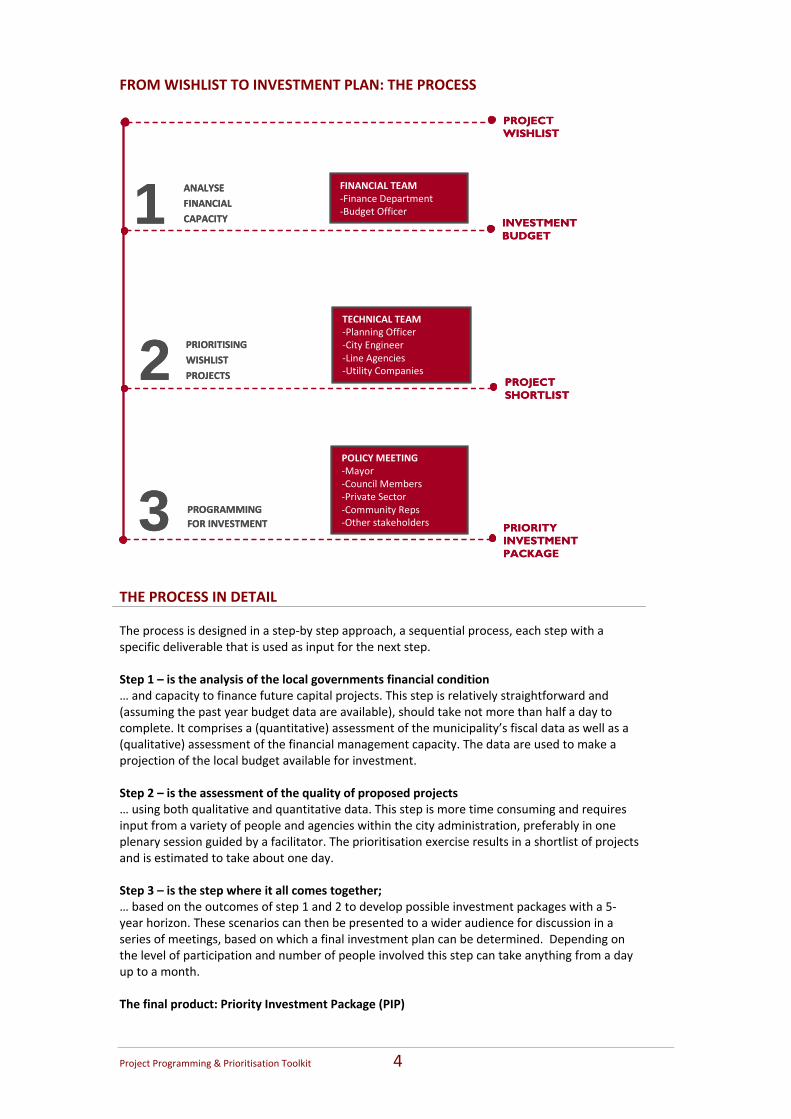
FROM WISHLIST TO INVESTMENT PLAN: THE PROCESS THE PROCESS IN DETAIL The process is designed in a step‐by step approach, a sequential process, each step with a specific deliverable that is used as input for the next step. Step 1 – is the analysis of the local governments financial condition … and capacity to finance future capital projects. This step is relatively straightforward and (assuming the past year budget data are available), should take not more than half a day to complete. It comprises a (quantitative) assessment of the municipality’s fiscal data as well as a (qualitative) assessment of the financial management capacity. The data are used to make a projection of the local budget available for investment. Step 2 – is the assessment of the quality of proposed projects … using both qualitative and quantitative data. This step is more time consuming and requires input from a variety of people and agencies within the city administration, preferably in one plenary session guided by a facilitator. The prioritisation exercise results in a shortlist of projects and is estimated to take about one day. Step 3 – is the step where it all comes together; … based on the outcomes of step 1 and 2 to develop possible investment packages with a 5‐year horizon. These scenarios can then be presented to a wider audience for discussion in a series of meetings, based on which a final investment plan can be determined. Depending on the level of participation and number of people involved this step can take anything from a day up to a month. The final product: Priority Investment Package (PIP)
PROJECT WISHLIST
TECHNICAL TEAM‐Planning Officer ‐City Engineer‐Line Agencies‐Utility Companies
PRIORITISING WISHLIST
PROJECTS2
PRIORITY INVESTMENT PACKAGE
ANALYSE FINANCIAL CAPACITY
FINANCIAL TEAM‐Finance Department‐Budget Officer1
POLICY MEETING ‐Mayor ‐Council Members‐Private Sector‐Community Reps‐Other stakeholders
PROGRAMMING FOR INVESTMENT3
INVESTMENT BUDGET
PROJECT SHORTLIST
Project Programming & Prioritisation Toolkit 5
SOPHISTICATION VERSUS SIMPLICITY The starting point for the development of this toolkit was that it: - Must be applicable and if possible add value to the local planning process
in different size cities and among different countries - Must be generic enough to be applicable to different country context,
while also containing sufficient level of detail for use at the operational level and allow for cross city and country comparison
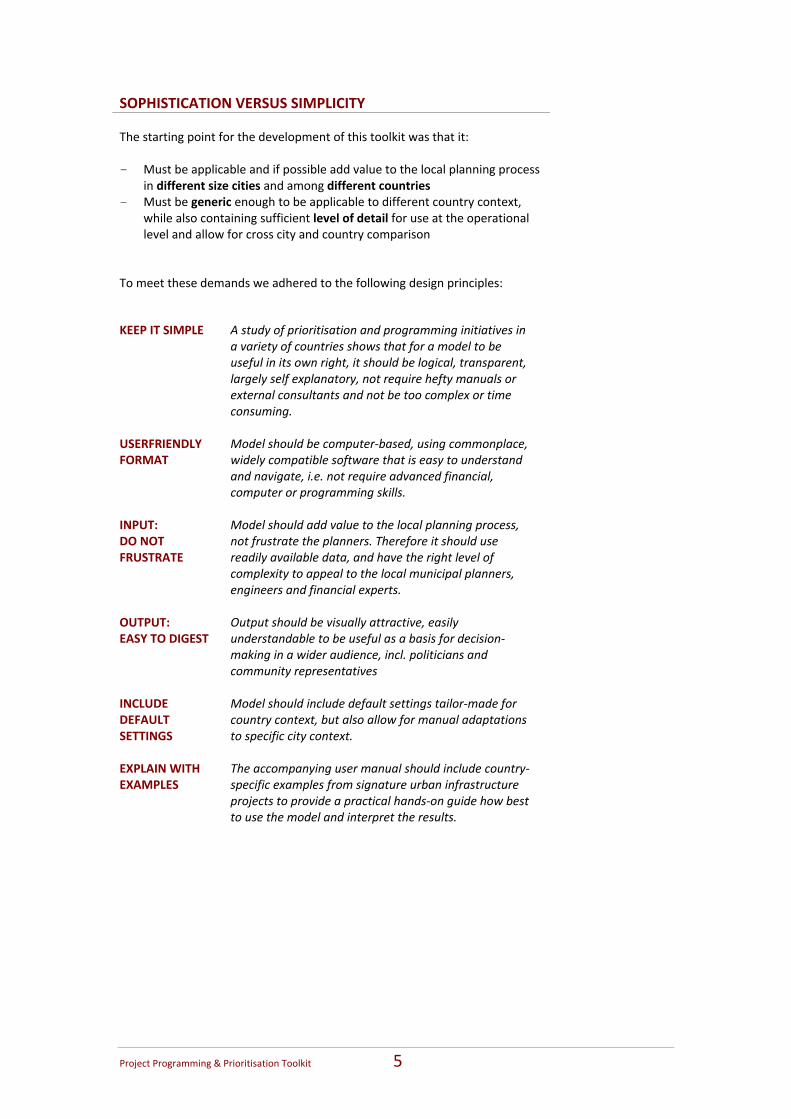
To meet these demands we adhered to the following design principles: KEEP IT SIMPLE A study of prioritisation and programming initiatives in
a variety of countries shows that for a model to be useful in its own right, it should be logical, transparent, largely self explanatory, not require hefty manuals or external consultants and not be too complex or time consuming.
USERFRIENDLY FORMAT
Model should be computer‐based, using commonplace, widely compatible software that is easy to understand and navigate, i.e. not require advanced financial, computer or programming skills.
INPUT: DO NOT FRUSTRATE
Model should add value to the local planning process, not frustrate the planners. Therefore it should use readily available data, and have the right level of complexity to appeal to the local municipal planners, engineers and financial experts.
OUTPUT: EASY TO DIGEST
Output should be visually attractive, easily understandable to be useful as a basis for decision‐making in a wider audience, incl. politicians and community representatives
INCLUDE DEFAULT SETTINGS
Model should include default settings tailor‐made for country context, but also allow for manual adaptations to specific city context.
EXPLAIN WITH EXAMPLES
The accompanying user manual should include country‐specific examples from signature urban infrastructure projects to provide a practical hands‐on guide how best to use the model and interpret the results.
Project Programming & Prioritisation Toolkit 6
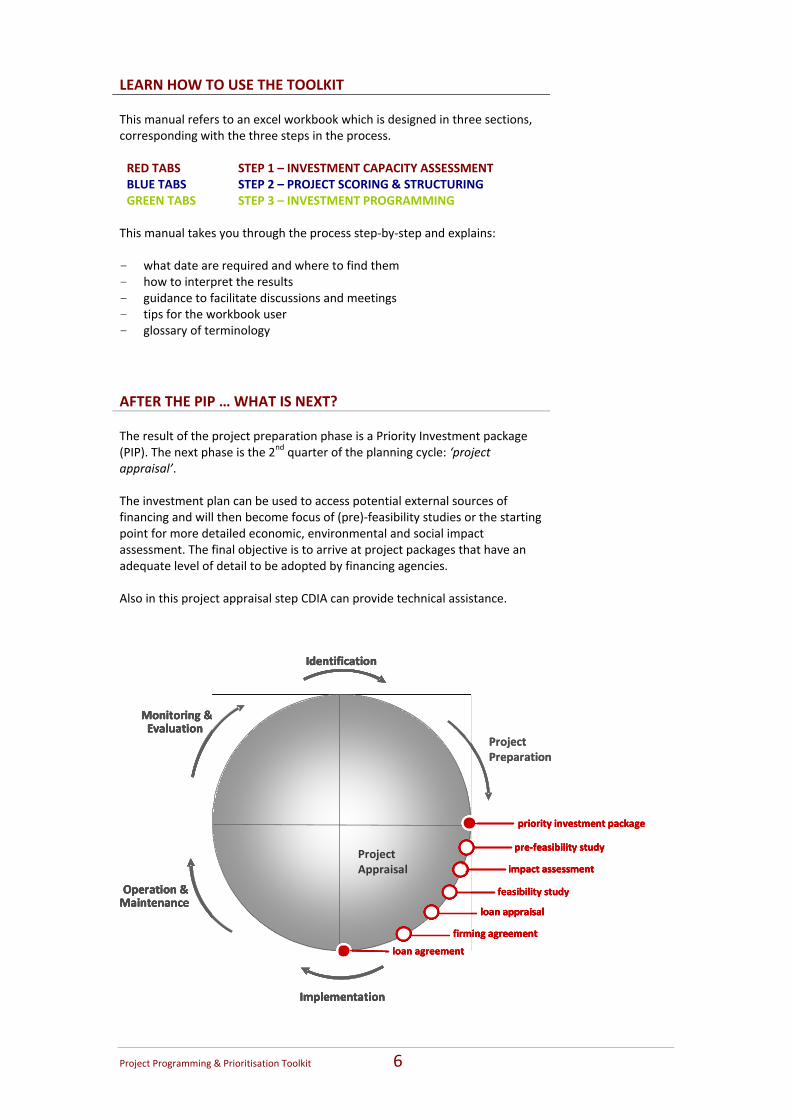
LEARN HOW TO USE THE TOOLKIT This manual refers to an excel workbook which is designed in three sections, corresponding with the three steps in the process. RED TABS STEP 1 – INVESTMENT CAPACITY ASSESSMENT BLUE TABS STEP 2 – PROJECT SCORING & STRUCTURING GREEN TABS STEP 3 – INVESTMENT PROGRAMMING
This manual takes you through the process step‐by‐step and explains: - what date are required and where to find them - how to interpret the results - guidance to facilitate discussions and meetings - tips for the workbook user - glossary of terminology AFTER THE PIP … WHAT IS NEXT? The result of the project preparation phase is a Priority Investment package (PIP). The next phase is the 2nd quarter of the planning cycle: ‘project appraisal’. The investment plan can be used to access potential external sources of financing and will then become focus of (pre)‐feasibility studies or the starting point for more detailed economic, environmental and social impact assessment. The final objective is to arrive at project packages that have an adequate level of detail to be adopted by financing agencies. Also in this project appraisal step CDIA can provide technical assistance.
Implementation
Monitoring & Evaluation
Identification
Operation & Maintenance
Implementation
Monitoring & Evaluation
Identification
Operation & Maintenance
loan appraisal
priority investment package
Project Appraisal
pre‐feasibility study
Project Preparation
impact assessment
feasibility study
loan agreement
firming agreement
Implementation
Monitoring & Evaluation
Identification
Operation & Maintenance
Implementation
Monitoring & Evaluation
Identification
Operation & Maintenance
loan appraisal loan appraisal loan appraisal
priority investment packagepriority investment package
Project Appraisal
pre‐feasibility study pre‐feasibility study
Project Preparation
impact assessment impact assessment
feasibility studyfeasibility study
loan agreement loan agreement
firming agreement firming agreement firming agreement
Project Programming & Prioritisation Toolkit 7
STEP 1 ANALYSIS FINANCIAL CAPACITY
‘Borrowing one’s future income to increase
purchasing power of one’s present’
Project Programming & Prioritisation Toolkit 8
STEP 1 ANALYSIS FINANCIAL CAPACITY
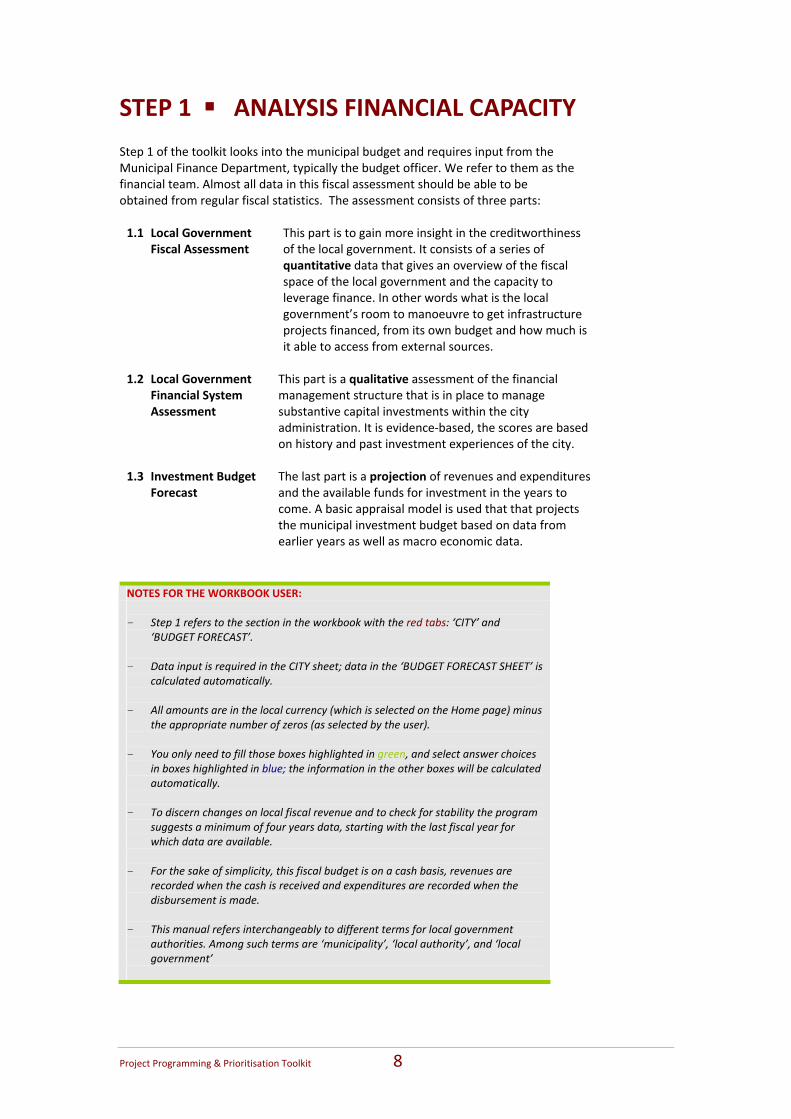
Step 1 of the toolkit looks into the municipal budget and requires input from the Municipal Finance Department, typically the budget officer. We refer to them as the financial team. Almost all data in this fiscal assessment should be able to be obtained from regular fiscal statistics. The assessment consists of three parts: 1.1 Local Government
Fiscal Assessment This part is to gain more insight in the creditworthiness of the local government. It consists of a series of quantitative data that gives an overview of the fiscal space of the local government and the capacity to leverage finance. In other words what is the local government’s room to manoeuvre to get infrastructure projects financed, from its own budget and how much is it able to access from external sources.
1.2 Local Government Financial System Assessment
This part is a qualitative assessment of the financial management structure that is in place to manage substantive capital investments within the city administration. It is evidence‐based, the scores are based on history and past investment experiences of the city.
1.3 Investment Budget Forecast
The last part is a projection of revenues and expenditures and the available funds for investment in the years to come. A basic appraisal model is used that that projects the municipal investment budget based on data from earlier years as well as macro economic data.
NOTES FOR THE WORKBOOK USER: - Step 1 refers to the section in the workbook with the red tabs: ‘CITY’ and
‘BUDGET FORECAST’. - Data input is required in the CITY sheet; data in the ‘BUDGET FORECAST SHEET’ is
calculated automatically. - All amounts are in the local currency (which is selected on the Home page) minus
the appropriate number of zeros (as selected by the user). - You only need to fill those boxes highlighted in green, and select answer choices
in boxes highlighted in blue; the information in the other boxes will be calculated automatically.
- To discern changes on local fiscal revenue and to check for stability the program
suggests a minimum of four years data, starting with the last fiscal year for which data are available.
- For the sake of simplicity, this fiscal budget is on a cash basis, revenues are
recorded when the cash is received and expenditures are recorded when the disbursement is made.
- This manual refers interchangeably to different terms for local government
authorities. Among such terms are ‘municipality’, ‘local authority’, and ‘local government’
Project Programming & Prioritisation Toolkit 9
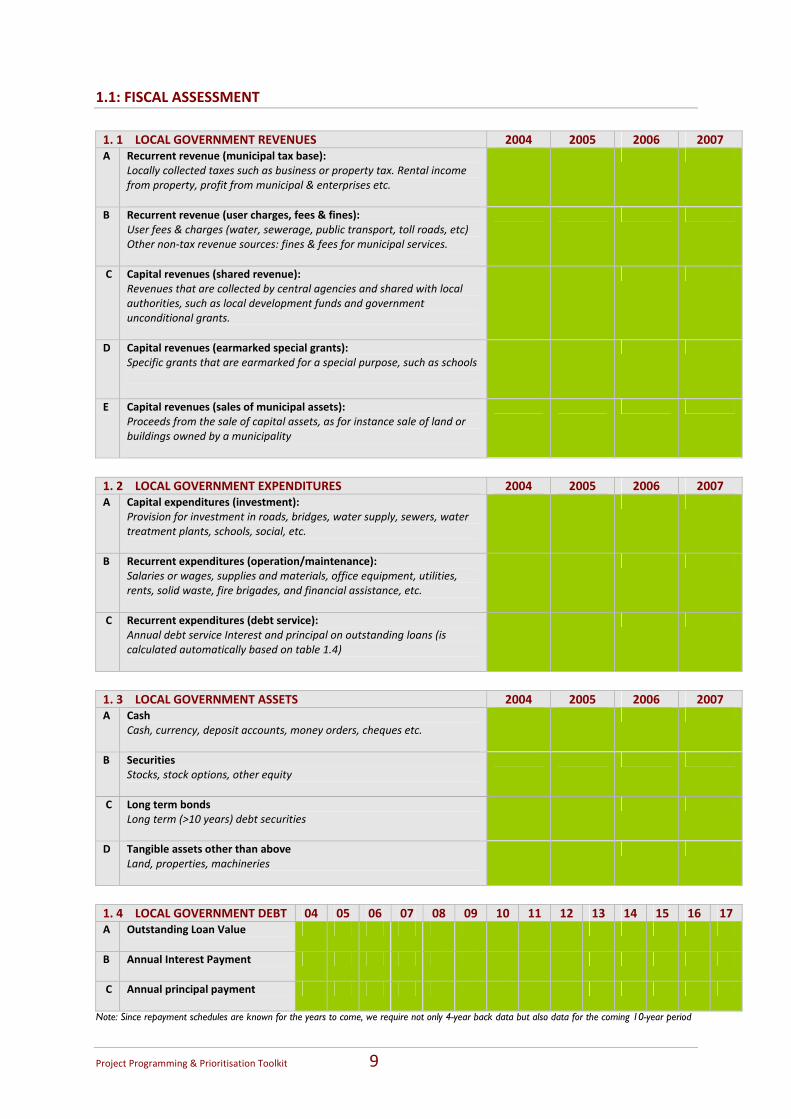
1.1: FISCAL ASSESSMENT
1. 1 LOCAL GOVERNMENT REVENUES 2004 2005 2006 2007 A Recurrent revenue (municipal tax base):
Locally collected taxes such as business or property tax. Rental income from property, profit from municipal & enterprises etc.
B Recurrent revenue (user charges, fees & fines): User fees & charges (water, sewerage, public transport, toll roads, etc) Other non‐tax revenue sources: fines & fees for municipal services.
C Capital revenues (shared revenue): Revenues that are collected by central agencies and shared with local authorities, such as local development funds and government unconditional grants.
D Capital revenues (earmarked special grants): Specific grants that are earmarked for a special purpose, such as schools
E Capital revenues (sales of municipal assets): Proceeds from the sale of capital assets, as for instance sale of land or buildings owned by a municipality
1. 2 LOCAL GOVERNMENT EXPENDITURES 2004 2005 2006 2007 A Capital expenditures (investment):
Provision for investment in roads, bridges, water supply, sewers, water treatment plants, schools, social, etc.
B Recurrent expenditures (operation/maintenance): Salaries or wages, supplies and materials, office equipment, utilities, rents, solid waste, fire brigades, and financial assistance, etc.
C Recurrent expenditures (debt service): Annual debt service Interest and principal on outstanding loans (is calculated automatically based on table 1.4)
1. 3 LOCAL GOVERNMENT ASSETS 2004 2005 2006 2007 A Cash
Cash, currency, deposit accounts, money orders, cheques etc.
B Securities Stocks, stock options, other equity
C Long term bonds Long term (>10 years) debt securities
D Tangible assets other than above Land, properties, machineries
1. 4 LOCAL GOVERNMENT DEBT 04 05 06 07 08 09 10 11 12 13 14 15 16 17 A Outstanding Loan Value
B Annual Interest Payment
C Annual principal payment
Note: Since repayment schedules are known for the years to come, we require not only 4-year back data but also data for the coming 10-year period
Project Programming & Prioritisation Toolkit 10
WHY ARE THESE DATA IMPORTANT? REVENUE Ideally a municipality must be able to carry the fiscal burden of an infrastructure loan from its regular stream of income. That is why the ratio of debt service to recurring revenues, or some variant of this measure, is one the most important financial ratios. The ratio is commonly used by credit‐rating agencies in assessing municipal credit risk, by municipalities in projecting their own debt capacity, and by national governments in establishing borrowing ceilings for local governments. The main distinction made here is between own source revenue (generated within the locality) and shared revenue (taxes that are collected by central agencies and shared with local authorities). It is important to know to what extent the local government collects their own revenues and what extent it relies on intergovernmental transfers and grants. Own sources are financial sources over which the municipality has most control. Further, in some countries local revenue sharing receipts are subject to central‐government discretion and can change from year to year.
EXPENDITURES Local governments have two main expenditure responsibilities. The first includes all operating and maintenance expenditures (i.e., recurrent expenditures) for existing municipal public goods and services, while the second refers to the capital outlays for the provision of new infrastructure (i.e., capital expenditures). The recurrent expenditure budget is concerned with the regular operation of services, including salaries, and the benefits for the employees, the purchase of short‐life equipment, the costs of routine repair and maintenance, and the servicing of long‐term debt. Capital expenditures are largely concerned with the creation of long‐term capital assets: economic or physical and social infrastructure.
ASSETS This category is relatively straightforward, it is important to have a list of local government assets to see what assets the local government has acquired over the years and if they could possibly be used as contribution into potential infrastructure projects
DEBT It is useful to know volume of outstanding loans over the past few years and the annual payments for principal and interest in the past but also in the years to come. This information is necessary to be able to make a good judgement on the potential debt service for future projects.
Project Programming & Prioritisation Toolkit 11
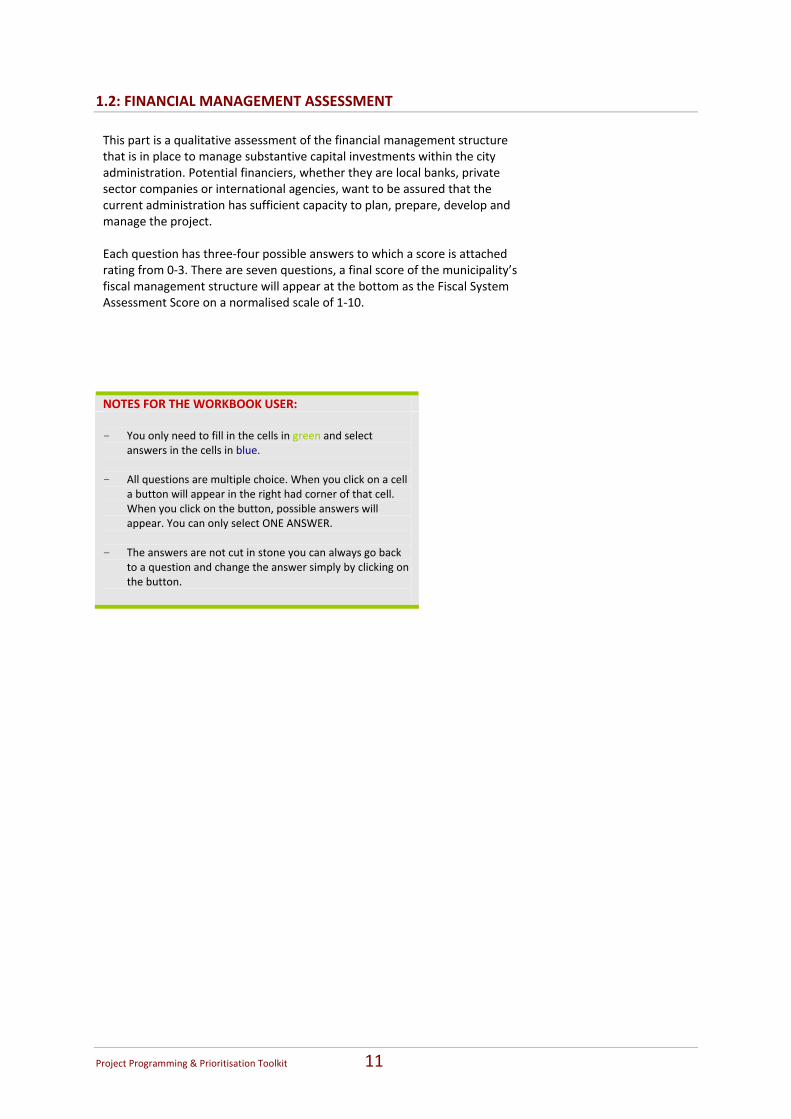
1.2: FINANCIAL MANAGEMENT ASSESSMENT This part is a qualitative assessment of the financial management structure that is in place to manage substantive capital investments within the city administration. Potential financiers, whether they are local banks, private sector companies or international agencies, want to be assured that the current administration has sufficient capacity to plan, prepare, develop and manage the project. Each question has three‐four possible answers to which a score is attached rating from 0‐3. There are seven questions, a final score of the municipality’s fiscal management structure will appear at the bottom as the Fiscal System Assessment Score on a normalised scale of 1‐10.
NOTES FOR THE WORKBOOK USER: - You only need to fill in the cells in green and select
answers in the cells in blue. - All questions are multiple choice. When you click on a cell
a button will appear in the right had corner of that cell. When you click on the button, possible answers will appear. You can only select ONE ANSWER.
- The answers are not cut in stone you can always go back
to a question and change the answer simply by clicking on the button.
Project Programming & Prioritisation Toolkit 12
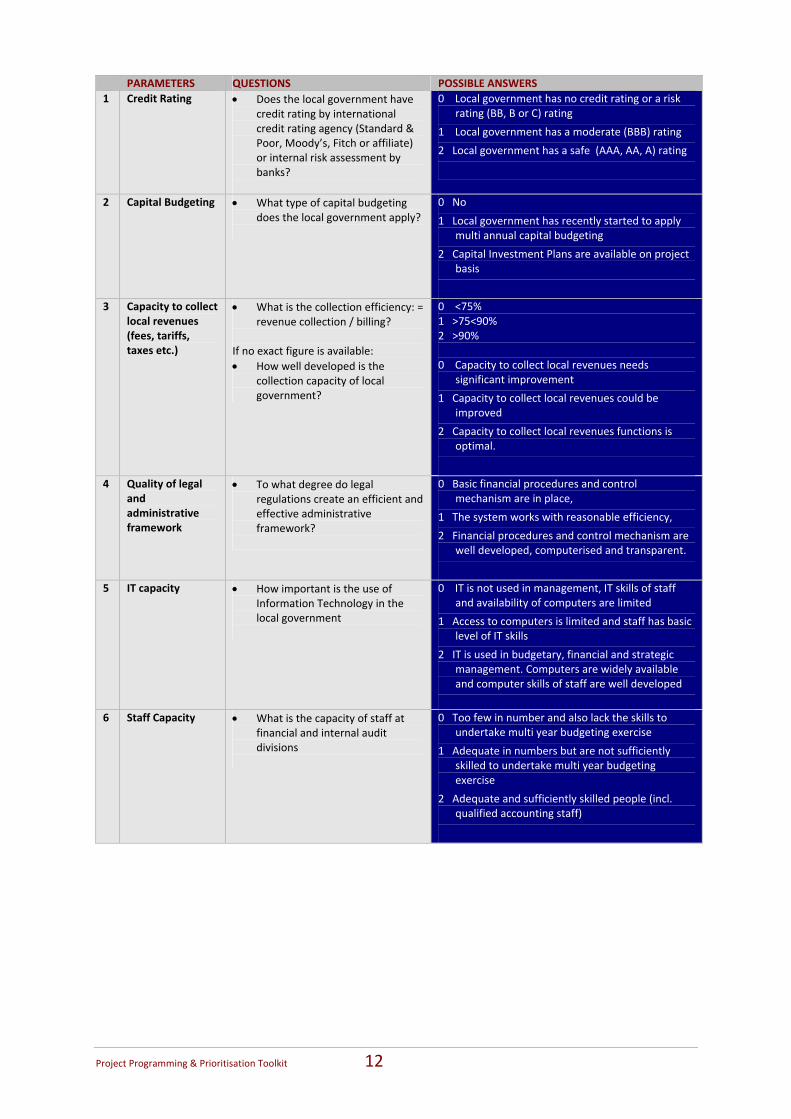
PARAMETERS QUESTIONS POSSIBLE ANSWERS 1 Credit Rating • Does the local government have
credit rating by international credit rating agency (Standard & Poor, Moody’s, Fitch or affiliate) or internal risk assessment by banks?
0 Local government has no credit rating or a risk rating (BB, B or C) rating
1 Local government has a moderate (BBB) rating
2 Local government has a safe (AAA, AA, A) rating
2 Capital Budgeting • What type of capital budgeting does the local government apply?
0 No
1 Local government has recently started to apply multi annual capital budgeting
2 Capital Investment Plans are available on project basis
3 Capacity to collect local revenues (fees, tariffs, taxes etc.)
• What is the collection efficiency: = revenue collection / billing?
If no exact figure is available: • How well developed is the
collection capacity of local government?
0 <75% 1 >75<90% 2 >90% 0 Capacity to collect local revenues needs
significant improvement
1 Capacity to collect local revenues could be improved
2 Capacity to collect local revenues functions is optimal.
4 Quality of legal and administrative framework
• To what degree do legal regulations create an efficient and effective administrative framework?
0 Basic financial procedures and control mechanism are in place,
1 The system works with reasonable efficiency,
2 Financial procedures and control mechanism are well developed, computerised and transparent.
5 IT capacity • How important is the use of Information Technology in the local government
0 IT is not used in management, IT skills of staff and availability of computers are limited
1 Access to computers is limited and staff has basic level of IT skills
2 IT is used in budgetary, financial and strategic management. Computers are widely available and computer skills of staff are well developed
6 Staff Capacity • What is the capacity of staff at
financial and internal audit divisions
0 Too few in number and also lack the skills to undertake multi year budgeting exercise
1 Adequate in numbers but are not sufficiently skilled to undertake multi year budgeting exercise
2 Adequate and sufficiently skilled people (incl. qualified accounting staff)
Project Programming & Prioritisation Toolkit 13
1.3: INVESTMENT BUDGET FORECAST The toolkit assists in making a projection of revenues and expenditures and the available funds for ongoing and future investment. The excel workbook includes a simple forecasting model that uses the fiscal data of the municipality plus a set of macro economic country data as a starting point to project the municipal investment budget for the next five years. This is not a detailed and precise projection, but rather a quick estimation to give an idea of the financial condition of the municipality, its investment budget and debt carrying capacity. The main purpose of the financial forecast is to have a basis for the funding allocations in the 5‐year investment plan that will be developed in step 3. The toolkit helps to determine optional ad optimal project financing alternatives and to define the impact of financial decisions on future budgets.
DATASET The dataset needed for the calculation comes from 2.1: the historical statements of budget execution for the past 3‐4 years taking into consideration different sources of revenue and expenditures. The reason for dividing these into separate categories is because projection is developed individually for each category, as each has its own rules of the game. For example, with economic growth in the city the income in property tax is likely to increase while income from legal fees that have to be paid for passport renewal will not be impacted.
PRINCIPLES FOR PROJECTION The projection is calculated for the next eight years. Though longer reliable projections may be useful for the municipality, this model is designed for quick medium term assessments” Each category of revenue and expenditure is analysed with respect to the trend in the historical period, these trends are extrapolated for the next year and then projections are made for the future years on the basis of national macro economic data and growth parameters specific to the local conditions.
ASSUMPTIONS There is a series of assumption that lay the foundation for the projections. For every source a separate set of assumptions has been developed. These assumptions result in a default projection. However, all data in the assumptions section can be changed manually, and in fact we encourage the users to have a look at these data, check for accuracy, update if necessary and possibly adjusted to reflect local conditions before commencing the forecasting exercise. The assumptions can be found in tables 2.1 – 2.8 of the excel workbook sheet ‘BUDGET FORECAST’. Also see p. 16‐17 of this manual
Project Programming & Prioritisation Toolkit 14
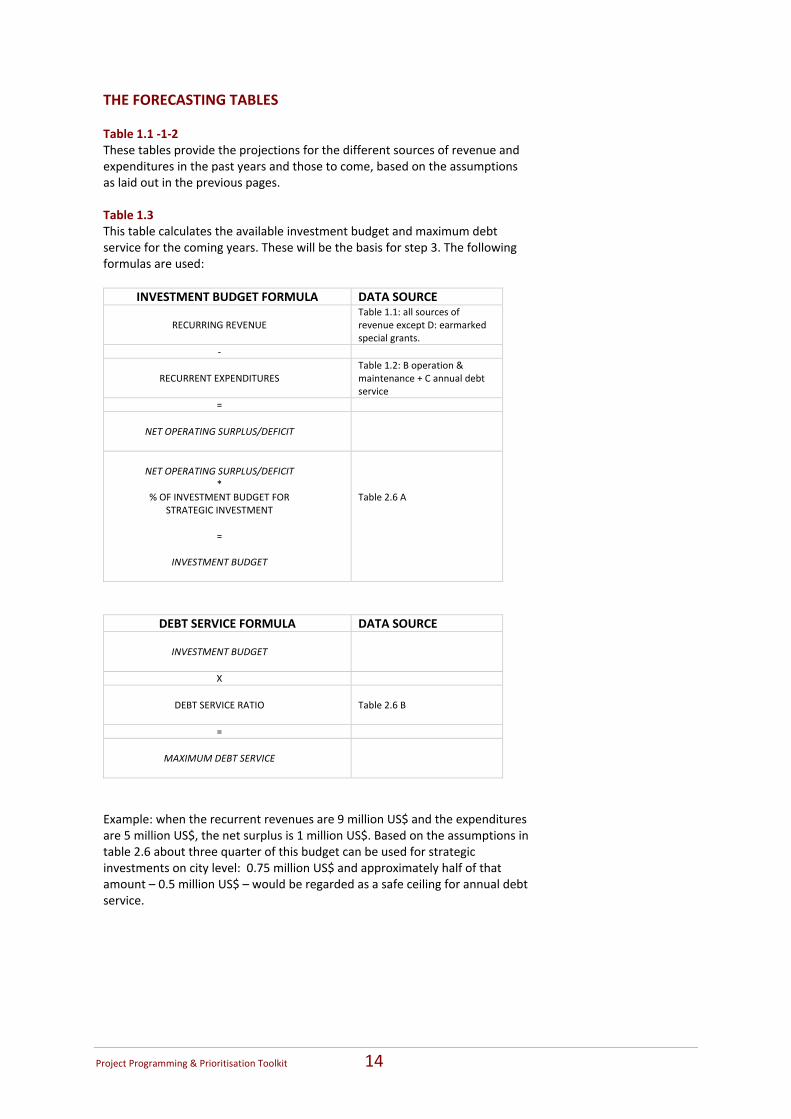
THE FORECASTING TABLES Table 1.1 ‐1‐2 These tables provide the projections for the different sources of revenue and expenditures in the past years and those to come, based on the assumptions as laid out in the previous pages. Table 1.3 This table calculates the available investment budget and maximum debt service for the coming years. These will be the basis for step 3. The following formulas are used:
INVESTMENT BUDGET FORMULA DATA SOURCE
RECURRING REVENUE Table 1.1: all sources of revenue except D: earmarked special grants.
‐
RECURRENT EXPENDITURES
Table 1.2: B operation & maintenance + C annual debt service
=
NET OPERATING SURPLUS/DEFICIT
NET OPERATING SURPLUS/DEFICIT
* % OF INVESTMENT BUDGET FOR
STRATEGIC INVESTMENT =
INVESTMENT BUDGET
Table 2.6 A
DEBT SERVICE FORMULA DATA SOURCE
INVESTMENT BUDGET
X
DEBT SERVICE RATIO
Table 2.6 B
=
MAXIMUM DEBT SERVICE
Example: when the recurrent revenues are 9 million US$ and the expenditures are 5 million US$, the net surplus is 1 million US$. Based on the assumptions in table 2.6 about three quarter of this budget can be used for strategic investments on city level: 0.75 million US$ and approximately half of that amount – 0.5 million US$ – would be regarded as a safe ceiling for annual debt service.
Project Programming & Prioritisation Toolkit 15
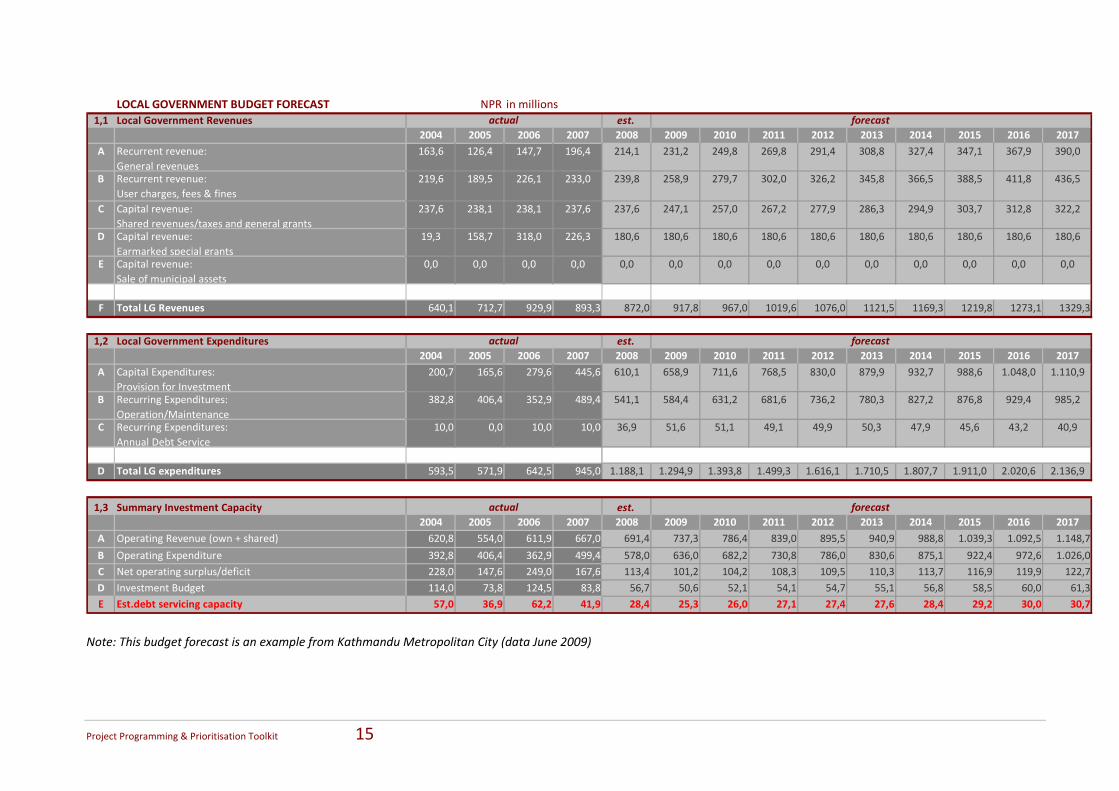
LOCAL GOVERNMENT BUDGET FORECAST in millions1,1 Local Government Revenues est.
2004 2005 2006 2007 2008 2009 2010 2011 2012 2013 2014 2015 2016 2017A Recurrent revenue:
General revenues 163,6 126,4 147,7 196,4 214,1 231,2 249,8 269,8 291,4 308,8 327,4 347,1 367,9 390,0
B Recurrent revenue:User charges, fees & fines
219,6 189,5 226,1 233,0 239,8 258,9 279,7 302,0 326,2 345,8 366,5 388,5 411,8 436,5
C Capital revenue:Shared revenues/taxes and general grants
237,6 238,1 238,1 237,6 237,6 247,1 257,0 267,2 277,9 286,3 294,9 303,7 312,8 322,2
D Capital revenue:Earmarked special grants
19,3 158,7 318,0 226,3 180,6 180,6 180,6 180,6 180,6 180,6 180,6 180,6 180,6 180,6
E Capital revenue:Sale of municipal assets
0,0 0,0 0,0 0,0 0,0 0,0 0,0 0,0 0,0 0,0 0,0 0,0 0,0 0,0
F Total LG Revenues 640,1 712,7 929,9 893,3 872,0 917,8 967,0 1019,6 1076,0 1121,5 1169,3 1219,8 1273,1 1329,3
1,2 Local Government Expenditures est.2004 2005 2006 2007 2008 2009 2010 2011 2012 2013 2014 2015 2016 2017
A Capital Expenditures:Provision for Investment
200,7 165,6 279,6 445,6 610,1 658,9 711,6 768,5 830,0 879,9 932,7 988,6 1.048,0 1.110,9
B Recurring Expenditures:Operation/Maintenance
382,8 406,4 352,9 489,4 541,1 584,4 631,2 681,6 736,2 780,3 827,2 876,8 929,4 985,2
C Recurring Expenditures:Annual Debt Service
10,0 0,0 10,0 10,0 36,9 51,6 51,1 49,1 49,9 50,3 47,9 45,6 43,2 40,9
D Total LG expenditures 593,5 571,9 642,5 945,0 1.188,1 1.294,9 1.393,8 1.499,3 1.616,1 1.710,5 1.807,7 1.911,0 2.020,6 2.136,9
1,3 Summary Investment Capacity est.2004 2005 2006 2007 2008 2009 2010 2011 2012 2013 2014 2015 2016 2017
A Operating Revenue (own + shared) 620,8 554,0 611,9 667,0 691,4 737,3 786,4 839,0 895,5 940,9 988,8 1.039,3 1.092,5 1.148,7
B Operating Expenditure 392,8 406,4 362,9 499,4 578,0 636,0 682,2 730,8 786,0 830,6 875,1 922,4 972,6 1.026,0C Net operating surplus/deficit 228,0 147,6 249,0 167,6 113,4 101,2 104,2 108,3 109,5 110,3 113,7 116,9 119,9 122,7
D Investment Budget 114,0 73,8 124,5 83,8 56,7 50,6 52,1 54,1 54,7 55,1 56,8 58,5 60,0 61,3E Est.debt servicing capacity 57,0 36,9 62,2 41,9 28,4 25,3 26,0 27,1 27,4 27,6 28,4 29,2 30,0 30,7
forecast
forecast
actual
NPRactual
actual
forecast
Note: This budget forecast is an example from Kathmandu Metropolitan City (data June 2009)
Project Programming & Prioritisation Toolkit 16
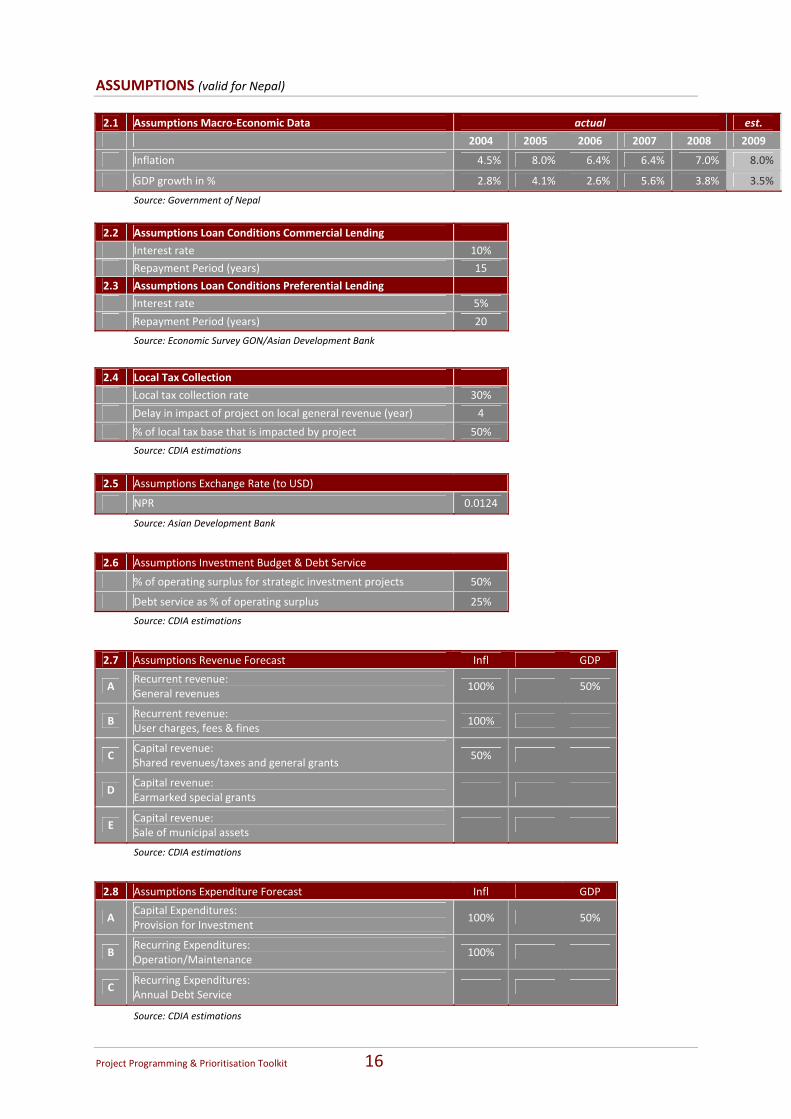
ASSUMPTIONS (valid for Nepal) 2.1 Assumptions Macro‐Economic Data actual est.
2004 2005 2006 2007 2008 2009
Inflation 4.5% 8.0% 6.4% 6.4% 7.0% 8.0%
GDP growth in % 2.8% 4.1% 2.6% 5.6% 3.8% 3.5%
Source: Government of Nepal
2.2 Assumptions Loan Conditions Commercial Lending
Interest rate 10%
Repayment Period (years) 15
2.3 Assumptions Loan Conditions Preferential Lending
Interest rate 5%
Repayment Period (years) 20
Source: Economic Survey GON/Asian Development Bank
2.4 Local Tax Collection
Local tax collection rate 30%
Delay in impact of project on local general revenue (year) 4
% of local tax base that is impacted by project 50%
Source: CDIA estimations
2.5 Assumptions Exchange Rate (to USD)
NPR 0.0124
Source: Asian Development Bank
2.6 Assumptions Investment Budget & Debt Service
% of operating surplus for strategic investment projects 50%
Debt service as % of operating surplus 25%
Source: CDIA estimations
2.7 Assumptions Revenue Forecast Infl GDP
A Recurrent revenue: General revenues
100% 50%
B Recurrent revenue: User charges, fees & fines
100%
C Capital revenue: Shared revenues/taxes and general grants
50%
D Capital revenue: Earmarked special grants
E Capital revenue: Sale of municipal assets
Source: CDIA estimations
2.8 Assumptions Expenditure Forecast Infl GDP
A Capital Expenditures: Provision for Investment
100% 50%
B Recurring Expenditures: Operation/Maintenance
100%
C Recurring Expenditures: Annual Debt Service
Source: CDIA estimations
Project Programming & Prioritisation Toolkit 17
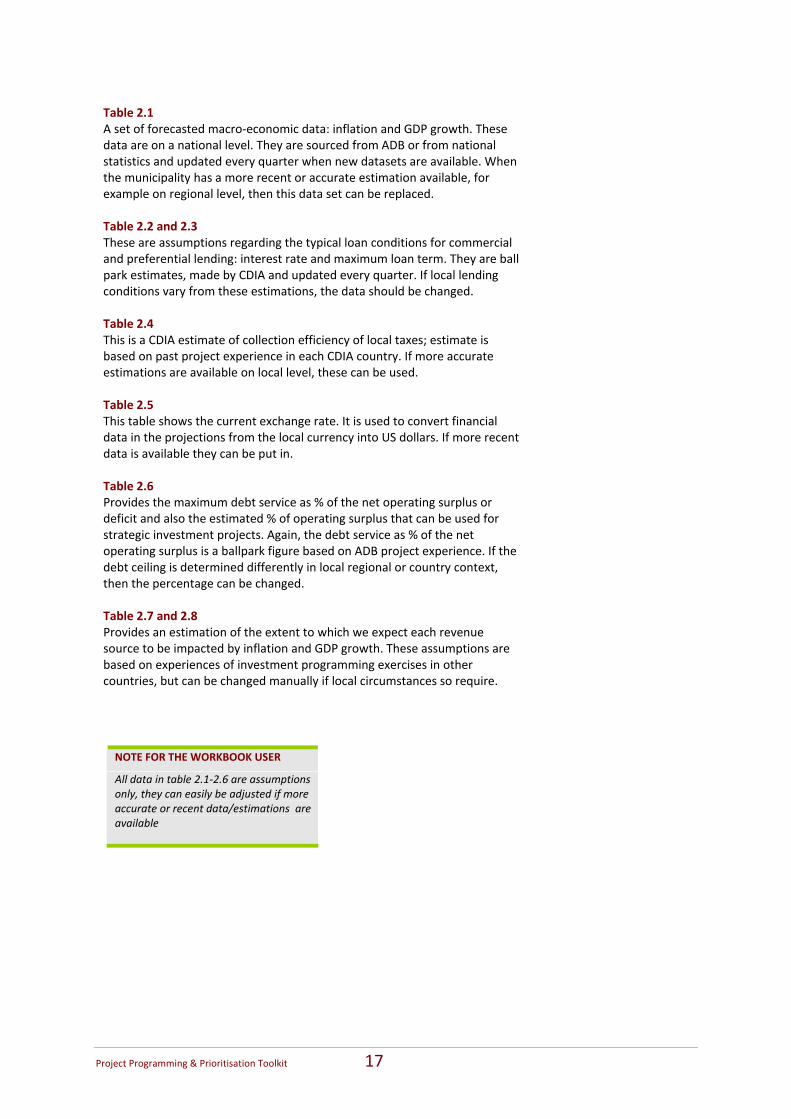
Table 2.1 A set of forecasted macro‐economic data: inflation and GDP growth. These data are on a national level. They are sourced from ADB or from national statistics and updated every quarter when new datasets are available. When the municipality has a more recent or accurate estimation available, for example on regional level, then this data set can be replaced. Table 2.2 and 2.3 These are assumptions regarding the typical loan conditions for commercial and preferential lending: interest rate and maximum loan term. They are ball park estimates, made by CDIA and updated every quarter. If local lending conditions vary from these estimations, the data should be changed. Table 2.4 This is a CDIA estimate of collection efficiency of local taxes; estimate is based on past project experience in each CDIA country. If more accurate estimations are available on local level, these can be used. Table 2.5 This table shows the current exchange rate. It is used to convert financial data in the projections from the local currency into US dollars. If more recent data is available they can be put in. Table 2.6 Provides the maximum debt service as % of the net operating surplus or deficit and also the estimated % of operating surplus that can be used for strategic investment projects. Again, the debt service as % of the net operating surplus is a ballpark figure based on ADB project experience. If the debt ceiling is determined differently in local regional or country context, then the percentage can be changed. Table 2.7 and 2.8 Provides an estimation of the extent to which we expect each revenue source to be impacted by inflation and GDP growth. These assumptions are based on experiences of investment programming exercises in other countries, but can be changed manually if local circumstances so require.
NOTE FOR THE WORKBOOK USER
All data in table 2.1‐2.6 are assumptions only, they can easily be adjusted if more accurate or recent data/estimations are available
Project Programming & Prioritisation Toolkit 18
STEP 2 PROJECT
PRIORITISATION
‘The reason most major goals are
not achieved is that we spend our
time doing second things first’.
Project Programming & Prioritisation Toolkit 19
STEP 2 PROJECT PRIORITISATION
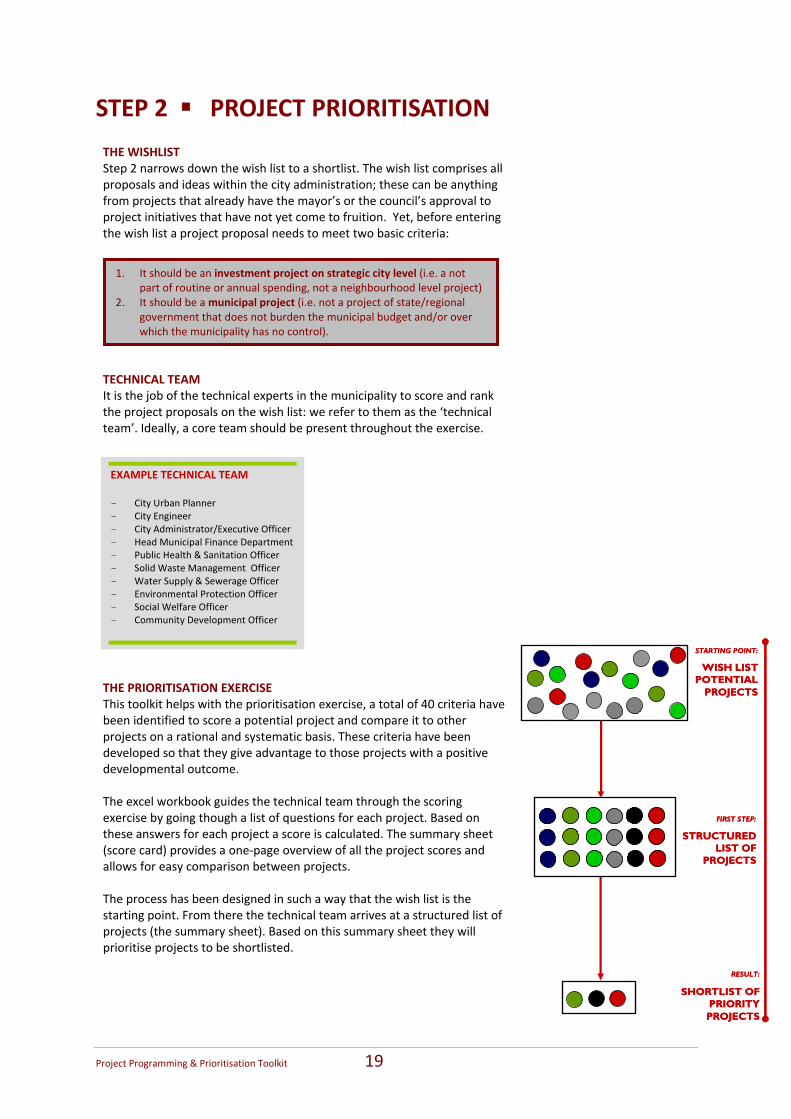
THE WISHLIST Step 2 narrows down the wish list to a shortlist. The wish list comprises all proposals and ideas within the city administration; these can be anything from projects that already have the mayor’s or the council’s approval to project initiatives that have not yet come to fruition. Yet, before entering the wish list a project proposal needs to meet two basic criteria: TECHNICAL TEAM It is the job of the technical experts in the municipality to score and rank the project proposals on the wish list: we refer to them as the ‘technical team’. Ideally, a core team should be present throughout the exercise. THE PRIORITISATION EXERCISE This toolkit helps with the prioritisation exercise, a total of 40 criteria have been identified to score a potential project and compare it to other projects on a rational and systematic basis. These criteria have been developed so that they give advantage to those projects with a positive developmental outcome. The excel workbook guides the technical team through the scoring exercise by going though a list of questions for each project. Based on these answers for each project a score is calculated. The summary sheet (score card) provides a one‐page overview of all the project scores and allows for easy comparison between projects. The process has been designed in such a way that the wish list is the starting point. From there the technical team arrives at a structured list of projects (the summary sheet). Based on this summary sheet they will prioritise projects to be shortlisted.
1. It should be an investment project on strategic city level (i.e. a not part of routine or annual spending, not a neighbourhood level project)
2. It should be a municipal project (i.e. not a project of state/regional government that does not burden the municipal budget and/or over which the municipality has no control).
EXAMPLE TECHNICAL TEAM - City Urban Planner - City Engineer - City Administrator/Executive Officer - Head Municipal Finance Department - Public Health & Sanitation Officer - Solid Waste Management Officer - Water Supply & Sewerage Officer - Environmental Protection Officer - Social Welfare Officer - Community Development Officer
RESULT:
SHORTLIST OF PRIORITY
PROJECTS
STARTING POINT:
WISH LIST POTENTIAL
PROJECTS
FIRST STEP:
STRUCTURED LIST OF
PROJECTS
RESULT:
SHORTLIST OF PRIORITY
PROJECTS
STARTING POINT:
WISH LIST POTENTIAL
PROJECTS
FIRST STEP:
STRUCTURED LIST OF
PROJECTS
Project Programming & Prioritisation Toolkit 20
PRIORITISING: THE SCORING METHODOLOGY In total there are 40 questions that need to be answered for each project. To highlight different aspects of the projects, these questions have been grouped under five indices. 1. Project Purpose 2. Public Response 3. Environmental Impact 4. Socio‐Economic Impact 5. Feasibility of Implementation Each question has up to five possible answers to which a score is attached on a scale of zero to three. For some questions it is also possible to have negative score with a maximum of ‐2. The workbook has been programmed so that based on the answers to the individual questions a score for each index is automatically calculated. To arrive at an index score the individual scores are added up to a total which is then normalised on a scale of ‐5 ‐ 10. The higher the score the better the developmental quality of the project. The table on the next page gives an idea of the number of questions and the points that can be earned for each index. The five scores are added up to a total score, which is used to rank the projects in a summary sheet. In this final score each index carries an equal weight: 2 points. This means that a project can score a maximum of 10 points.
NOTES FOR THE WORKBOOK USER: - A separate sheet will be created for each project. This will be done simply by
clicking on the ‘CREATE NEW PROJECT’ button. There is no maximum to the number of projects you can create
- You can refer to ‘Example Project’ as an example of what a filled in project
sheet looks like - In the sheet you only need to fill those boxes highlighted in blue and green; the
information in the other boxes will be calculated automatically. - All blue questions are multiple choice. When you click on a cell a button will
appear in the right had corner of the cell. When you click on the button, possible answers will appear. You can only select ONE ANSWER.
- The green cells (section 2) require manual input (not multiple choice). All
amounts are in local currency. - The answers are not cut in stone. Individual project sheets will be saved. If you
feel uncomfortable with the final outcome, you can always go back to the project sheet to change data. You can always go back to a question and change the answer simply by clicking on the button.
Project Programming & Prioritisation Toolkit 21
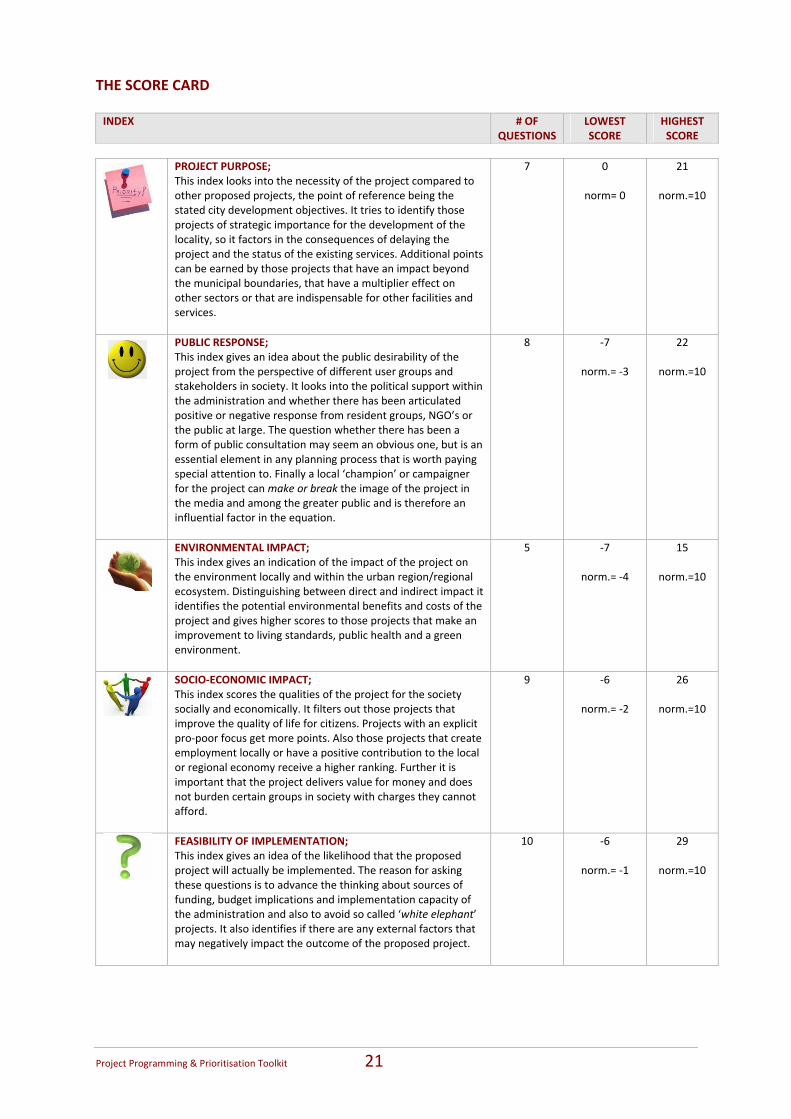
THE SCORE CARD INDEX # OF
QUESTIONS LOWEST SCORE
HIGHEST SCORE
PROJECT PURPOSE;
This index looks into the necessity of the project compared to other proposed projects, the point of reference being the stated city development objectives. It tries to identify those projects of strategic importance for the development of the locality, so it factors in the consequences of delaying the project and the status of the existing services. Additional points can be earned by those projects that have an impact beyond the municipal boundaries, that have a multiplier effect on other sectors or that are indispensable for other facilities and services.
7 0
norm= 0
21
norm.=10
PUBLIC RESPONSE; This index gives an idea about the public desirability of the project from the perspective of different user groups and stakeholders in society. It looks into the political support within the administration and whether there has been articulated positive or negative response from resident groups, NGO’s or the public at large. The question whether there has been a form of public consultation may seem an obvious one, but is an essential element in any planning process that is worth paying special attention to. Finally a local ‘champion’ or campaigner for the project can make or break the image of the project in the media and among the greater public and is therefore an influential factor in the equation.
8 ‐7
norm.= ‐3
22
norm.=10
ENVIRONMENTAL IMPACT; This index gives an indication of the impact of the project on the environment locally and within the urban region/regional ecosystem. Distinguishing between direct and indirect impact it identifies the potential environmental benefits and costs of the project and gives higher scores to those projects that make an improvement to living standards, public health and a green environment.
5 ‐7
norm.= ‐4
15
norm.=10
SOCIO‐ECONOMIC IMPACT; This index scores the qualities of the project for the society socially and economically. It filters out those projects that improve the quality of life for citizens. Projects with an explicit pro‐poor focus get more points. Also those projects that create employment locally or have a positive contribution to the local or regional economy receive a higher ranking. Further it is important that the project delivers value for money and does not burden certain groups in society with charges they cannot afford.
9 ‐6
norm.= ‐2
26
norm.=10
FEASIBILITY OF IMPLEMENTATION; This index gives an idea of the likelihood that the proposed project will actually be implemented. The reason for asking these questions is to advance the thinking about sources of funding, budget implications and implementation capacity of the administration and also to avoid so called ‘white elephant’ projects. It also identifies if there are any external factors that may negatively impact the outcome of the proposed project.
10 ‐6
norm.= ‐1
29
norm.=10
Project Programming & Prioritisation Toolkit 22
BUILT‐IN SCENARIOS
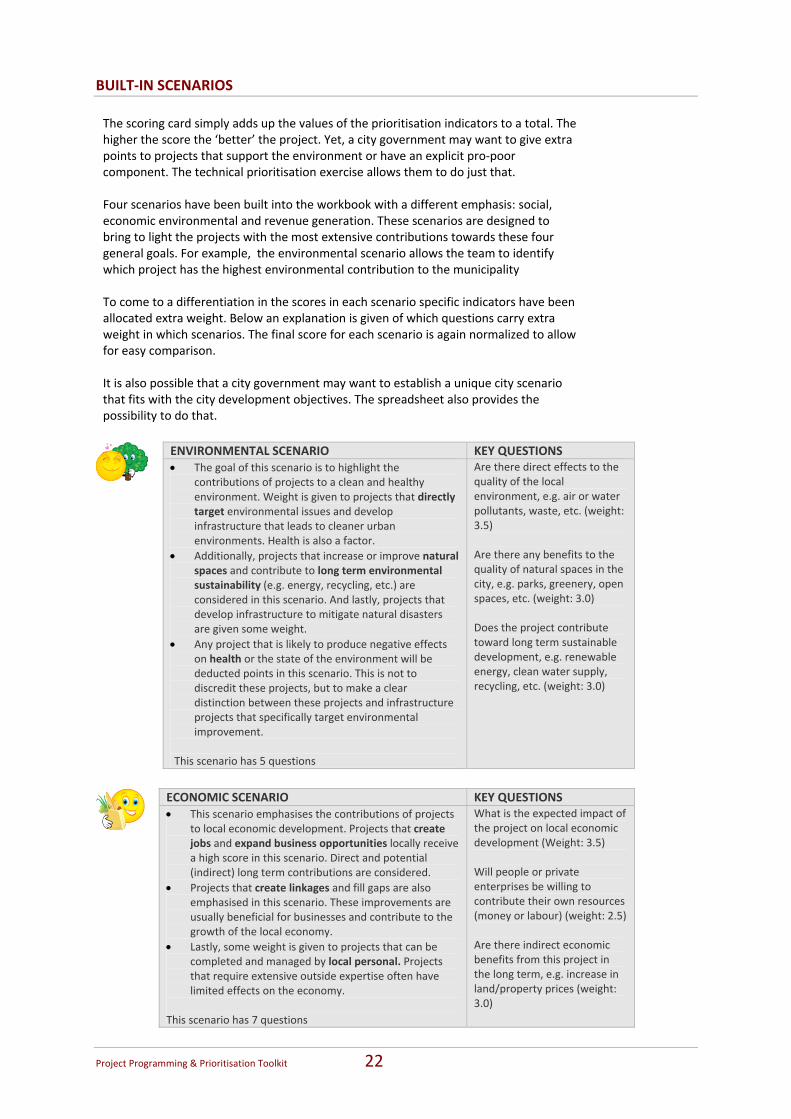
ENVIRONMENTAL SCENARIO KEY QUESTIONS
• The goal of this scenario is to highlight the
contributions of projects to a clean and healthy environment. Weight is given to projects that directly target environmental issues and develop infrastructure that leads to cleaner urban environments. Health is also a factor.
• Additionally, projects that increase or improve natural spaces and contribute to long term environmental sustainability (e.g. energy, recycling, etc.) are considered in this scenario. And lastly, projects that develop infrastructure to mitigate natural disasters are given some weight.
• Any project that is likely to produce negative effects on health or the state of the environment will be deducted points in this scenario. This is not to discredit these projects, but to make a clear distinction between these projects and infrastructure projects that specifically target environmental improvement.
This scenario has 5 questions
Are there direct effects to the quality of the local environment, e.g. air or water pollutants, waste, etc. (weight: 3.5) Are there any benefits to the quality of natural spaces in the city, e.g. parks, greenery, open spaces, etc. (weight: 3.0) Does the project contribute toward long term sustainable development, e.g. renewable energy, clean water supply, recycling, etc. (weight: 3.0)
ECONOMIC SCENARIO KEY QUESTIONS
• This scenario emphasises the contributions of projects
to local economic development. Projects that create jobs and expand business opportunities locally receive a high score in this scenario. Direct and potential (indirect) long term contributions are considered.
• Projects that create linkages and fill gaps are also emphasised in this scenario. These improvements are usually beneficial for businesses and contribute to the growth of the local economy.
• Lastly, some weight is given to projects that can be completed and managed by local personal. Projects that require extensive outside expertise often have limited effects on the economy.
This scenario has 7 questions
What is the expected impact of the project on local economic development (Weight: 3.5) Will people or private enterprises be willing to contribute their own resources (money or labour) (weight: 2.5) Are there indirect economic benefits from this project in the long term, e.g. increase in land/property prices (weight: 3.0)
The scoring card simply adds up the values of the prioritisation indicators to a total. The higher the score the ‘better’ the project. Yet, a city government may want to give extra points to projects that support the environment or have an explicit pro‐poor component. The technical prioritisation exercise allows them to do just that. Four scenarios have been built into the workbook with a different emphasis: social, economic environmental and revenue generation. These scenarios are designed to bring to light the projects with the most extensive contributions towards these four general goals. For example, the environmental scenario allows the team to identify which project has the highest environmental contribution to the municipality To come to a differentiation in the scores in each scenario specific indicators have been allocated extra weight. Below an explanation is given of which questions carry extra weight in which scenarios. The final score for each scenario is again normalized to allow for easy comparison. It is also possible that a city government may want to establish a unique city scenario that fits with the city development objectives. The spreadsheet also provides the possibility to do that.
Project Programming & Prioritisation Toolkit 23
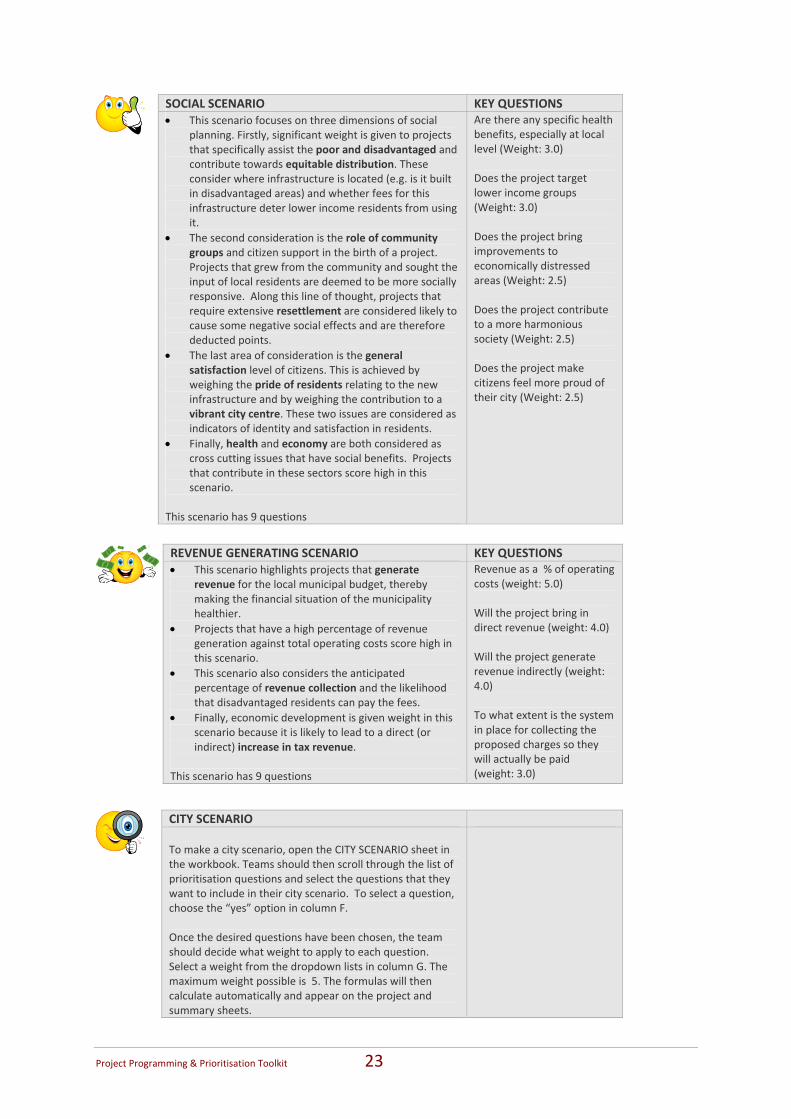
SOCIAL SCENARIO KEY QUESTIONS
• This scenario focuses on three dimensions of social
planning. Firstly, significant weight is given to projects that specifically assist the poor and disadvantaged and contribute towards equitable distribution. These consider where infrastructure is located (e.g. is it built in disadvantaged areas) and whether fees for this infrastructure deter lower income residents from using it.
• The second consideration is the role of community groups and citizen support in the birth of a project. Projects that grew from the community and sought the input of local residents are deemed to be more socially responsive. Along this line of thought, projects that require extensive resettlement are considered likely to cause some negative social effects and are therefore deducted points.
• The last area of consideration is the general satisfaction level of citizens. This is achieved by weighing the pride of residents relating to the new infrastructure and by weighing the contribution to a vibrant city centre. These two issues are considered as indicators of identity and satisfaction in residents.
• Finally, health and economy are both considered as cross cutting issues that have social benefits. Projects that contribute in these sectors score high in this scenario.
This scenario has 9 questions
Are there any specific health benefits, especially at local level (Weight: 3.0) Does the project target lower income groups (Weight: 3.0) Does the project bring improvements to economically distressed areas (Weight: 2.5) Does the project contribute to a more harmonious society (Weight: 2.5) Does the project make citizens feel more proud of their city (Weight: 2.5)
REVENUE GENERATING SCENARIO KEY QUESTIONS
• This scenario highlights projects that generate revenue for the local municipal budget, thereby making the financial situation of the municipality healthier.
• Projects that have a high percentage of revenue generation against total operating costs score high in this scenario.
• This scenario also considers the anticipated percentage of revenue collection and the likelihood that disadvantaged residents can pay the fees.
• Finally, economic development is given weight in this scenario because it is likely to lead to a direct (or indirect) increase in tax revenue.
This scenario has 9 questions
Revenue as a % of operating costs (weight: 5.0) Will the project bring in direct revenue (weight: 4.0) Will the project generate revenue indirectly (weight: 4.0) To what extent is the system in place for collecting the proposed charges so they will actually be paid (weight: 3.0)
CITY SCENARIO
To make a city scenario, open the CITY SCENARIO sheet in the workbook. Teams should then scroll through the list of prioritisation questions and select the questions that they want to include in their city scenario. To select a question, choose the “yes” option in column F. Once the desired questions have been chosen, the team should decide what weight to apply to each question. Select a weight from the dropdown lists in column G. The maximum weight possible is 5. The formulas will then calculate automatically and appear on the project and summary sheets.
Project Programming & Prioritisation Toolkit 24
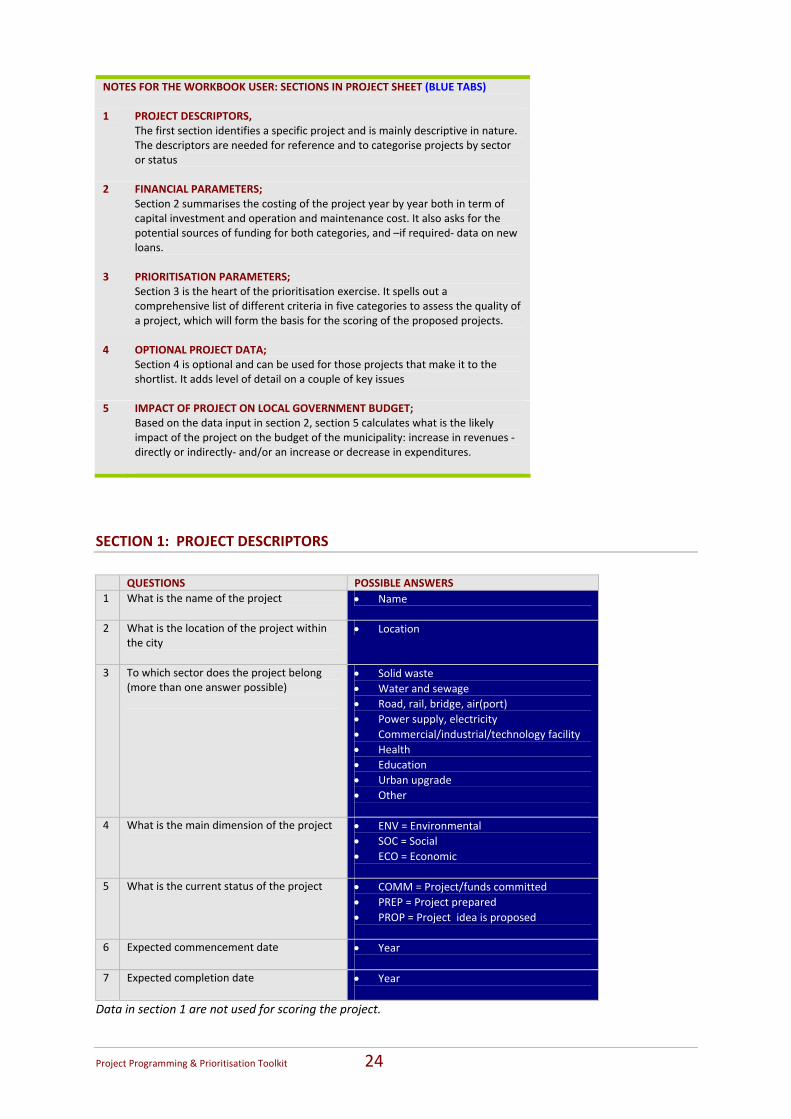
SECTION 1: PROJECT DESCRIPTORS
QUESTIONS POSSIBLE ANSWERS 1 What is the name of the project
• Name
2 What is the location of the project within the city
• Location
3 To which sector does the project belong (more than one answer possible)
• Solid waste • Water and sewage • Road, rail, bridge, air(port) • Power supply, electricity • Commercial/industrial/technology facility • Health • Education • Urban upgrade • Other
4 What is the main dimension of the project
• ENV = Environmental • SOC = Social • ECO = Economic
5 What is the current status of the project • COMM = Project/funds committed • PREP = Project prepared • PROP = Project idea is proposed
6 Expected commencement date • Year
7 Expected completion date • Year
Data in section 1 are not used for scoring the project.
NOTES FOR THE WORKBOOK USER: SECTIONS IN PROJECT SHEET (BLUE TABS) 1 PROJECT DESCRIPTORS,
The first section identifies a specific project and is mainly descriptive in nature. The descriptors are needed for reference and to categorise projects by sector or status
2 FINANCIAL PARAMETERS; Section 2 summarises the costing of the project year by year both in term of capital investment and operation and maintenance cost. It also asks for the potential sources of funding for both categories, and –if required‐ data on new loans.
3 PRIORITISATION PARAMETERS; Section 3 is the heart of the prioritisation exercise. It spells out a comprehensive list of different criteria in five categories to assess the quality of a project, which will form the basis for the scoring of the proposed projects.
4 OPTIONAL PROJECT DATA; Section 4 is optional and can be used for those projects that make it to the shortlist. It adds level of detail on a couple of key issues
5 IMPACT OF PROJECT ON LOCAL GOVERNMENT BUDGET; Based on the data input in section 2, section 5 calculates what is the likely impact of the project on the budget of the municipality: increase in revenues ‐directly or indirectly‐ and/or an increase or decrease in expenditures.
Project Programming & Prioritisation Toolkit 25
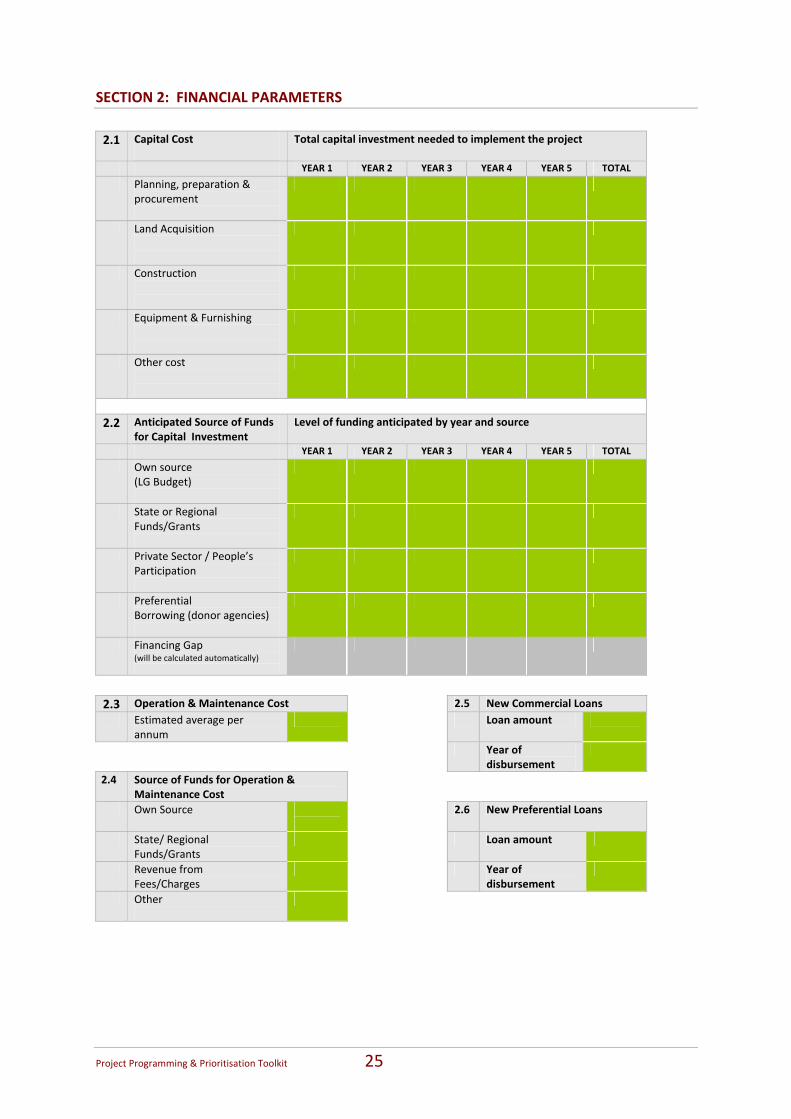
SECTION 2: FINANCIAL PARAMETERS
2.1 Capital Cost
Total capital investment needed to implement the project
YEAR 1 YEAR 2 YEAR 3 YEAR 4 YEAR 5 TOTAL
Planning, preparation & procurement
Land Acquisition
Construction
Equipment & Furnishing
Other cost
2.2 Anticipated Source of Funds
for Capital Investment Level of funding anticipated by year and source
YEAR 1 YEAR 2 YEAR 3 YEAR 4 YEAR 5 TOTAL
Own source (LG Budget)
State or Regional Funds/Grants
Private Sector / People’s Participation
Preferential Borrowing (donor agencies)
Financing Gap (will be calculated automatically)
2.3 Operation & Maintenance Cost 2.5 New Commercial Loans Estimated average per
annum Loan amount
Year of disbursement
2.4 Source of Funds for Operation & Maintenance Cost
Own Source
2.6 New Preferential Loans
State/ Regional Funds/Grants
Loan amount
Revenue from Fees/Charges
Year of disbursement
Other
Project Programming & Prioritisation Toolkit 26
WHY ARE THESE DATA IMPORTANT? This section assesses to what level of detail the proposing agency has done its financial homework. For a project to qualify for external sources of funding the financial picture needs to be firmly in place and this is the first step in drawing that picture. Section 2.1 sums up the total capital investment needed to implement the project. It makes a distinction between the preparatory phase and the implementation phase. Section 2.2 looks into the provisional commitments of different financing sources for the capital investment. Important issues in this section are how much of the project budget relies on conventional sources of financing (LG and state funding) and how much comes from other sources. Private sector investment is encouraged as it leverages the municipality’s budget and therefore could facilitate the implementation of more projects. Also it is important to know how much of the costs will be financed by debt (borrowing money) and how much by equity (LG taking a share in the investment). Section 2.3 looks at the costs involved in continued operation of the proposed project. This aspect is often overlooked in budgeting exercises, but of crucial importance as a reservation of resources sufficient for sustainable operation has to be made in the budget for years to come. Section 2.4 looks at similar parameters as 2.3 but concentrates on the operational budget. In this section, the less continued reliance on LG budget the better. In other words, the higher the regular stream of income from private sector, community payment and/or user charges the better. 2.5 and 2.6 are relevant in case the municipality decided to access loans for the project. It provides the total amount of the loan as well as the year in which the loan commences. This information is needed to calculate the repayment schedule of the loan.
Project Programming & Prioritisation Toolkit 27
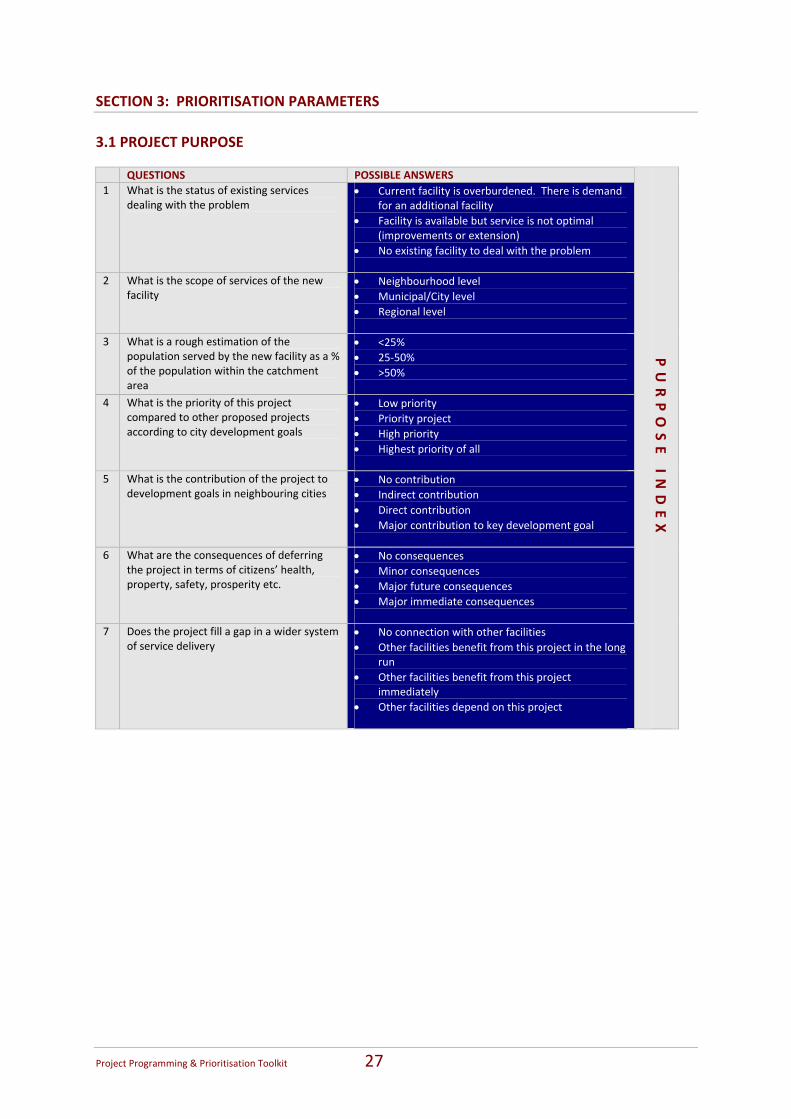
SECTION 3: PRIORITISATION PARAMETERS 3.1 PROJECT PURPOSE QUESTIONS POSSIBLE ANSWERS 1 What is the status of existing services
dealing with the problem
• Current facility is overburdened. There is demand for an additional facility
• Facility is available but service is not optimal (improvements or extension)
• No existing facility to deal with the problem
2 What is the scope of services of the new facility
• Neighbourhood level • Municipal/City level • Regional level
3 What is a rough estimation of the population served by the new facility as a % of the population within the catchment area
• <25% • 25‐50% • >50%
4 What is the priority of this project compared to other proposed projects according to city development goals
• Low priority • Priority project • High priority • Highest priority of all
5 What is the contribution of the project to development goals in neighbouring cities
• No contribution • Indirect contribution • Direct contribution • Major contribution to key development goal
6 What are the consequences of deferring the project in terms of citizens’ health, property, safety, prosperity etc.
• No consequences • Minor consequences • Major future consequences • Major immediate consequences
7 Does the project fill a gap in a wider system of service delivery
• No connection with other facilities • Other facilities benefit from this project in the long
run • Other facilities benefit from this project
immediately • Other facilities depend on this project
PURPO
SE INDEX
Project Programming & Prioritisation Toolkit 28
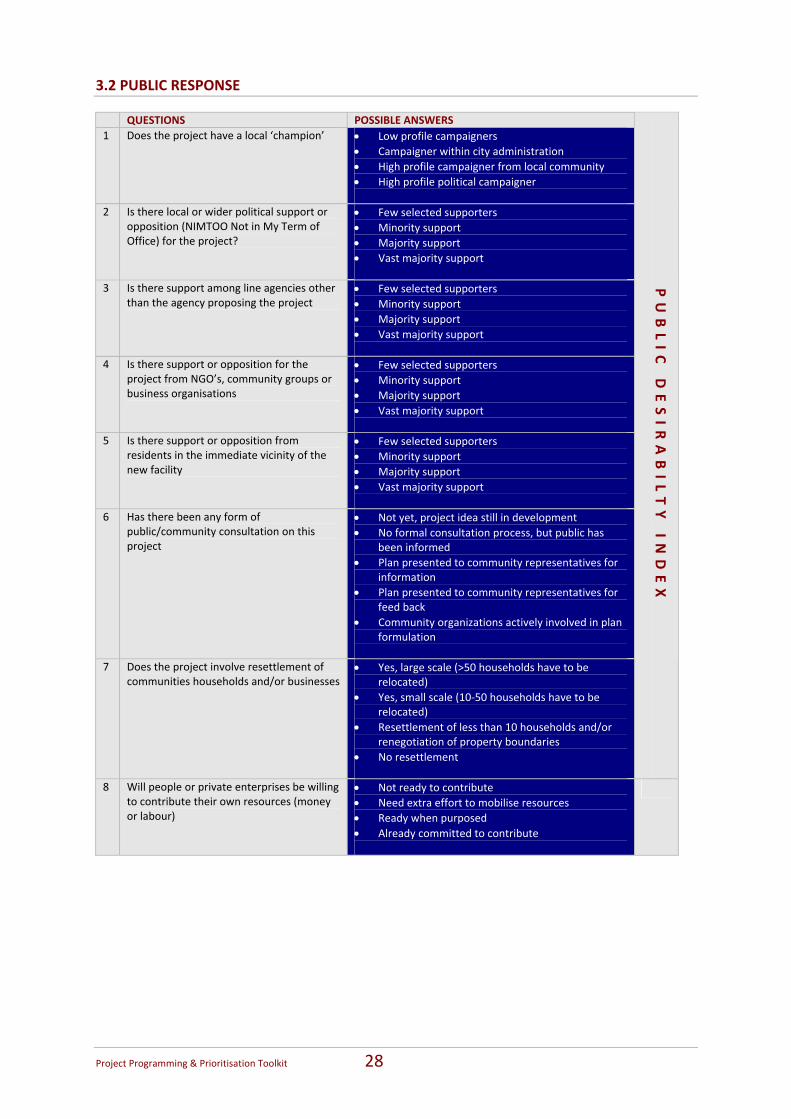
3.2 PUBLIC RESPONSE QUESTIONS POSSIBLE ANSWERS 1 Does the project have a local ‘champion’ • Low profile campaigners
• Campaigner within city administration • High profile campaigner from local community • High profile political campaigner
2 Is there local or wider political support or opposition (NIMTOO Not in My Term of Office) for the project?
• Few selected supporters • Minority support • Majority support • Vast majority support
3 Is there support among line agencies other than the agency proposing the project
• Few selected supporters • Minority support • Majority support • Vast majority support
4 Is there support or opposition for the project from NGO’s, community groups or business organisations
• Few selected supporters • Minority support • Majority support • Vast majority support
5 Is there support or opposition from residents in the immediate vicinity of the new facility
• Few selected supporters • Minority support • Majority support • Vast majority support
6 Has there been any form of public/community consultation on this project
• Not yet, project idea still in development • No formal consultation process, but public has
been informed • Plan presented to community representatives for
information • Plan presented to community representatives for
feed back • Community organizations actively involved in plan
formulation
7 Does the project involve resettlement of communities households and/or businesses
• Yes, large scale (>50 households have to be relocated)
• Yes, small scale (10‐50 households have to be relocated)
• Resettlement of less than 10 households and/or renegotiation of property boundaries
• No resettlement
PUBLIC DESIRABILTY INDEX
8 Will people or private enterprises be willing to contribute their own resources (money or labour)
• Not ready to contribute • Need extra effort to mobilise resources • Ready when purposed • Already committed to contribute
Project Programming & Prioritisation Toolkit 29
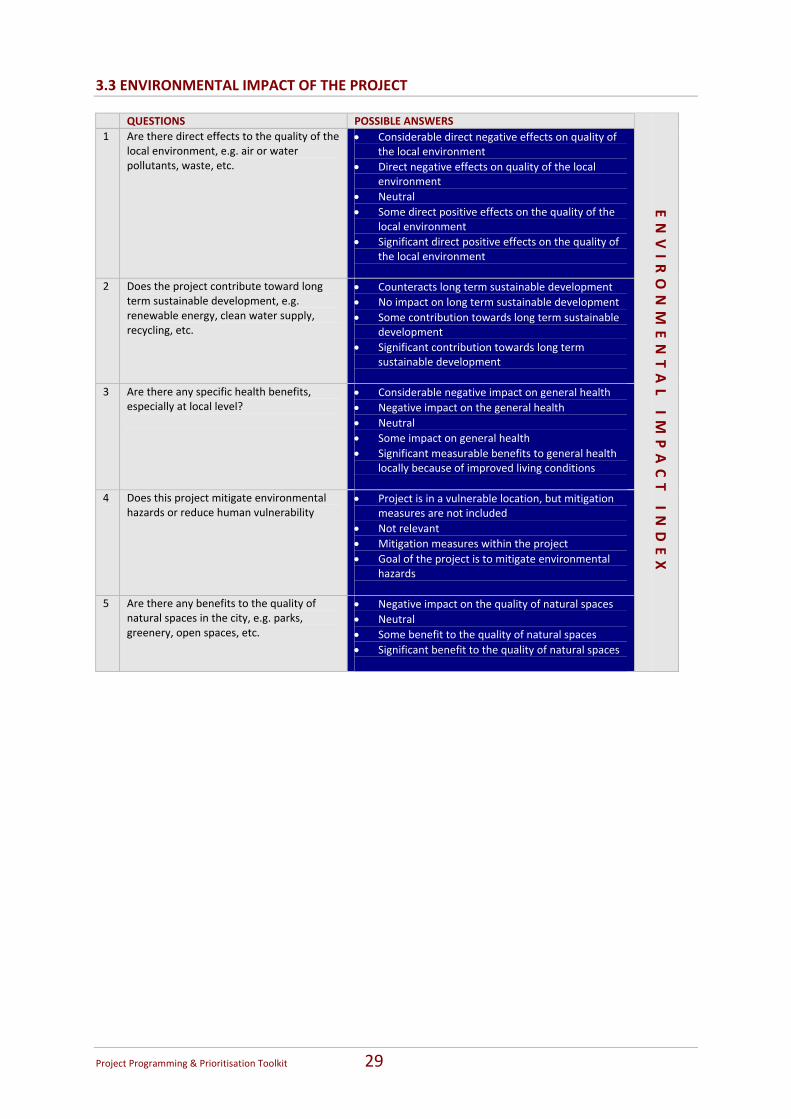
3.3 ENVIRONMENTAL IMPACT OF THE PROJECT QUESTIONS POSSIBLE ANSWERS 1 Are there direct effects to the quality of the
local environment, e.g. air or water pollutants, waste, etc.
• Considerable direct negative effects on quality of the local environment
• Direct negative effects on quality of the local environment
• Neutral • Some direct positive effects on the quality of the
local environment • Significant direct positive effects on the quality of
the local environment
2 Does the project contribute toward long term sustainable development, e.g. renewable energy, clean water supply, recycling, etc.
• Counteracts long term sustainable development • No impact on long term sustainable development • Some contribution towards long term sustainable
development • Significant contribution towards long term
sustainable development
3 Are there any specific health benefits, especially at local level?
• Considerable negative impact on general health • Negative impact on the general health • Neutral • Some impact on general health • Significant measurable benefits to general health
locally because of improved living conditions
4 Does this project mitigate environmental hazards or reduce human vulnerability
• Project is in a vulnerable location, but mitigation measures are not included
• Not relevant • Mitigation measures within the project • Goal of the project is to mitigate environmental
hazards
5 Are there any benefits to the quality of natural spaces in the city, e.g. parks, greenery, open spaces, etc.
• Negative impact on the quality of natural spaces • Neutral • Some benefit to the quality of natural spaces • Significant benefit to the quality of natural spaces
ENVIRO
NM
ENTAL IM
PACT INDEX
Project Programming & Prioritisation Toolkit 30
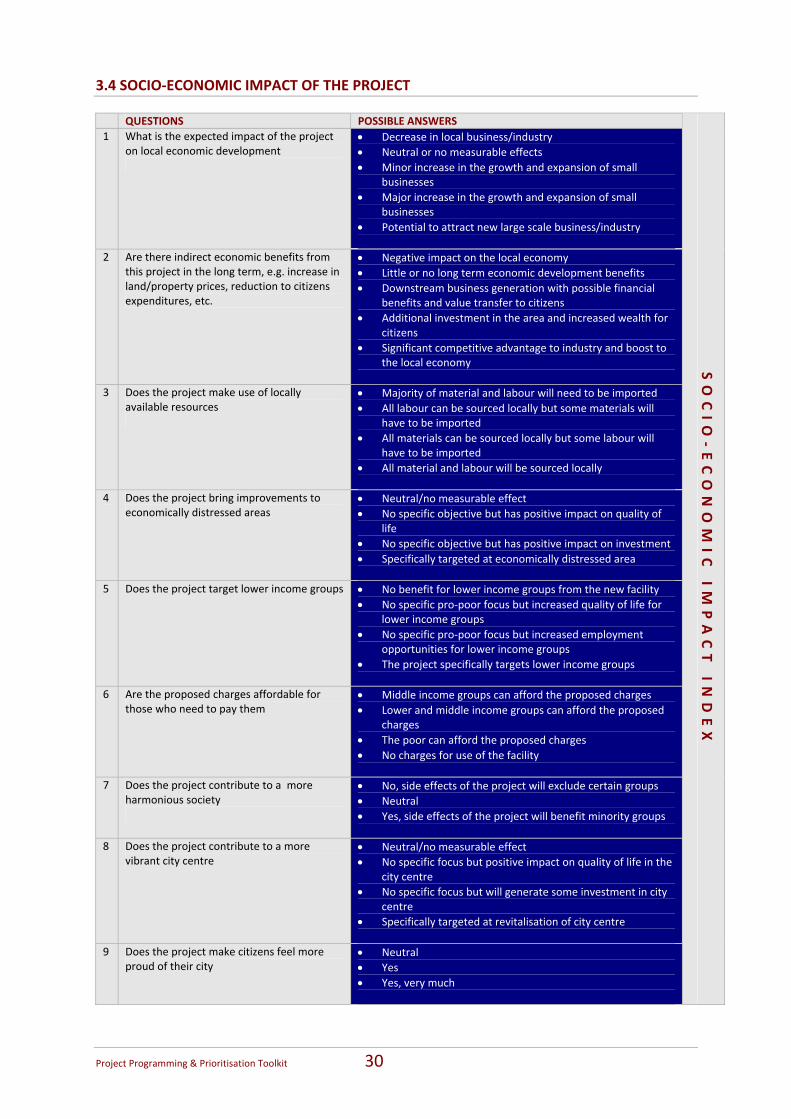
3.4 SOCIO‐ECONOMIC IMPACT OF THE PROJECT QUESTIONS POSSIBLE ANSWERS 1 What is the expected impact of the project
on local economic development
• Decrease in local business/industry • Neutral or no measurable effects • Minor increase in the growth and expansion of small
businesses • Major increase in the growth and expansion of small
businesses • Potential to attract new large scale business/industry
2 Are there indirect economic benefits from this project in the long term, e.g. increase in land/property prices, reduction to citizens expenditures, etc.
• Negative impact on the local economy • Little or no long term economic development benefits • Downstream business generation with possible financial
benefits and value transfer to citizens • Additional investment in the area and increased wealth for
citizens • Significant competitive advantage to industry and boost to
the local economy
3 Does the project make use of locally available resources
• Majority of material and labour will need to be imported • All labour can be sourced locally but some materials will
have to be imported • All materials can be sourced locally but some labour will
have to be imported • All material and labour will be sourced locally
4 Does the project bring improvements to economically distressed areas
• Neutral/no measurable effect • No specific objective but has positive impact on quality of
life • No specific objective but has positive impact on investment • Specifically targeted at economically distressed area
5 Does the project target lower income groups • No benefit for lower income groups from the new facility • No specific pro‐poor focus but increased quality of life for
lower income groups • No specific pro‐poor focus but increased employment
opportunities for lower income groups • The project specifically targets lower income groups
6 Are the proposed charges affordable for those who need to pay them
• Middle income groups can afford the proposed charges • Lower and middle income groups can afford the proposed
charges • The poor can afford the proposed charges • No charges for use of the facility
7 Does the project contribute to a more harmonious society
• No, side effects of the project will exclude certain groups • Neutral • Yes, side effects of the project will benefit minority groups
8 Does the project contribute to a more vibrant city centre
• Neutral/no measurable effect • No specific focus but positive impact on quality of life in the
city centre • No specific focus but will generate some investment in city
centre • Specifically targeted at revitalisation of city centre
9 Does the project make citizens feel more proud of their city
• Neutral • Yes • Yes, very much
SO
CIO
‐ECO
NO
MIC IM
PACT INDEX
Project Programming & Prioritisation Toolkit 31
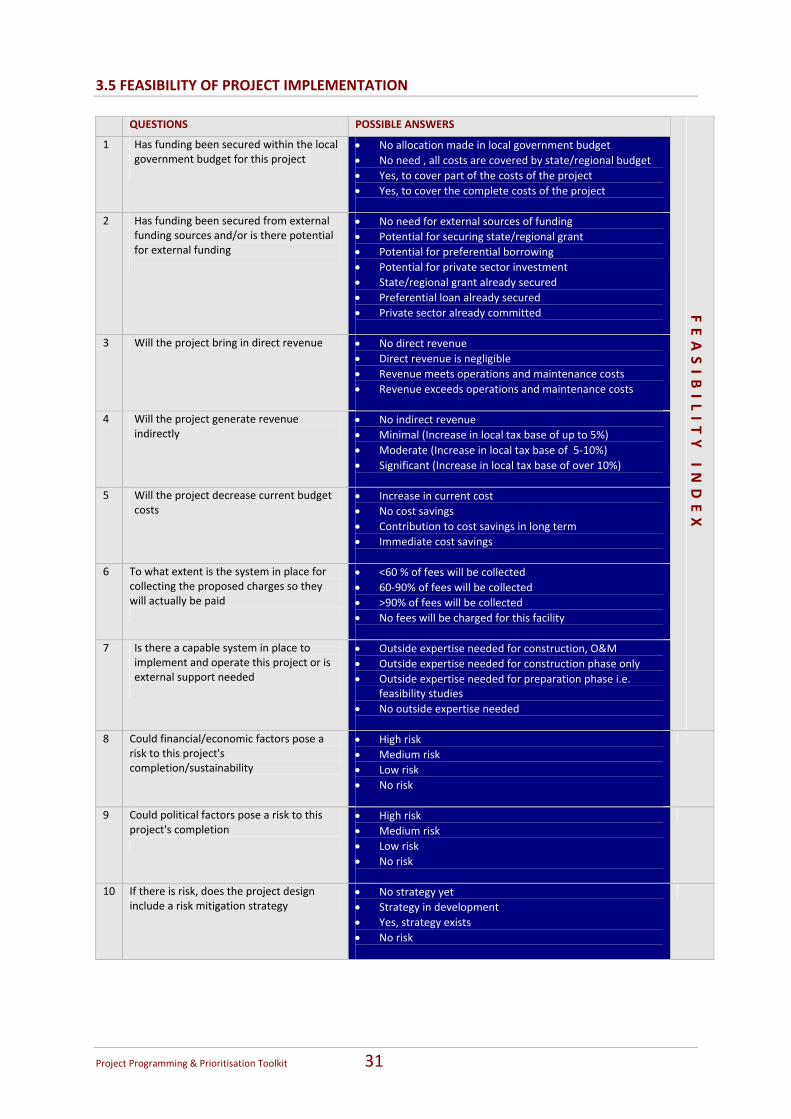
3.5 FEASIBILITY OF PROJECT IMPLEMENTATION QUESTIONS POSSIBLE ANSWERS
1 Has funding been secured within the local government budget for this project
• No allocation made in local government budget • No need , all costs are covered by state/regional budget • Yes, to cover part of the costs of the project • Yes, to cover the complete costs of the project
2 Has funding been secured from external funding sources and/or is there potential for external funding
• No need for external sources of funding • Potential for securing state/regional grant • Potential for preferential borrowing • Potential for private sector investment • State/regional grant already secured • Preferential loan already secured • Private sector already committed
3 Will the project bring in direct revenue • No direct revenue • Direct revenue is negligible • Revenue meets operations and maintenance costs • Revenue exceeds operations and maintenance costs
4 Will the project generate revenue indirectly
• No indirect revenue • Minimal (Increase in local tax base of up to 5%) • Moderate (Increase in local tax base of 5‐10%) • Significant (Increase in local tax base of over 10%)
5 Will the project decrease current budget costs
• Increase in current cost • No cost savings • Contribution to cost savings in long term • Immediate cost savings
6 To what extent is the system in place for collecting the proposed charges so they will actually be paid
• <60 % of fees will be collected • 60‐90% of fees will be collected • >90% of fees will be collected • No fees will be charged for this facility
7 Is there a capable system in place to implement and operate this project or is external support needed
• Outside expertise needed for construction, O&M • Outside expertise needed for construction phase only • Outside expertise needed for preparation phase i.e.
feasibility studies • No outside expertise needed
FEASIBILITY INDEX
8 Could financial/economic factors pose a risk to this project's completion/sustainability
• High risk • Medium risk • Low risk • No risk
9 Could political factors pose a risk to this project's completion
• High risk • Medium risk • Low risk • No risk
10 If there is risk, does the project design include a risk mitigation strategy
• No strategy yet • Strategy in development • Yes, strategy exists • No risk
Project Programming & Prioritisation Toolkit 32
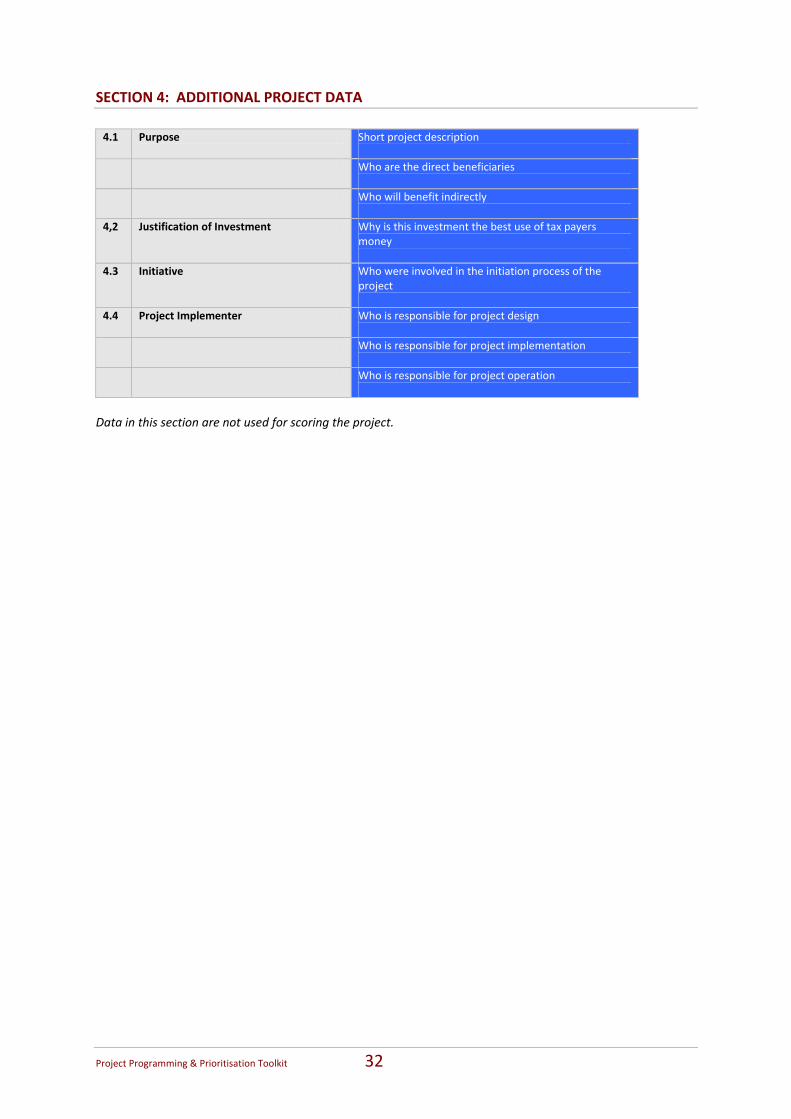
SECTION 4: ADDITIONAL PROJECT DATA 4.1 Purpose Short project description
Who are the direct beneficiaries
Who will benefit indirectly
4,2 Justification of Investment Why is this investment the best use of tax payers
money
4.3 Initiative Who were involved in the initiation process of the project
4.4 Project Implementer Who is responsible for project design
Who is responsible for project implementation
Who is responsible for project operation
Data in this section are not used for scoring the project.
Project Programming & Prioritisation Toolkit 33
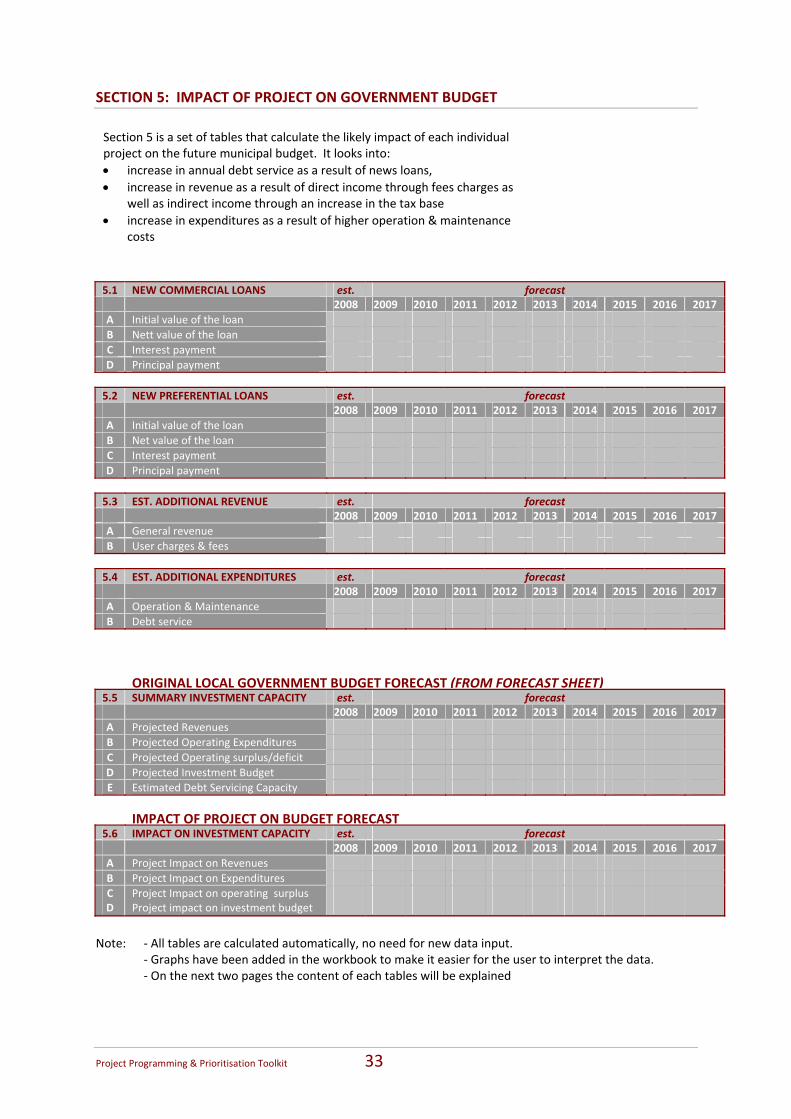
SECTION 5: IMPACT OF PROJECT ON GOVERNMENT BUDGET Section 5 is a set of tables that calculate the likely impact of each individual project on the future municipal budget. It looks into: • increase in annual debt service as a result of news loans, • increase in revenue as a result of direct income through fees charges as
well as indirect income through an increase in the tax base • increase in expenditures as a result of higher operation & maintenance
costs 5.1 NEW COMMERCIAL LOANS est. forecast 2008 2009 2010 2011 2012 2013 2014 2015 2016 2017A Initial value of the loan B Nett value of the loan C Interest payment D Principal payment
5.2 NEW PREFERENTIAL LOANS est. forecast 2008 2009 2010 2011 2012 2013 2014 2015 2016 2017A Initial value of the loan B Net value of the loan C Interest payment D Principal payment
5.3 EST. ADDITIONAL REVENUE est. forecast 2008 2009 2010 2011 2012 2013 2014 2015 2016 2017A General revenue B User charges & fees
5.4 EST. ADDITIONAL EXPENDITURES est. forecast 2008 2009 2010 2011 2012 2013 2014 2015 2016 2017A Operation & Maintenance B Debt service
ORIGINAL LOCAL GOVERNMENT BUDGET FORECAST (FROM FORECAST SHEET)
5.5 SUMMARY INVESTMENT CAPACITY est. forecast 2008 2009 2010 2011 2012 2013 2014 2015 2016 2017A Projected Revenues B Projected Operating Expenditures C Projected Operating surplus/deficit D Projected Investment Budget E Estimated Debt Servicing Capacity
IMPACT OF PROJECT ON BUDGET FORECAST 5.6 IMPACT ON INVESTMENT CAPACITY est. forecast 2008 2009 2010 2011 2012 2013 2014 2015 2016 2017A Project Impact on Revenues B Project Impact on Expenditures C Project Impact on operating surplus D Project impact on investment budget
Note: ‐ All tables are calculated automatically, no need for new data input.
‐ Graphs have been added in the workbook to make it easier for the user to interpret the data. ‐ On the next two pages the content of each tables will be explained
Project Programming & Prioritisation Toolkit 34
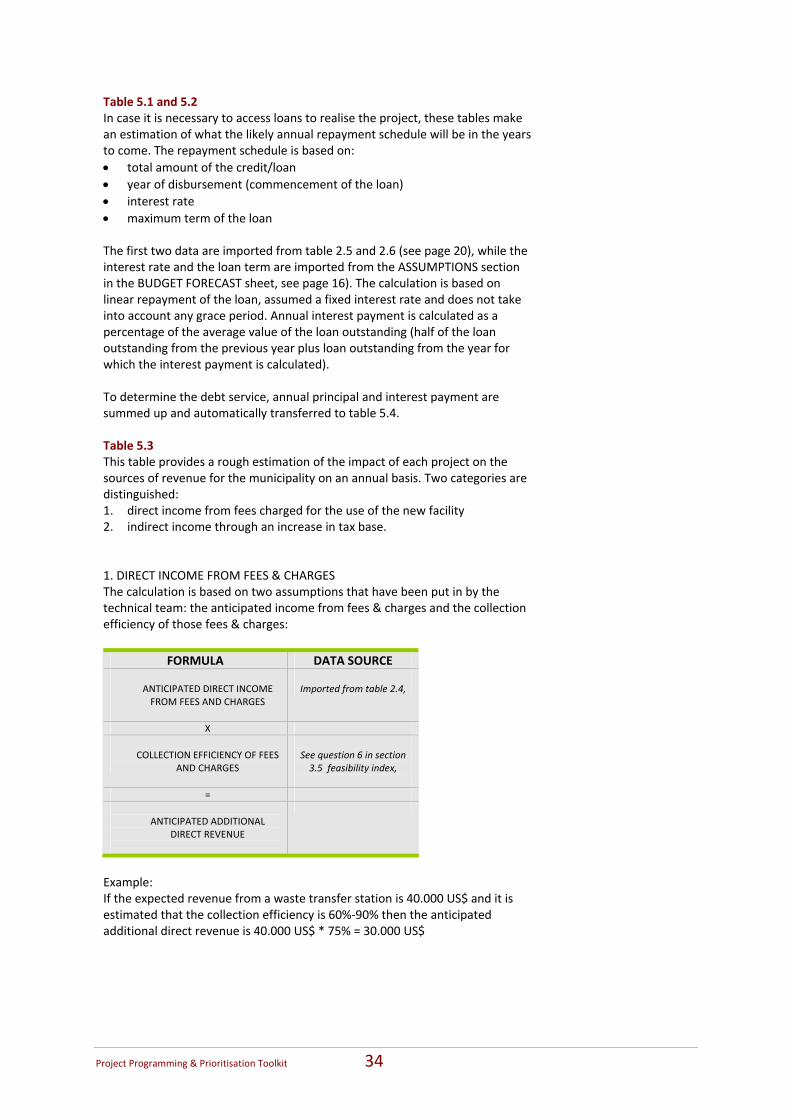
Table 5.1 and 5.2 In case it is necessary to access loans to realise the project, these tables make an estimation of what the likely annual repayment schedule will be in the years to come. The repayment schedule is based on: • total amount of the credit/loan • year of disbursement (commencement of the loan) • interest rate • maximum term of the loan The first two data are imported from table 2.5 and 2.6 (see page 20), while the interest rate and the loan term are imported from the ASSUMPTIONS section in the BUDGET FORECAST sheet, see page 16). The calculation is based on linear repayment of the loan, assumed a fixed interest rate and does not take into account any grace period. Annual interest payment is calculated as a percentage of the average value of the loan outstanding (half of the loan outstanding from the previous year plus loan outstanding from the year for which the interest payment is calculated). To determine the debt service, annual principal and interest payment are summed up and automatically transferred to table 5.4. Table 5.3 This table provides a rough estimation of the impact of each project on the sources of revenue for the municipality on an annual basis. Two categories are distinguished: 1. direct income from fees charged for the use of the new facility 2. indirect income through an increase in tax base. 1. DIRECT INCOME FROM FEES & CHARGES The calculation is based on two assumptions that have been put in by the technical team: the anticipated income from fees & charges and the collection efficiency of those fees & charges:
FORMULA DATA SOURCE
ANTICIPATED DIRECT INCOME FROM FEES AND CHARGES
Imported from table 2.4,
X
COLLECTION EFFICIENCY OF FEES AND CHARGES
See question 6 in section 3.5 feasibility index,
=
ANTICIPATED ADDITIONAL DIRECT REVENUE
Example: If the expected revenue from a waste transfer station is 40.000 US$ and it is estimated that the collection efficiency is 60%‐90% then the anticipated additional direct revenue is 40.000 US$ * 75% = 30.000 US$
Project Programming & Prioritisation Toolkit 35
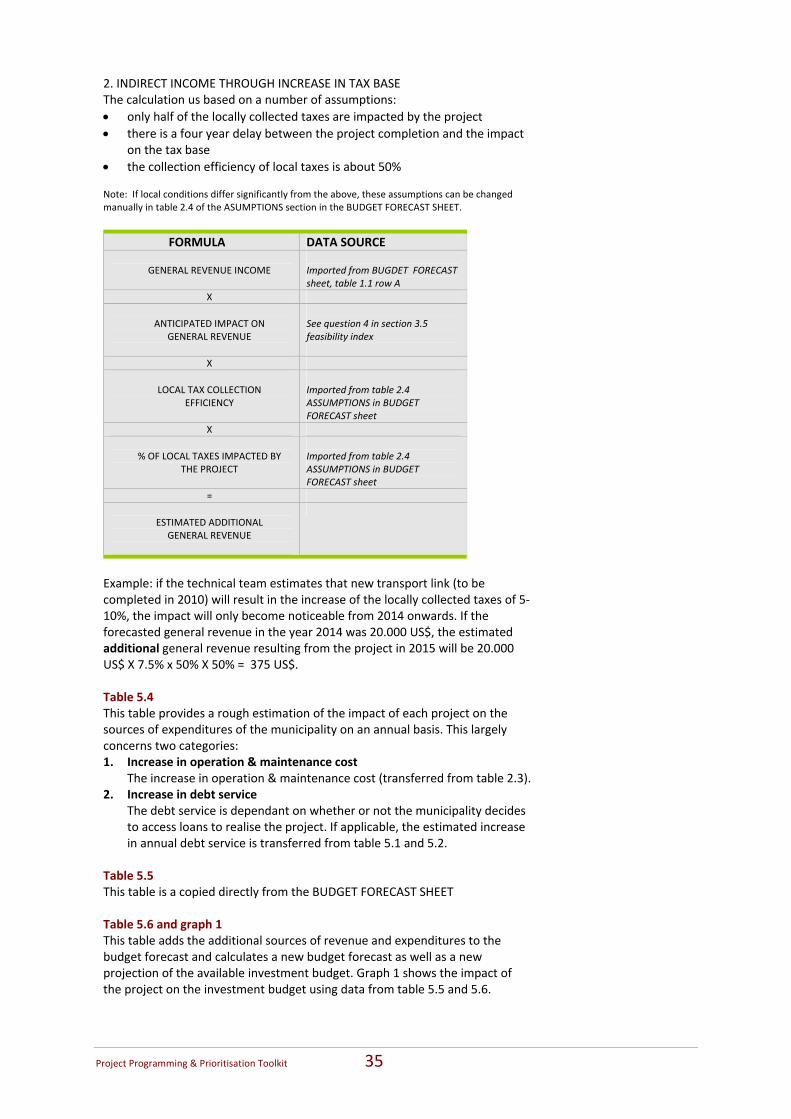
2. INDIRECT INCOME THROUGH INCREASE IN TAX BASE The calculation us based on a number of assumptions: • only half of the locally collected taxes are impacted by the project • there is a four year delay between the project completion and the impact
on the tax base • the collection efficiency of local taxes is about 50% Note: If local conditions differ significantly from the above, these assumptions can be changed manually in table 2.4 of the ASUMPTIONS section in the BUDGET FORECAST SHEET.
FORMULA DATA SOURCE
GENERAL REVENUE INCOME Imported from BUGDET FORECAST sheet, table 1.1 row A
X
ANTICIPATED IMPACT ON GENERAL REVENUE
See question 4 in section 3.5 feasibility index
X
LOCAL TAX COLLECTION EFFICIENCY
Imported from table 2.4 ASSUMPTIONS in BUDGET FORECAST sheet
X
% OF LOCAL TAXES IMPACTED BY THE PROJECT
Imported from table 2.4 ASSUMPTIONS in BUDGET FORECAST sheet
=
ESTIMATED ADDITIONAL GENERAL REVENUE
Example: if the technical team estimates that new transport link (to be completed in 2010) will result in the increase of the locally collected taxes of 5‐10%, the impact will only become noticeable from 2014 onwards. If the forecasted general revenue in the year 2014 was 20.000 US$, the estimated additional general revenue resulting from the project in 2015 will be 20.000 US$ X 7.5% x 50% X 50% = 375 US$. Table 5.4 This table provides a rough estimation of the impact of each project on the sources of expenditures of the municipality on an annual basis. This largely concerns two categories: 1. Increase in operation & maintenance cost
The increase in operation & maintenance cost (transferred from table 2.3).2. Increase in debt service
The debt service is dependant on whether or not the municipality decides to access loans to realise the project. If applicable, the estimated increase in annual debt service is transferred from table 5.1 and 5.2.
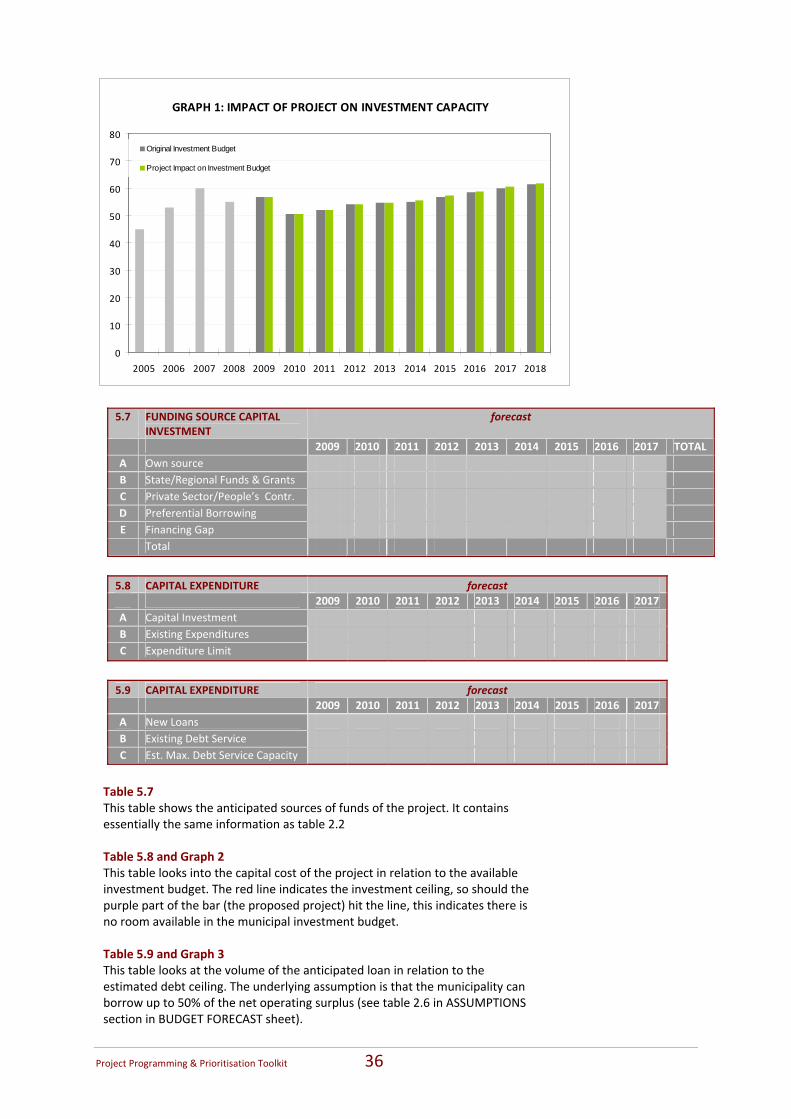
Table 5.5 This table is a copied directly from the BUDGET FORECAST SHEET Table 5.6 and graph 1 This table adds the additional sources of revenue and expenditures to the budget forecast and calculates a new budget forecast as well as a new projection of the available investment budget. Graph 1 shows the impact of the project on the investment budget using data from table 5.5 and 5.6.
Project Programming & Prioritisation Toolkit 36
GRAPH 1: IMPACT OF PROJECT ON INVESTMENT CAPACITY
0
10
20
30
40
50
60
70
80
2005 2006 2007 2008 2009 2010 2011 2012 2013 2014 2015 2016 2017 2018
Original Investment Budget
Project Impact on Investment Budget
5.7 FUNDING SOURCE CAPITAL INVESTMENT
forecast
2009 2010 2011 2012 2013 2014 2015 2016 2017 TOTAL A Own source B State/Regional Funds & Grants C Private Sector/People’s Contr. D Preferential Borrowing E Financing Gap Total
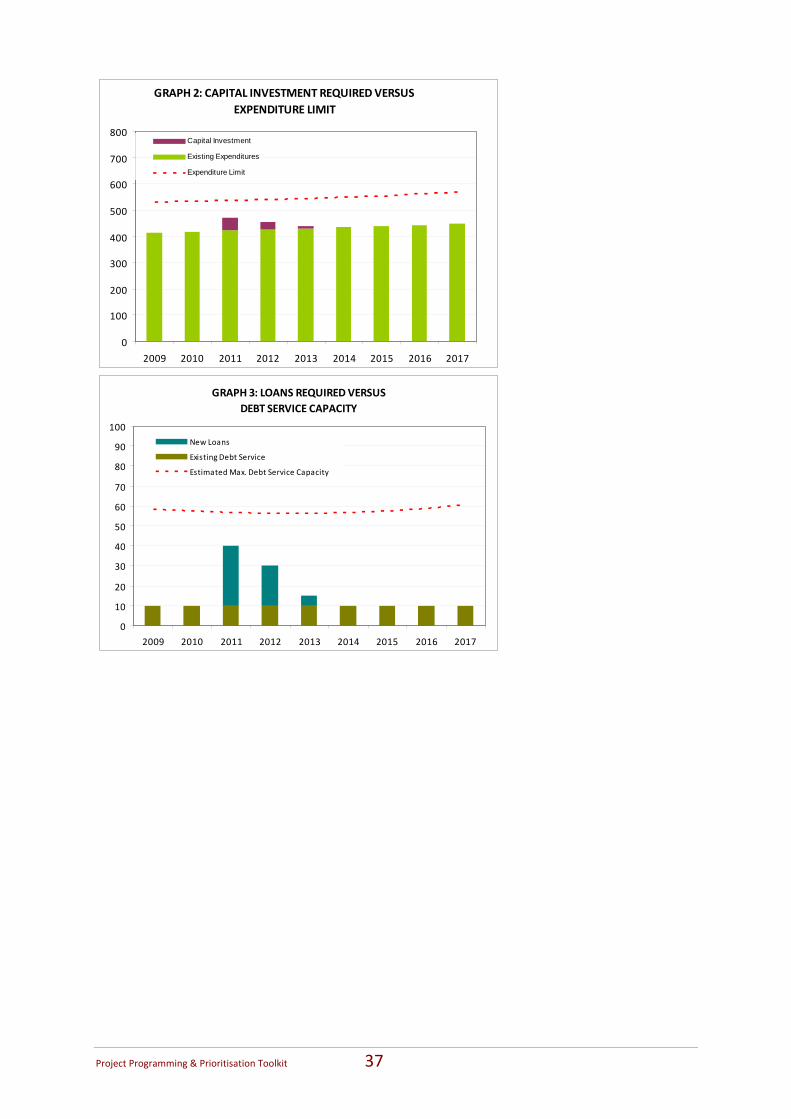
5.8 CAPITAL EXPENDITURE forecast 2009 2010 2011 2012 2013 2014 2015 2016 2017 A Capital Investment B Existing Expenditures C Expenditure Limit
5.9 CAPITAL EXPENDITURE forecast 2009 2010 2011 2012 2013 2014 2015 2016 2017 A New Loans B Existing Debt Service C Est. Max. Debt Service Capacity
Table 5.7 This table shows the anticipated sources of funds of the project. It contains essentially the same information as table 2.2 Table 5.8 and Graph 2 This table looks into the capital cost of the project in relation to the available investment budget. The red line indicates the investment ceiling, so should the purple part of the bar (the proposed project) hit the line, this indicates there is no room available in the municipal investment budget. Table 5.9 and Graph 3 This table looks at the volume of the anticipated loan in relation to the estimated debt ceiling. The underlying assumption is that the municipality can borrow up to 50% of the net operating surplus (see table 2.6 in ASSUMPTIONS section in BUDGET FORECAST sheet).
Project Programming & Prioritisation Toolkit 37
GRAPH 2: CAPITAL INVESTMENT REQUIRED VERSUS EXPENDITURE LIMIT
0
100
200
300
400
500
600
700
800
2009 2010 2011 2012 2013 2014 2015 2016 2017
Capital Investment
Existing Expenditures
Expenditure Limit
GRAPH 3: LOANS REQUIRED VERSUS
DEBT SERVICE CAPACITY
0
10
20
30
40
50
60
70
80
90
100
2009 2010 2011 2012 2013 2014 2015 2016 2017
New Loans
Existing Debt Service
Estimated Max. Debt Service Capacity
Project Programming & Prioritisation Toolkit 38
GUIDANCE FOR THE FACILITATOR A: CHECK ASSUMPTIONS & BUILT‐IN SCENARIOS Before commencing the prioritisation exercise the facilitator should: • Check the assumptions that underpin the excel workbook. The assumptions include
data on inflation, GDP growth, interest and exchange rate, typical lending conditions, debt ceiling, tax collection efficiency, % of operating surplus for strategic investment projects etc. Each of these indicators has a default setting but this can be adjusted easily to reflect local circumstances. If no changes are made the default settings will be used.
• Study the weights allocation in the built‐in scenarios. In case these do not properly reflect the city development objectives the facilitator should encourage the team to develop CITY scenario
B: KEY IN DATA FOR EACH PROJECT ON THE WISHLIST First task is for the technical team to key in all data for each proposed project. Only section 1, 2 and 3 require manual data‐input. Section 4 is optional and section 5 is calculated automatically. This exercise is best done in a plenary session whereby the excel workbook is displayed on a screen and the facilitator guides the discussion and keys in the data. Depending on the availability of data and concurrence within the team on the questions the input for each project should take approximately half an hour. Remember that each proposal on the wish list must meet two basic criteria: 1. It should be an investment project 2. It should be a municipal project C: REVIEW SUMMARY SHEET AND REVISE SCORES The summary sheet provides a one‐page overview of the scores of each project on each index and for each scenario. Because al scores have been normalized it is easy to compare the scores of projects. The summary sheet also gives scores on a number of financial parameters. When pressing the ‘SORT PROJECTS’ button on any column, the projects are automatically sorted with the highest score in each category first. The team now has the opportunity to discuss the scores of the projects. The scenarios can help but the main point of reference should always be the city development goals. If the team questions why a particular project has come out higher than another one, they can simply go back to the project sheet and check if they’re comfortable the selected answers. The answers can be adjusted. Only when the team is happy with the scores of each individual project, it is time to move to the next step: short listing. Note: It may help if the facilitator highlight highest and second highest scores in summary sheet D: SHORTLIST PROJECTS FOR EACH CATEGORY The team now has to decide on a ranking. This is best done in the plenary session with the whole technical team present. This ranking session could also include a broader audience with for example community representatives. There are several ways to do this. The team could decide to follow one particular scenario and simply adopt the ranking according to that scenario. Alternatively the ranking can be decided by voting. Each individual team members can each submit their own ranking –which does not necessarily have to correspond to the summary sheet ranking) to the facilitator who will then calculate the ‘winning ‘projects based on the highest number of votes. The facilitator will manually key in the ranking in column B of the summary sheet. When pressing the SORT button, the projects will automatically be displayed with the highest ranking one first. Note: The excel sheet does not provide an automatic ranking. The ranking in column B is the result of manual input
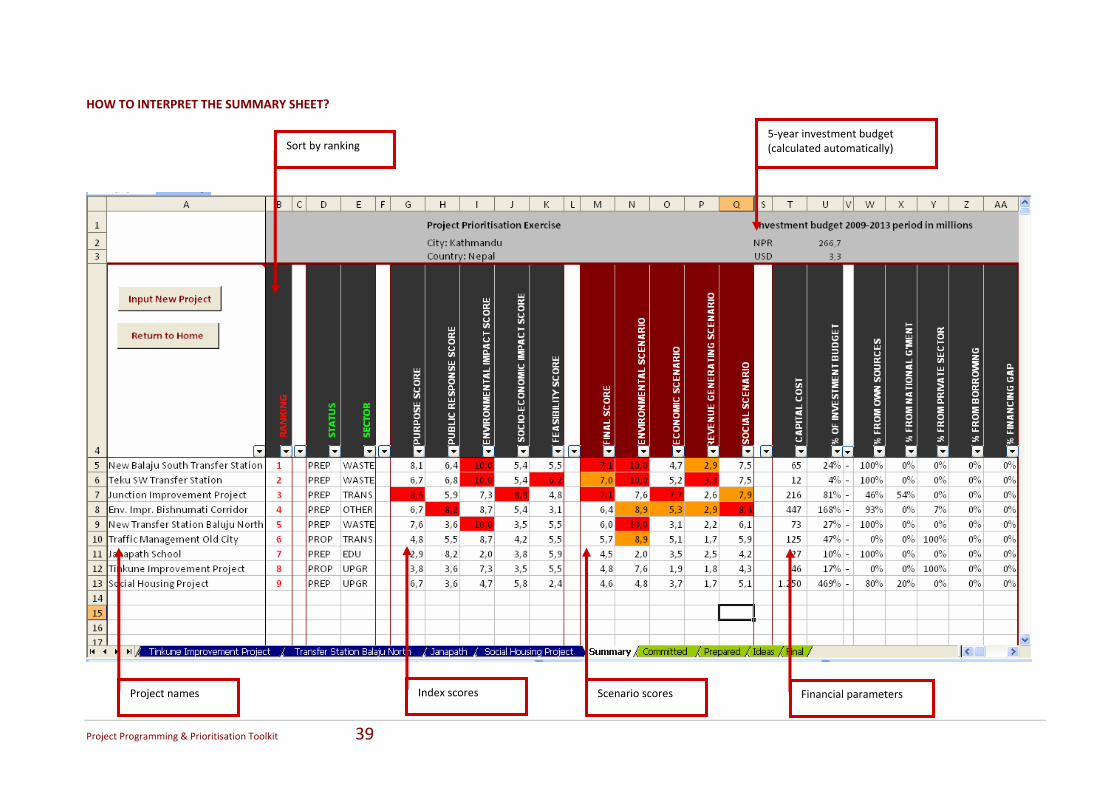
Project Programming & Prioritisation Toolkit 39
HOW TO INTERPRET THE SUMMARY SHEET?
Sort by ranking5‐year investment budget (calculated automatically)
Project names Index scores Scenario scores Financial parameters

Project Programming & Prioritisation Toolkit 40
STEP 3 PROGRAMMING
FOR INVESTMENT
‘Don’t tell me where your priorities are.
Show me where you spend your money
and I’ll tell you what they are’
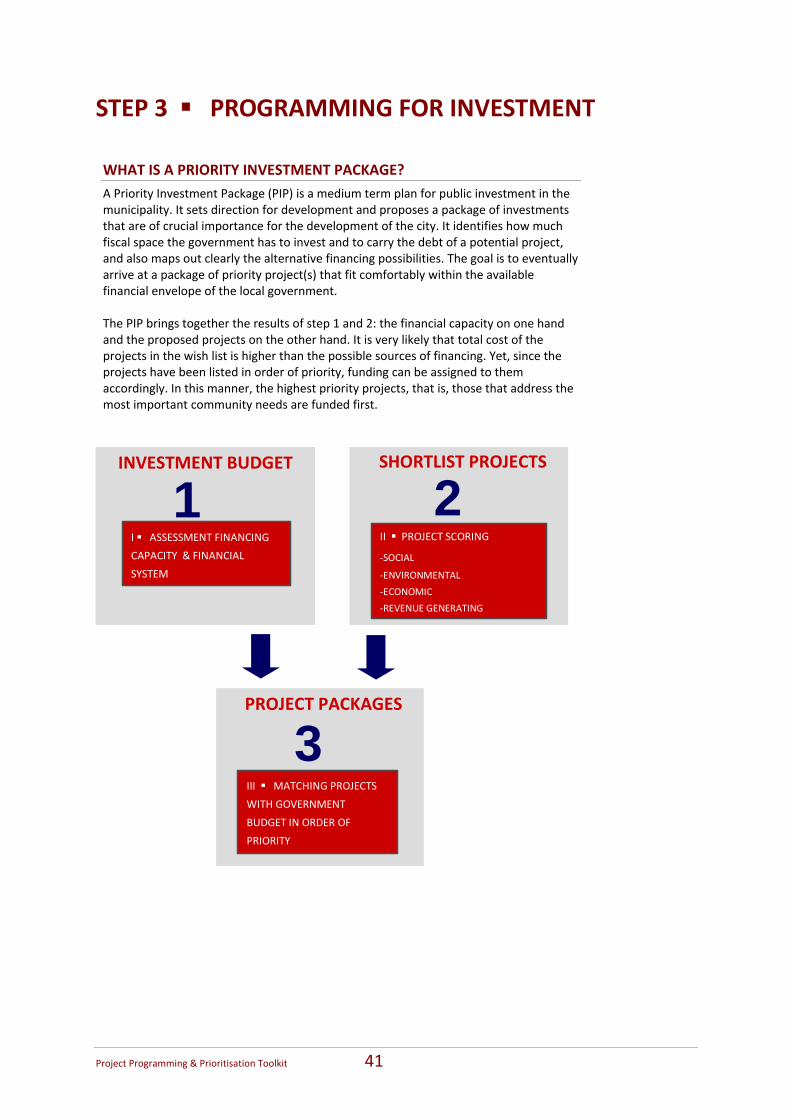
Project Programming & Prioritisation Toolkit 41
STEP 3 PROGRAMMING FOR INVESTMENT
WHAT IS A PRIORITY INVESTMENT PACKAGE? A Priority Investment Package (PIP) is a medium term plan for public investment in the municipality. It sets direction for development and proposes a package of investments that are of crucial importance for the development of the city. It identifies how much fiscal space the government has to invest and to carry the debt of a potential project, and also maps out clearly the alternative financing possibilities. The goal is to eventually arrive at a package of priority project(s) that fit comfortably within the available financial envelope of the local government. The PIP brings together the results of step 1 and 2: the financial capacity on one hand and the proposed projects on the other hand. It is very likely that total cost of the projects in the wish list is higher than the possible sources of financing. Yet, since the projects have been listed in order of priority, funding can be assigned to them accordingly. In this manner, the highest priority projects, that is, those that address the most important community needs are funded first.
I ASSESSMENT FINANCING
CAPACITY & FINANCIAL
SYSTEM
1INVESTMENT BUDGET
I ASSESSMENT FINANCING
CAPACITY & FINANCIAL
SYSTEM
1INVESTMENT BUDGET
II PROJECT SCORING
‐SOCIAL
‐ENVIRONMENTAL
‐ECONOMIC
‐REVENUE GENERATING
2SHORTLIST PROJECTS
II PROJECT SCORING
‐SOCIAL
‐ENVIRONMENTAL
‐ECONOMIC
‐REVENUE GENERATING
2SHORTLIST PROJECTS
III MATCHING PROJECTS
WITH GOVERNMENT
BUDGET IN ORDER OF
PRIORITY
3PROJECT PACKAGES
III MATCHING PROJECTS
WITH GOVERNMENT
BUDGET IN ORDER OF
PRIORITY
3PROJECT PACKAGES
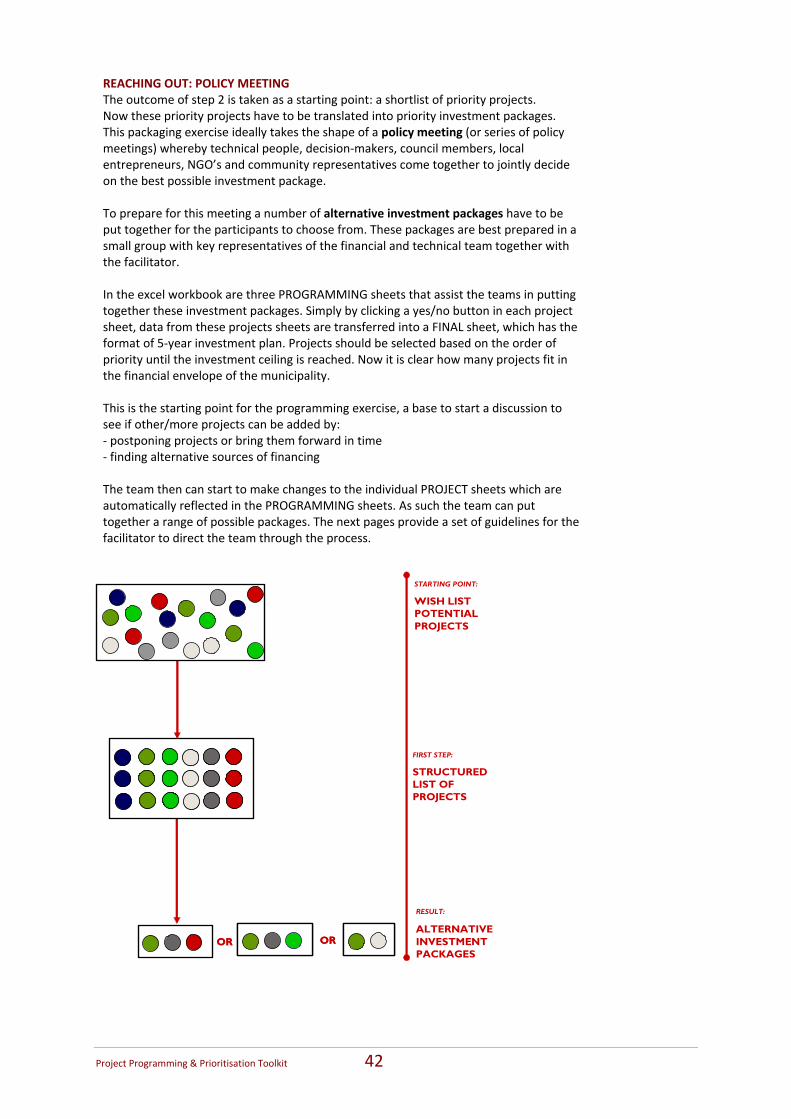
Project Programming & Prioritisation Toolkit 42
REACHING OUT: POLICY MEETING The outcome of step 2 is taken as a starting point: a shortlist of priority projects. Now these priority projects have to be translated into priority investment packages. This packaging exercise ideally takes the shape of a policy meeting (or series of policy meetings) whereby technical people, decision‐makers, council members, local entrepreneurs, NGO’s and community representatives come together to jointly decide on the best possible investment package. To prepare for this meeting a number of alternative investment packages have to be put together for the participants to choose from. These packages are best prepared in a small group with key representatives of the financial and technical team together with the facilitator. In the excel workbook are three PROGRAMMING sheets that assist the teams in putting together these investment packages. Simply by clicking a yes/no button in each project sheet, data from these projects sheets are transferred into a FINAL sheet, which has the format of 5‐year investment plan. Projects should be selected based on the order of priority until the investment ceiling is reached. Now it is clear how many projects fit in the financial envelope of the municipality. This is the starting point for the programming exercise, a base to start a discussion to see if other/more projects can be added by: ‐ postponing projects or bring them forward in time ‐ finding alternative sources of financing The team then can start to make changes to the individual PROJECT sheets which are automatically reflected in the PROGRAMMING sheets. As such the team can put together a range of possible packages. The next pages provide a set of guidelines for the facilitator to direct the team through the process.
RESULT:
ALTERNATIVE INVESTMENT PACKAGES
STARTING POINT:
WISH LIST POTENTIAL PROJECTS
FIRST STEP:
STRUCTURED LIST OF PROJECTS
OROR OROR
Project Programming & Prioritisation Toolkit 43
GUIDANCE FOR THE FACILITATOR A: SELECT PROJECTS The first task is to import the data from the project sheets into the programming sheets. This is done simply by clicking the button ‘INCLUDE PROJECT IN INVESTMENT PLAN’ on the project sheet ranking list. The team starts with the COMITTED projects than the PREPARED projects followed by the PROPOSED projects. Projects should be added one by one in order of priority using the ranking list in the summary sheet. Alternatively, all projects can be added to the FINAL sheet irrespective of their status. The excel workbook automatically sums up the required investment for each project and calculates the impact on investment budget available and the maximum debt service. Graph 1& 2 help the team by visualising the impact. Graph 1 shows the capital investment required for the projects versus the expenditure limit. If the bar hits the red line it means that the investment ceiling has been reached. Graph 2 shows the debt ceiling, meaning that the bar indicating the annual debt service cannot go beyond the red line. After adding a new project the team should check the funds remaining after budget allocation. If balance after investment is positive another project can be added, until the budget is exhausted. This package is the standard investment package and this is the time to save this file as INVESTMENT PACKAGE 1. B: MODIFY PROJECT DATA Now the team can start playing around with the package. The objective is to create fiscal room for additional projects by changing the data in the individual project sheets: • What happens if the loan amount for a particular project is increased? • What happens if private sector funding is accessed for a particular project? • What happens if we try to source alternative sources of funding? • What happens if the starting date of a project is brought forward or is postponed? Again the graphs in the spreadsheet help the team to put together a balanced package. Graph 1 and 2 will send alarm bells ringing once the maximum value for investment or loans has been reached in a particular year. C: DEVELOP ALTERNATIVE PACKAGES Once the team has put together a new possible package, the file should be saved as INVESTMENT PACKAGE 2. In this way the team can create a number of packages each with their own advantages disadvantages and consequences. Rather than relying on the municipal budget for project funding, the team is encouraged to think creatively. As much as possible the own sources should be considered as the municipality’s potential, its own contribution in order to receive external funds.
NOTES FOR THE WORKBOOK USER: - Step 3 ‘Programming for Investment’ refers to the section in the
workbook with the green tabs. - There are three sheets: COMMITTED, PREPARED and PROPOSED. All
information in these sheets is calculated automatically, no need for manual input.
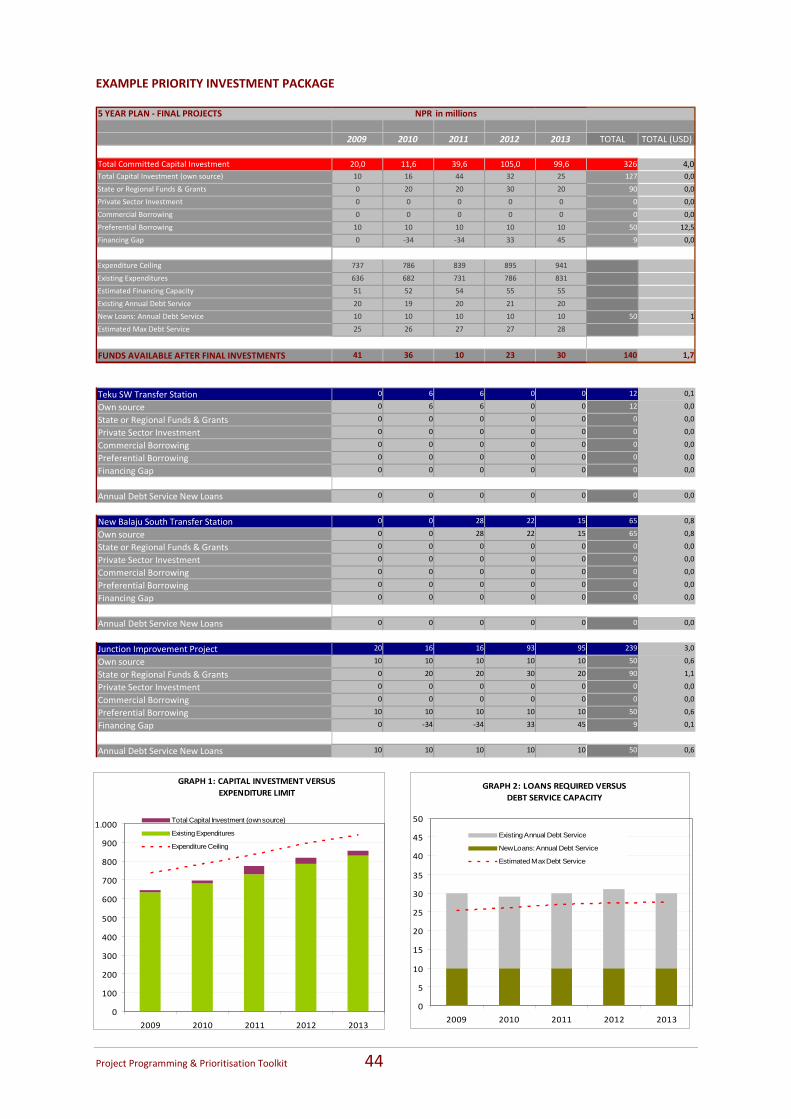
Project Programming & Prioritisation Toolkit 44
EXAMPLE PRIORITY INVESTMENT PACKAGE 5 YEAR PLAN ‐ FINAL PROJECTS
2009 2010 2011 2012 2013 TOTAL TOTAL (USD)
Total Committed Capital Investment 20,0 11,6 39,6 105,0 99,6 326 4,0Total Capital Investment (own source) 10 16 44 32 25 127 0,0
State or Regional Funds & Grants 0 20 20 30 20 90 0,0
Private Sector Investment 0 0 0 0 0 0 0,0
Commercial Borrowing 0 0 0 0 0 0 0,0
Preferential Borrowing 10 10 10 10 10 50 12,5
Financing Gap 0 ‐34 ‐34 33 45 9 0,0
Expenditure Ceiling 737 786 839 895 941
Existing Expenditures 636 682 731 786 831
Estimated Financing Capacity 51 52 54 55 55
Existing Annual Debt Service 20 19 20 21 20
New Loans: Annual Debt Service 10 10 10 10 10 50 1
Estimated Max Debt Service 25 26 27 27 28
FUNDS AVAILABLE AFTER FINAL INVESTMENTS 41 36 10 23 30 140 1,7
Teku SW Transfer Station 0 6 6 0 0 12 0,1
Own source 0 6 6 0 0 12 0,0
State or Regional Funds & Grants 0 0 0 0 0 0 0,0
Private Sector Investment 0 0 0 0 0 0 0,0
Commercial Borrowing 0 0 0 0 0 0 0,0
Preferential Borrowing 0 0 0 0 0 0 0,0
Financing Gap 0 0 0 0 0 0 0,0
Annual Debt Service New Loans 0 0 0 0 0 0 0,0
New Balaju South Transfer Station 0 0 28 22 15 65 0,8
Own source 0 0 28 22 15 65 0,8
State or Regional Funds & Grants 0 0 0 0 0 0 0,0
Private Sector Investment 0 0 0 0 0 0 0,0
Commercial Borrowing 0 0 0 0 0 0 0,0
Preferential Borrowing 0 0 0 0 0 0 0,0
Financing Gap 0 0 0 0 0 0 0,0
Annual Debt Service New Loans 0 0 0 0 0 0 0,0
Junction Improvement Project 20 16 16 93 95 239 3,0
Own source 10 10 10 10 10 50 0,6
State or Regional Funds & Grants 0 20 20 30 20 90 1,1
Private Sector Investment 0 0 0 0 0 0 0,0
Commercial Borrowing 0 0 0 0 0 0 0,0
Preferential Borrowing 10 10 10 10 10 50 0,6
Financing Gap 0 ‐34 ‐34 33 45 9 0,1
Annual Debt Service New Loans 10 10 10 10 10 50 0,6
NPR in millions
GRAPH 1: CAPITAL INVESTMENT VERSUS EXPENDITURE LIMIT
0
100
200
300
400
500
600
700
800
900
1.000
2009 2010 2011 2012 2013
Total Capital Investment (own source)
Existing Expenditures
Expenditure Ceiling
GRAPH 2: LOANS REQUIRED VERSUS DEBT SERVICE CAPACITY
0
5
10
15
20
25
30
35
40
45
50
2009 2010 2011 2012 2013
Existing Annual Debt Service
New Loans: Annual Debt Service
Estimated Max Debt Service

Project Programming & Prioritisation Toolkit 45
EXAMPLE PROJECTS
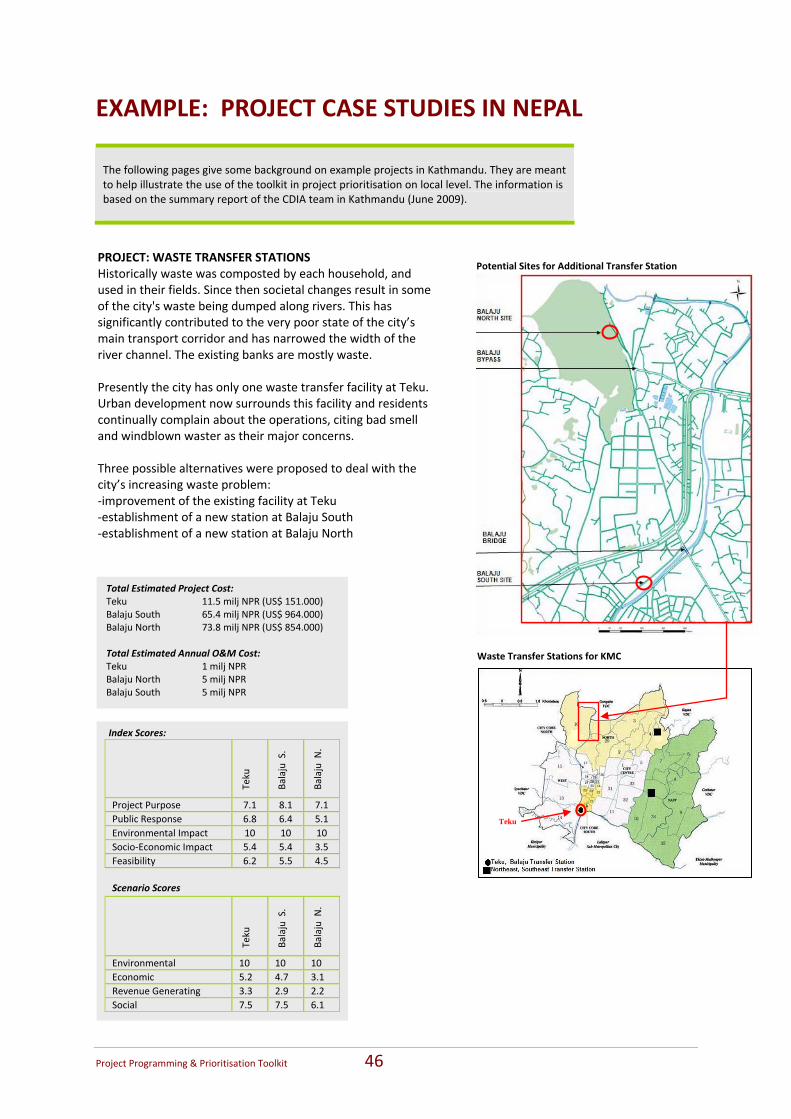
Project Programming & Prioritisation Toolkit 46
Total Estimated Project Cost:Teku 11.5 milj NPR (US$ 151.000) Balaju South 65.4 milj NPR (US$ 964.000) Balaju North 73.8 milj NPR (US$ 854.000) Total Estimated Annual O&M Cost: Teku 1 milj NPR Balaju North 5 milj NPR Balaju South 5 milj NPR
Index Scores:
Teku
Balaju S.
Balaju N
.
Project Purpose 7.1 8.1 7.1 Public Response 6.8 6.4 5.1 Environmental Impact 10 10 10 Socio‐Economic Impact 5.4 5.4 3.5 Feasibility 6.2 5.5 4.5 Scenario Scores
Teku
Balaju S.
Balaju N
.
Environmental 10 10 10 Economic 5.2 4.7 3.1 Revenue Generating 3.3 2.9 2.2 Social 7.5 7.5 6.1
EXAMPLE: PROJECT CASE STUDIES IN NEPAL
The following pages give some background on example projects in Kathmandu. They are meant to help illustrate the use of the toolkit in project prioritisation on local level. The information is based on the summary report of the CDIA team in Kathmandu (June 2009).
PROJECT: WASTE TRANSFER STATIONS Historically waste was composted by each household, and used in their fields. Since then societal changes result in some of the city's waste being dumped along rivers. This has significantly contributed to the very poor state of the city’s main transport corridor and has narrowed the width of the river channel. The existing banks are mostly waste. Presently the city has only one waste transfer facility at Teku. Urban development now surrounds this facility and residents continually complain about the operations, citing bad smell and windblown waster as their major concerns. Three possible alternatives were proposed to deal with the city’s increasing waste problem: ‐improvement of the existing facility at Teku ‐establishment of a new station at Balaju South ‐establishment of a new station at Balaju North
Potential Sites for Additional Transfer Station
Waste Transfer Stations for KMC
Teku
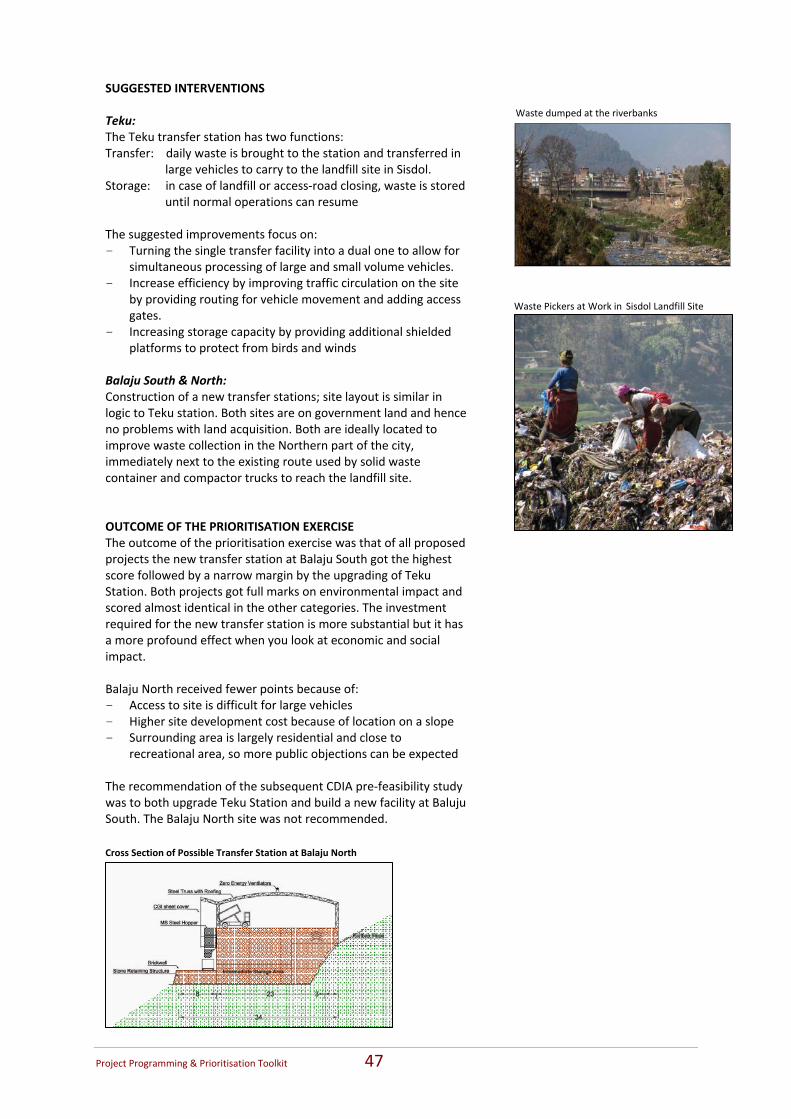
Project Programming & Prioritisation Toolkit 47
Waste Pickers at Work in Sisdol Landfill Site
SUGGESTED INTERVENTIONS Teku: The Teku transfer station has two functions: Transfer: daily waste is brought to the station and transferred in
large vehicles to carry to the landfill site in Sisdol. Storage: in case of landfill or access‐road closing, waste is stored
until normal operations can resume The suggested improvements focus on: - Turning the single transfer facility into a dual one to allow for
simultaneous processing of large and small volume vehicles. - Increase efficiency by improving traffic circulation on the site
by providing routing for vehicle movement and adding access gates.
- Increasing storage capacity by providing additional shielded platforms to protect from birds and winds
Balaju South & North: Construction of a new transfer stations; site layout is similar in logic to Teku station. Both sites are on government land and hence no problems with land acquisition. Both are ideally located to improve waste collection in the Northern part of the city, immediately next to the existing route used by solid waste container and compactor trucks to reach the landfill site. OUTCOME OF THE PRIORITISATION EXERCISE The outcome of the prioritisation exercise was that of all proposed projects the new transfer station at Balaju South got the highest score followed by a narrow margin by the upgrading of Teku Station. Both projects got full marks on environmental impact and scored almost identical in the other categories. The investment required for the new transfer station is more substantial but it has a more profound effect when you look at economic and social impact. Balaju North received fewer points because of: - Access to site is difficult for large vehicles - Higher site development cost because of location on a slope - Surrounding area is largely residential and close to
recreational area, so more public objections can be expected The recommendation of the subsequent CDIA pre‐feasibility study was to both upgrade Teku Station and build a new facility at Baluju South. The Balaju North site was not recommended.
Waste dumped at the riverbanks
Cross Section of Possible Transfer Station at Balaju North
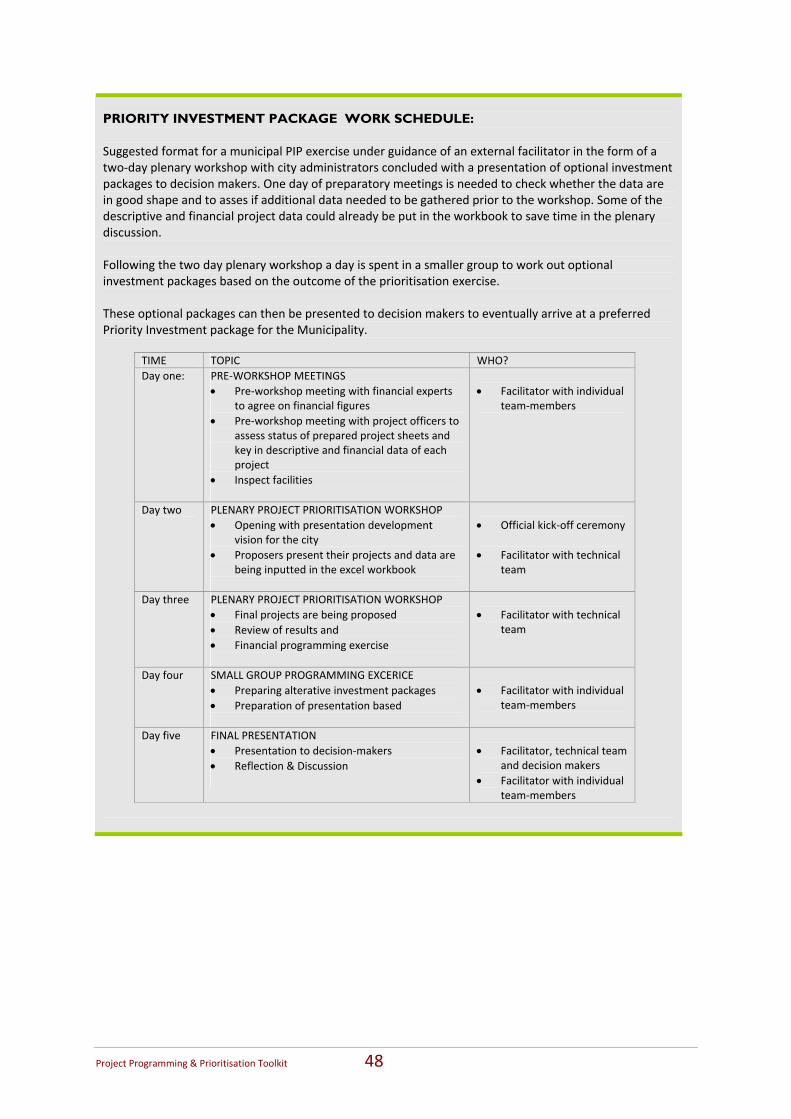
Project Programming & Prioritisation Toolkit 48
PRIORITY INVESTMENT PACKAGE WORK SCHEDULE: Suggested format for a municipal PIP exercise under guidance of an external facilitator in the form of a two‐day plenary workshop with city administrators concluded with a presentation of optional investment packages to decision makers. One day of preparatory meetings is needed to check whether the data are in good shape and to asses if additional data needed to be gathered prior to the workshop. Some of the descriptive and financial project data could already be put in the workbook to save time in the plenary discussion. Following the two day plenary workshop a day is spent in a smaller group to work out optional investment packages based on the outcome of the prioritisation exercise. These optional packages can then be presented to decision makers to eventually arrive at a preferred Priority Investment package for the Municipality.
TIME TOPIC WHO? Day one: PRE‐WORKSHOP MEETINGS
• Pre‐workshop meeting with financial experts to agree on financial figures
• Pre‐workshop meeting with project officers to assess status of prepared project sheets and key in descriptive and financial data of each project
• Inspect facilities
• Facilitator with individual
team‐members
Day two PLENARY PROJECT PRIORITISATION WORKSHOP • Opening with presentation development
vision for the city • Proposers present their projects and data are
being inputted in the excel workbook
• Official kick‐off ceremony • Facilitator with technical
team
Day three PLENARY PROJECT PRIORITISATION WORKSHOP • Final projects are being proposed • Review of results and • Financial programming exercise
• Facilitator with technical
team
Day four SMALL GROUP PROGRAMMING EXCERICE • Preparing alterative investment packages • Preparation of presentation based
• Facilitator with individual
team‐members
Day five FINAL PRESENTATION • Presentation to decision‐makers • Reflection & Discussion
• Facilitator, technical team
and decision makers • Facilitator with individual
team‐members
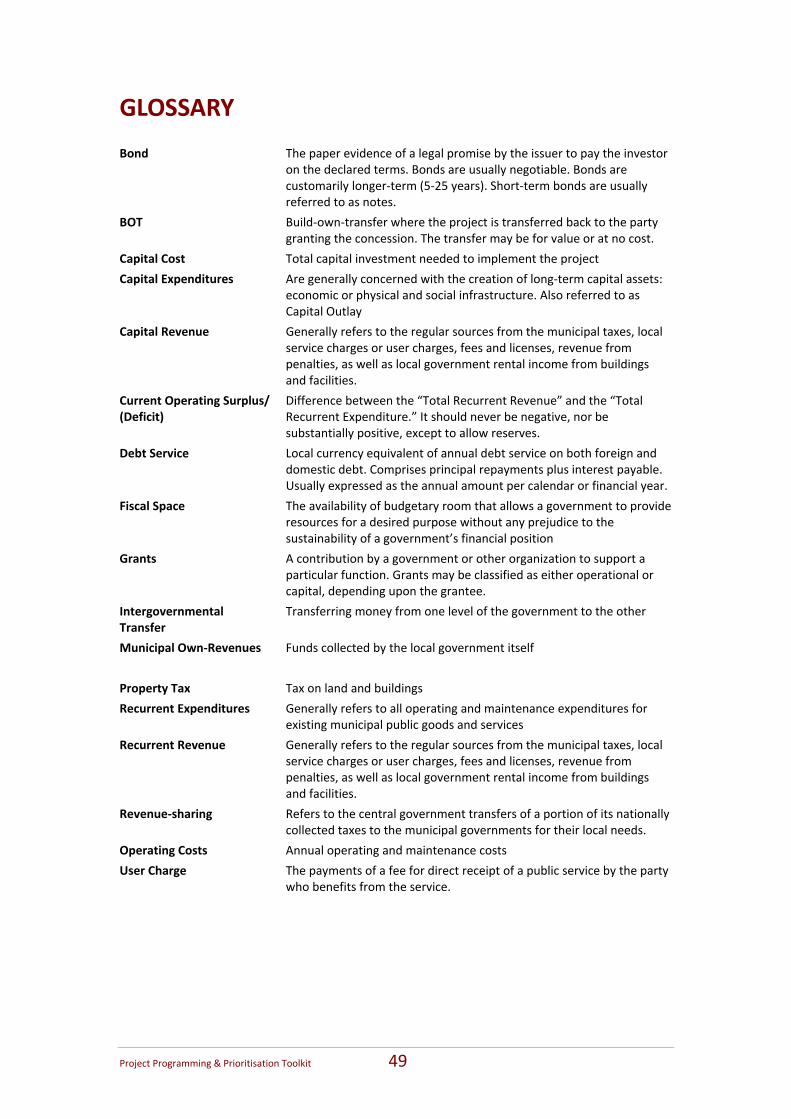
Project Programming & Prioritisation Toolkit 49
GLOSSARY Bond
The paper evidence of a legal promise by the issuer to pay the investor on the declared terms. Bonds are usually negotiable. Bonds are customarily longer‐term (5‐25 years). Short‐term bonds are usually referred to as notes.
BOT Build‐own‐transfer where the project is transferred back to the party granting the concession. The transfer may be for value or at no cost.
Capital Cost Total capital investment needed to implement the project
Capital Expenditures Are generally concerned with the creation of long‐term capital assets: economic or physical and social infrastructure. Also referred to as Capital Outlay
Capital Revenue Generally refers to the regular sources from the municipal taxes, local service charges or user charges, fees and licenses, revenue from penalties, as well as local government rental income from buildings and facilities.
Current Operating Surplus/ (Deficit)
Difference between the “Total Recurrent Revenue” and the “Total Recurrent Expenditure.” It should never be negative, nor be substantially positive, except to allow reserves.
Debt Service Local currency equivalent of annual debt service on both foreign and domestic debt. Comprises principal repayments plus interest payable. Usually expressed as the annual amount per calendar or financial year.
Fiscal Space The availability of budgetary room that allows a government to provide resources for a desired purpose without any prejudice to the sustainability of a government’s financial position
Grants A contribution by a government or other organization to support a particular function. Grants may be classified as either operational or capital, depending upon the grantee.
Intergovernmental Transfer
Transferring money from one level of the government to the other
Municipal Own‐Revenues Funds collected by the local government itself
Property Tax Tax on land and buildings
Recurrent Expenditures Generally refers to all operating and maintenance expenditures for existing municipal public goods and services
Recurrent Revenue Generally refers to the regular sources from the municipal taxes, local service charges or user charges, fees and licenses, revenue from penalties, as well as local government rental income from buildings and facilities.
Revenue‐sharing Refers to the central government transfers of a portion of its nationally collected taxes to the municipal governments for their local needs.
Operating Costs Annual operating and maintenance costs
User Charge The payments of a fee for direct receipt of a public service by the party who benefits from the service.
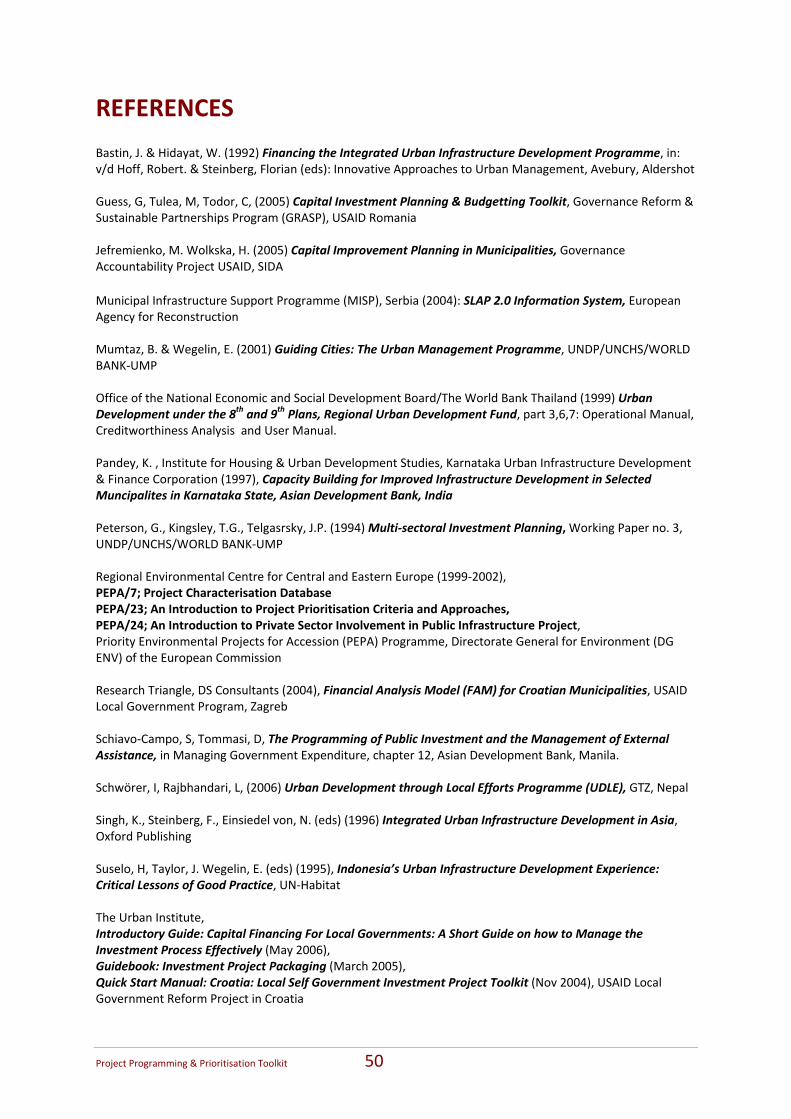
Project Programming & Prioritisation Toolkit 50
REFERENCES Bastin, J. & Hidayat, W. (1992) Financing the Integrated Urban Infrastructure Development Programme, in: v/d Hoff, Robert. & Steinberg, Florian (eds): Innovative Approaches to Urban Management, Avebury, Aldershot Guess, G, Tulea, M, Todor, C, (2005) Capital Investment Planning & Budgetting Toolkit, Governance Reform & Sustainable Partnerships Program (GRASP), USAID Romania Jefremienko, M. Wolkska, H. (2005) Capital Improvement Planning in Municipalities, Governance Accountability Project USAID, SIDA Municipal Infrastructure Support Programme (MISP), Serbia (2004): SLAP 2.0 Information System, European Agency for Reconstruction Mumtaz, B. & Wegelin, E. (2001) Guiding Cities: The Urban Management Programme, UNDP/UNCHS/WORLD BANK‐UMP Office of the National Economic and Social Development Board/The World Bank Thailand (1999) Urban Development under the 8th and 9th Plans, Regional Urban Development Fund, part 3,6,7: Operational Manual, Creditworthiness Analysis and User Manual. Pandey, K. , Institute for Housing & Urban Development Studies, Karnataka Urban Infrastructure Development & Finance Corporation (1997), Capacity Building for Improved Infrastructure Development in Selected Muncipalites in Karnataka State, Asian Development Bank, India Peterson, G., Kingsley, T.G., Telgasrsky, J.P. (1994) Multi‐sectoral Investment Planning, Working Paper no. 3, UNDP/UNCHS/WORLD BANK‐UMP Regional Environmental Centre for Central and Eastern Europe (1999‐2002), PEPA/7; Project Characterisation Database PEPA/23; An Introduction to Project Prioritisation Criteria and Approaches, PEPA/24; An Introduction to Private Sector Involvement in Public Infrastructure Project, Priority Environmental Projects for Accession (PEPA) Programme, Directorate General for Environment (DG ENV) of the European Commission Research Triangle, DS Consultants (2004), Financial Analysis Model (FAM) for Croatian Municipalities, USAID Local Government Program, Zagreb Schiavo‐Campo, S, Tommasi, D, The Programming of Public Investment and the Management of External Assistance, in Managing Government Expenditure, chapter 12, Asian Development Bank, Manila. Schwörer, I, Rajbhandari, L, (2006) Urban Development through Local Efforts Programme (UDLE), GTZ, Nepal Singh, K., Steinberg, F., Einsiedel von, N. (eds) (1996) Integrated Urban Infrastructure Development in Asia, Oxford Publishing Suselo, H, Taylor, J. Wegelin, E. (eds) (1995), Indonesia’s Urban Infrastructure Development Experience: Critical Lessons of Good Practice, UN‐Habitat The Urban Institute, Introductory Guide: Capital Financing For Local Governments: A Short Guide on how to Manage the Investment Process Effectively (May 2006), Guidebook: Investment Project Packaging (March 2005), Quick Start Manual: Croatia: Local Self Government Investment Project Toolkit (Nov 2004), USAID Local Government Reform Project in Croatia