Embed Size (px)
Citation preview
Security Status ReportingKris BudnikSLVA Information Security
Agenda• Introductions, objectives and background
• Selecting the target environment
• Defining the scope and language of security monitoring
• Setting baselines and benchmarks
• Defining metrics
• Understanding your audience and their priorities
• Building dashboards and reports
Introductions, Objectives and Background

Introductions…• Who are you?
• The industry you work in?
• What do you do?
• Why are you here?
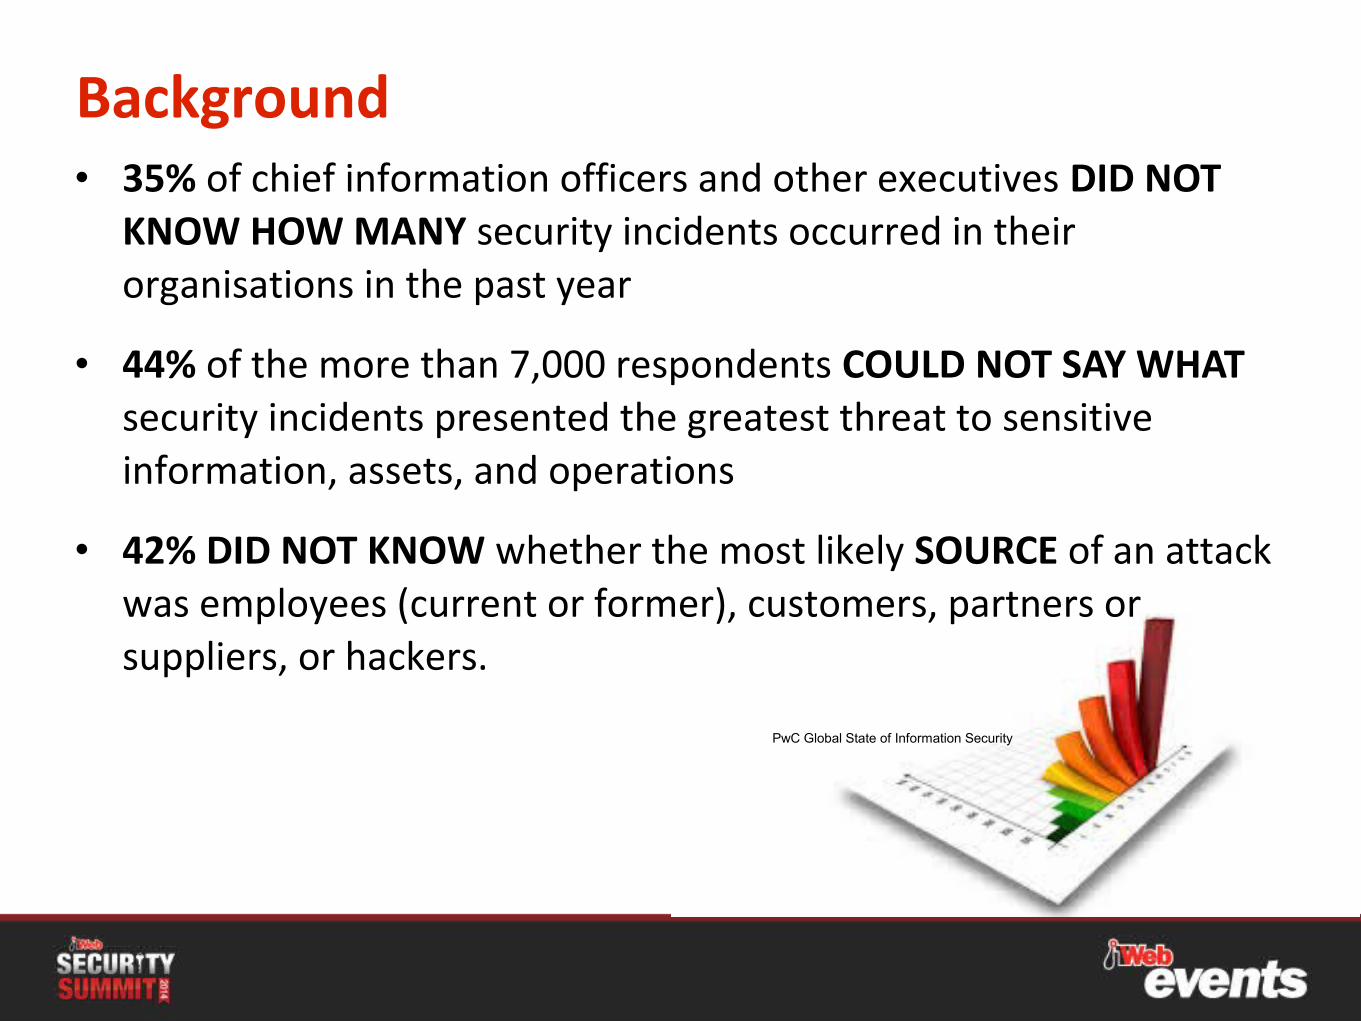
Background• 35% of chief information officers and other executives DID NOT
KNOW HOW MANY security incidents occurred in their organisations in the past year
• 44% of the more than 7,000 respondents COULD NOT SAY WHAT security incidents presented the greatest threat to sensitive information, assets, and operations
• 42% DID NOT KNOW whether the most likely SOURCE of an attack was employees (current or former), customers, partners or suppliers, or hackers.
PwC Global State of Information Security
Security Monitoring
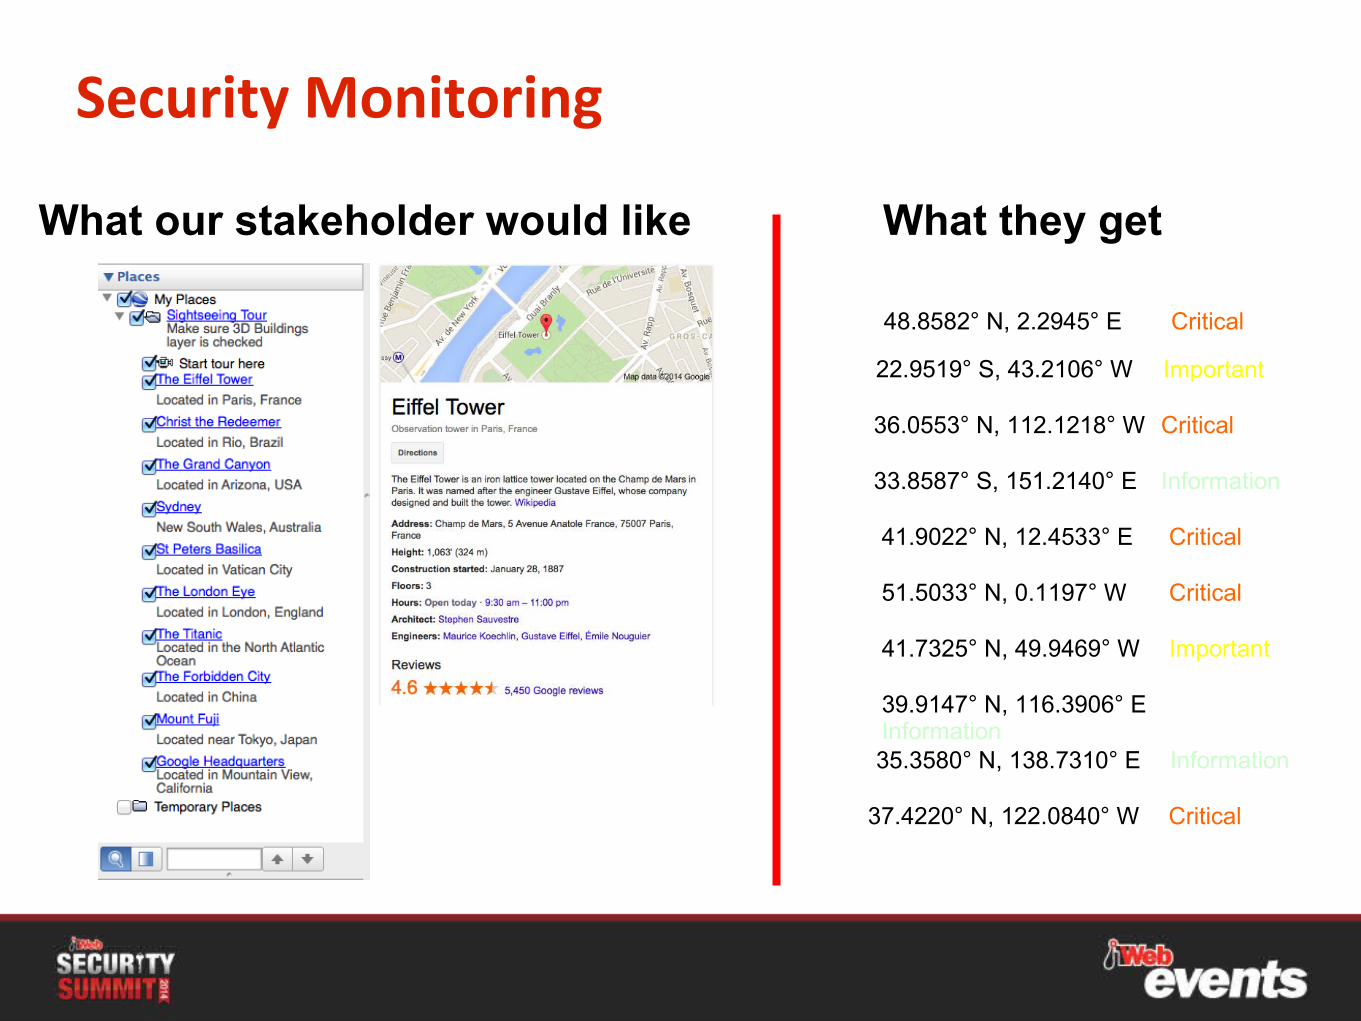
What our stakeholder would like What they get
48.8582° N, 2.2945° E Critical
22.9519° S, 43.2106° W Important
36.0553° N, 112.1218° W Critical
33.8587° S, 151.2140° E Information
41.9022° N, 12.4533° E Critical
51.5033° N, 0.1197° W Critical
41.7325° N, 49.9469° W Important
39.9147° N, 116.3906° E Information35.3580° N, 138.7310° E Information
37.4220° N, 122.0840° W Critical
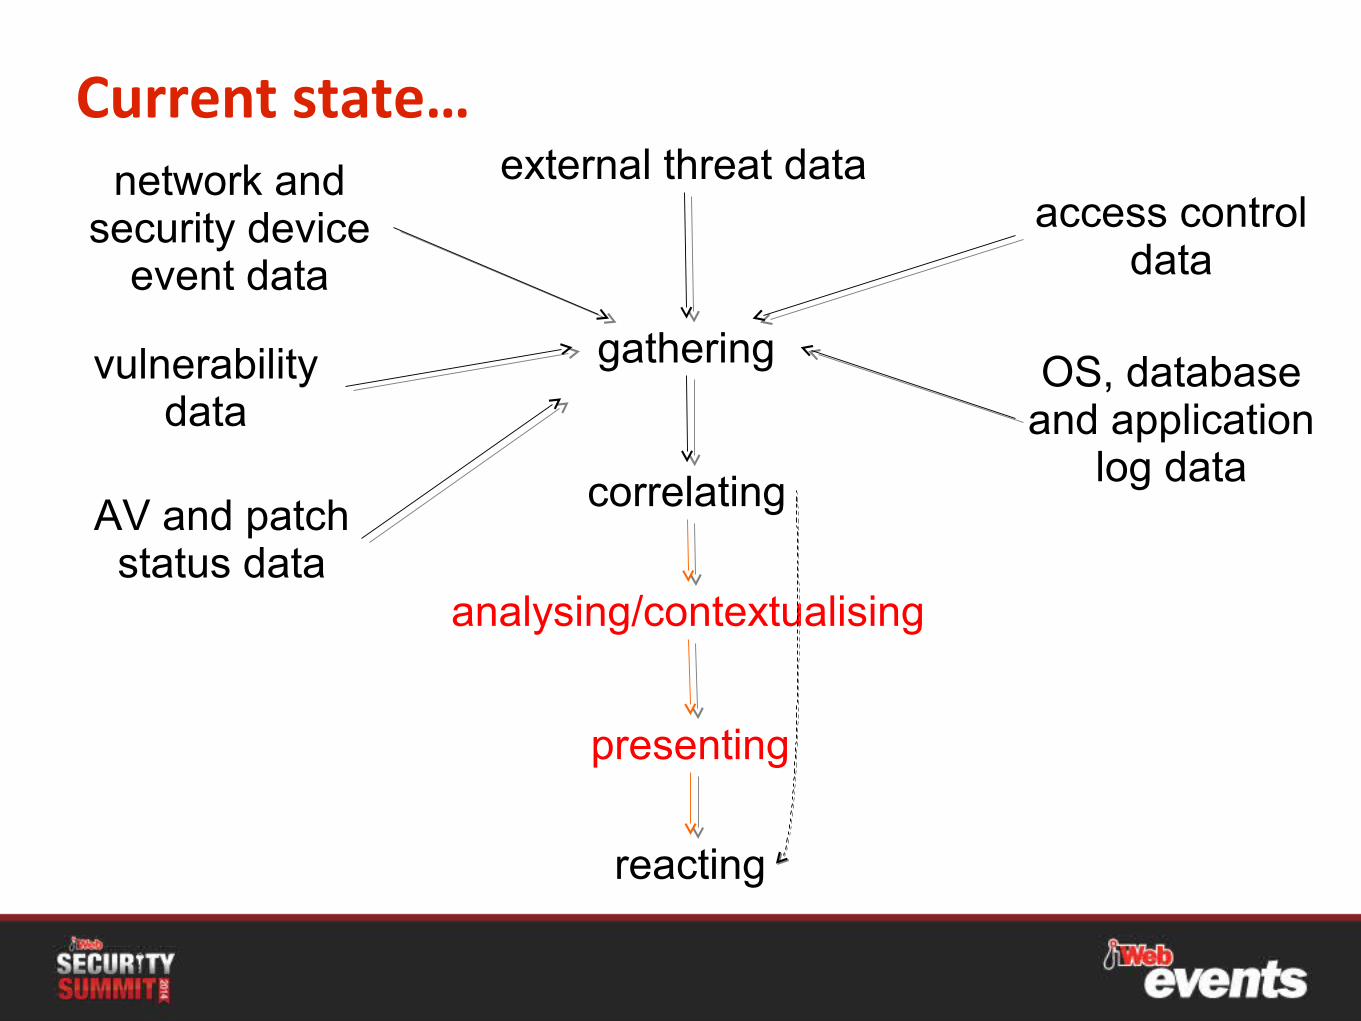
Current state…network and
security device event data
access control data
vulnerability data
OS, database and application
log data
external threat data
gathering
correlating
presenting
reacting
AV and patch status data
analysing/contextualising
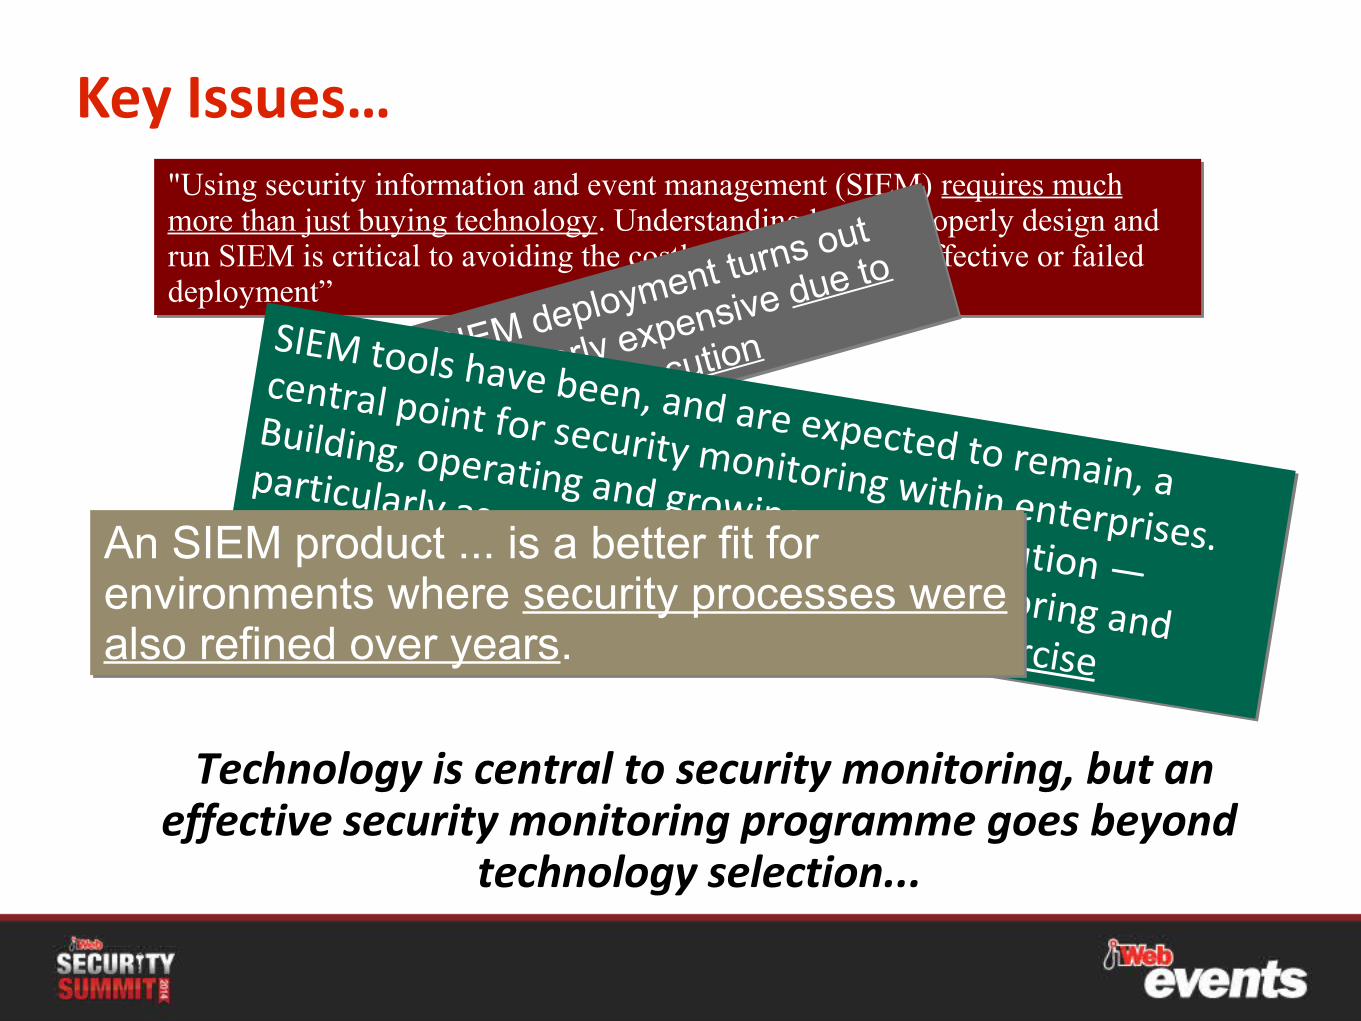
Key Issues…
Technology is central to security monitoring, but an effective security monitoring programme goes beyond
technology selection...
"Using security information and event management (SIEM) requires much more than just buying technology. Understanding how to properly design and run SIEM is critical to avoiding the costly mistake of an ineffective or failed deployment”
"Using security information and event management (SIEM) requires much more than just buying technology. Understanding how to properly design and run SIEM is critical to avoiding the costly mistake of an ineffective or failed deployment”
Many an SIEM deployment turns out
ineffective or overly expensive due to
poor planning and executionMany an SIEM deployment turns out
ineffective or overly expensive due to
poor planning and executionSIEM tools have been, and are expected to remain, a
central point for security monitoring within enterprises.
Building, operating and growing an SIEM solution —
particularly as part of a larger security monitoring and
assessment architecture — is not an easy exercise
SIEM tools have been, and are expected to remain, a
central point for security monitoring within enterprises.
Building, operating and growing an SIEM solution —
particularly as part of a larger security monitoring and
assessment architecture — is not an easy exercise
An SIEM product ... is a better fit for environments where security processes were also refined over years.
An SIEM product ... is a better fit for environments where security processes were also refined over years.
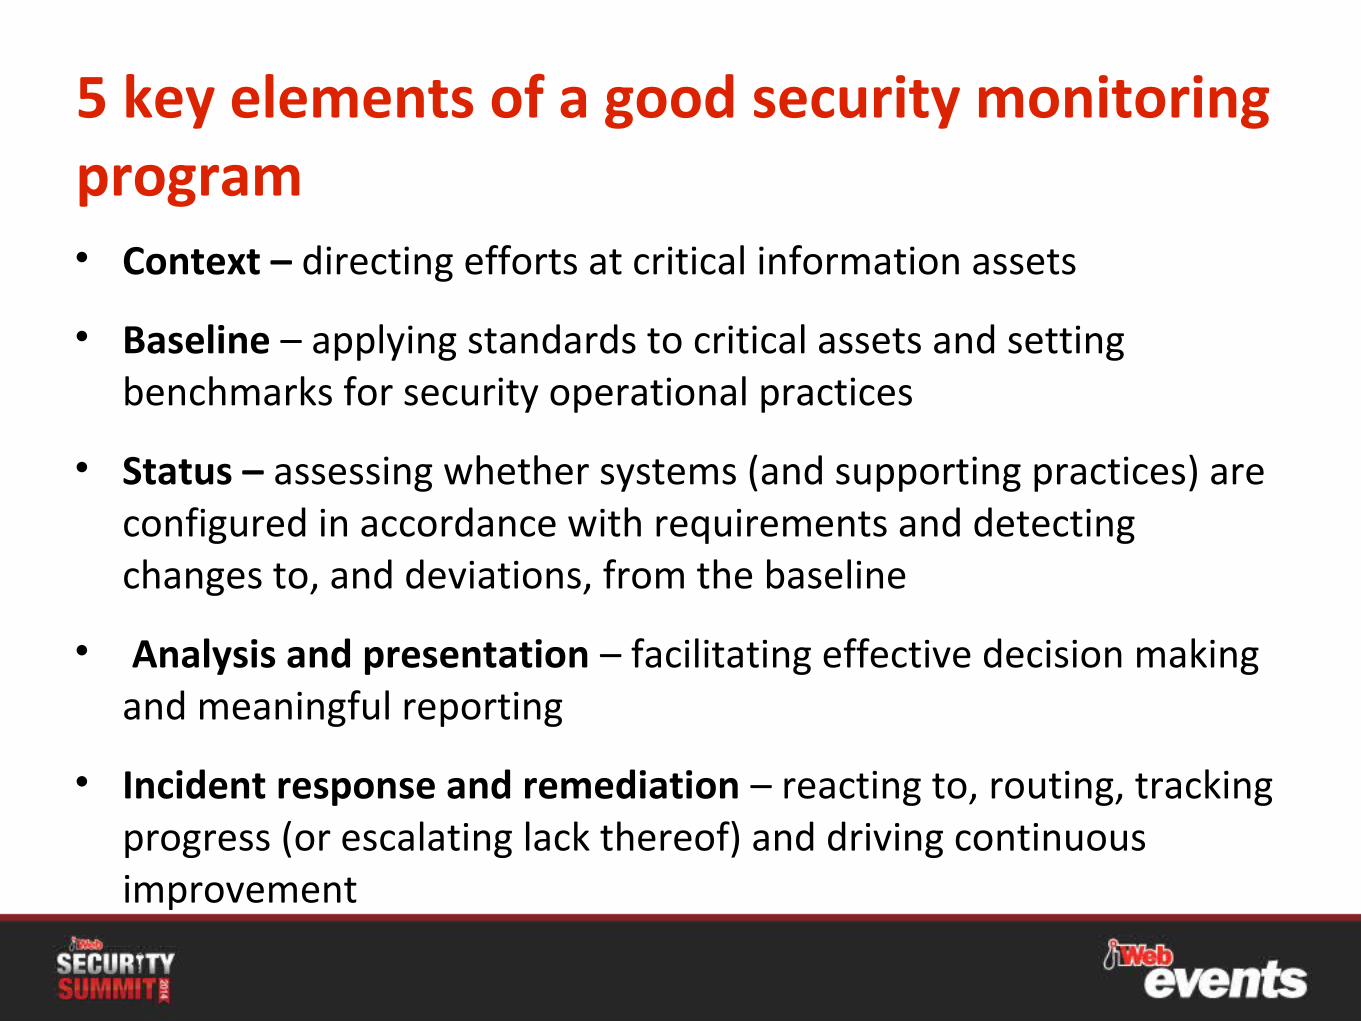
5 key elements of a good security monitoring program• Context – directing efforts at critical information assets
• Baseline – applying standards to critical assets and setting benchmarks for security operational practices
• Status – assessing whether systems (and supporting practices) are configured in accordance with requirements and detecting changes to, and deviations, from the baseline
• Analysis and presentation – facilitating effective decision making and meaningful reporting
• Incident response and remediation – reacting to, routing, tracking progress (or escalating lack thereof) and driving continuous improvement
Selecting the Target Environment
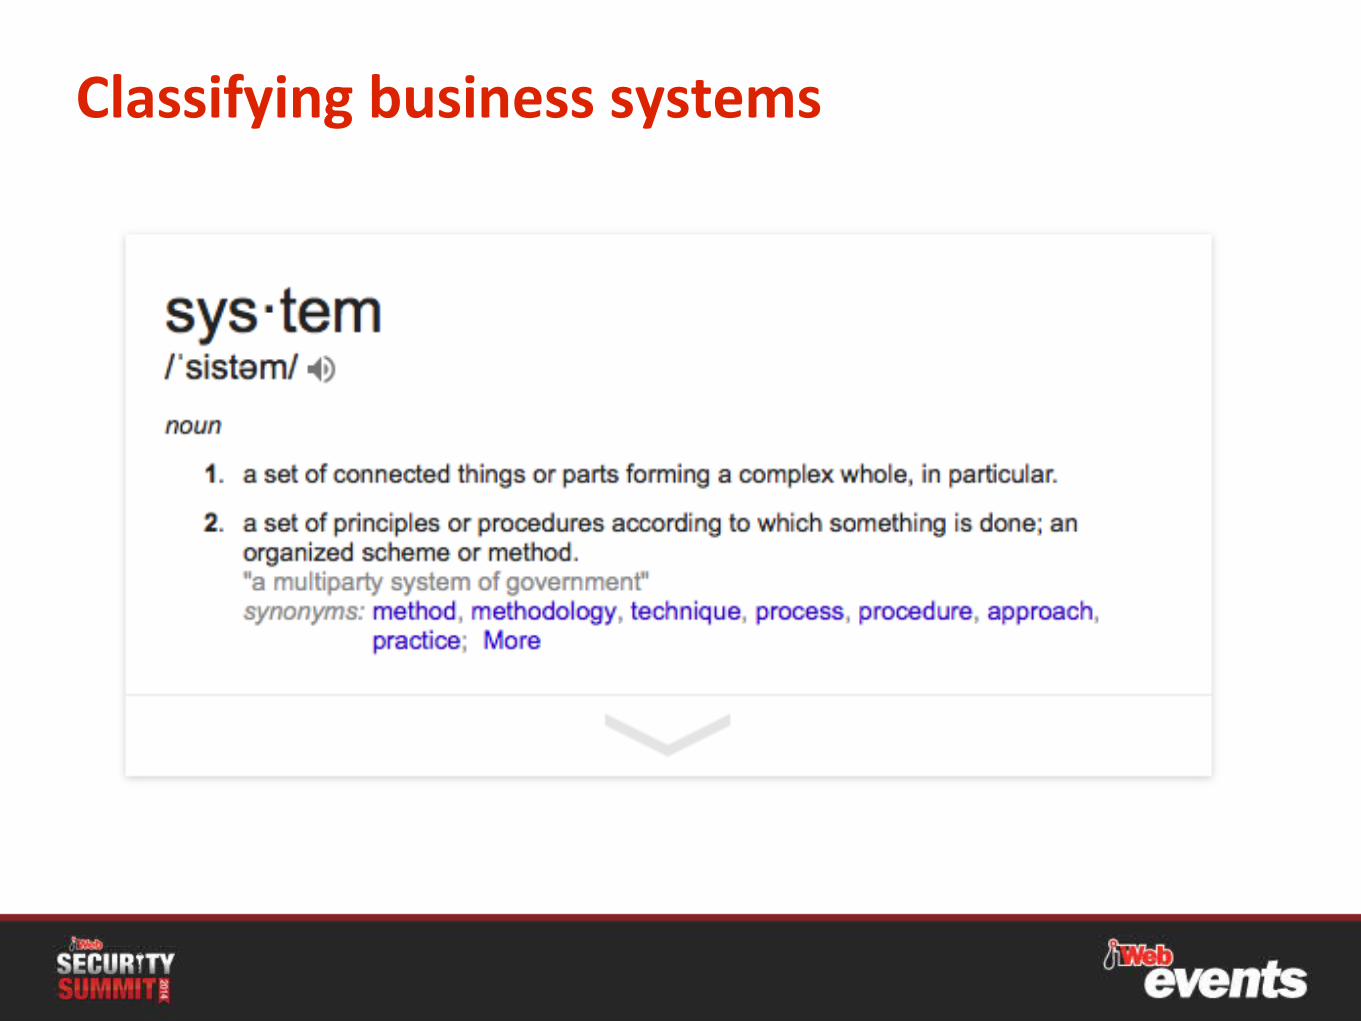
Classifying business systems
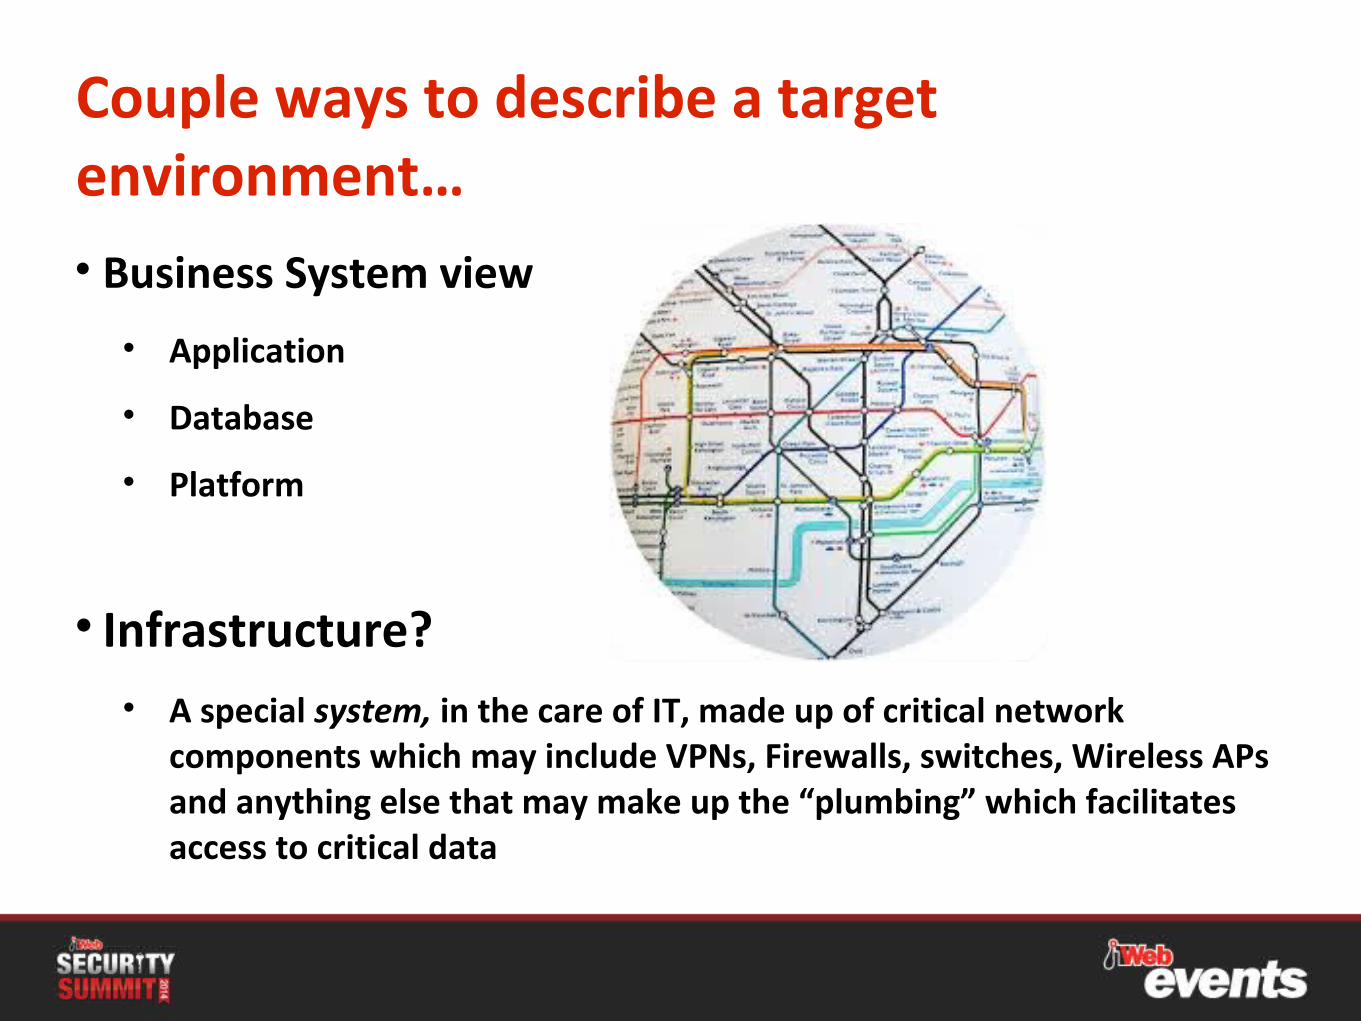
Couple ways to describe a target environment…• Business System view
• Application
• Database
• Platform
• Infrastructure?• A special system, in the care of IT, made up of critical network
components which may include VPNs, Firewalls, switches, Wireless APs and anything else that may make up the “plumbing” which facilitates access to critical data
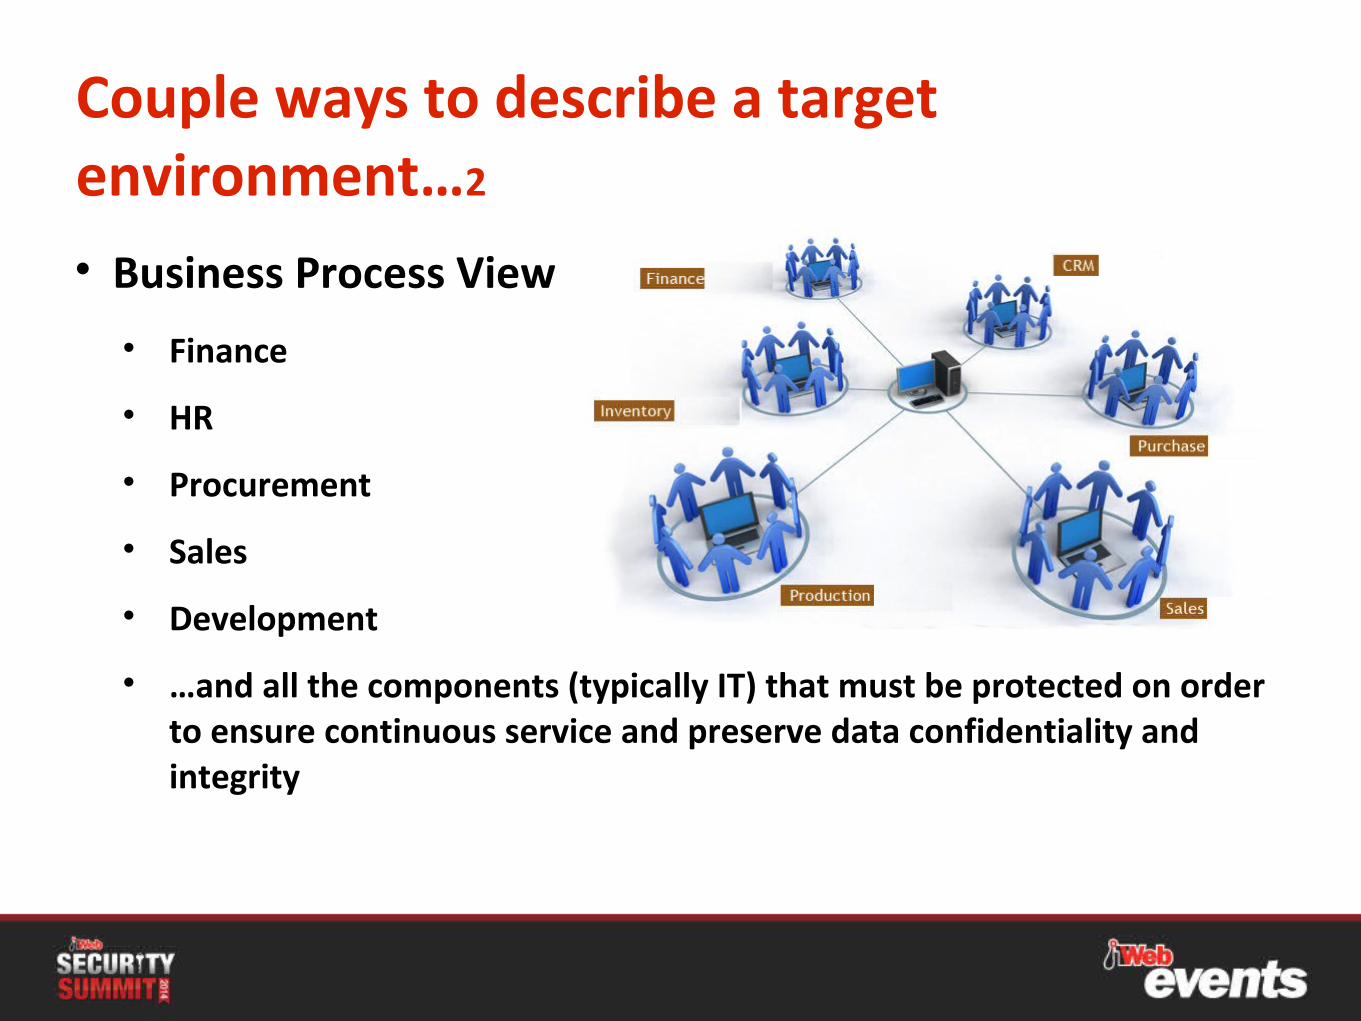
Couple ways to describe a target environment…2
• Business Process View
• Finance
• HR
• Procurement
• Sales
• Development
• …and all the components (typically IT) that must be protected on order to ensure continuous service and preserve data confidentiality and integrity
Prioritize security requirements
• Being able to identify which systems are most critical to business and why is key to the definition of the trget environment
• Start by agreeing a business impact reference against which systems (or processes) can be assessed
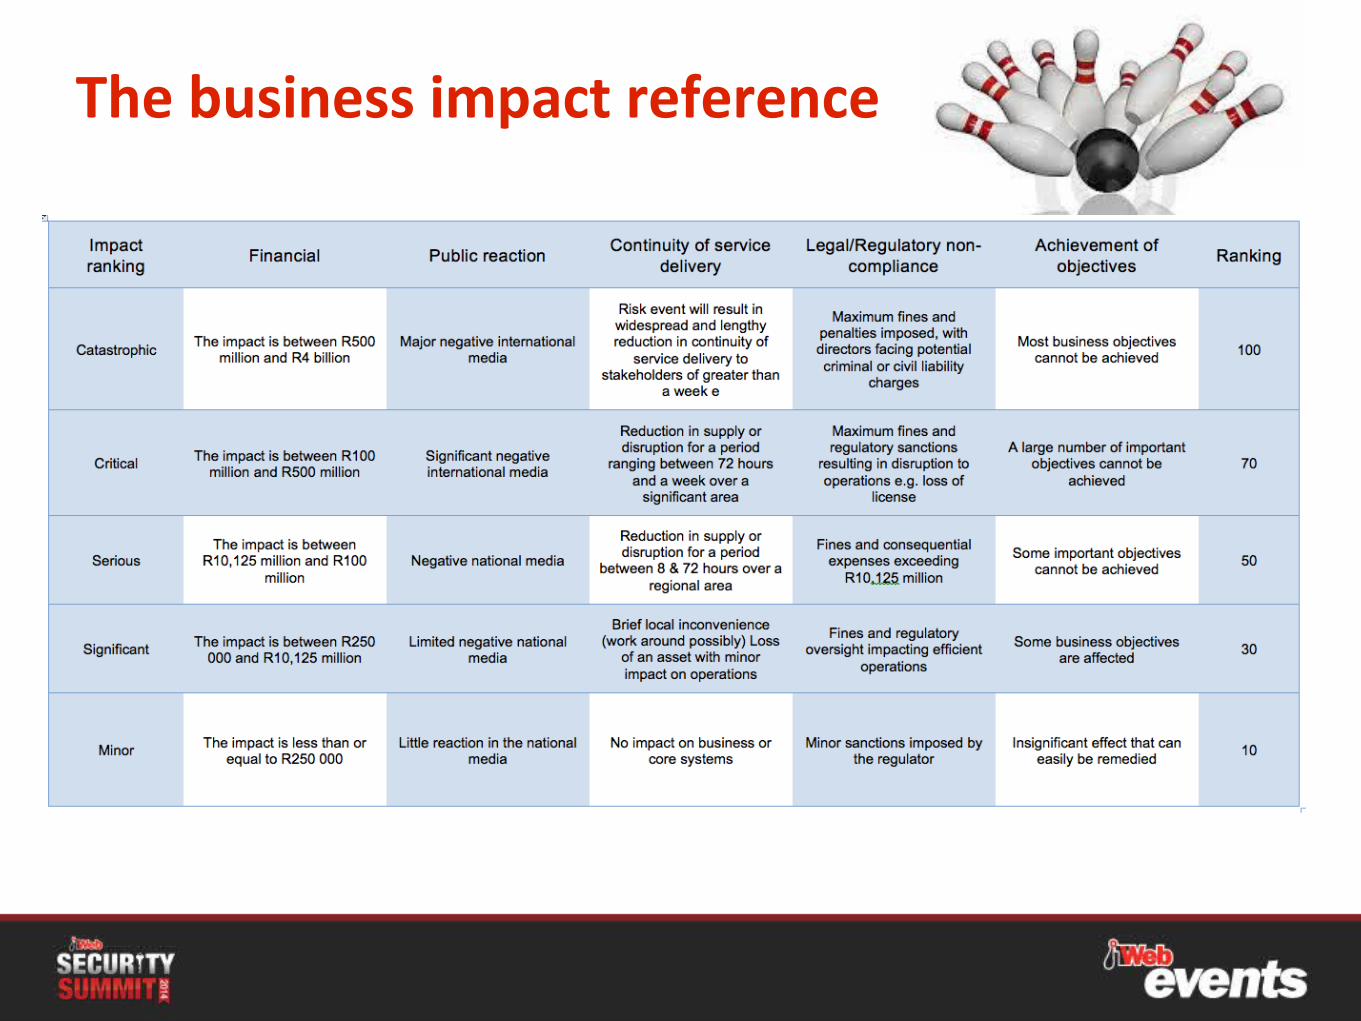
The business impact reference
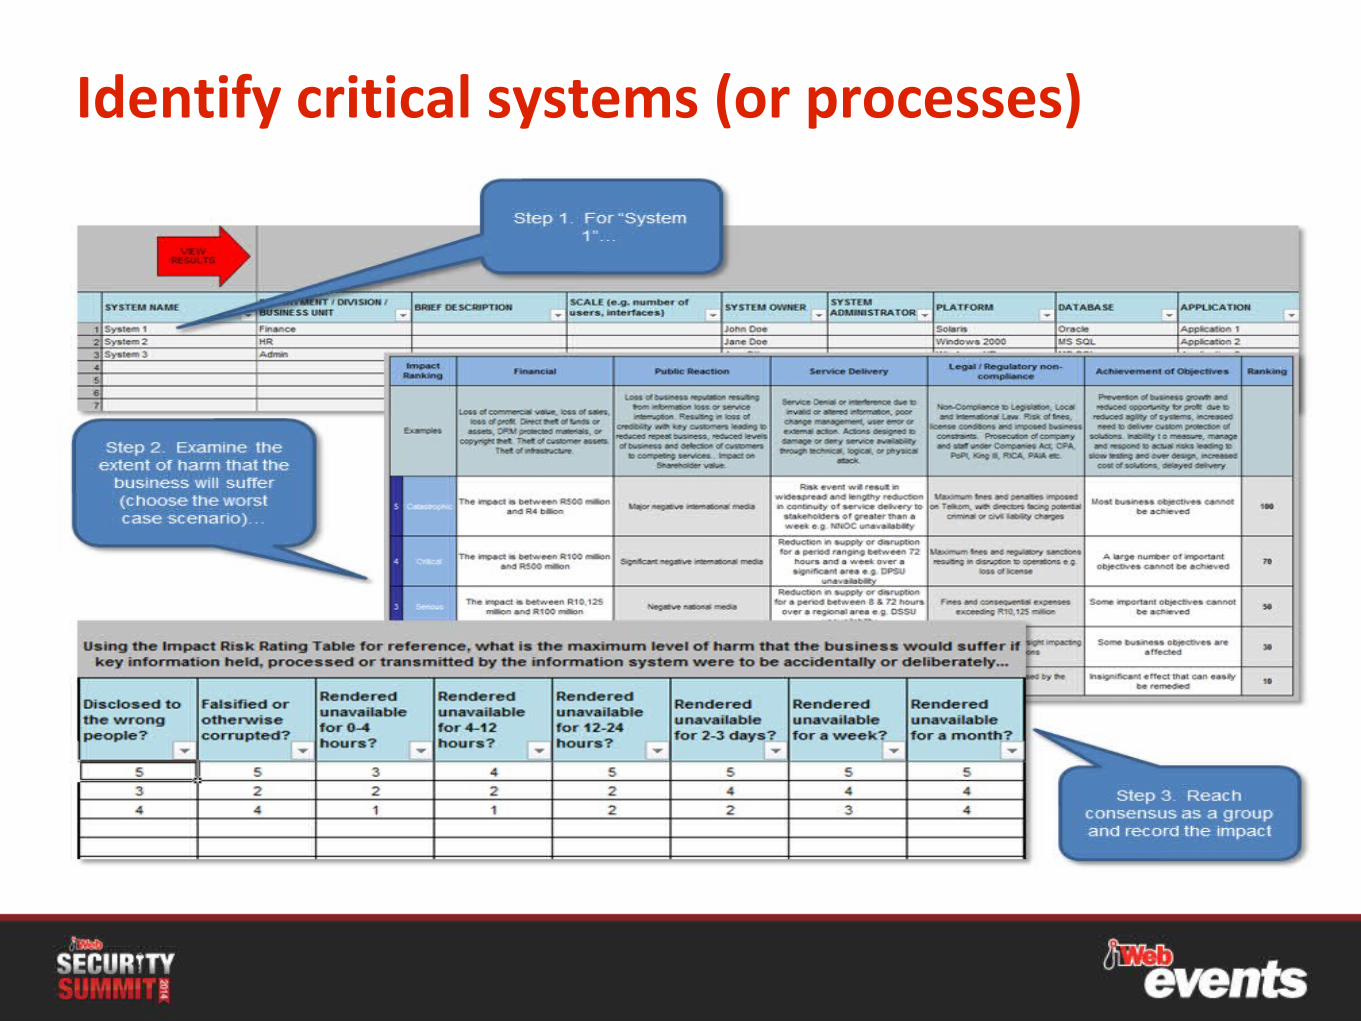
Identify critical systems (or processes)
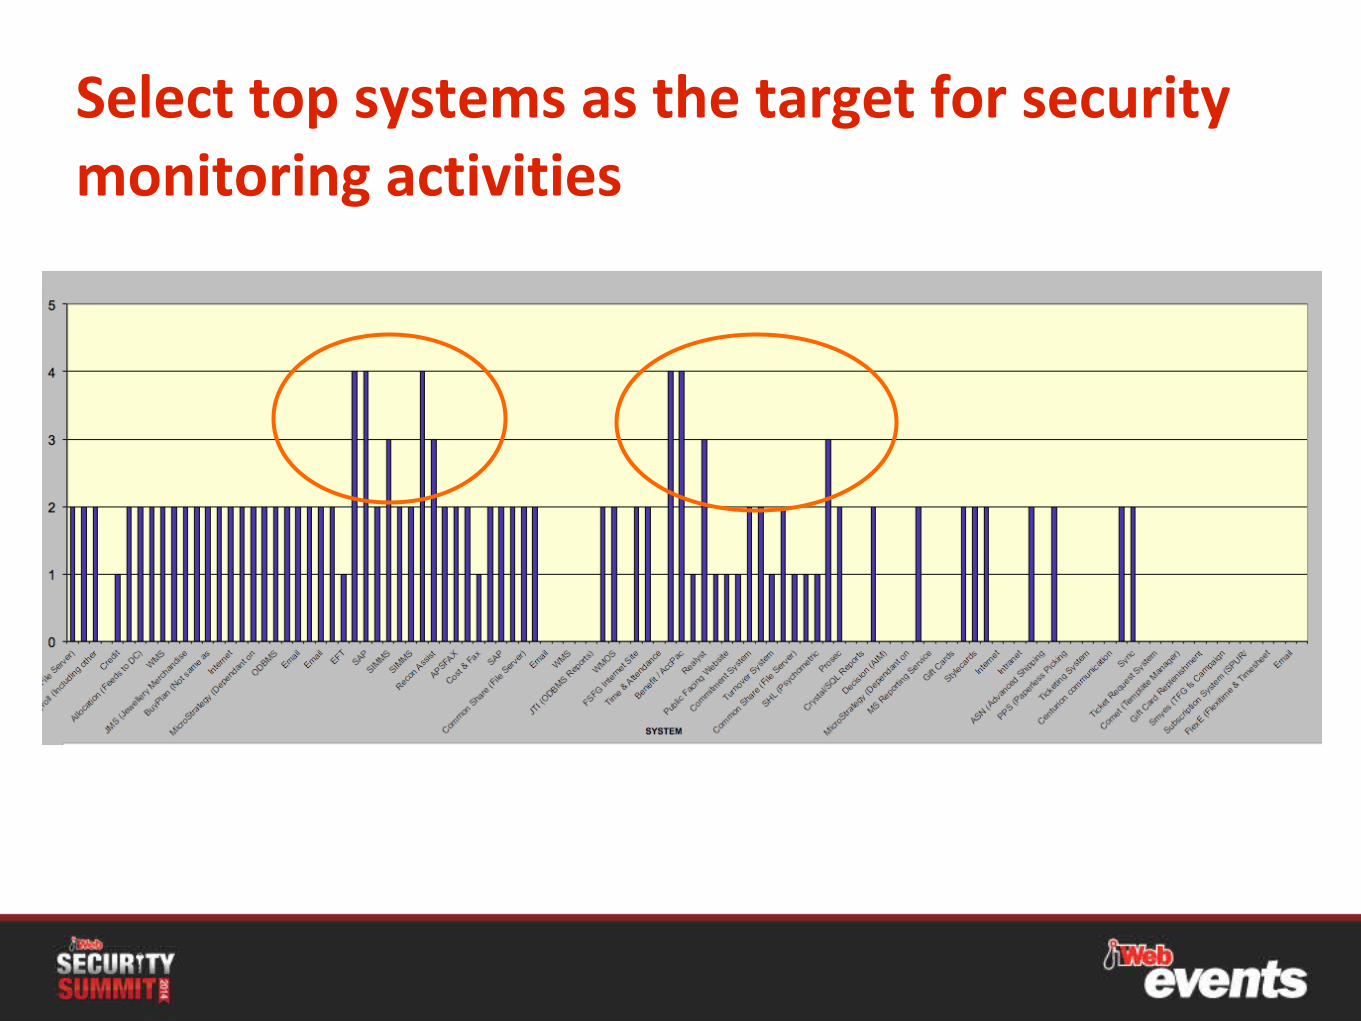
Select top systems as the target for security monitoring activities
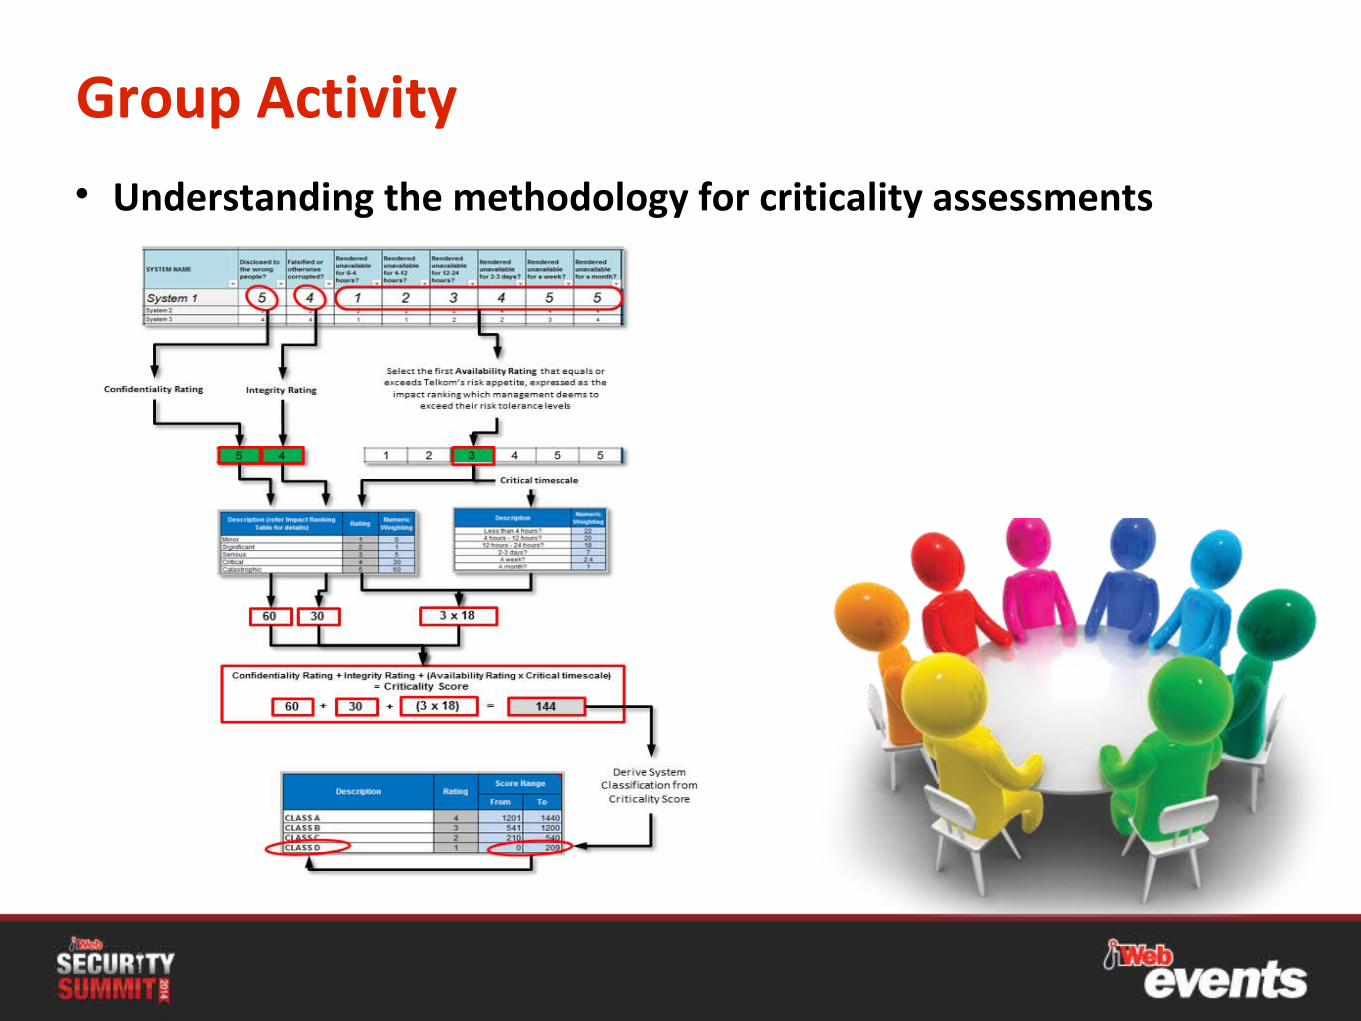
Group Activity• Understanding the methodology for criticality assessments
Defining the Scope and Language of Security Monitoring
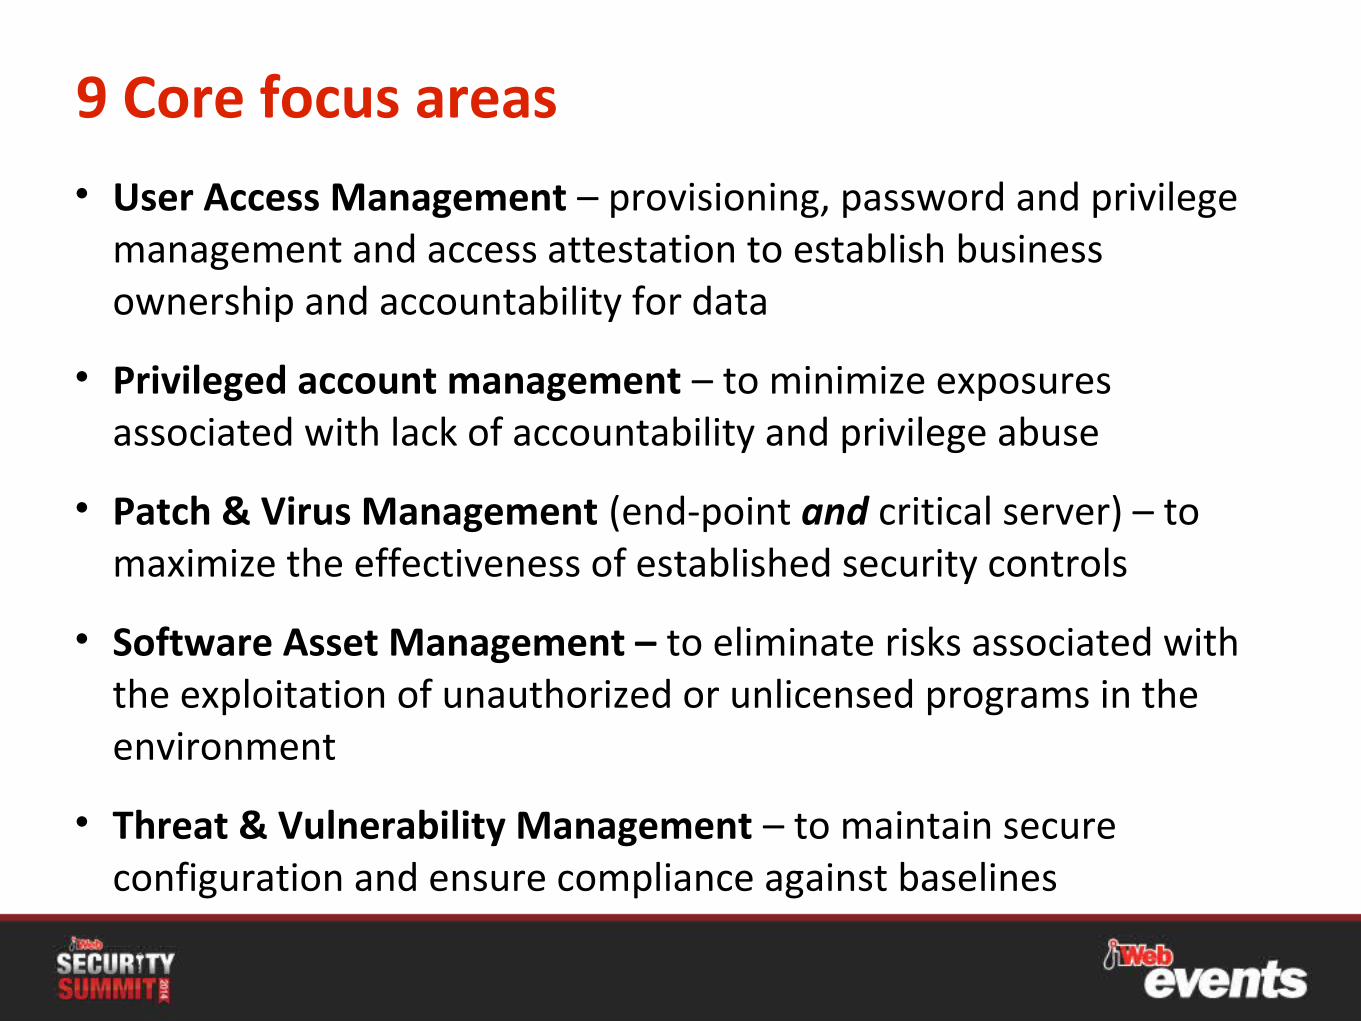
9 Core focus areas• User Access Management – provisioning, password and privilege
management and access attestation to establish business ownership and accountability for data
• Privileged account management – to minimize exposures associated with lack of accountability and privilege abuse
• Patch & Virus Management (end-point and critical server) – to maximize the effectiveness of established security controls
• Software Asset Management – to eliminate risks associated with the exploitation of unauthorized or unlicensed programs in the environment
• Threat & Vulnerability Management – to maintain secure configuration and ensure compliance against baselines
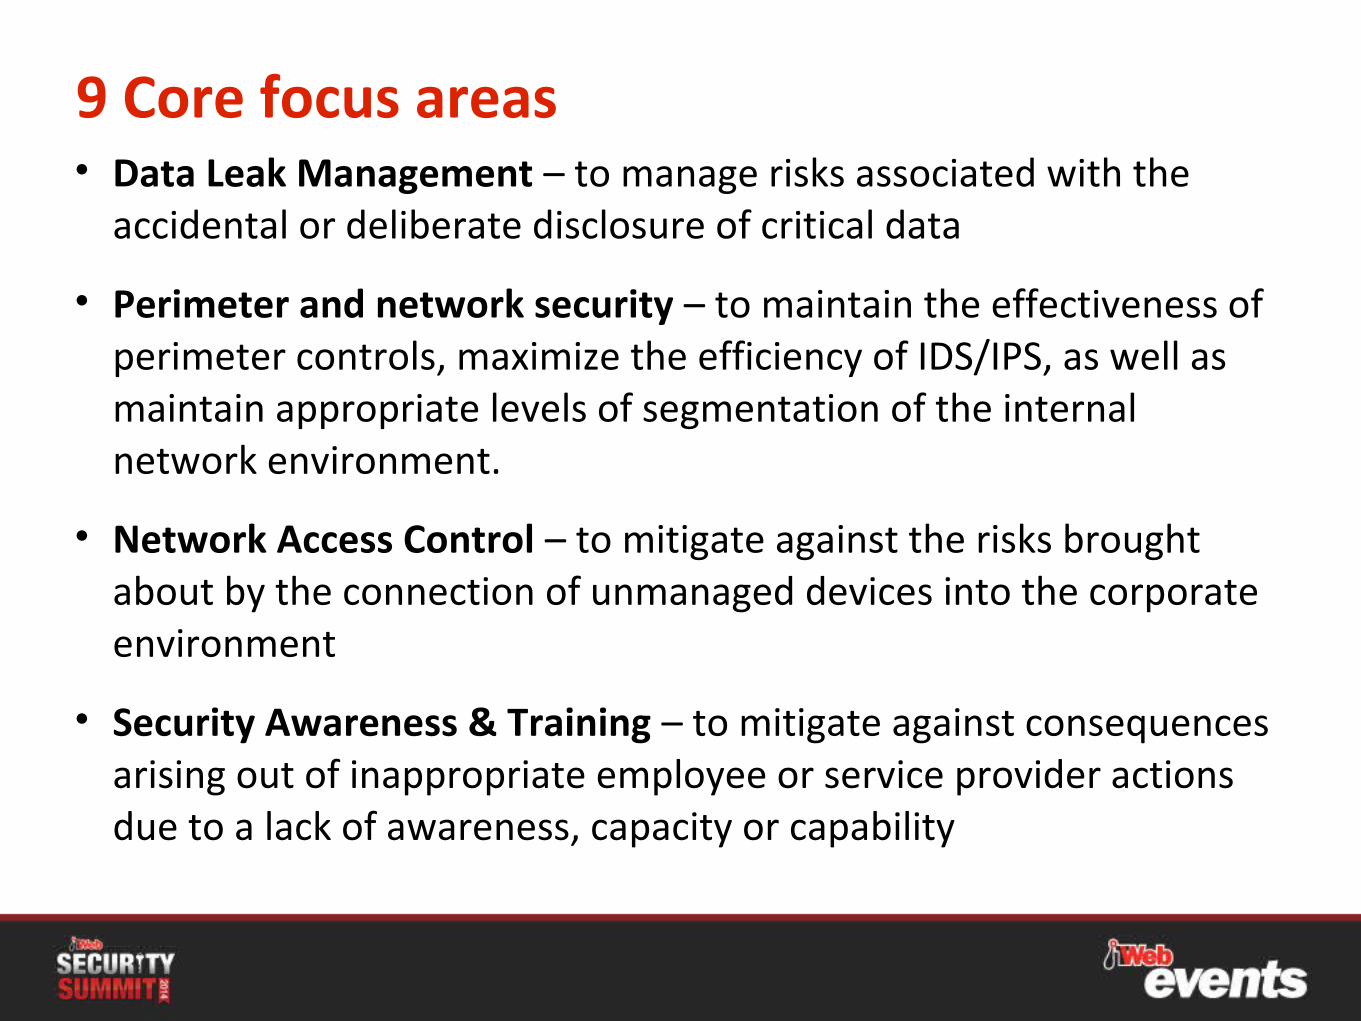
9 Core focus areas• Data Leak Management – to manage risks associated with the
accidental or deliberate disclosure of critical data
• Perimeter and network security – to maintain the effectiveness of perimeter controls, maximize the efficiency of IDS/IPS, as well as maintain appropriate levels of segmentation of the internal network environment.
• Network Access Control – to mitigate against the risks brought about by the connection of unmanaged devices into the corporate environment
• Security Awareness & Training – to mitigate against consequences arising out of inappropriate employee or service provider actions due to a lack of awareness, capacity or capability
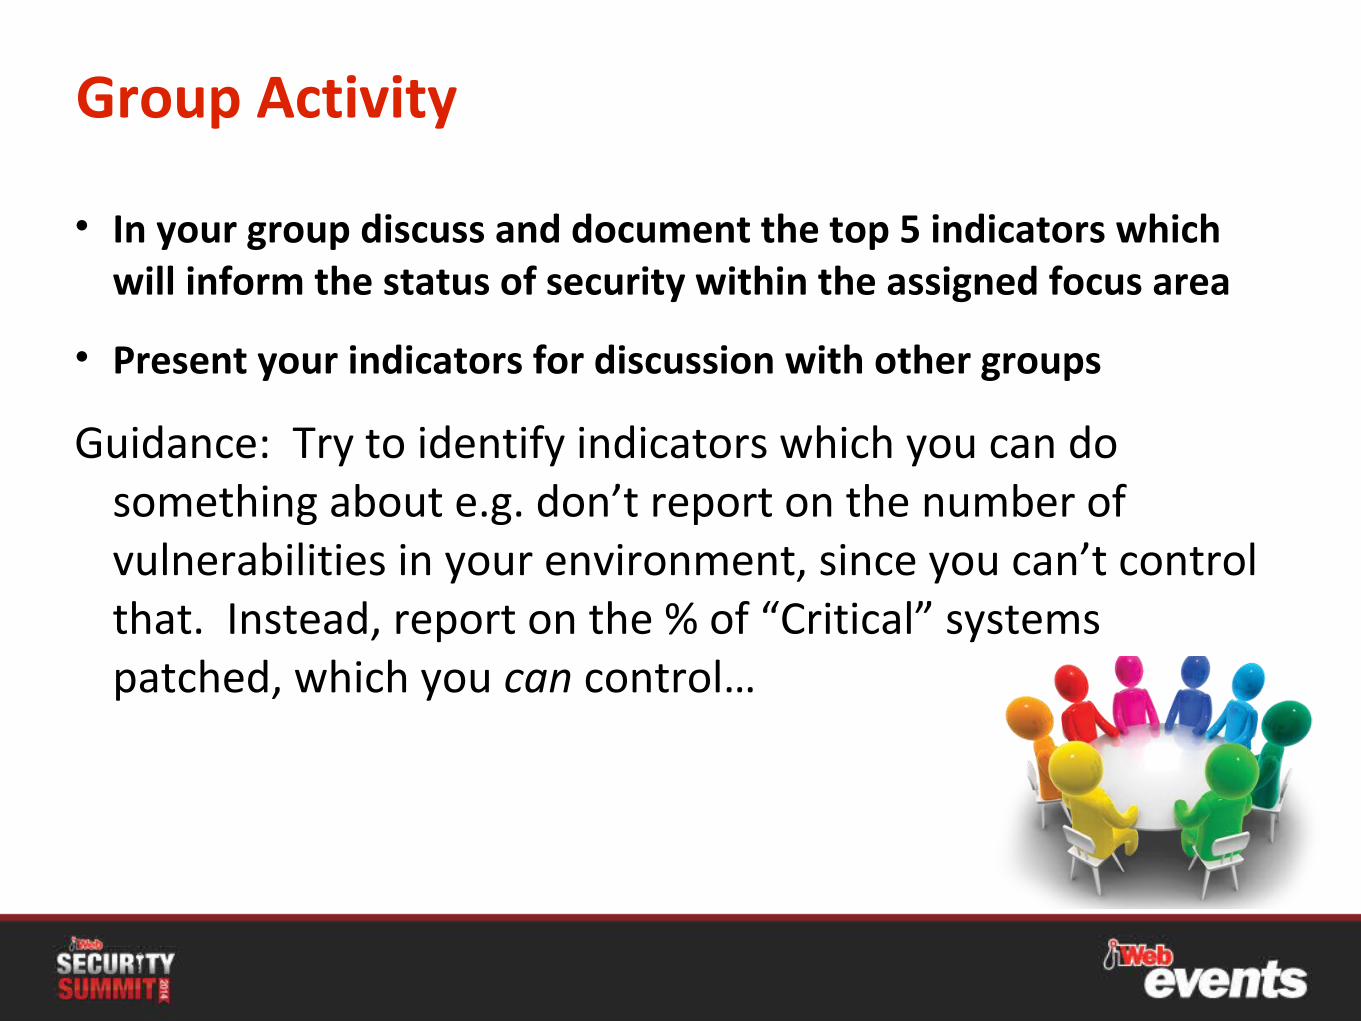
Group Activity
• In your group discuss and document the top 5 indicators which will inform the status of security within the assigned focus area
• Present your indicators for discussion with other groups
Guidance: Try to identify indicators which you can do something about e.g. don’t report on the number of vulnerabilities in your environment, since you can’t control that. Instead, report on the % of “Critical” systems patched, which you can control…
Setting Baselines and Benchmarks
Technical benchmarks
• Adopt the Center for Information Security Configuration Benchmarks
Available Free of Charge:
•85 Benchmark documents in PDF
•28 Security Metric Definitions in PDF
•Configuration Assessment Tools
•RSS Feed for CIS Downloads

Functional baselines
• Numerous sources for inspiration
• ISO 27002
• ISO 27004
• COBIT
• CIS Security Metrics
• SABSA
• ITIL
• PCI/DSS (useful even if you don’t process card data)
• Various legal and regulatory requirements

Critical factors to adopting best practices
• They lack context!
• Technical benchmarks should be seen as a reference only
• Same applies to standards and best practices…
• Baselines and benchmarks must be negotiated, simplified and defined according to the context, risk appetite, capability, capacity and culture of your specific organisation
Group Activity
• Review of selected source documents to gain a better understanding of content and applicability to your environment and Security Status Reporting in general
• Match to key performance indicators from previous exercise
Defining Metrics
Five characteristics of effective metrics
• Effective metrics must support the business’s goals, and the connection to those goals should be clear.
• They must be controllable.
• They must be quantitative
• They must be easy to collect and analyse
• They must be subject to trending. Tracking progress and setting targets is vital to get people to pay attention
Quantifying Security Status
• Leverage CVSS (Common Vulnerability Scoring Systems)
• Maintained by Forum of Incident Response and Security Teams (www.first.org/cvss)
• CVSS is composed of three metric groups:
• Base – represents the intrinsic and fundamental characteristics of a vulnerability that are constant over time and security environments
• Temporal – represents the characteristics of a vulnerability that change over time but not as a consequence of the security environment
• Environmental – represents the characteristics of a vulnerability that are relevant and unique to the security environment
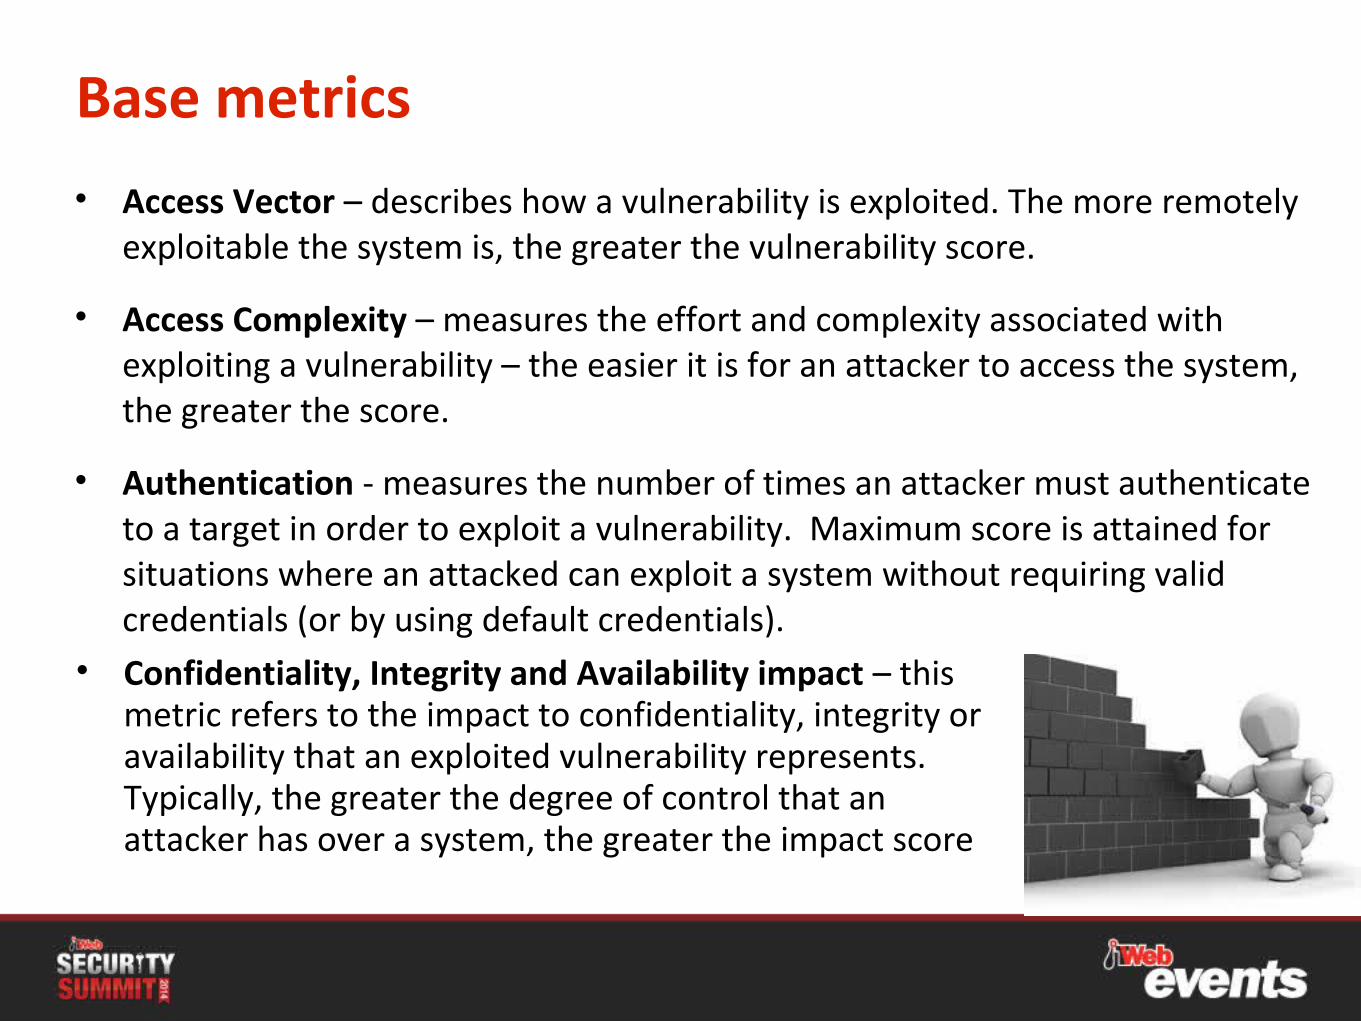
Base metrics
• Access Vector – describes how a vulnerability is exploited. The more remotely exploitable the system is, the greater the vulnerability score.
• Access Complexity – measures the effort and complexity associated with exploiting a vulnerability – the easier it is for an attacker to access the system, the greater the score.
• Authentication - measures the number of times an attacker must authenticate to a target in order to exploit a vulnerability. Maximum score is attained for situations where an attacked can exploit a system without requiring valid credentials (or by using default credentials).
• Confidentiality, Integrity and Availability impact – this metric refers to the impact to confidentiality, integrity or availability that an exploited vulnerability represents. Typically, the greater the degree of control that an attacker has over a system, the greater the impact score
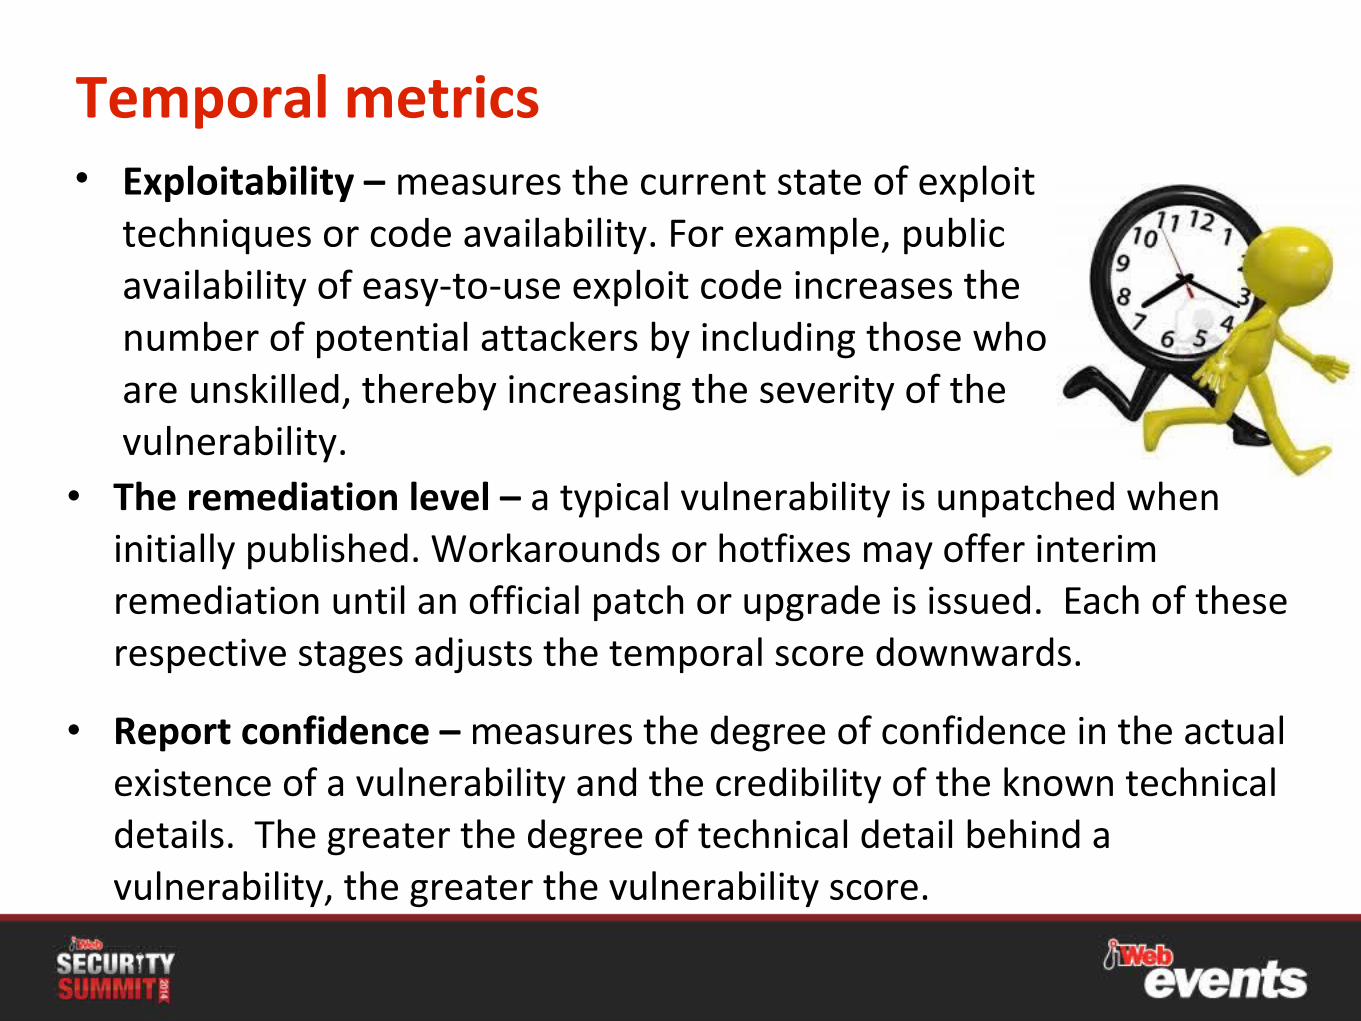
Temporal metrics• Exploitability – measures the current state of exploit
techniques or code availability. For example, public availability of easy-to-use exploit code increases the number of potential attackers by including those who are unskilled, thereby increasing the severity of the vulnerability.
• The remediation level – a typical vulnerability is unpatched when initially published. Workarounds or hotfixes may offer interim remediation until an official patch or upgrade is issued. Each of these respective stages adjusts the temporal score downwards.
• Report confidence – measures the degree of confidence in the actual existence of a vulnerability and the credibility of the known technical details. The greater the degree of technical detail behind a vulnerability, the greater the vulnerability score.

Environmental metrics
• Damage potential – the potential magnitude of the impact on operations should the vulnerability be exploited. The greater the damage the greater the vulnerability score
• Target distribution – meant as an environment-specific indicator in order to approximate the percentage of systems similar to the target that could be affected by the vulnerability. The greater the proportion of vulnerable systems, the higher the score
• Security Requirements – measured in terms of confidentiality, integrity, and availability
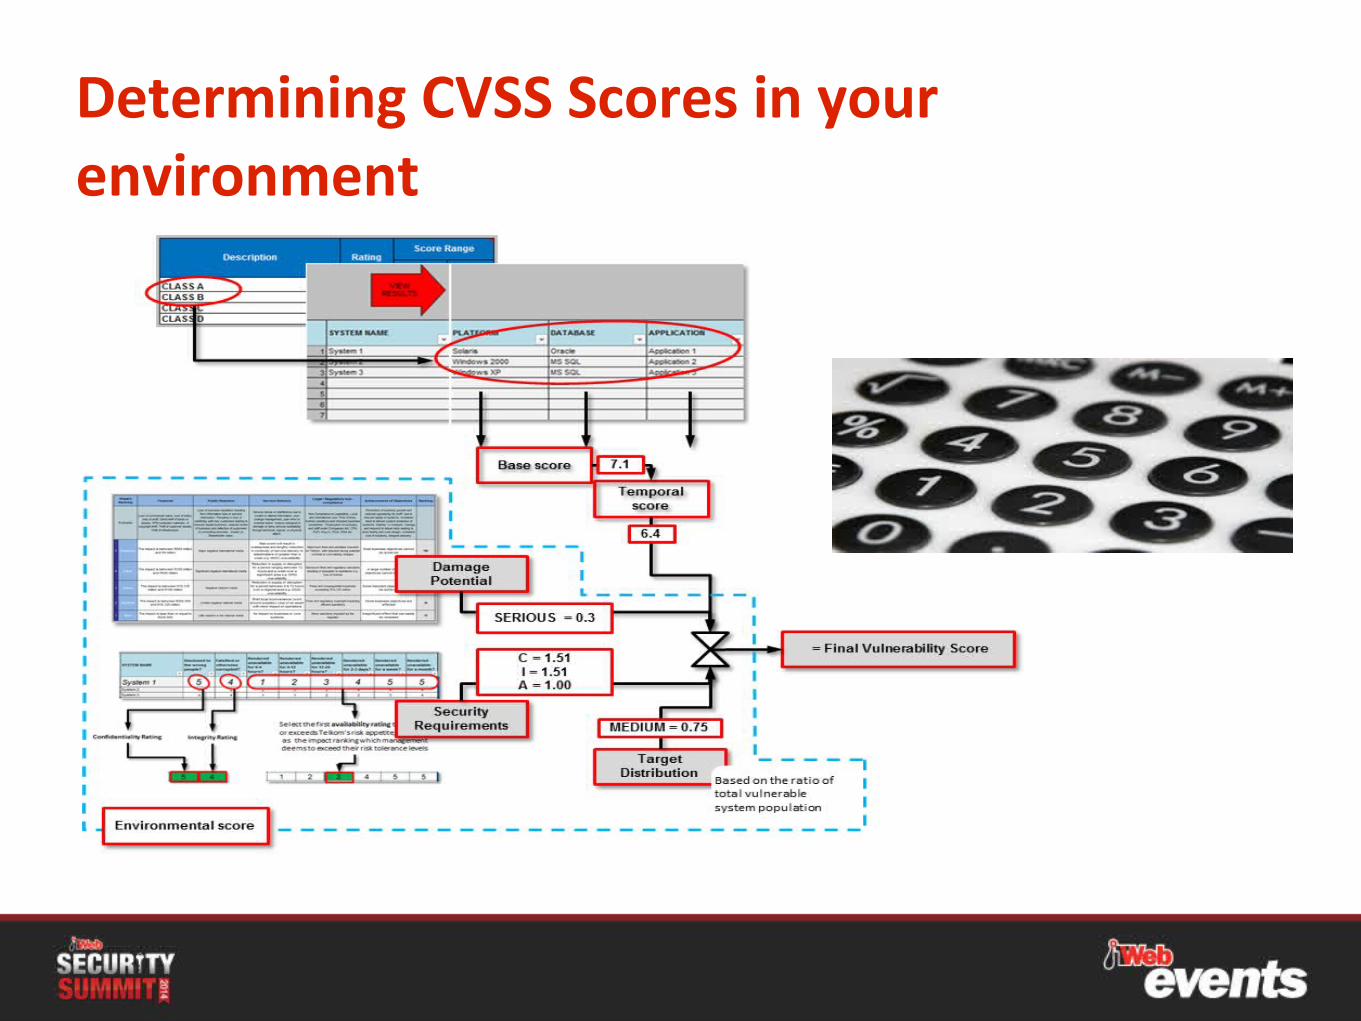
Determining CVSS Scores in your environment
Group Activity
• CVSS Base and Temporal Scores are available for most technical vulnerabilities
• Scores can also be used to measure functional security inadequacies
• In your groups work through the 5 Indicators defined previously and establish base and temporal scores for each. Discuss with the rest of the class
Guidance: Consider current events and nature of high profile incidents when trying to establish Temporal scores.
Understanding your Audience and their Priorities
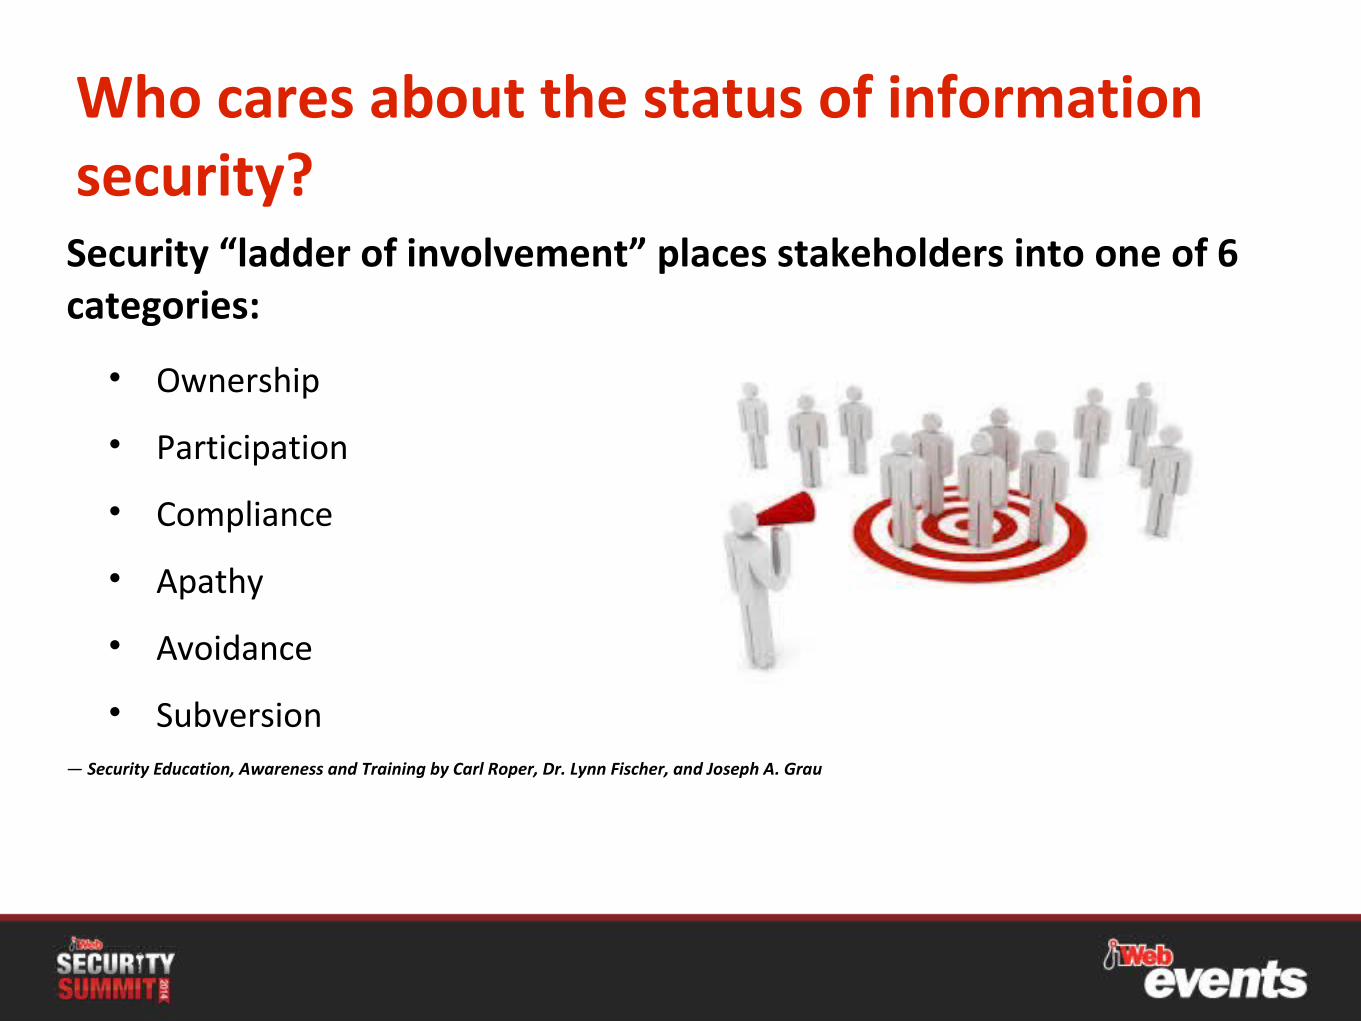
Who cares about the status of information security?Security “ladder of involvement” places stakeholders into one of 6 categories:
• Ownership
• Participation
• Compliance
• Apathy
• Avoidance
• Subversion— Security Education, Awareness and Training by Carl Roper, Dr. Lynn Fischer, and Joseph A. Grau
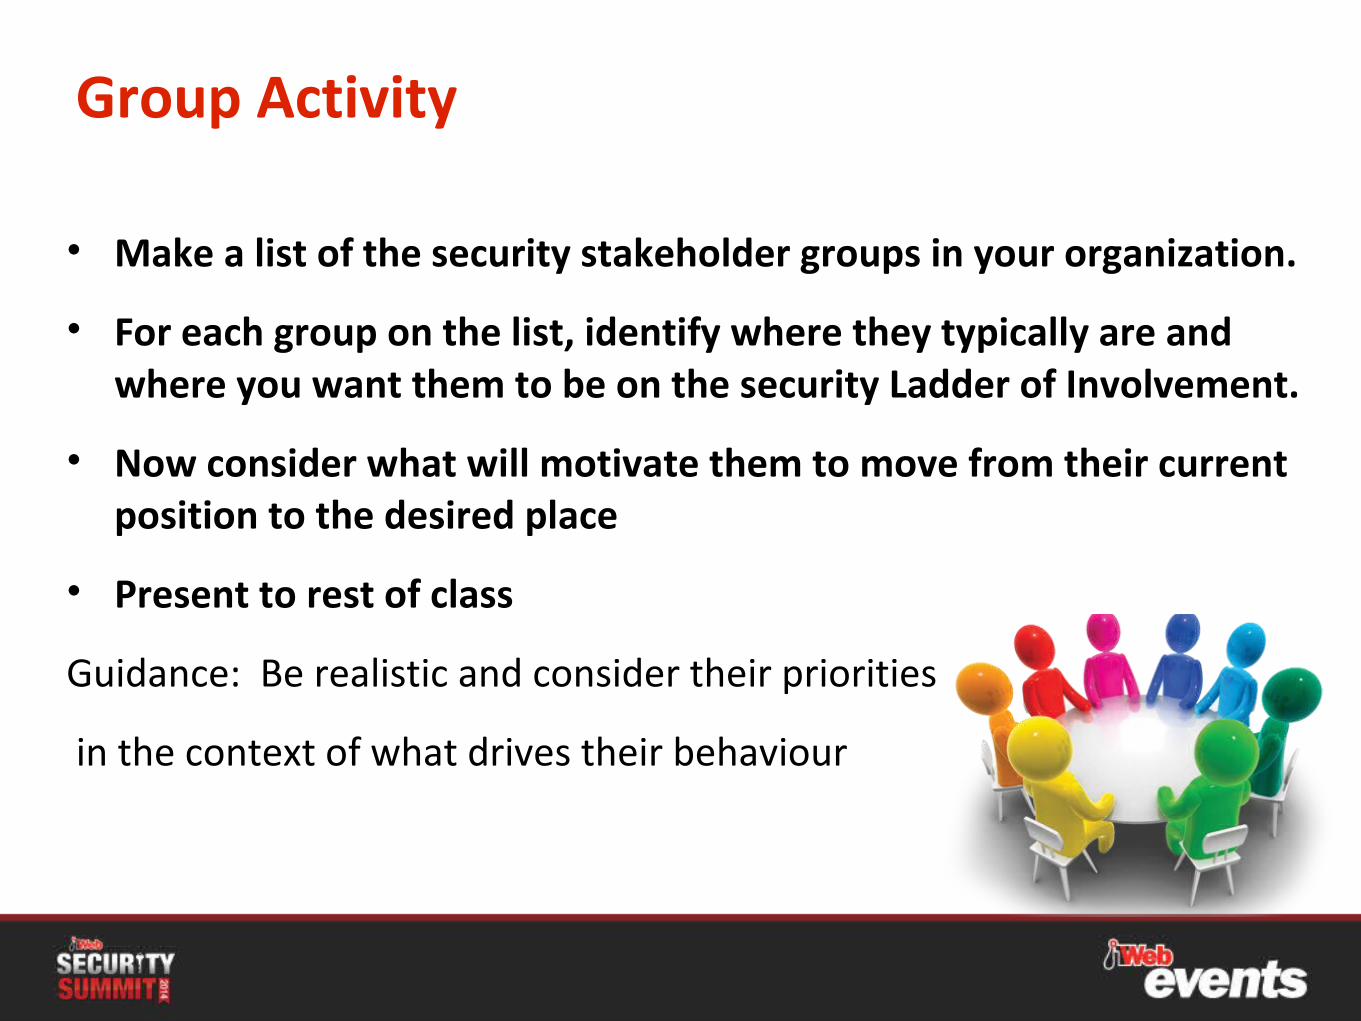
Group Activity
• Make a list of the security stakeholder groups in your organization.
• For each group on the list, identify where they typically are and where you want them to be on the security Ladder of Involvement.
• Now consider what will motivate them to move from their current position to the desired place
• Present to rest of class
Guidance: Be realistic and consider their priorities
in the context of what drives their behaviour

Building Dashboards and Reports
Rule 1 – Who are you trying to impress?
• Think about the audience for the dashboard.
• Ensure that where possible the dashboard consists of data specific to a single audience.
Rule 2 – Select the right type of dashboard
• 3 common types:• Operational - Think of an operational dashboard as monitoring the nerve
centre of your operation. Operational dashboards often require real-time or near real-time data.
• Strategic – These typically provide the KPI’s (Key Performance Indicators) that management tracks on a periodic (daily, weekly or monthly) basis. A strategic dashboard should provide a high-level overview of the state of the business (from a security perspective)
• Analytical - An analytical dashboard could display operational or strategic data. However this type of dashboard will offer drill-down functionality - allowing the user to explore more of the data to get different insights
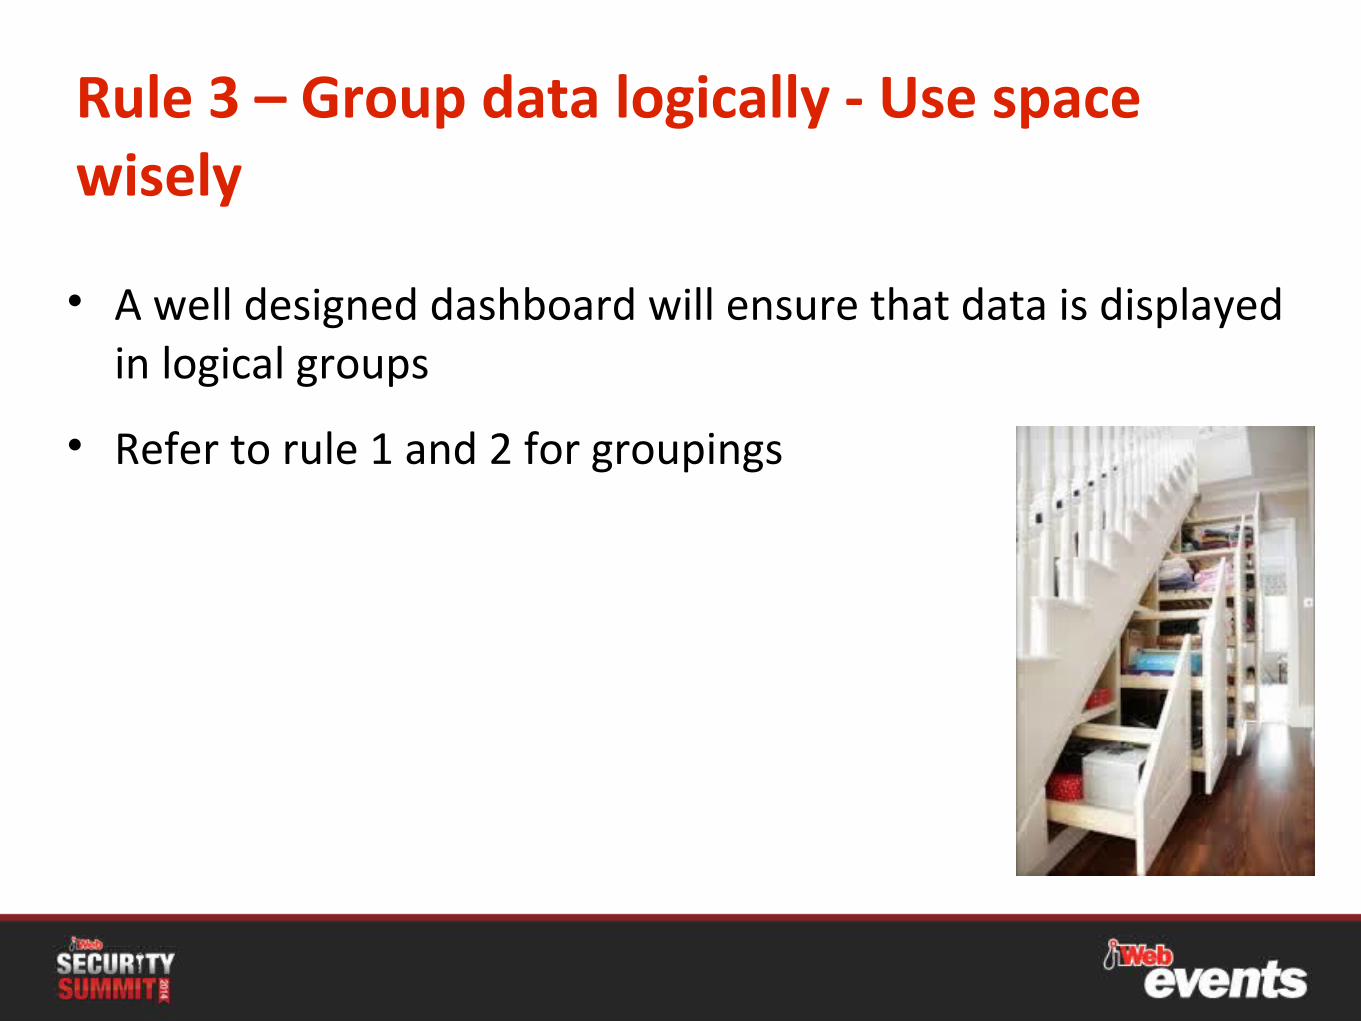
Rule 3 – Group data logically - Use space wisely
• A well designed dashboard will ensure that data is displayed in logical groups
• Refer to rule 1 and 2 for groupings
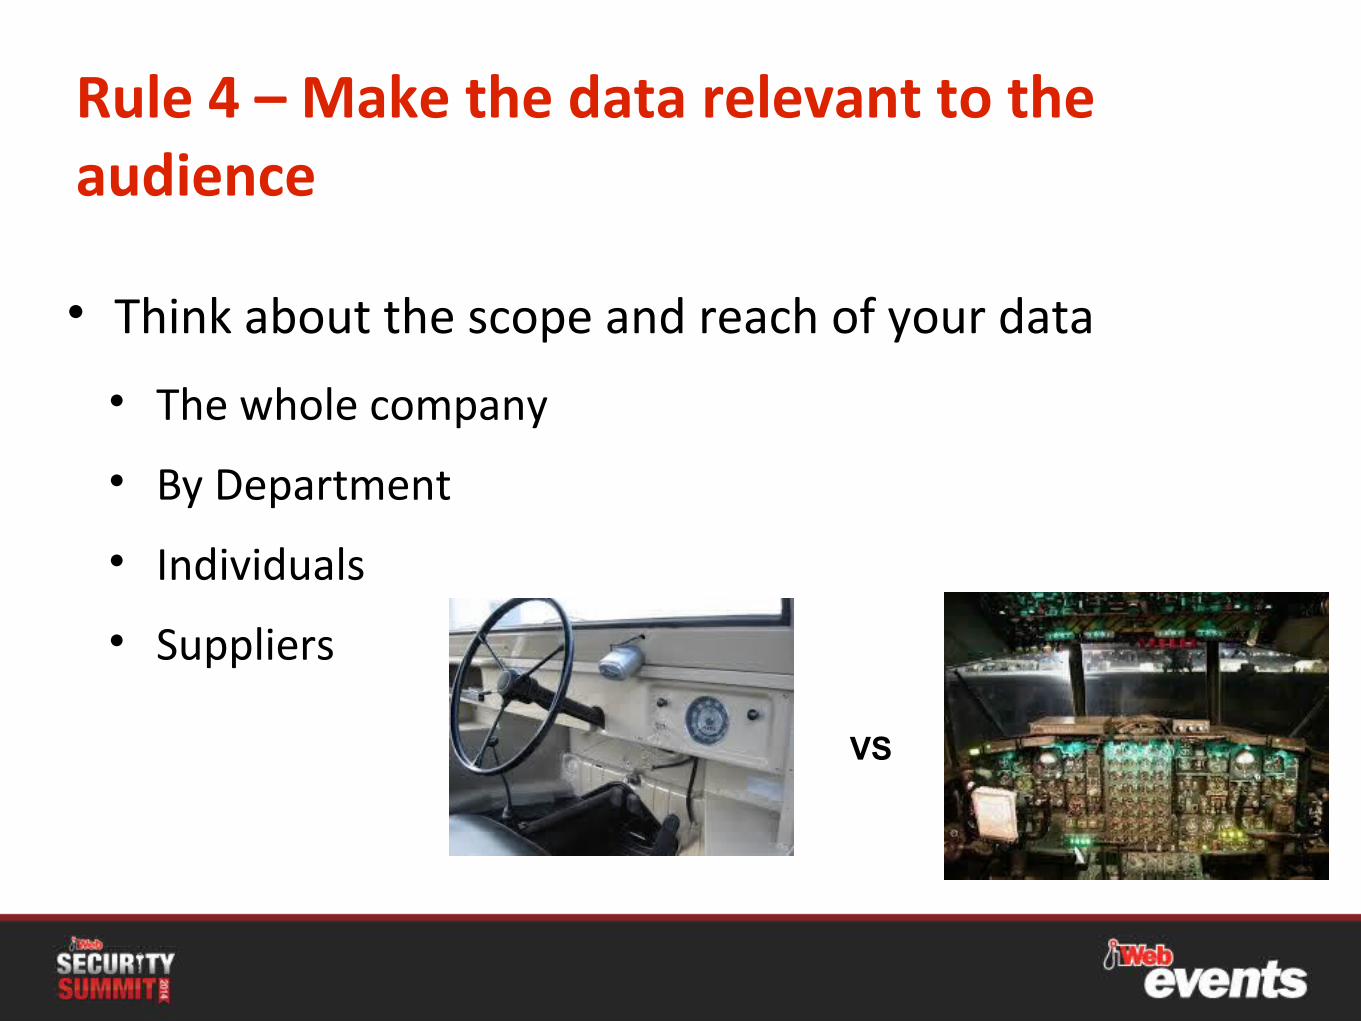
Rule 4 – Make the data relevant to the audience
• Think about the scope and reach of your data
• The whole company
• By Department
• Individuals
• Suppliers
VS
Rule 5 – Present only that which is important
• Cluttered displays deflect the focus from the important messages.
• Each dashboard type may require different amounts of data (for example an Executive dashboard may only need 6 numbers, whereas an Operational dashboard may need upwards of 20)
• Ensuring that everything you display is relevant and meaningful to the audience. Do not add a graph or text simply because you can…
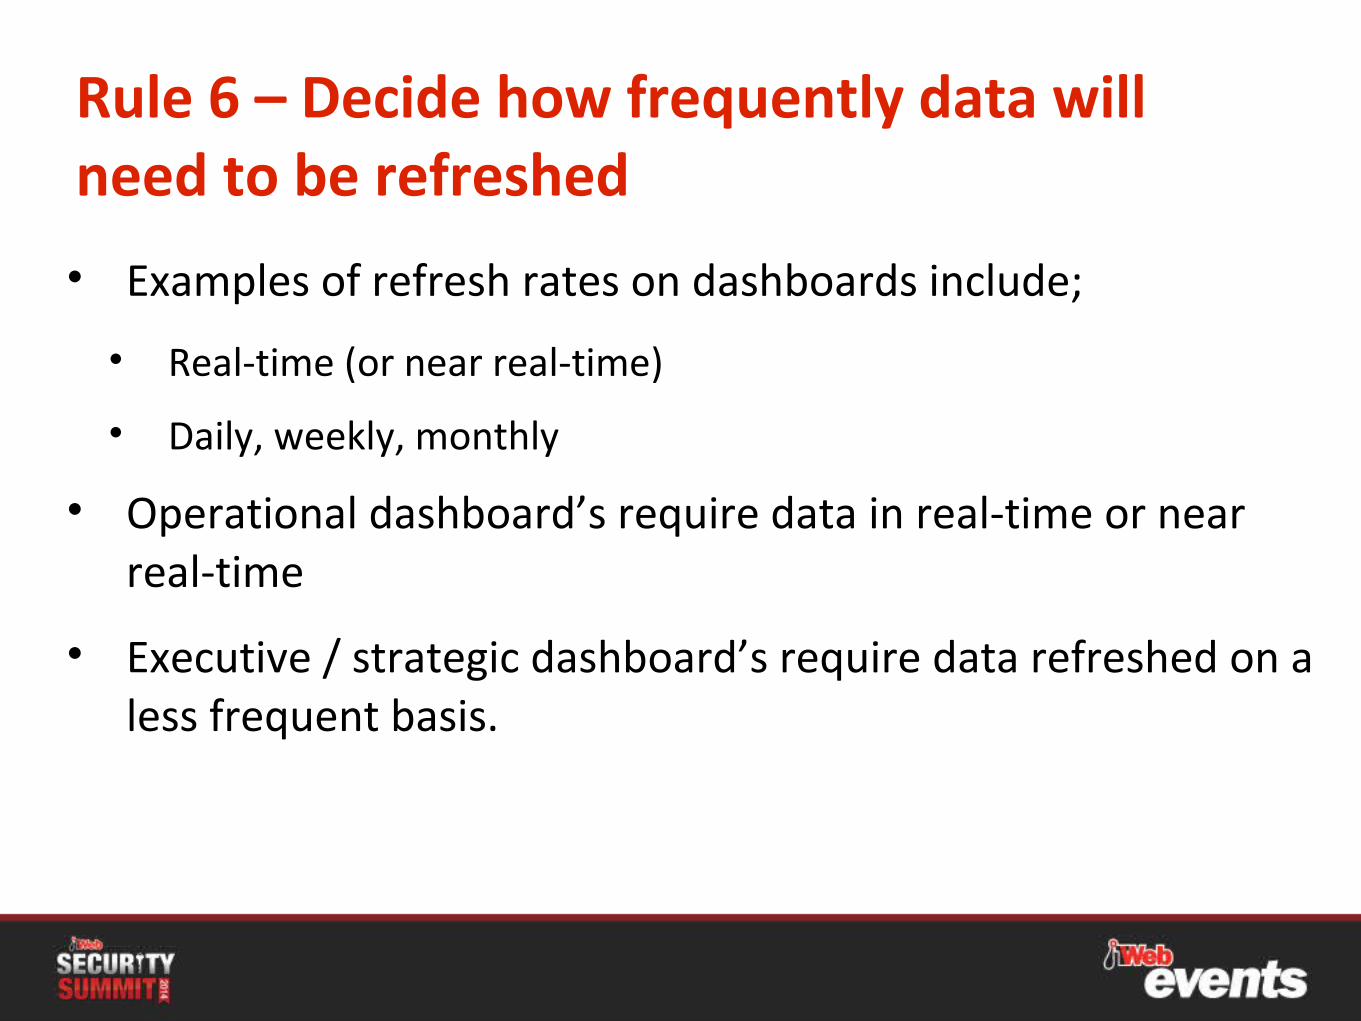
Rule 6 – Decide how frequently data will need to be refreshed
• Examples of refresh rates on dashboards include;
• Real-time (or near real-time)
• Daily, weekly, monthly
• Operational dashboard’s require data in real-time or near real-time
• Executive / strategic dashboard’s require data refreshed on a less frequent basis.
Group Activity
• Using the 5 Indicators your group defined previously, and considering the 6 rules for effective dashboards, discuss and mock-up the most effective dashboard/report
• Present to the rest of the class
Guidance: Be creative and think about the “ladder of involvement” !
Wrap up and summary