Embed Size (px)
Citation preview
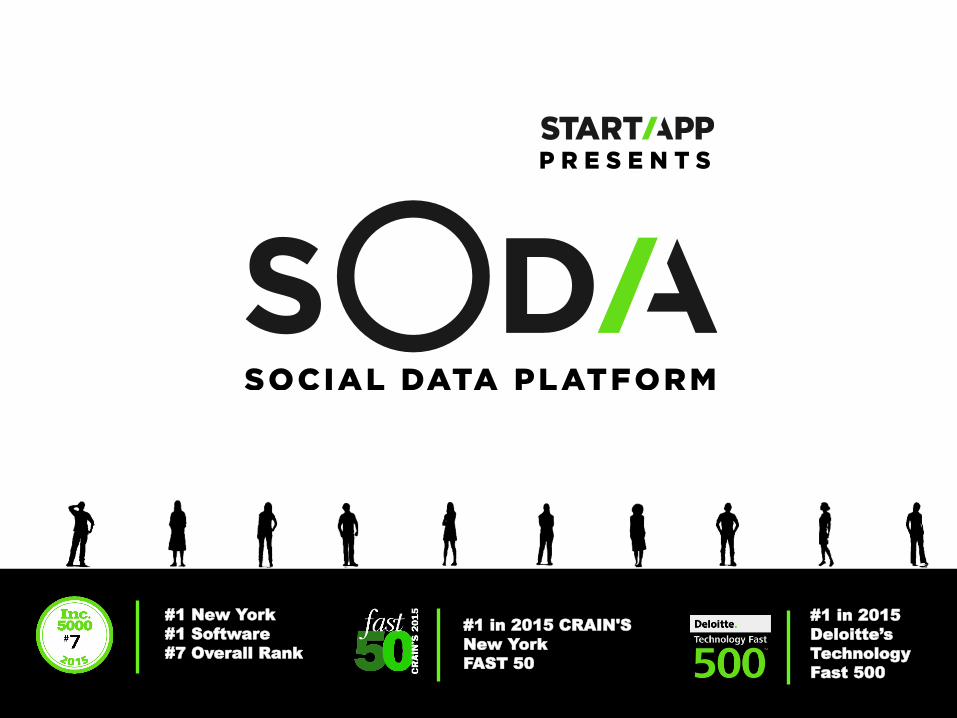
#1 New York
#1 Software
#7 Overall Rank
#1 in 2015 CRAIN'S
New York
FAST 50
#1 in 2015
Deloitte’s
Technology
Fast 500
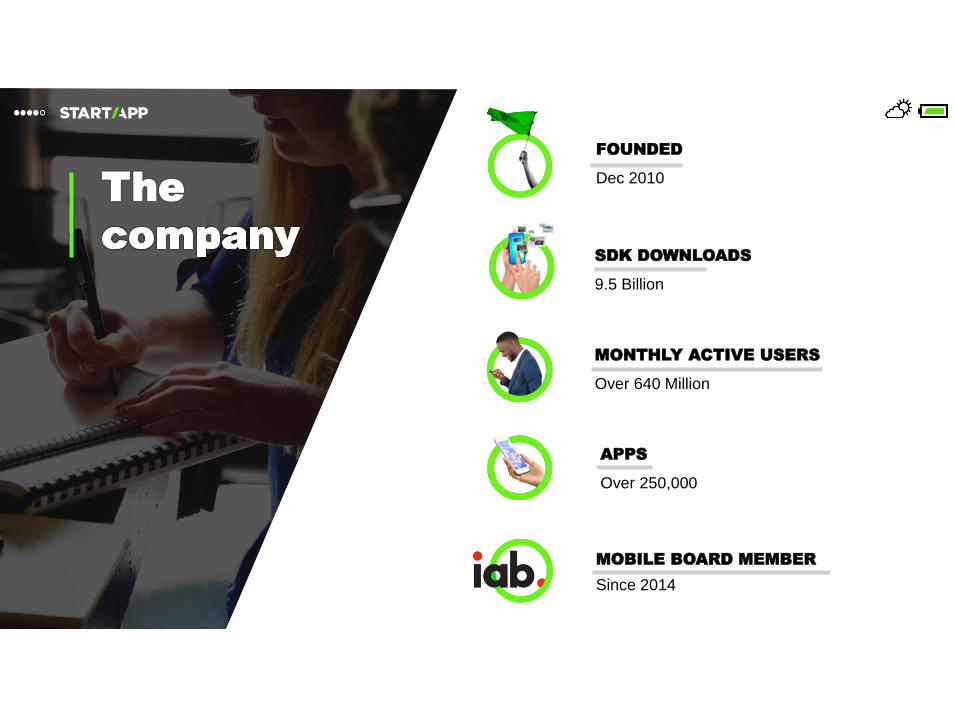
FOUNDED
Dec 2010The
SDK DOWNLOADS
9.5 Billion
APPS
Over 250,000
MOBILE BOARD MEMBER
Since 2014
MONTHLY ACTIVE USERS
Over 640 Million
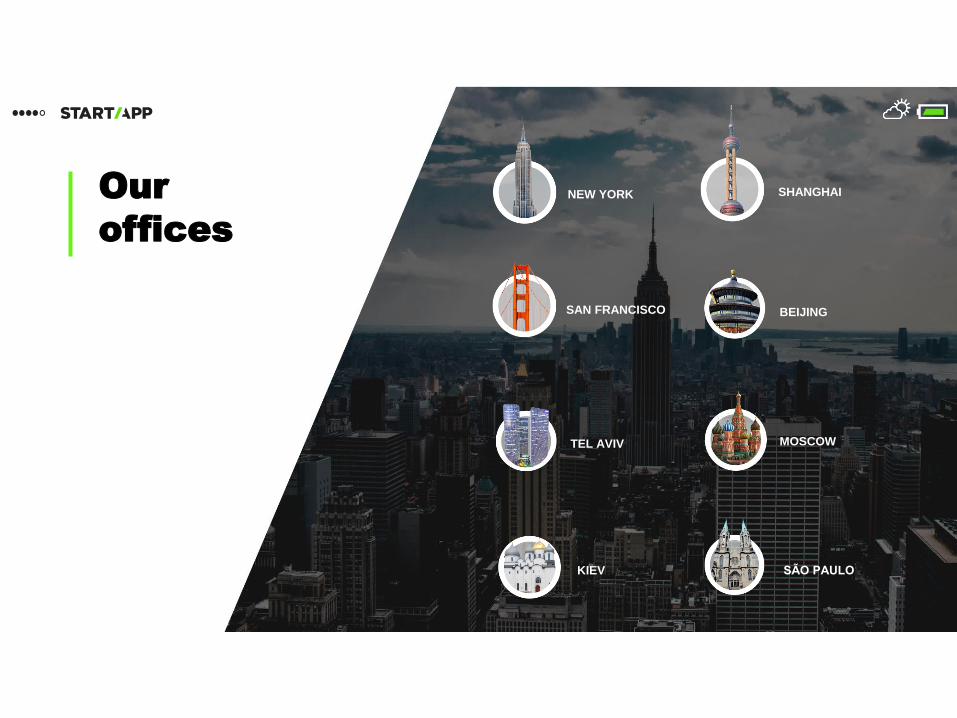
SAN FRANCISCO
NEW YORK
TEL AVIV
BEIJING
SÃO PAULOKIEV
Our
offices
SHANGHAINEW YORK
MOSCOW
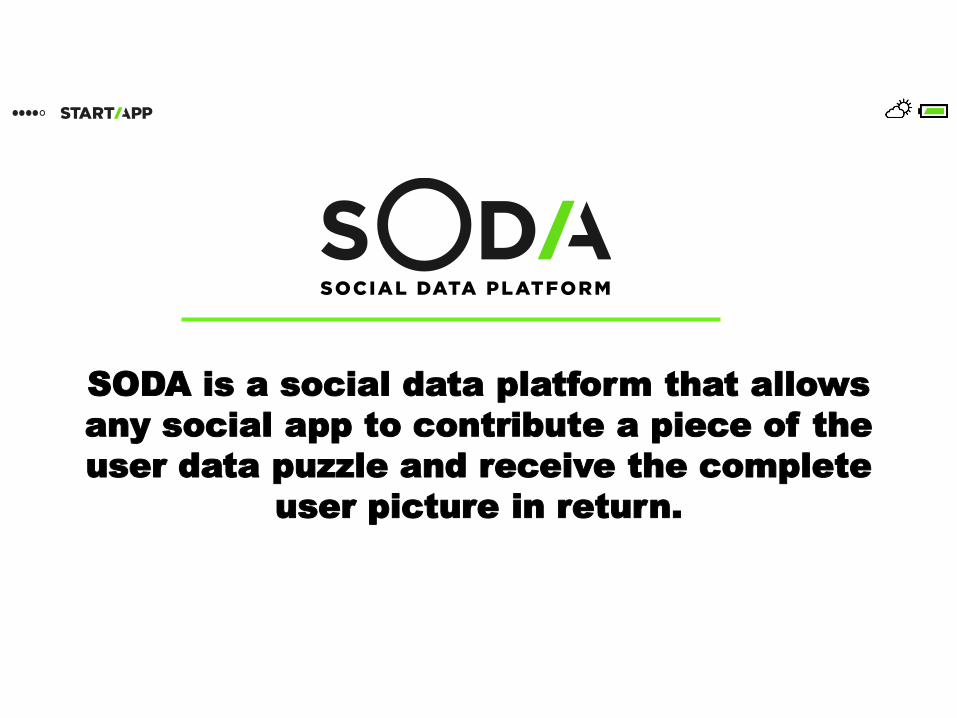
SODA is a social data platform that allows
any social app to contribute a piece of the
user data puzzle and receive the complete
user picture in return.

Mobile integration with daily activities
Music
Player
News &
ArticlesGames
Photography
Tools
Social
Networks
Food & Weight
TrackingShopping Dating
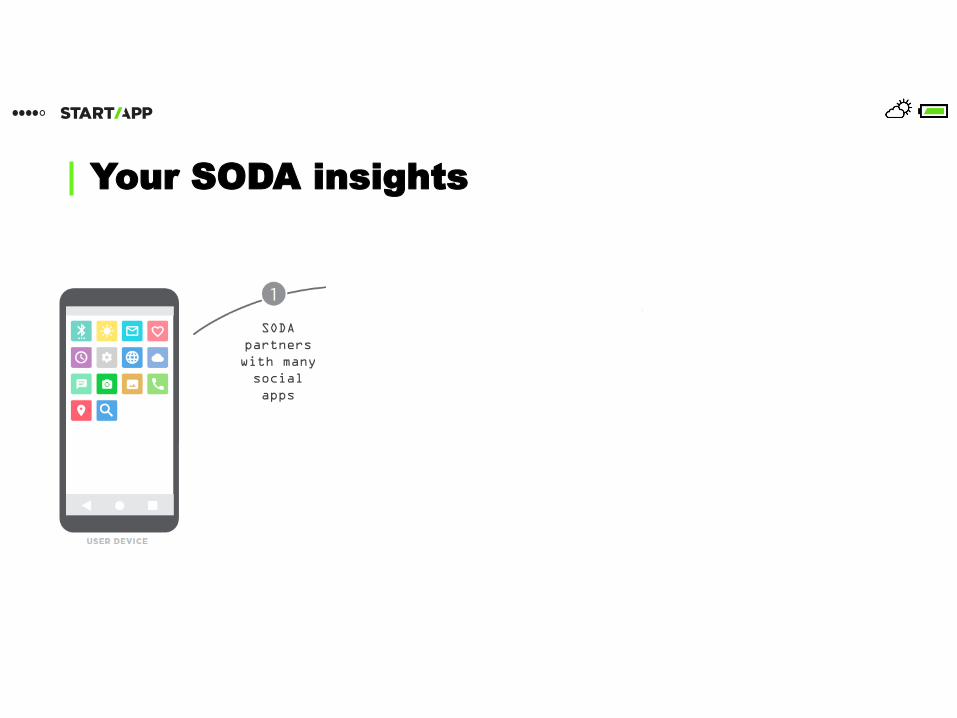
Your SODA insights
SODA
partners
with many
social
apps
Each app
partner
contributes a
piece of the
user data
puzzle
SODA combines these
pieces and returns a
full, anonymized
social picture
MOBILE DATING
Games Communication Social Networks
Photography Shopping Dating
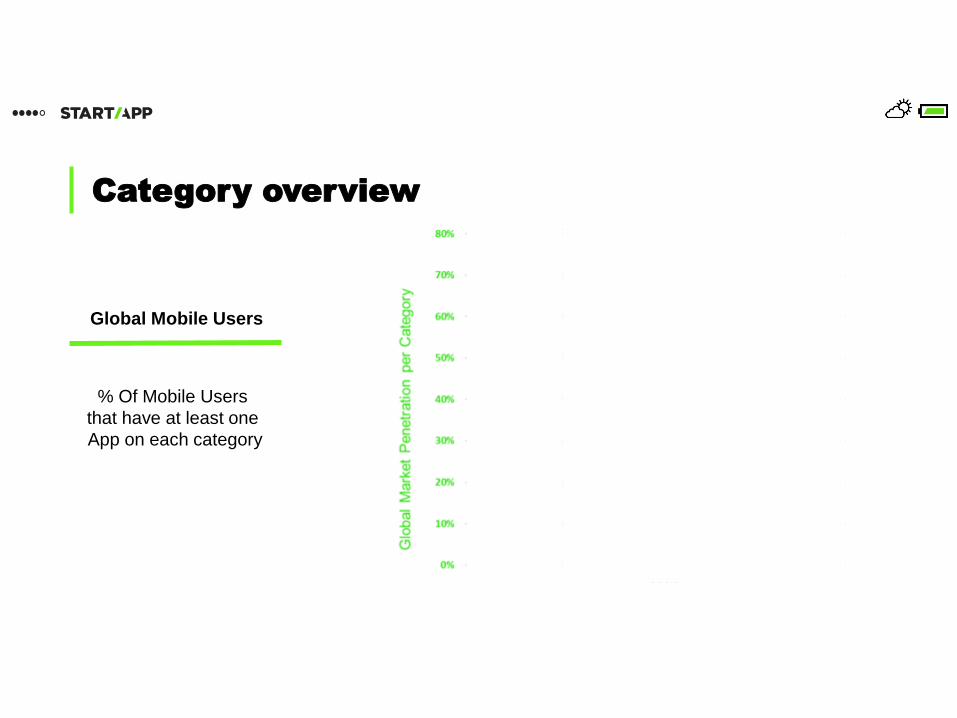
Category overview
Global Mobile Users
% Of Mobile Users
that have at least one
App on each category
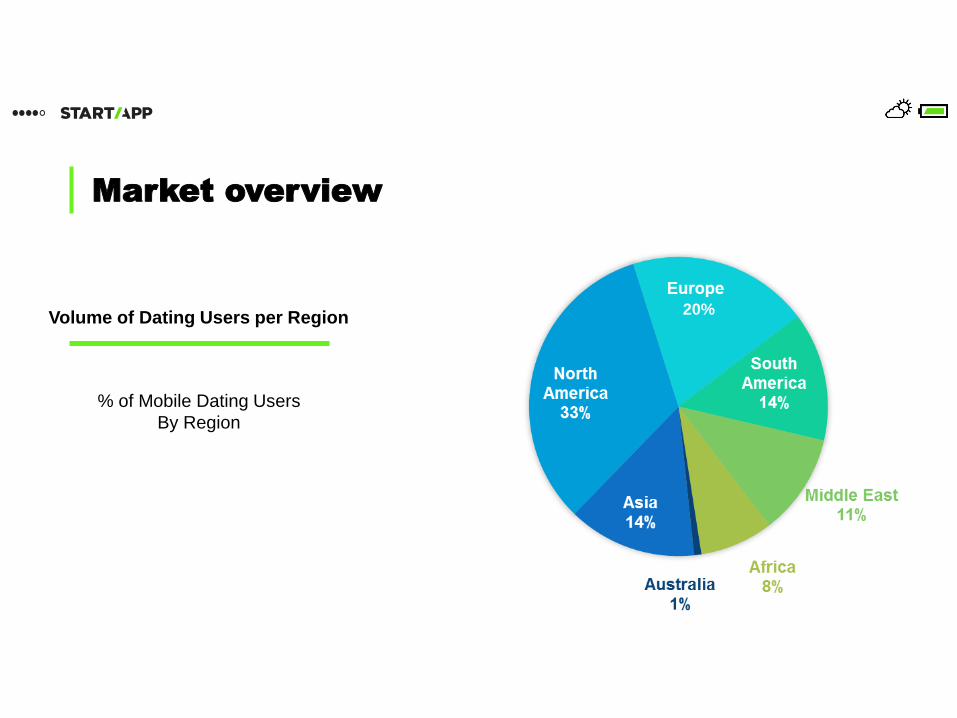
Volume of Dating Users per Region
Market overview
% of Mobile Dating Users
By Region
20%
Market overview
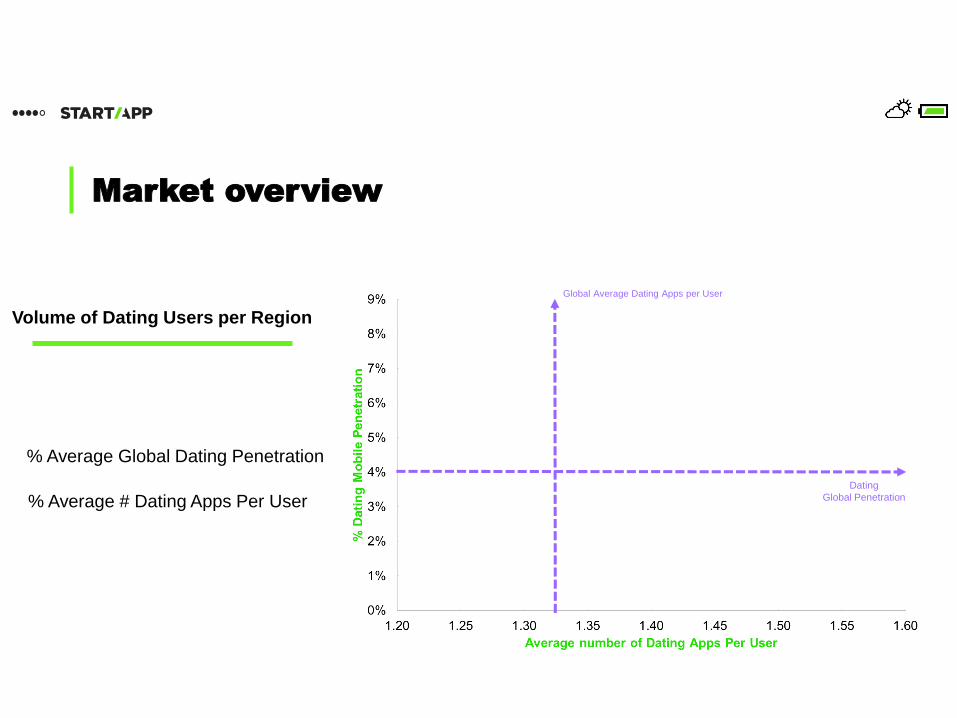
Volume of Dating Users per Region
Global Average Dating Apps per User
% Average # Dating Apps Per UserDating
Global Penetration
% Average Global Dating Penetration
AMERICAN DATING
USERS
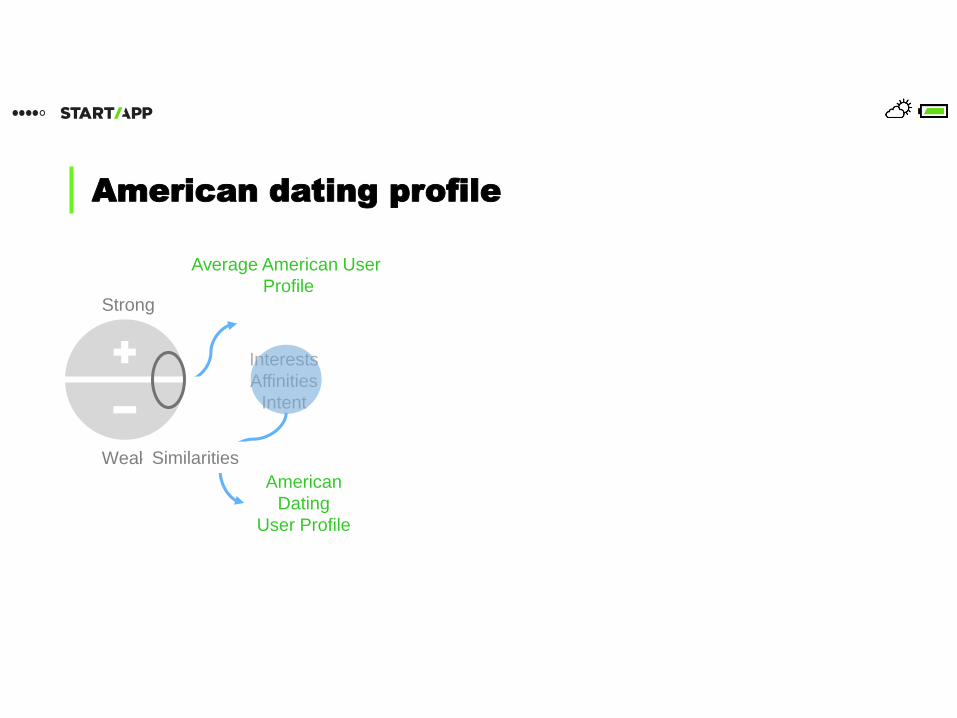
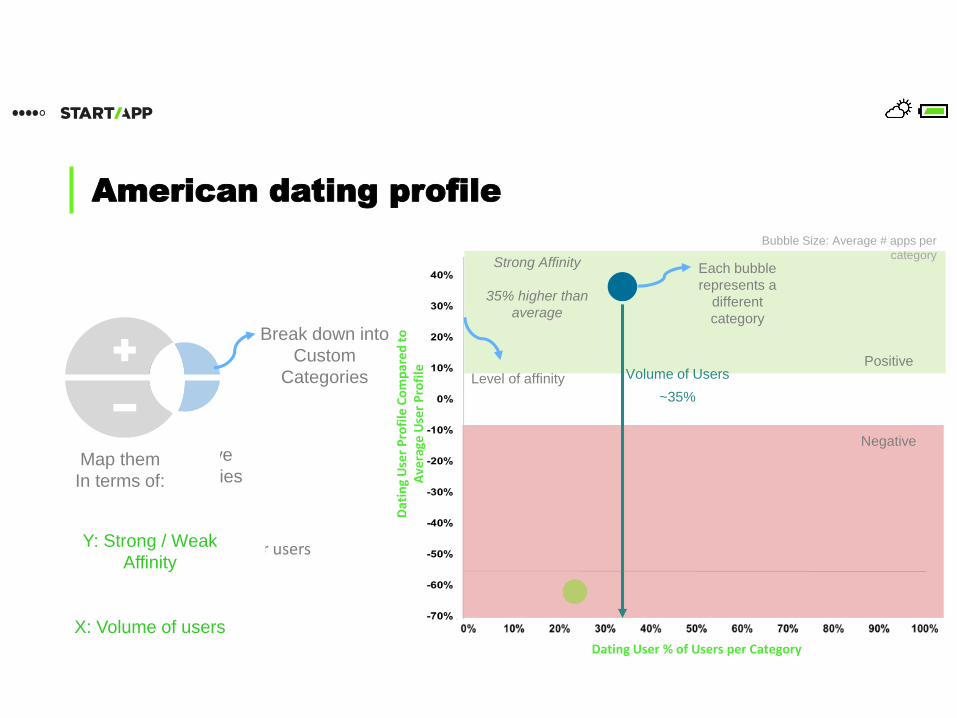
American dating profile
Average American User
Profile
Interests
Affinities
Intent
Strong
Weak
American
Dating
User Profile
ComparisonSimilarities
Positive
American dating profile
Remove
Similarities
Analyze what makes our usersUnique
Break down into
Custom
Categories
Map them
In terms of:
Y: Level of AffinityCompared to Average
American User Profile
X: % of Dating Users
Y: Strong / Weak
Affinity
X: Volume of users
Each bubble
represents a
different
category
Level of affinity
Negative
Volume of Users
~35%
Strong Affinity
35% higher than
average
Bubble Size: Average # apps per
category
Dating User % of Users per Category
Mic
o P
rofi
le C
om
par
ed t
o
Dat
ing
Pro
file
Dat
ing
Use
r P
rofi
le C
om
par
ed t
o
Ave
rage
Use
r P
rofi
le
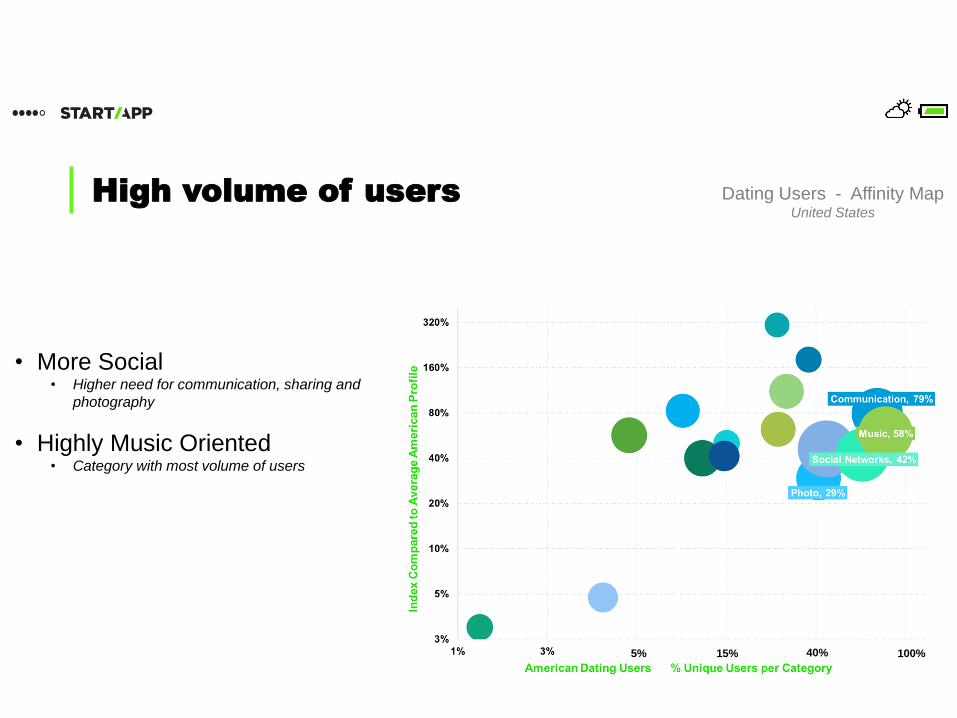
High volume of users
• More Social• Higher need for communication, sharing and
photography
• Highly Music Oriented• Category with most volume of users
Dating Users - Affinity MapUnited States
5% 15% 40% 100%
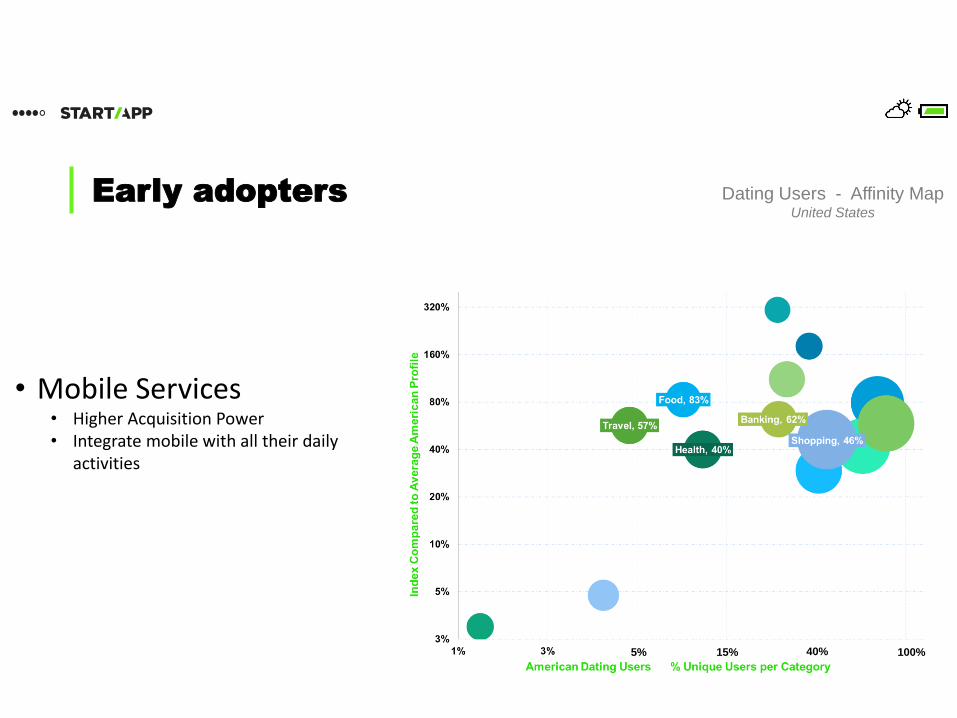
Early adopters
• Mobile Services• Higher Acquisition Power• Integrate mobile with all their daily
activities
Dating Users - Affinity MapUnited States
5% 15% 40% 100%
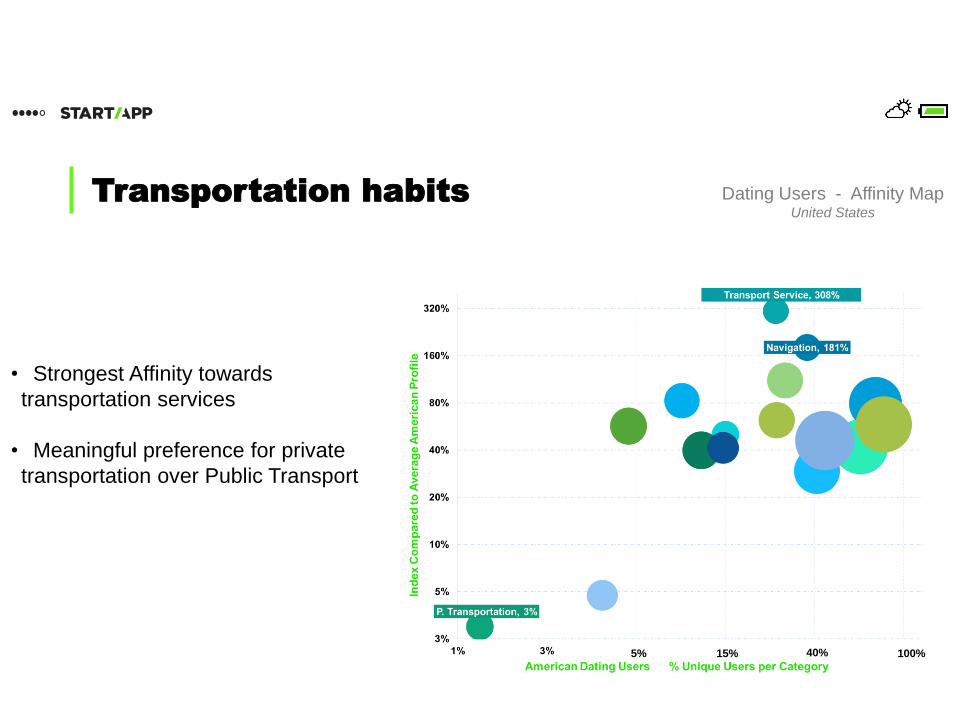
Transportation habits
• Strongest Affinity towards
transportation services
• Meaningful preference for private
transportation over Public Transport
Dating Users - Affinity MapUnited States
5% 15% 40% 100%

DATING IN THE
CITY
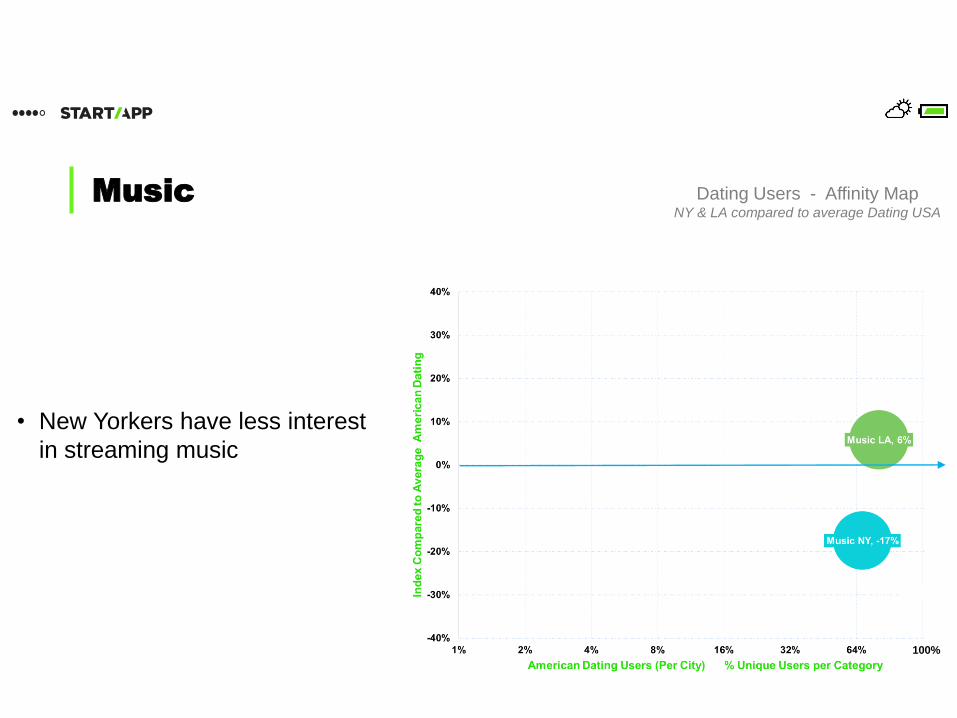
Music
• New Yorkers have less interest
in streaming music
Dating Users - Affinity MapNY & LA compared to average Dating USA
100%
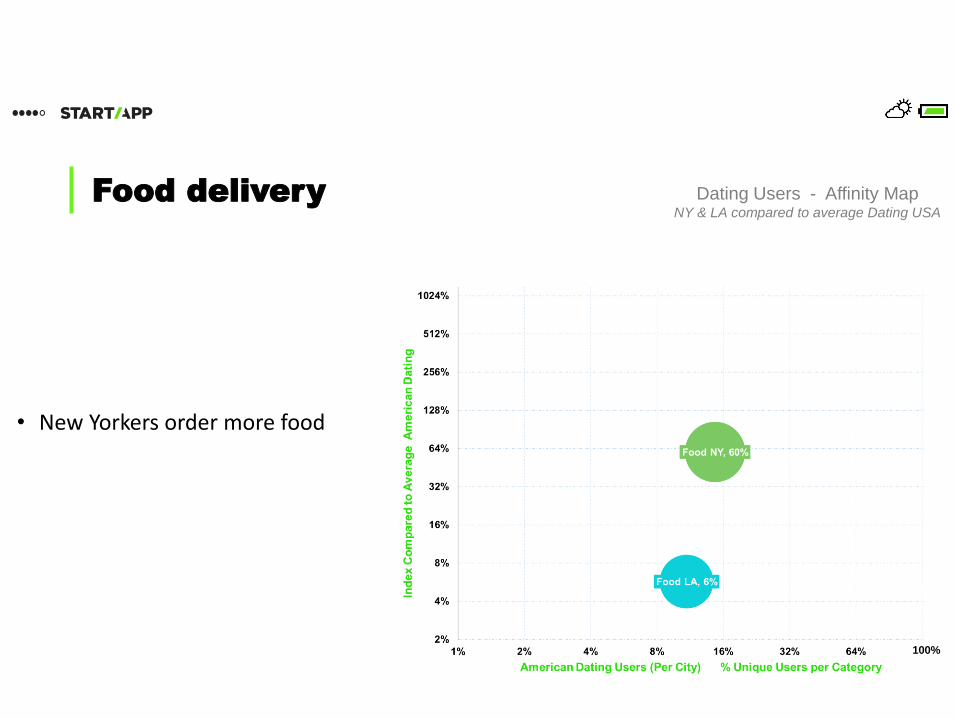
Food delivery
• New Yorkers order more food
Dating Users - Affinity MapNY & LA compared to average Dating USA
100%
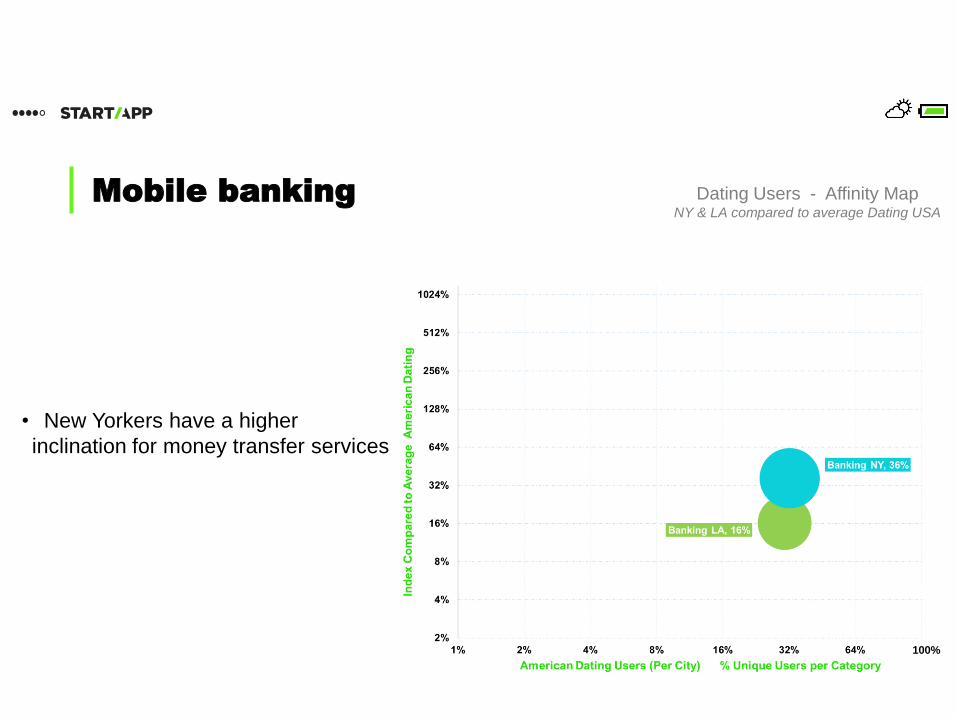
Mobile banking
• New Yorkers have a higher
inclination for money transfer services
Dating Users - Affinity MapNY & LA compared to average Dating USA
100%
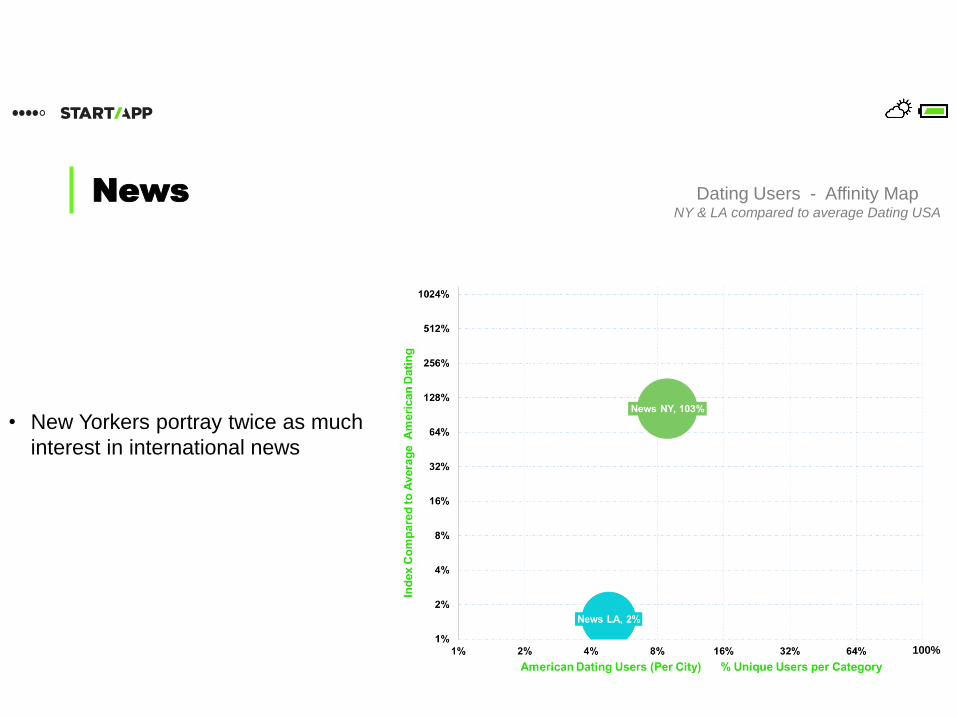
News
• New Yorkers portray twice as much
interest in international news
Dating Users - Affinity MapNY & LA compared to average Dating USA
100%
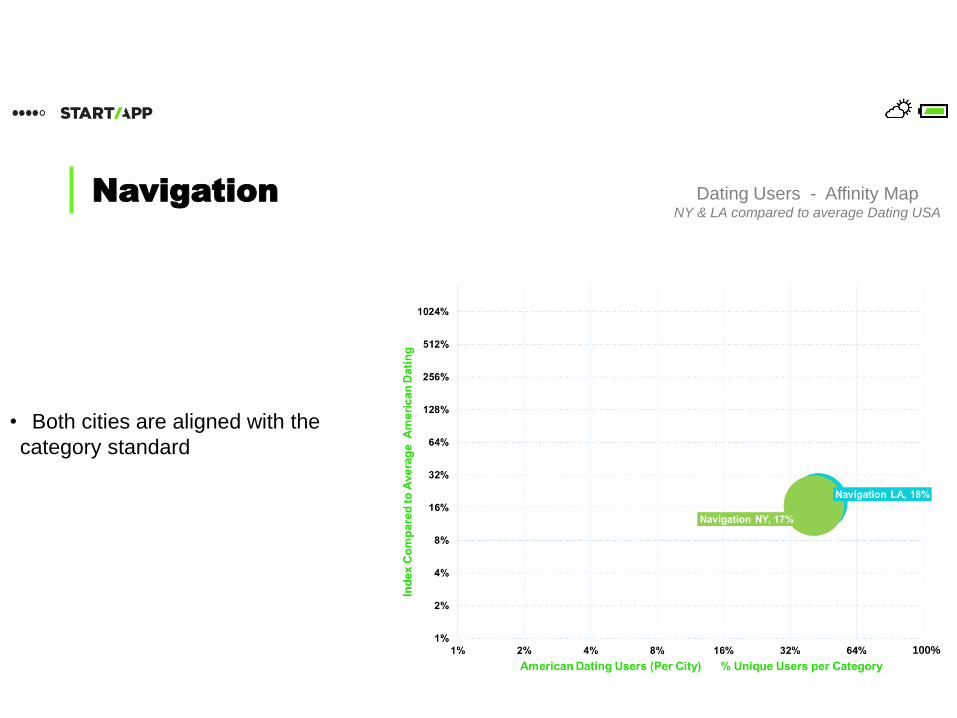
Navigation
• Both cities are aligned with the
category standard
Dating Users - Affinity MapNY & LA compared to average Dating USA
100%
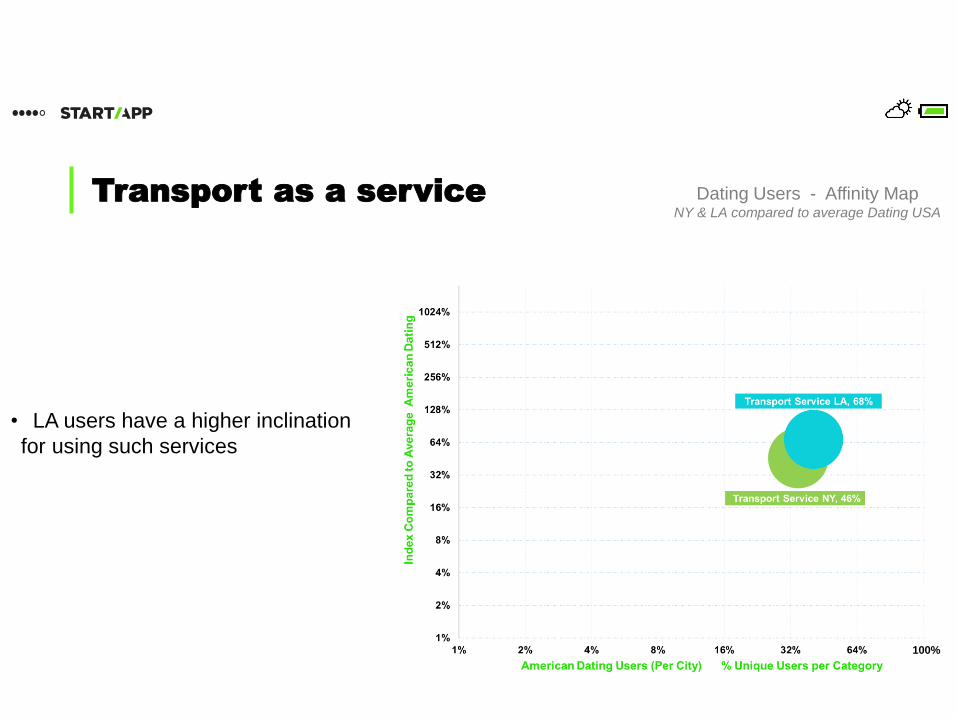
Transport as a service
• LA users have a higher inclination
for using such services
Dating Users - Affinity MapNY & LA compared to average Dating USA
100%
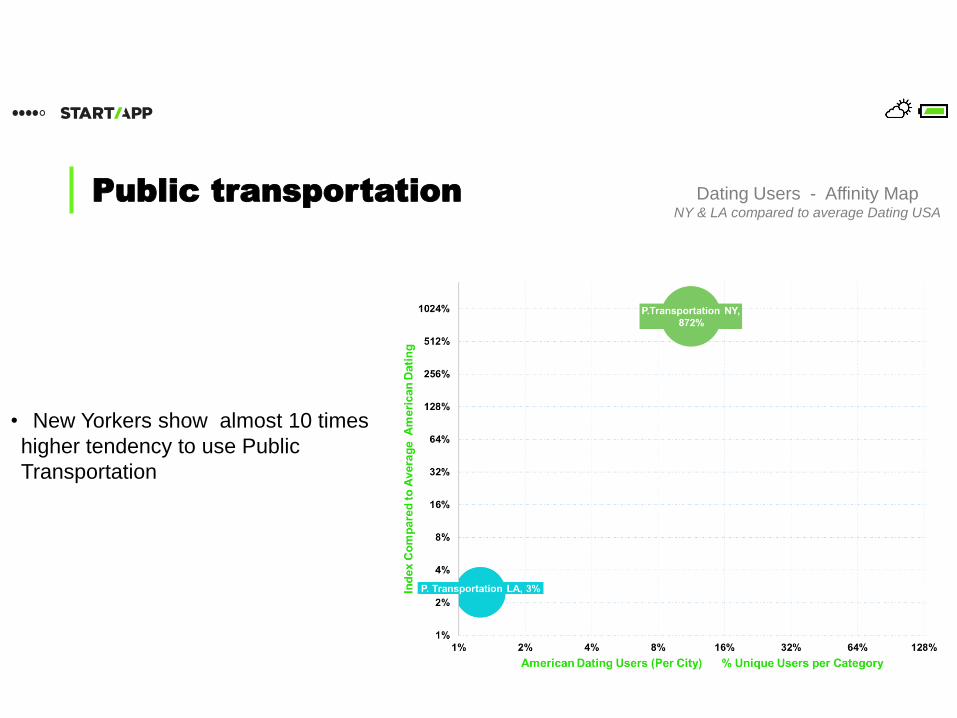
Public transportation Dating Users - Affinity MapNY & LA compared to average Dating USA
• New Yorkers show almost 10 times
higher tendency to use Public
Transportation
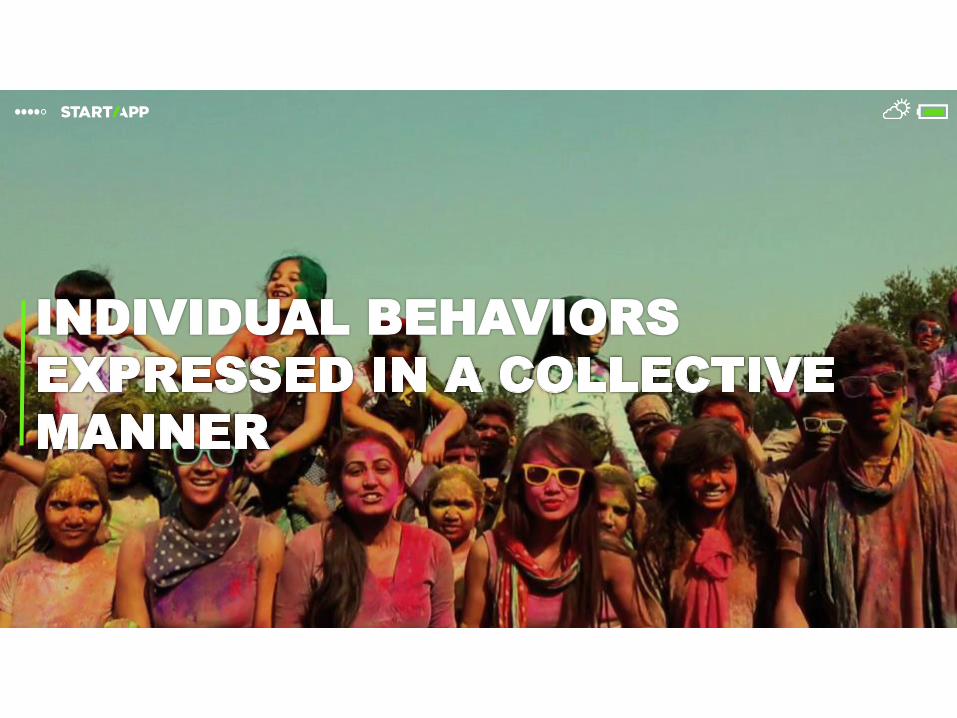
INDIVIDUAL BEHAVIORS
HOW WELL DO WE
KNOW
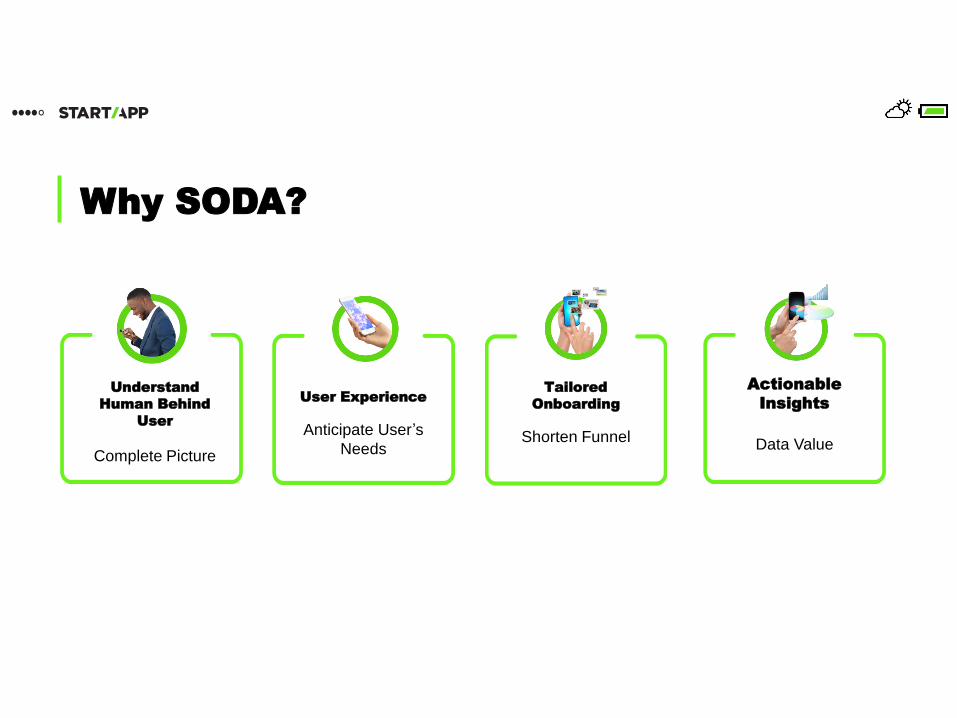
Why SODA?
Understand
Human Behind
User
Complete Picture
User Experience
Anticipate User’s
Needs
Tailored
Onboarding
Shorten Funnel
Actionable
Insights
Data Value