Embed Size (px)
Citation preview
Building Performance Module
The City University of New YorkNew York City College Of TechnologyArchitectural Technology Department
written by Felix RodriguezTemperature and Light Logger - UA-002-64
April 14, 2015
Building Performance Module
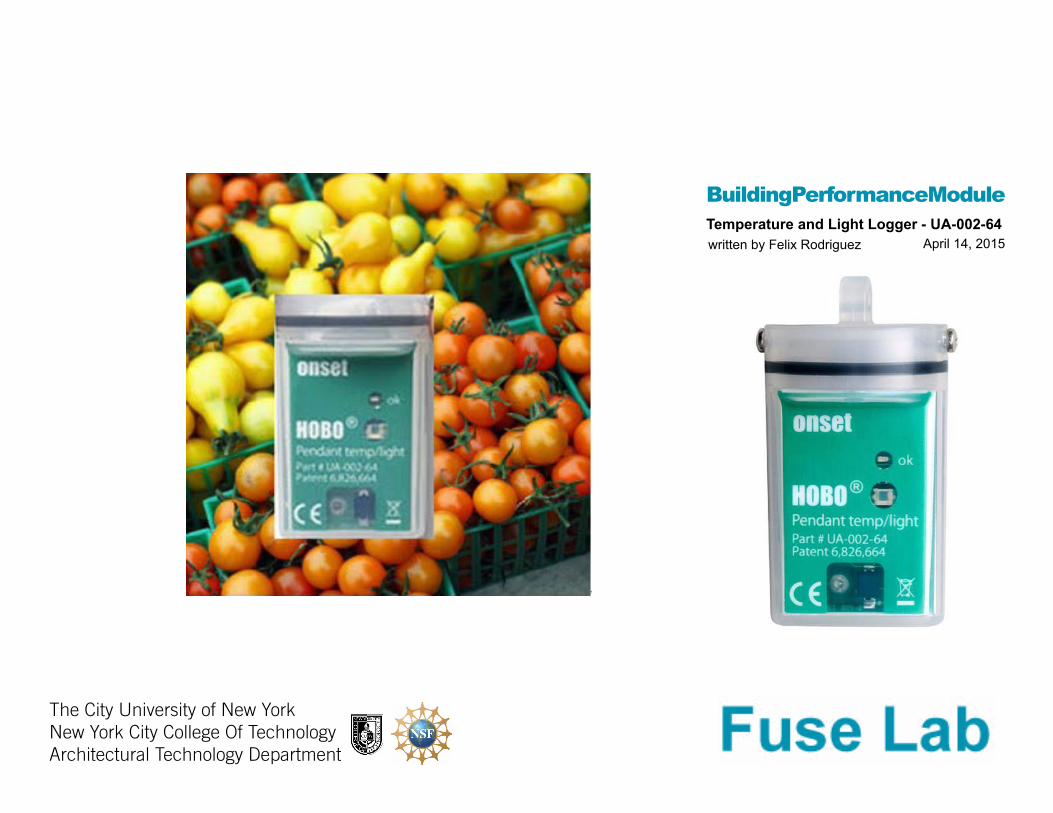
Temperature and Light Logger - UA-002-64
Definition:
This is a HOBO: UA-002-64 Temperature and Light Logger a miniature data logger that can record temperature and relative Light levels.
Applications:
Indoor and Outdoor environments
Waterproof for Underwater measurements
2
Left click on the RED number symbol to get a brief description of the items required to use the Temperature and Light Logger.
Step 1:
Always refer back to the Manual when necessary just left click with you mouse.
Left click with your mouse on the Specification Button to see the battery life of the logger, it’s range, and operating temperature.
This would give you an idea under which conditions this logger can be used.
Step 2:
Connect the Logger to the PC using the USB cable to get it ready to Launch.
Open the Software HOBOware Pro by clicking on the icon with a Circle and a H on your desktop.
Step 3:
Fig 1. HOBO: UA-002-64 Logger Components
Fig 2. HOBO: UA-002-64 - Connecting to PC using a USB cable
Building Performance Module3
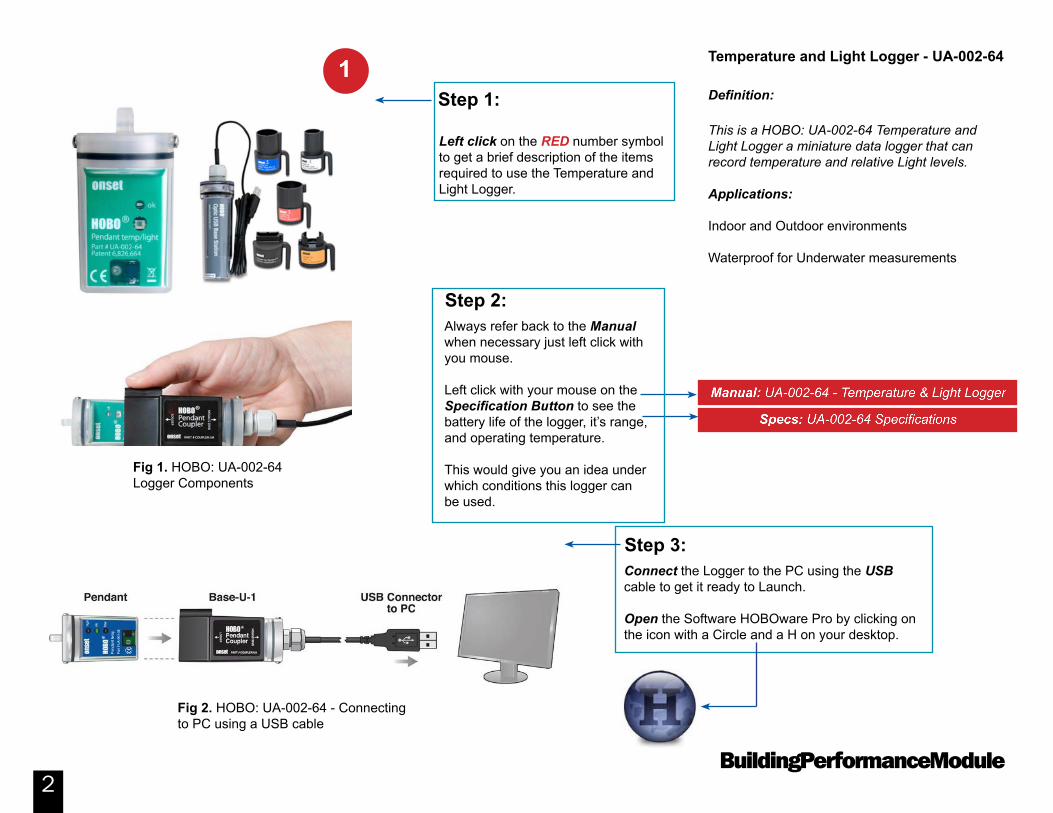
How to Launch the logger to collect data.Step 4:
Once Logger is connected confirm on the right hand bottom corner of the Hoboware Pro Software that it says 1 device connected.
Under the Device drop-down menu select Launch to get the configuration page where you can configure the logger to start logging data.
Left click on the video button to see a video on how to Launch the logger, then you can try it on your own.
Building Performance Module4
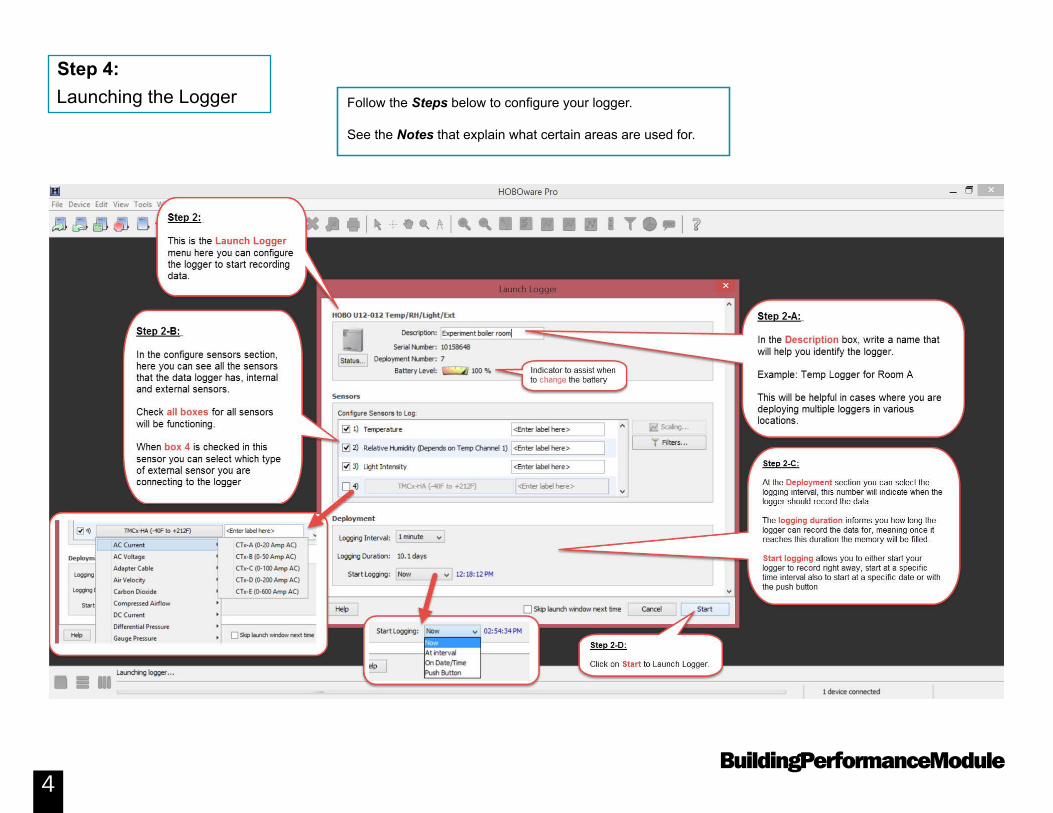
Follow the Steps below to configure your logger.
See the Notes that explain what certain areas are used for.
Launching the LoggerStep 4:
Building Performance Module5
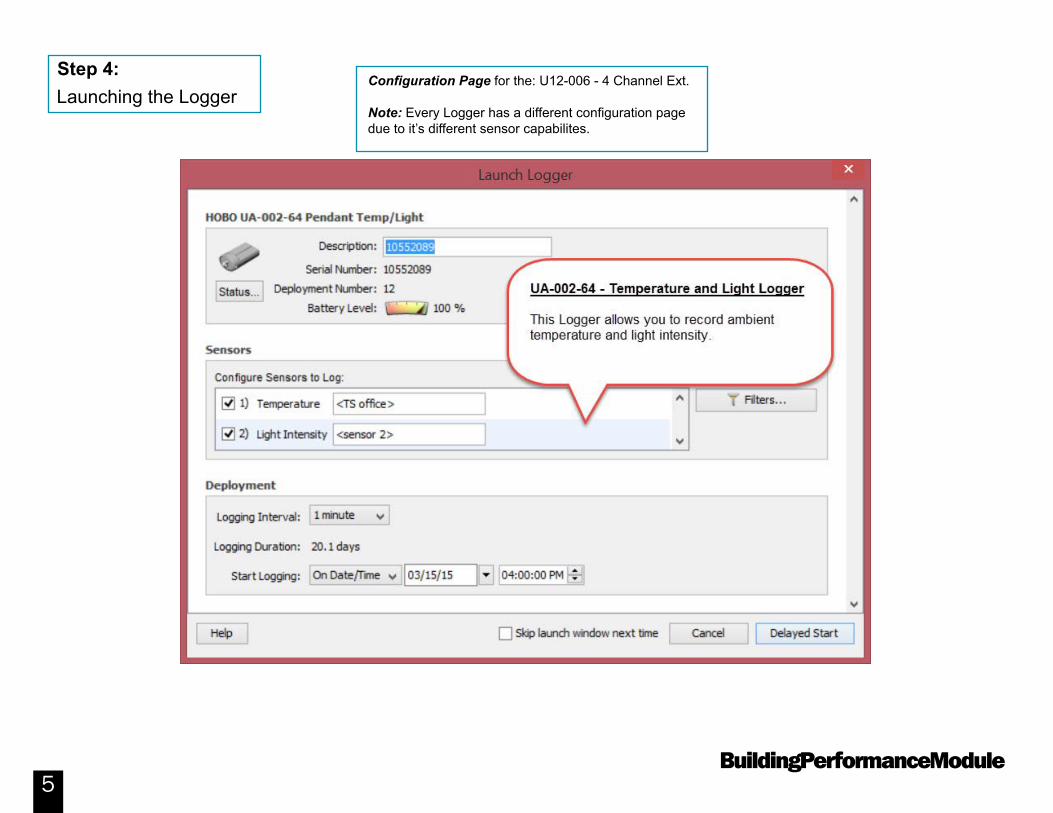
Configuration Page for the: U12-006 - 4 Channel Ext.
Note: Every Logger has a different configuration page due to it’s different sensor capabilites.
Launching the LoggerStep 4:
Building Performance Module6
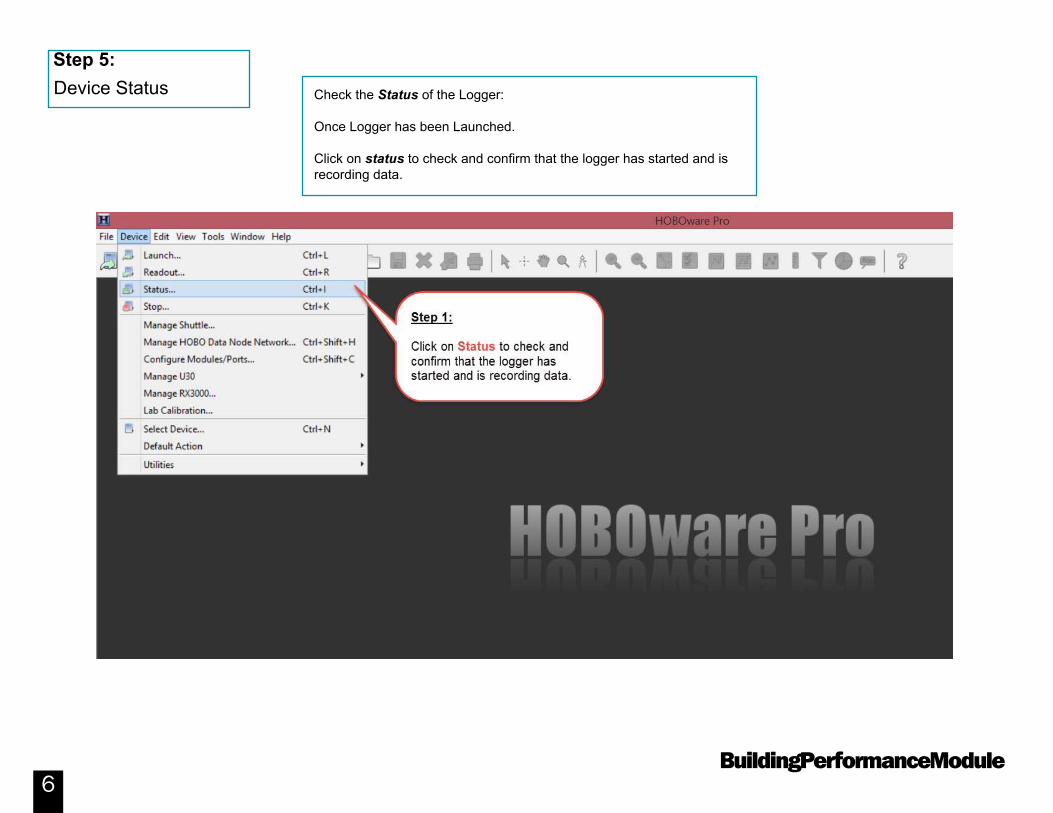
Check the Status of the Logger:
Once Logger has been Launched.
Click on status to check and confirm that the logger has started and is recording data.
Device StatusStep 5:
Building Performance Module7
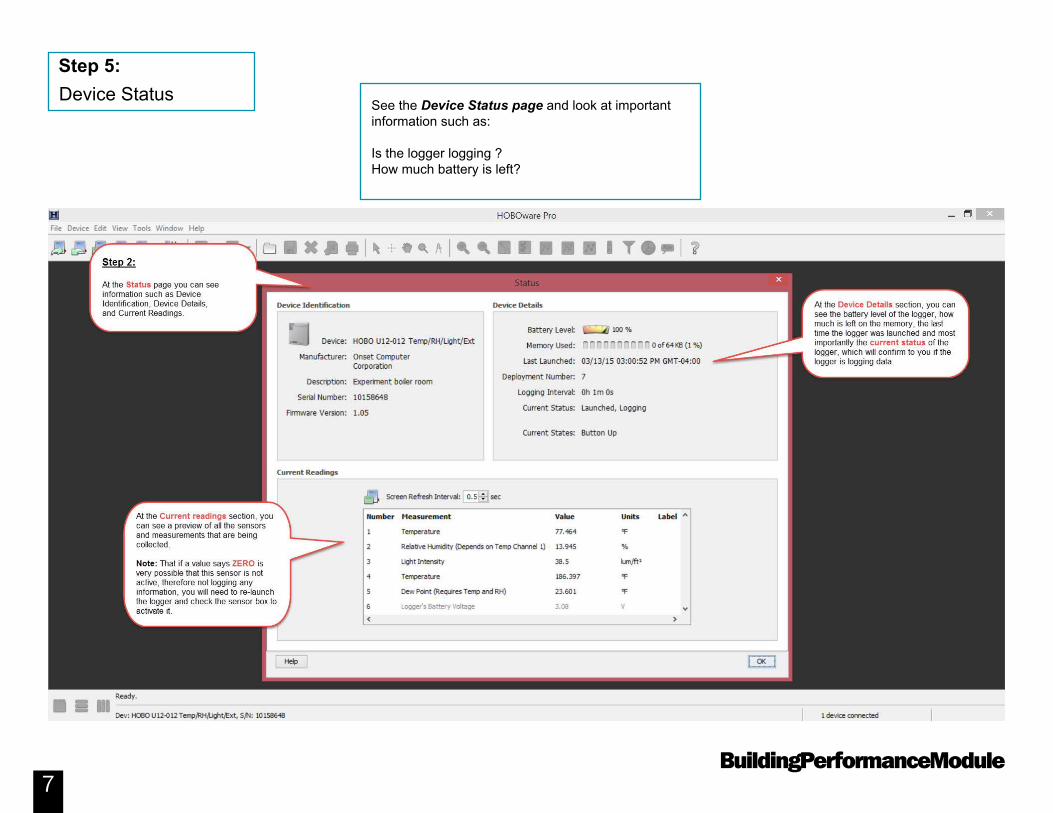
See the Device Status page and look at important information such as:
Is the logger logging ?How much battery is left?
Device StatusStep 5:
Building Performance Module8
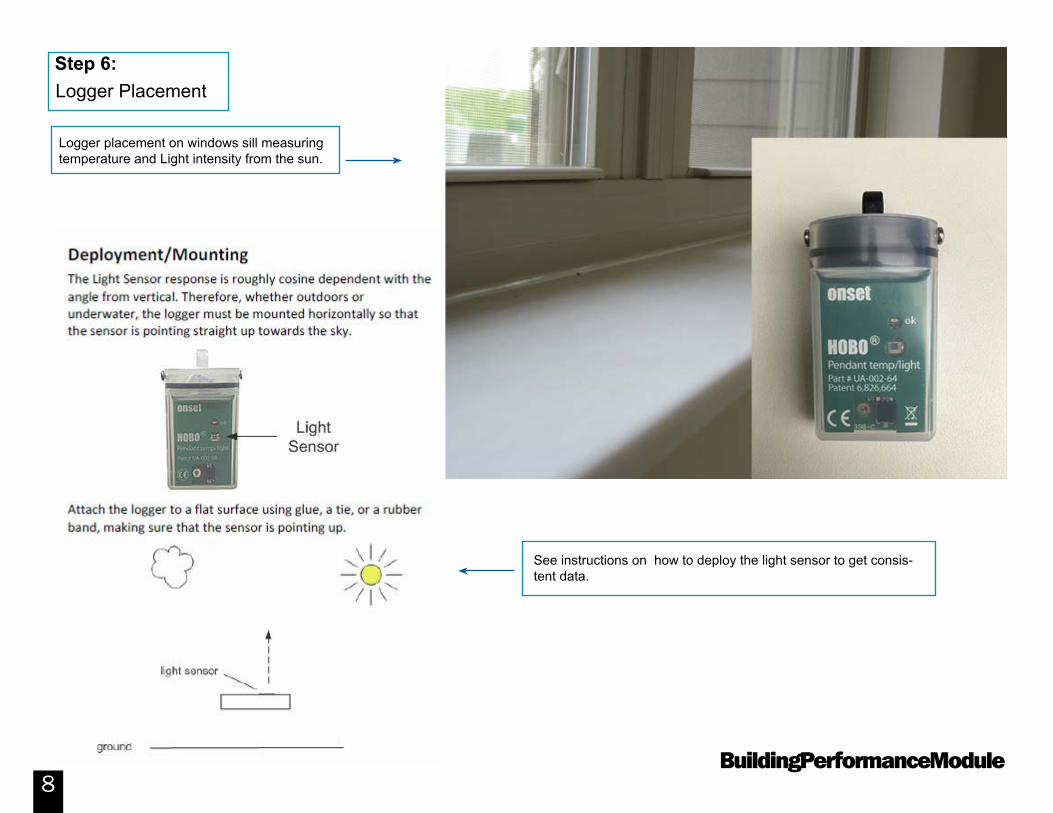
Logger placement on windows sill measuring temperature and Light intensity from the sun.
See instructions on how to deploy the light sensor to get consis-tent data.
Step 6:Logger Placement
Building Performance Module9
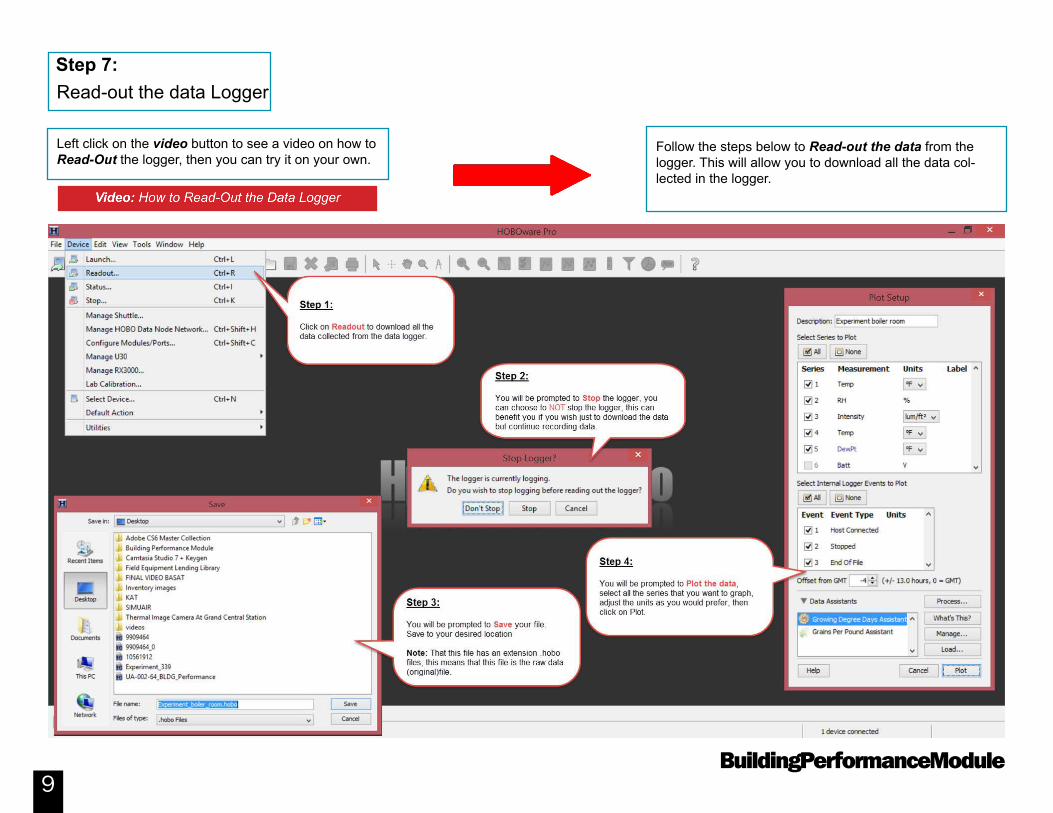
Follow the steps below to Read-out the data from the logger. This will allow you to download all the data col-lected in the logger.
Step 7:Read-out the data Logger
Left click on the video button to see a video on how to Read-Out the logger, then you can try it on your own.
Building Performance Module10
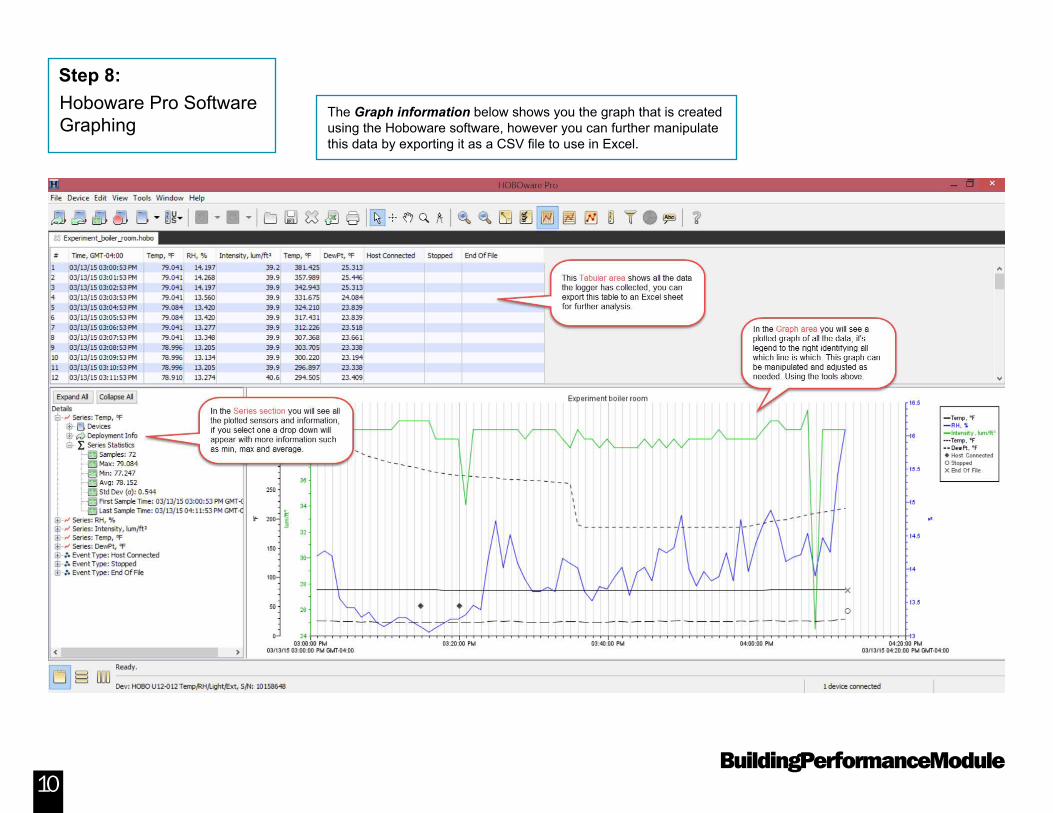
The Graph information below shows you the graph that is created using the Hoboware software, however you can further manipulate this data by exporting it as a CSV file to use in Excel.
Step 8:Hoboware Pro Software Graphing
Building Performance Module11
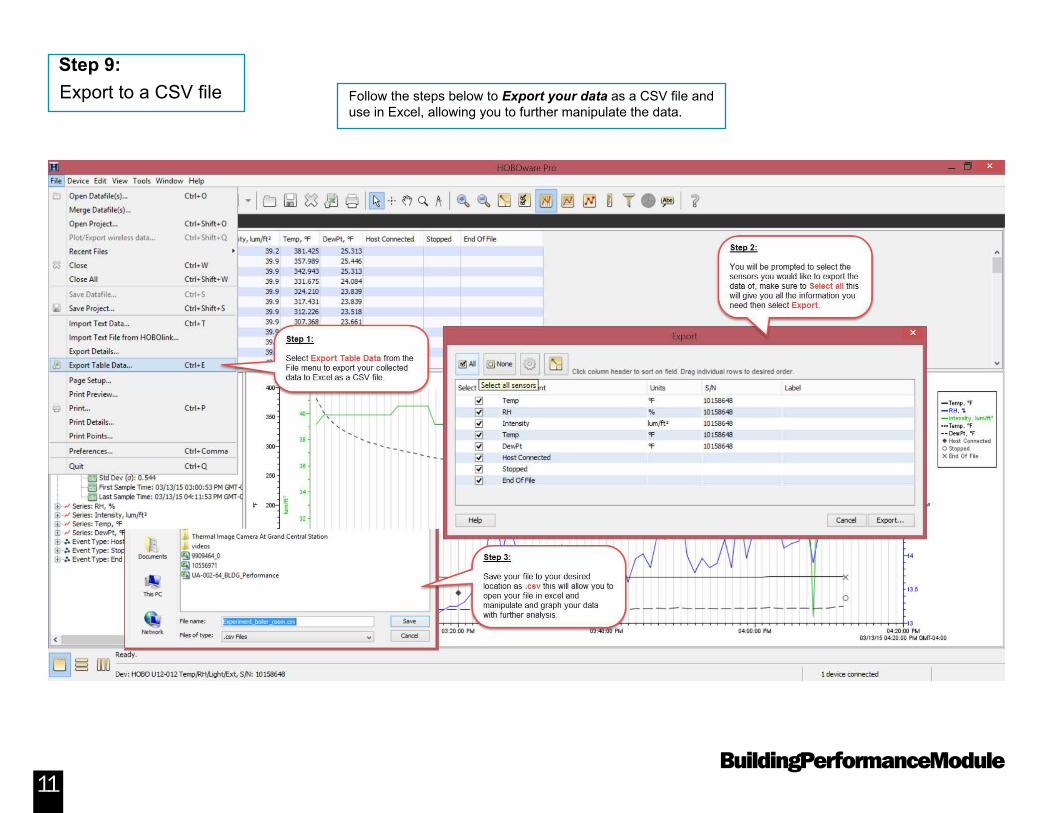
Follow the steps below to Export your data as a CSV file and use in Excel, allowing you to further manipulate the data.
Step 9:Export to a CSV file
Building Performance Module12
4- Channel Ext. Data Logger - (U12-006)
Additional Information;
Learn how to use HOBOware Software more in depth by left clicking on the buttons to the left.
Introduction to HOBOware Pro Software part 1
Introduction to HOBOware Pro Software part 2
Introduction to HOBOware Pro Software part 3
Additional References