Embed Size (px)
Citation preview


Natural Disasters are too often treated as acute problems
The scientific consensus is that natural disasters are not simply “natural” events… They are an outcome of the interaction between
biophysical systems, human systems, and their built environment
Human action (or inaction) is in large measure driving these events: We continue to develop and expand into high hazard
areas Increasing hazard exposure All too often destroy or compromise natural resources and
the potential services they are providing. A prime example are wetlands.
Ecosystem Restoration/Preservation & Coastal Hazards
Ecosystem restoration/preservation and coastal hazards are inextricably related to each other
Destruction and compromising of ecosystems, such as wetlands, can increase the severity of hazard impacts for a variety of reasons: First, there is a loss of ecosystem services Increases flooding losses as well as causalities
Second, there is increasing exposure to coastal hazards such as surge and flooding
Preservation and restoration of ecosystems can and should also be an important element of hazard mitigation policies and programs Unfortunately, as we will see, these are neglected elements
within hazard mitigation planning, particularly in Texas.
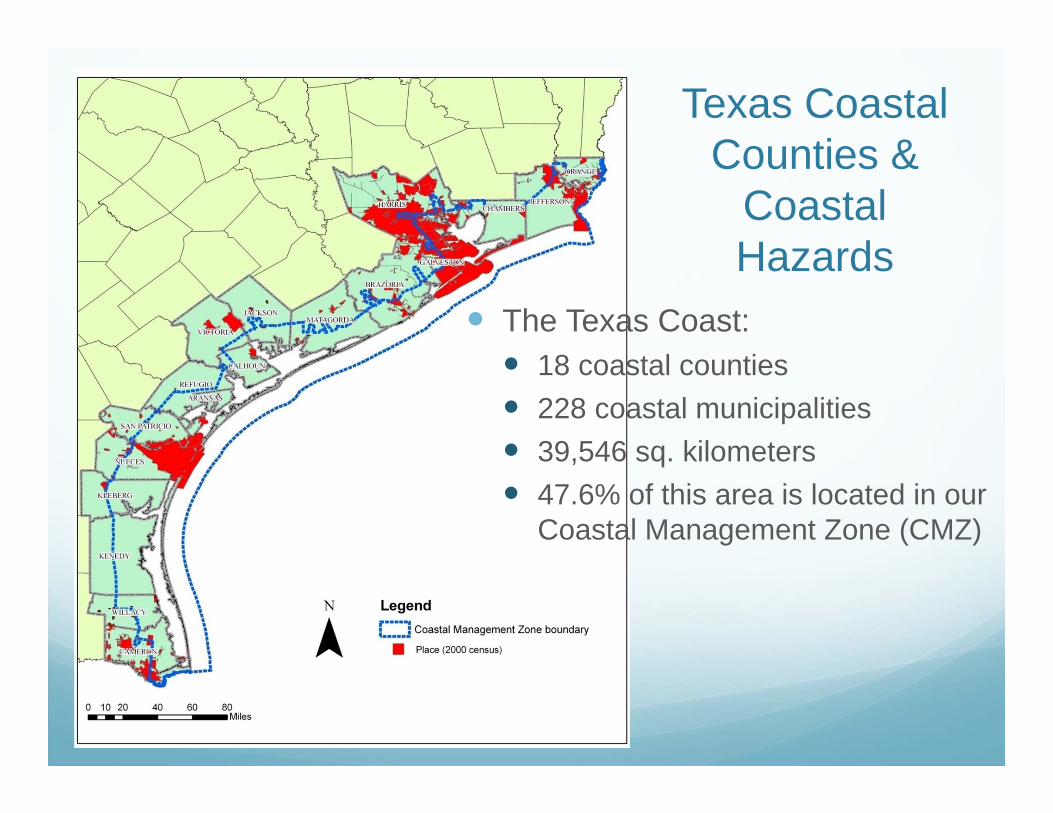
Texas Coastal Counties &
Coastal Hazards
The Texas Coast: 18 coastal counties 228 coastal municipalities 39,546 sq. kilometers 47.6% of this area is located in our
Coastal Management Zone (CMZ)
Texas Coastal Counties &
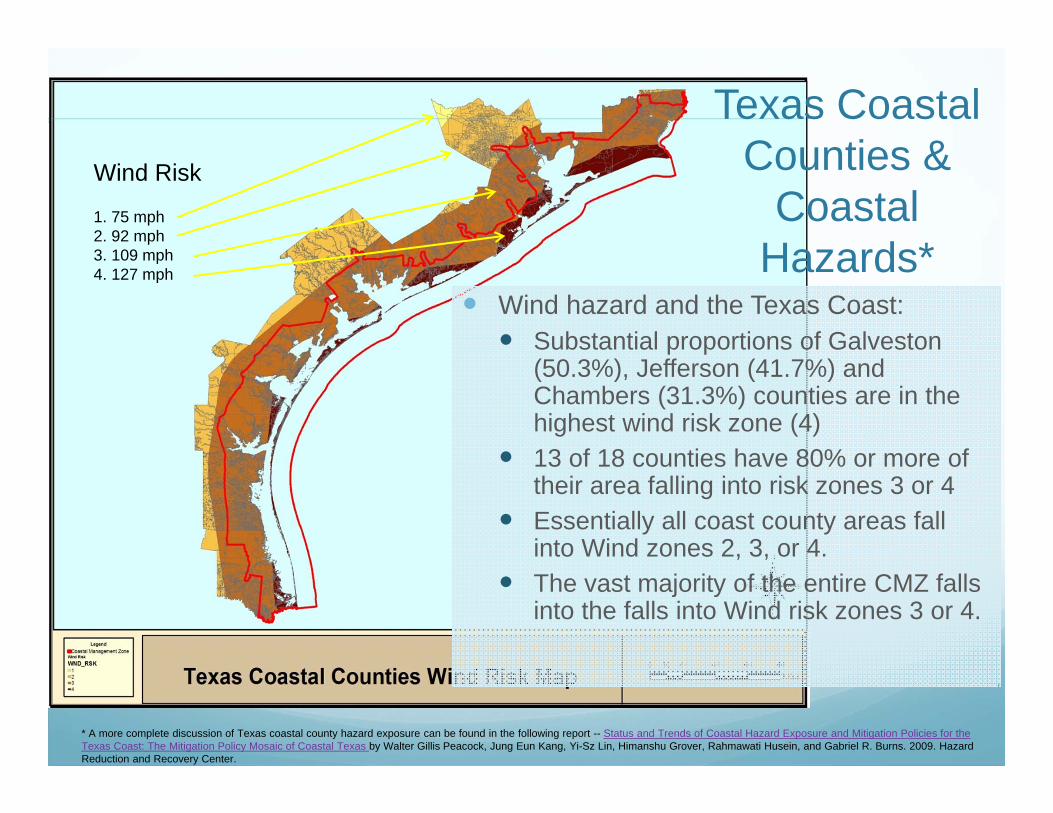
Coastal Hazards*
Wind hazard and the Texas Coast: Substantial proportions of Galveston
(50.3%), Jefferson (41.7%) and Chambers (31.3%) counties are in the highest wind risk zone (4)
13 of 18 counties have 80% or more of their area falling into risk zones 3 or 4
Essentially all coast county areas fall into Wind zones 2, 3, or 4.
The vast majority of the entire CMZ falls into the falls into Wind risk zones 3 or 4.
1. 75 mph2. 92 mph3. 109 mph4. 127 mph
Wind Risk
* A more complete discussion of Texas coastal county hazard exposure can be found in the following report -- Status and Trends of Coastal Hazard Exposure and Mitigation Policies for the Texas Coast: The Mitigation Policy Mosaic of Coastal Texas by Walter Gillis Peacock, Jung Eun Kang, Yi-Sz Lin, Himanshu Grover, Rahmawati Husein, and Gabriel R. Burns. 2009. Hazard Reduction and Recovery Center.

Texas Coastal Counties &
Coastal Hazards*
Surge Risk Zones: Between 20-24% of Calhoun, Chambers,
Galveston and Jefferson counties fall into the highest surge risk zone (5) (meaning they are vulnerable to all hurricanes).
Aransas, Calhoun, Chambers, Galveston, Jefferson and Orange counties all have 30% or more of their areas located in zones 4 & 5
Aransas, Calhoun, Chambers, Galveston, Jefferson and Orange counties all have in excess of 79% of their areas located in Cat 1 to 5 risk zones
On average, 47.1% of coastal county areas are located in hurricane surge risk zones.
Hurricane Surge Risk zones:5 = Cat. 1 or above4 = Cat. 2 or above3 = Cat. 3 or above2 = Cat. 4 or above1 = Cat. 5
* see: Status and Trends of Coastal Hazard Exposure and Mitigation Policies for the Texas Coast: The Mitigation Policy Mosaic of Coastal Texas by W.G.Peacock, J.E.Kang, Y.S. Lin, H. Grover, R.Husein, and G.R. Burns. 2009. Hazard Reduction and Recovery Center.

Texas Coastal Counties &
Coastal Hazards*
Flooding Risk Zones: 12 of 18 counties have over 20% of their areas in
flood risk areas 4 (100 year flood plain) or 5 (subject to ocean flooding with wave action) These are: Jefferson (58.6%), Chambers
(50%)Brazoria (48.3%), Orange (46.6%), Galveston (46.1%), Aransas (41.2%), Calhoun (33.9%), Cameron (33.2%), Matagorda (27.2%), Harris (21.6%), Victoria (21.5%), and Kenedy (20.9%).
All counties have over, sometimes substantially over, 20% in flood risk zones 3 (500 year), 4 (100 year) or 5 (surge). The only exception is San Patricio county at 18.4%.
All coastal county areas are at risk of flooding. Indeed, these flood zones are notoriously conservative in their assessments.
Major Flooding Risk Zones:5 = subject to ocean surge4 = 100 year flood plain3 = 500 year flood plain
* see: Status and Trends of Coastal Hazard Exposure and Mitigation Policies for the Texas Coast: The Mitigation Policy Mosaic of Coastal Texas by W.G.Peacock, J.E.Kang, Y.S. Lin, H. Grover, R.Husein, and G.R. Burns. 2009. Hazard Reduction and Recovery Center.
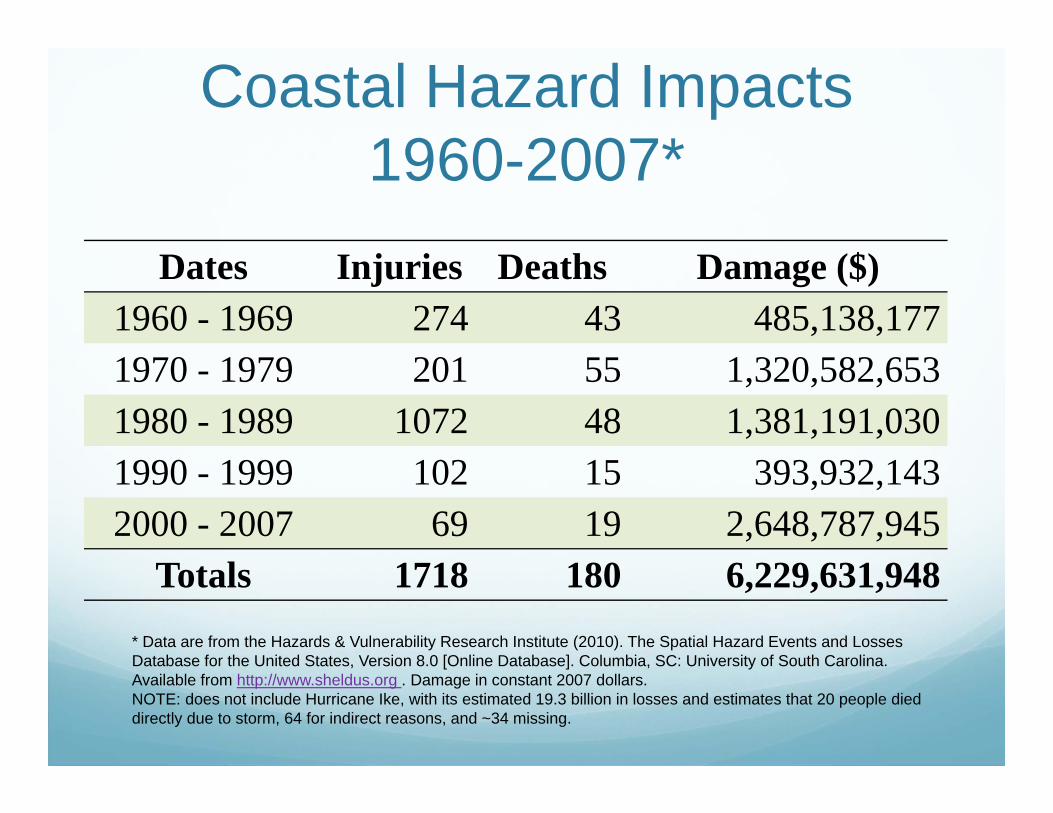
Coastal Hazard Impacts 1960-2007*
* Data are from the Hazards & Vulnerability Research Institute (2010). The Spatial Hazard Events and Losses Database for the United States, Version 8.0 [Online Database]. Columbia, SC: University of South Carolina. Available from http://www.sheldus.org . Damage in constant 2007 dollars. NOTE: does not include Hurricane Ike, with its estimated 19.3 billion in losses and estimates that 20 people died directly due to storm, 64 for indirect reasons, and ~34 missing.
Dates Injuries Deaths Damage ($)1960 - 1969 274 43 485,138,177 1970 - 1979 201 55 1,320,582,653 1980 - 1989 1072 48 1,381,191,030 1990 - 1999 102 15 393,932,143 2000 - 2007 69 19 2,648,787,945
Totals 1718 180 6,229,631,948

Coastal Hazard Impacts 1960-2008
** Including Ike’s estimates, interpret with caution**
Hazards & Vulnerability Research Institute (2010). The Spatial Hazard Events and Losses Database for the United States, Version 8.0 [Online Database]. Columbia, SC: University of South Carolina. Available from http://www.sheldus.org . Damage in constant 2007 dollars. NOTE: does not include Hurricane Ike, with its estimated 19.3 billion in losses and estimates that 20 people died directly due to storm, 64 for indirect reasons, and ~34 missing.
Dates Injuries Deaths Damage ($)1960 - 1969 274 43 485,138,177 1970 - 1979 201 55 1,320,582,653 1980 - 1989 1072 48 1,381,191,030 1990 - 1999 102 15 393,932,143 2000 - 2007 69 19 2,648,787,945
Totals 1718 180 6,229,631,948 21,948,787,94510325,529,631,948264
Texas Coastal Counties & Coastal Hazards
Clearly we see substantial hazard exposure when considering wind, surge, and flooding to Texas coastal counties.
And, we also see substantial losses, particularly when we factor in Hurricane Ike.
Coastal counties have also experience considerable population growth and increasing demographic diversity.

Coastal County Population Trends*
0
1000000
2000000
3000000
4000000
5000000
6000000
7000000
1980 1990 2000 2010
total
white
black
hispanic
Significant overall population growth: 3.8 million to 6.1 million 57.8% increase in population
Increased diversity White: 2.87 m. to 3.86 m.
34.3% increase Black: 630K to 979K
55.3% increase Hispanic: 824K to 2.6 m.
214.7% increase
NET RESULT: Increasing concentrations of an increasingly diverse population in coastal counties which are themselves highly exposed and vulnerable to coastal hazards
*Data from the U. S. CensusPopulation Size and Composition: Texas Coastal Counties
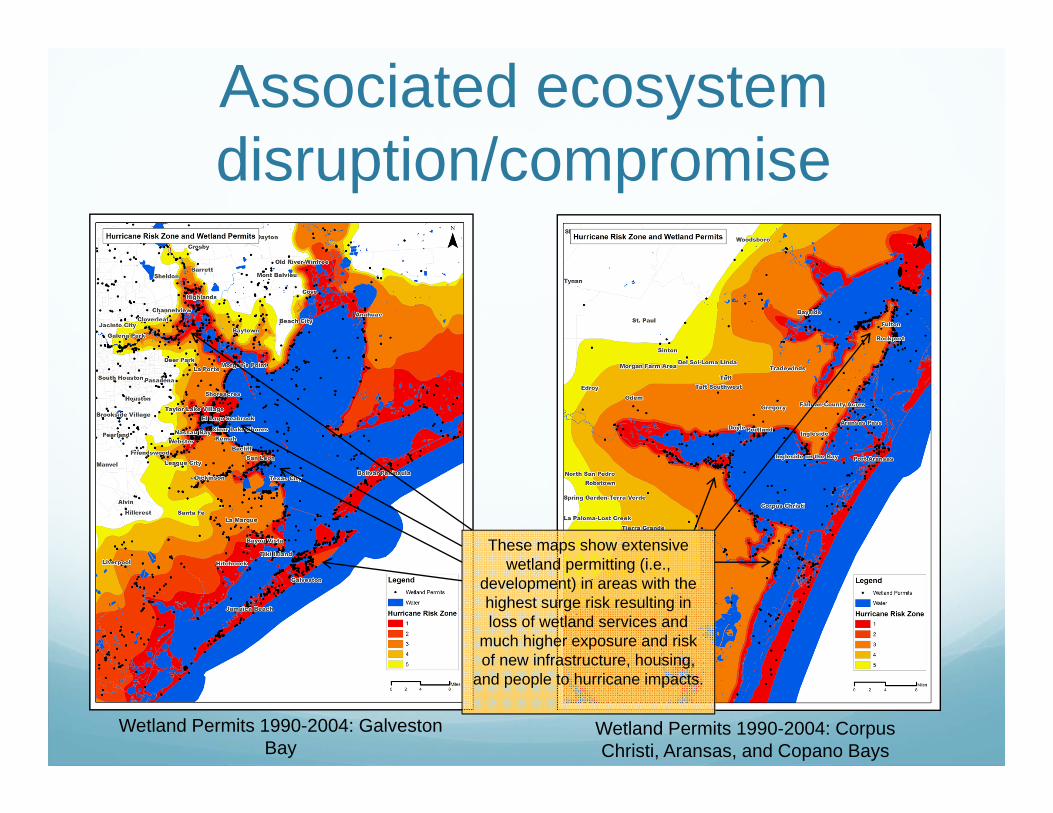
Associated ecosystem disruption/compromise
Wetland Permits 1990-2004: Galveston Bay
Wetland Permits 1990-2004: Corpus Christi, Aransas, and Copano Bays
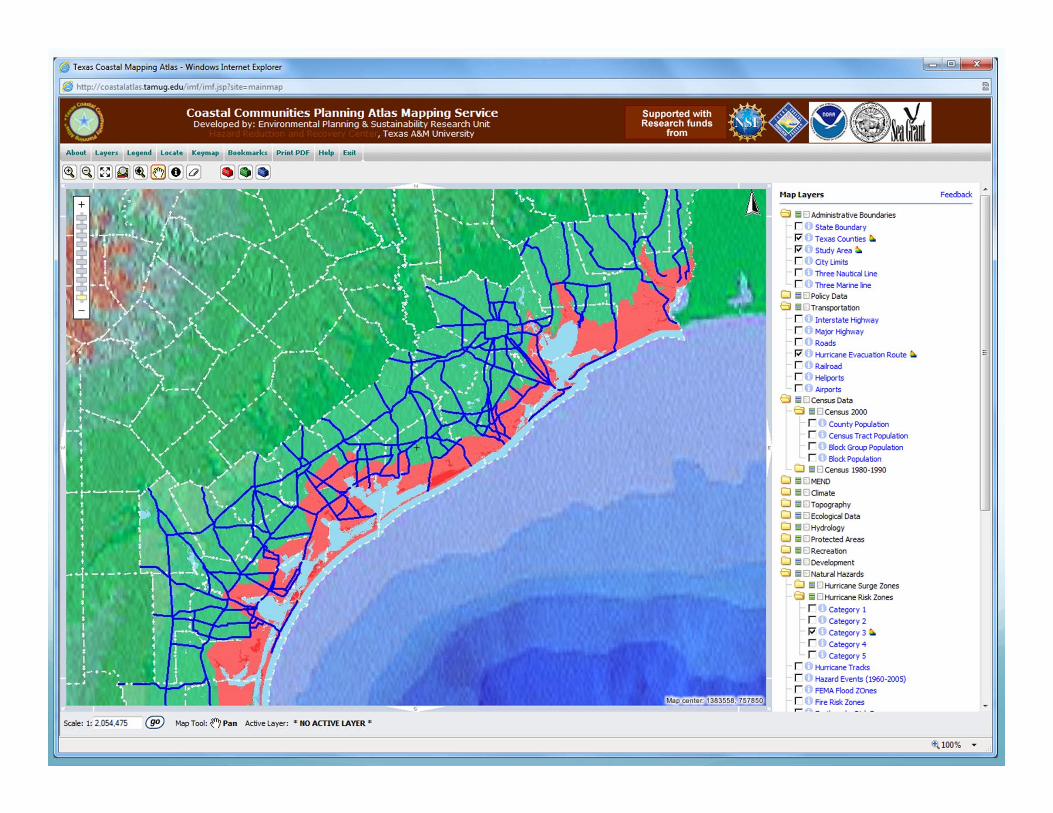
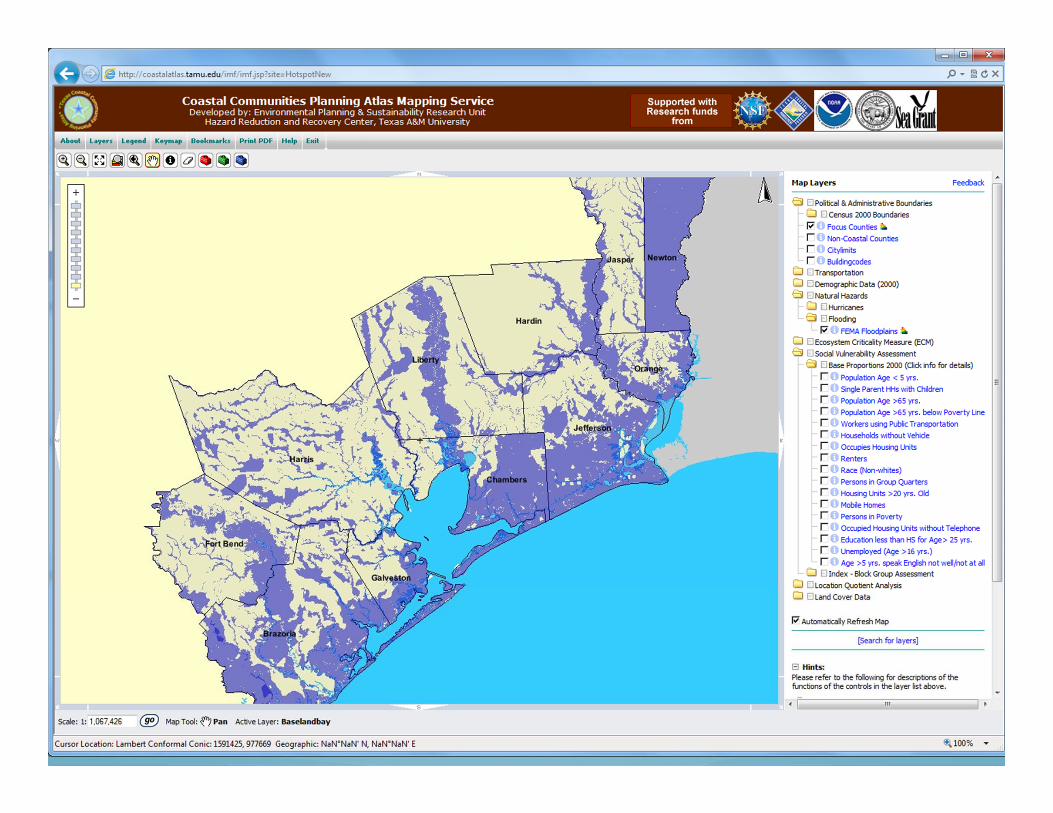
These maps show extensive wetland permitting (i.e.,
development) in areas with the highest surge risk resulting in loss of wetland services and
much higher exposure and risk of new infrastructure, housing,
and people to hurricane impacts.

Development in higher hazard areas can have consequences
This is a close up map of Galveston Island. Note the extensive concentration of
wetland permits often associated with residential
development around OffattsBayou and Greens Bayou.
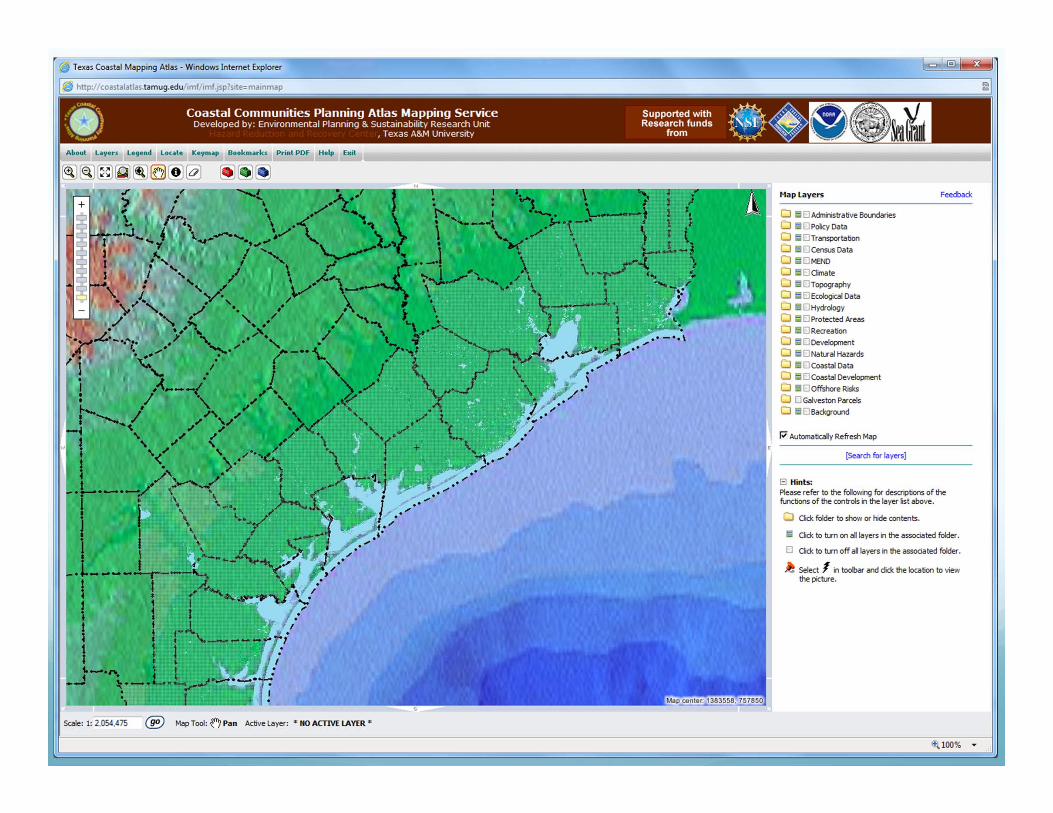
This map is from the coastal planning atlas, a web based planning tool developed and hosted by the Center for Texas Beaches and Shores at Texas A&M Galveston and the Hazard Reduction and Recovery Center at Texas A&M College Station. See coastalatlas.tamu.edu or coastalatlas.tamug.edu

Development in higher hazard areas can have consequences
These data* are from a damage survey of over 1500 single family homes following Hurricane Ike. The red dots indicate extensively damage
homes. Note the concentrations of higher
damaged homes associated with the wetland permits
around these same bayous when compared to the lighter (yellow) damage in the urban core of the city of Galveston
*For a more complete discussion of these data and analysis see: Van Zandt et al forthcoming; Peacock et al. forthcoming; and Highfield et al. 2011.

Disconnect between hazard mitigation and ecosystem protection/restoration*
12 Hazard Mitigation Plans 3 municipalities, 4 county, & 5
regional 18 counties and 112
municipalities
Few ecosystem issues mentioned Wetland restoration (1 plan)
Of the 836 mitigation actions proposed: Structural: 34.4% Emergency management:
24.1% Regulatory/planning: 25.8% Education/Awareness: 14.4% Natural resource
protection/restoration: 1.4%* For a more complete discussion of these findings and data collection see: Kang, Peacock and Husein 2010 and Peacock et al. 2009.
Disconnect between hazard mitigation and ecosystem protection/restoration
NotAtAll
SmallExtent
SomeExtent
VeryGreatExtent Total
Wetlandprotection
67 11 18 24 120
55.8% 9.2% 15.0% 20.0% 100.0%Coastal
Vegetationprotection
93 5 10 12 120
77.5% 4.2% 8.3% 10.0% 100.0%Habitat
protection/restoration
81 12 18 9 120
67.5% 10.0% 15.0% 7.5% 100.0%Protectedareas
76 17 14 13 12063.3% 14.2% 11.7% 10.8% 100.0%
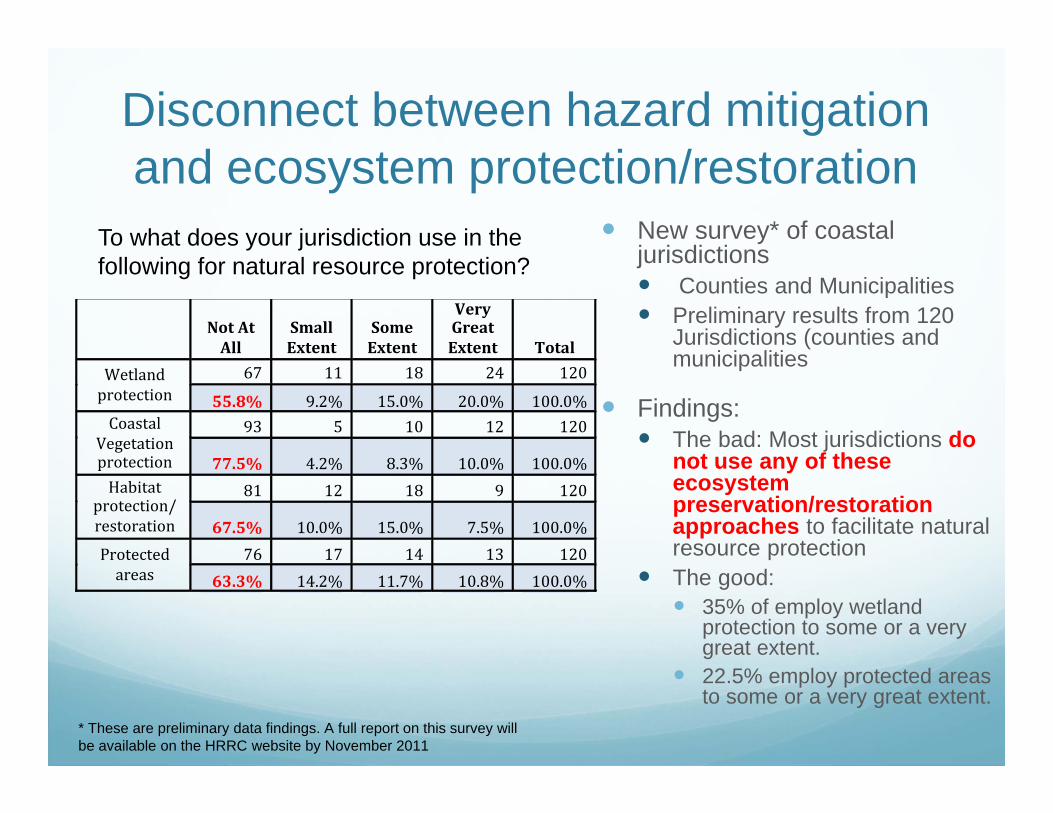
New survey* of coastal jurisdictions Counties and Municipalities Preliminary results from 120
Jurisdictions (counties and municipalities
Findings: The bad: Most jurisdictions do
not use any of these ecosystem preservation/restoration approaches to facilitate natural resource protection
The good: 35% of employ wetland
protection to some or a very great extent.
22.5% employ protected areas to some or a very great extent.
To what does your jurisdiction use in the following for natural resource protection?
* These are preliminary data findings. A full report on this survey will be available on the HRRC website by November 2011

Recommendation 1 We must do a better job of linking ecosystem
restoration and preservation with hazard mitigation policies and planning activities: This might be accomplished through: Education programs related to hazard mitigation training Incentives to enhance ecosystem restoration/preservation as
a part of effective hazard mitigation planning Guidelines: modify FEMA and State hazard mitigation
guidelines Mandates for ecosystem preservation/restoration to obtain
hazard mitigation funding from the federal and state government.
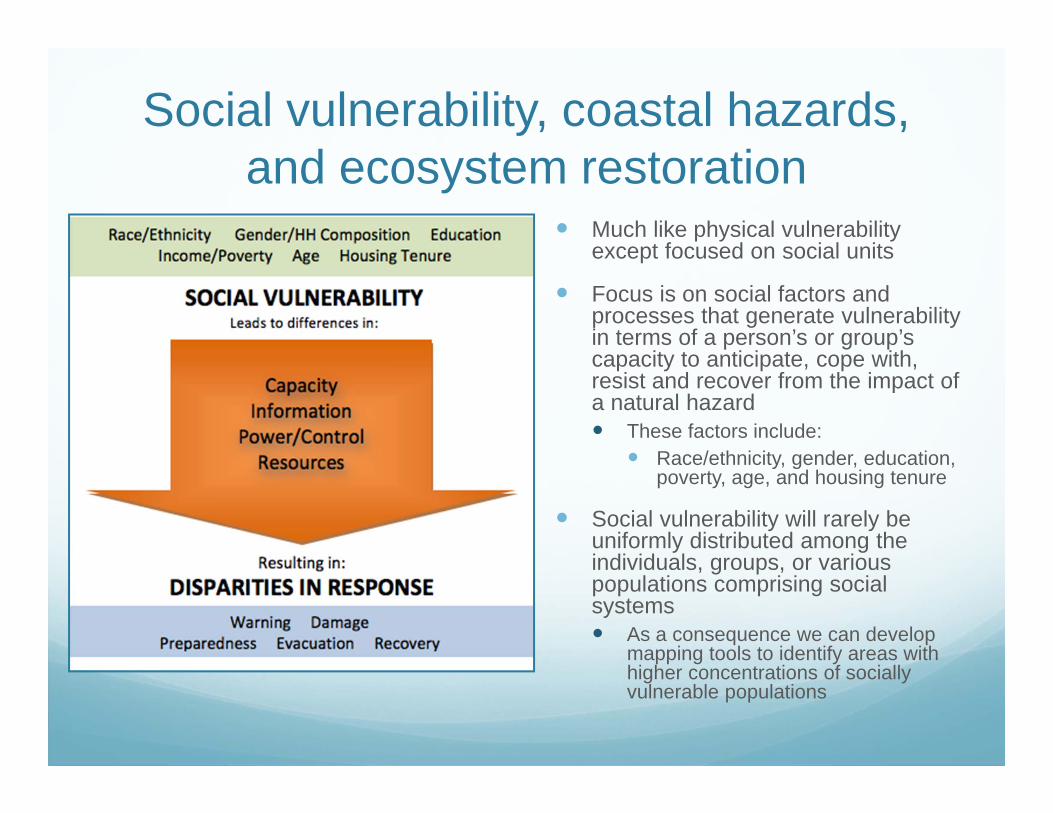
Social vulnerability, coastal hazards, and ecosystem restoration
Much like physical vulnerability except focused on social units
Focus is on social factors and processes that generate vulnerability in terms of a person’s or group’s capacity to anticipate, cope with, resist and recover from the impact of a natural hazard These factors include:
Race/ethnicity, gender, education, poverty, age, and housing tenure
Social vulnerability will rarely be uniformly distributed among the individuals, groups, or various populations comprising social systems As a consequence we can develop
mapping tools to identify areas with higher concentrations of socially vulnerable populations

Social vulnerability mapping strategy
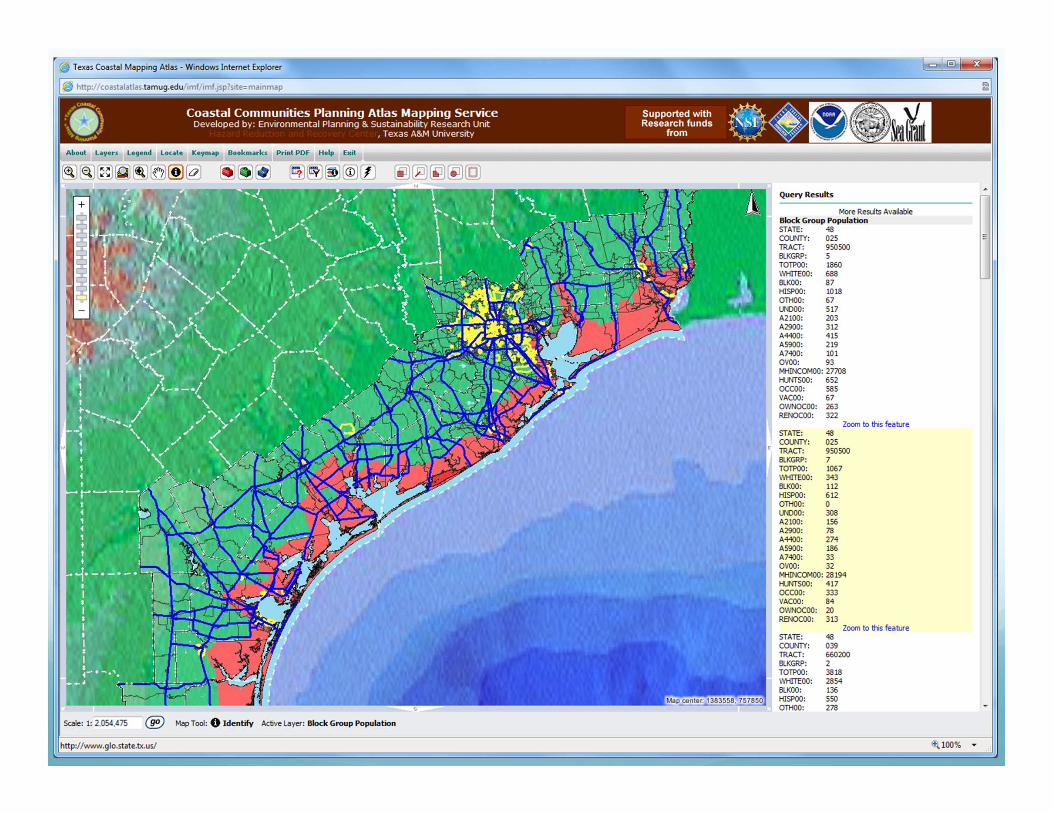
This table displays 1st order (base indicators) 2nd order, and 3rd order social vulnerability indicators that can be mapped using data available on the Texas Coastal Planning Atlas: coastalatlas.tamu.edu or coastalatlas.tamug.edu
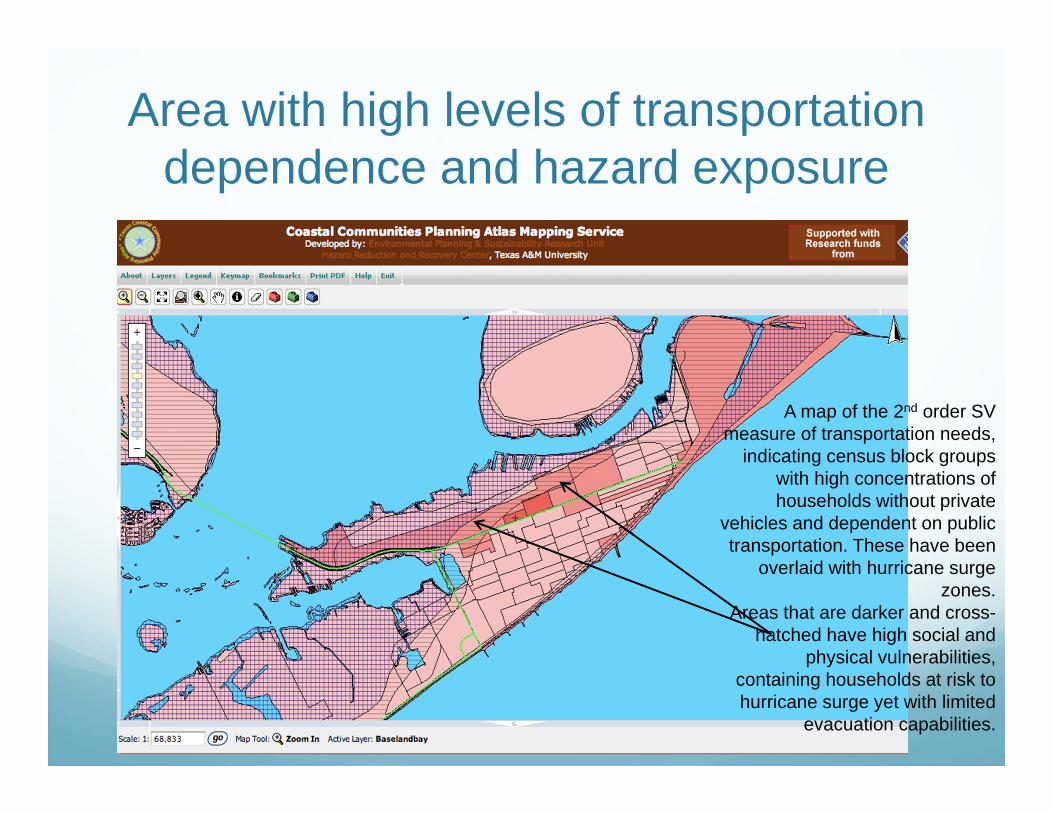
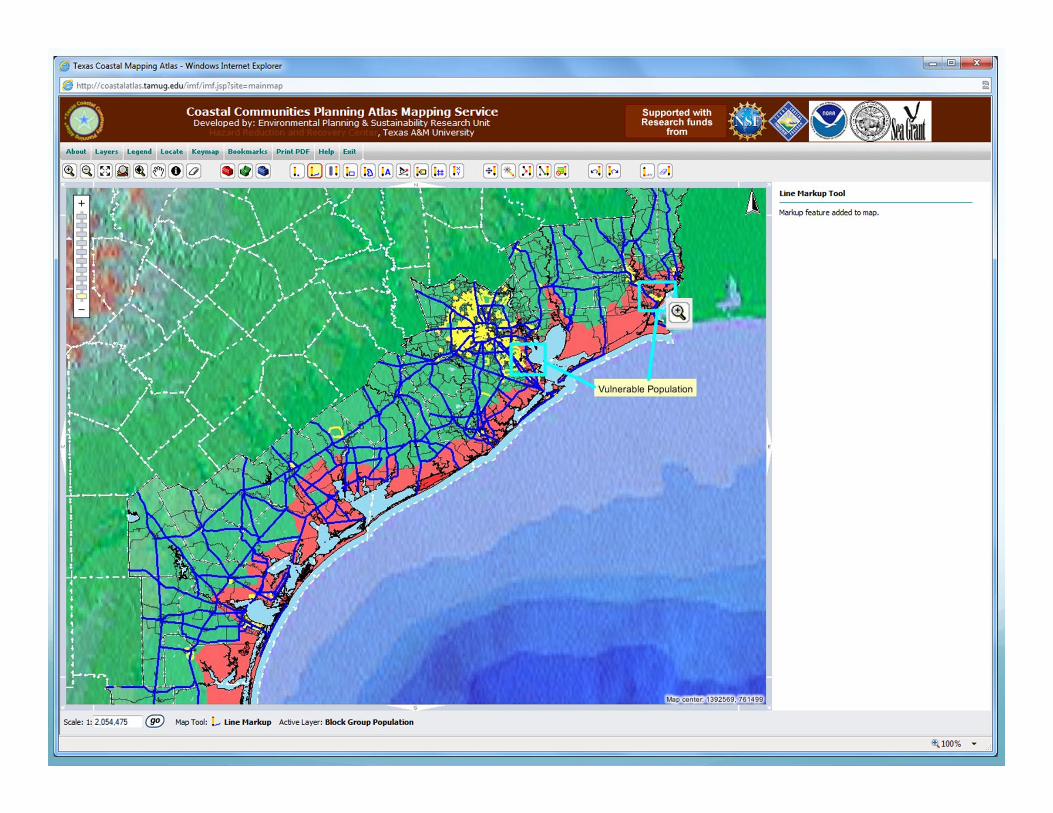
Area with high levels of transportation dependence and hazard exposure
A map of the 2nd order SV measure of transportation needs,
indicating census block groups with high concentrations of households without private
vehicles and dependent on public transportation. These have been
overlaid with hurricane surge zones.
Areas that are darker and cross-hatched have high social and
physical vulnerabilities, containing households at risk to hurricane surge yet with limited
evacuation capabilities.
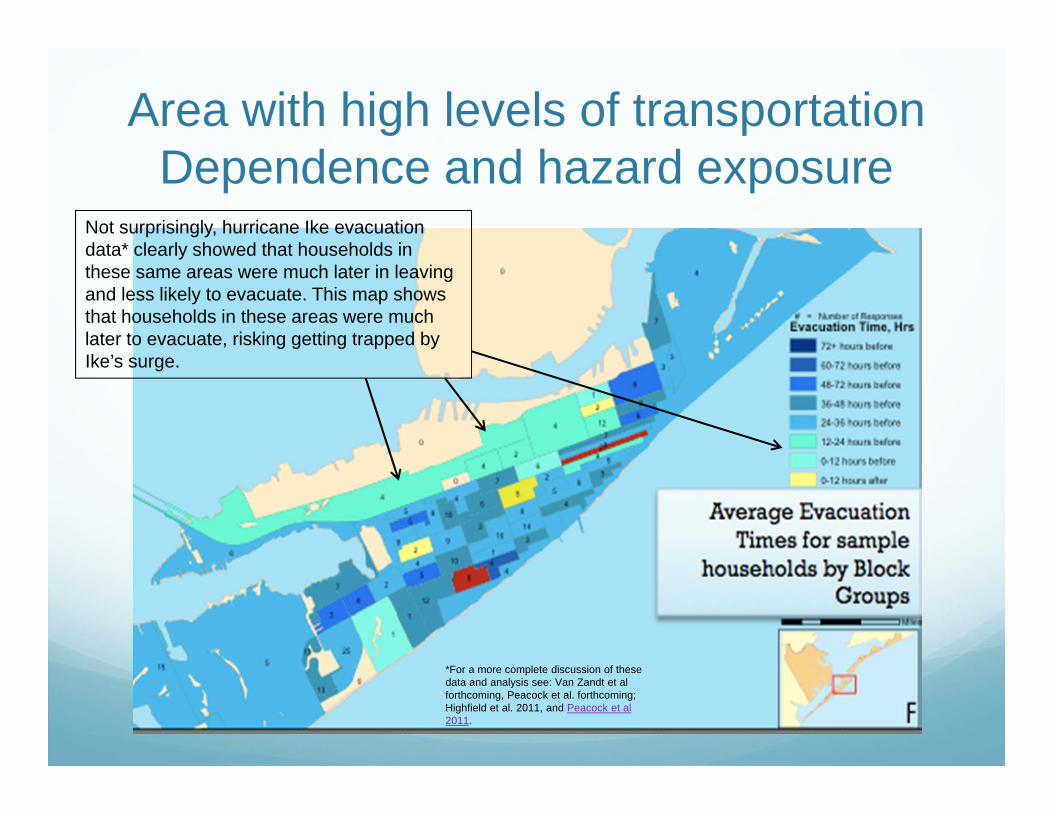
Area with high levels of transportation Dependence and hazard exposure
Not surprisingly, hurricane Ike evacuation data* clearly showed that households in these same areas were much later in leaving and less likely to evacuate. This map shows that households in these areas were much later to evacuate, risking getting trapped by Ike’s surge.
*For a more complete discussion of these data and analysis see: Van Zandt et al forthcoming, Peacock et al. forthcoming; Highfield et al. 2011, and Peacock et al 2011.
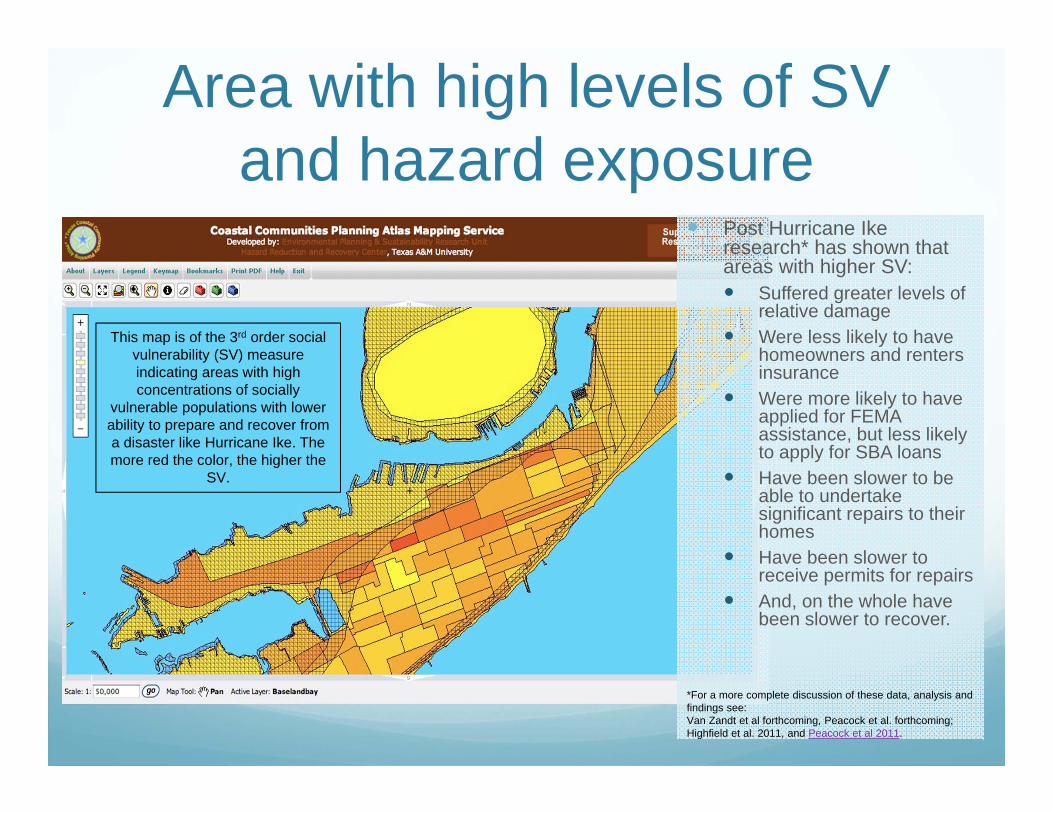
Area with high levels of SV and hazard exposure
Post Hurricane Ike research* has shown that areas with higher SV: Suffered greater levels of
relative damage Were less likely to have
homeowners and renters insurance
Were more likely to have applied for FEMA assistance, but less likely to apply for SBA loans
Have been slower to be able to undertake significant repairs to their homes
Have been slower to receive permits for repairs
And, on the whole have been slower to recover.
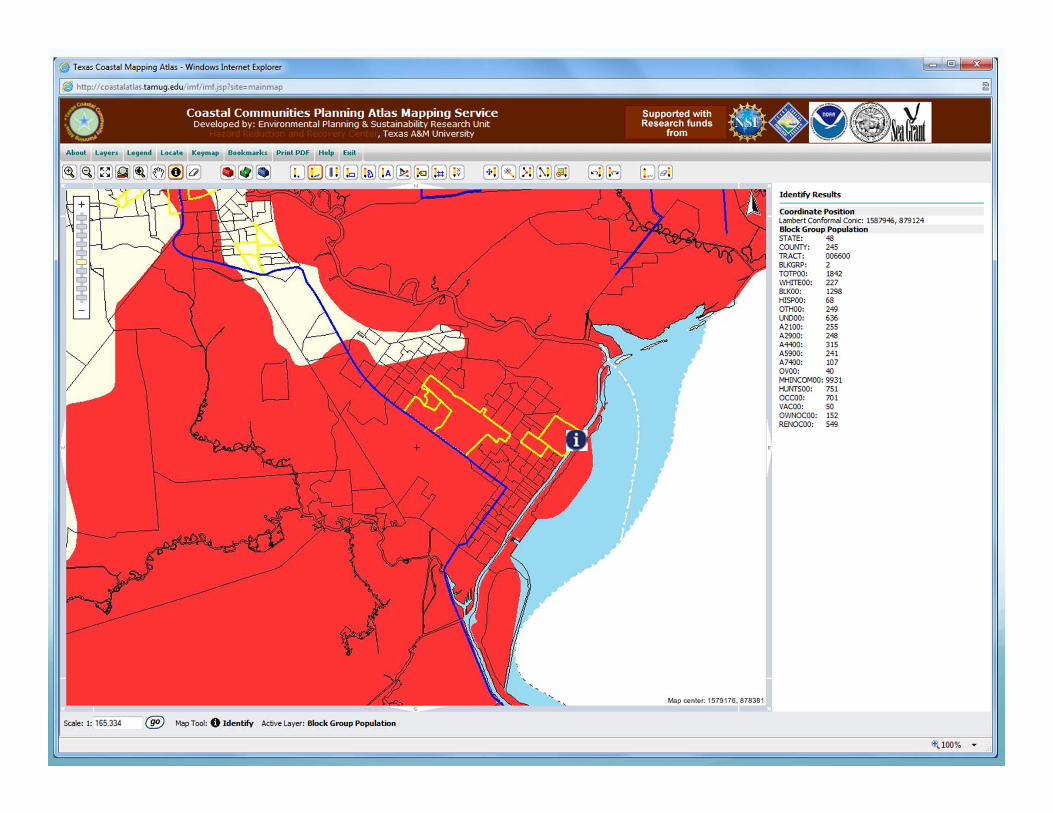
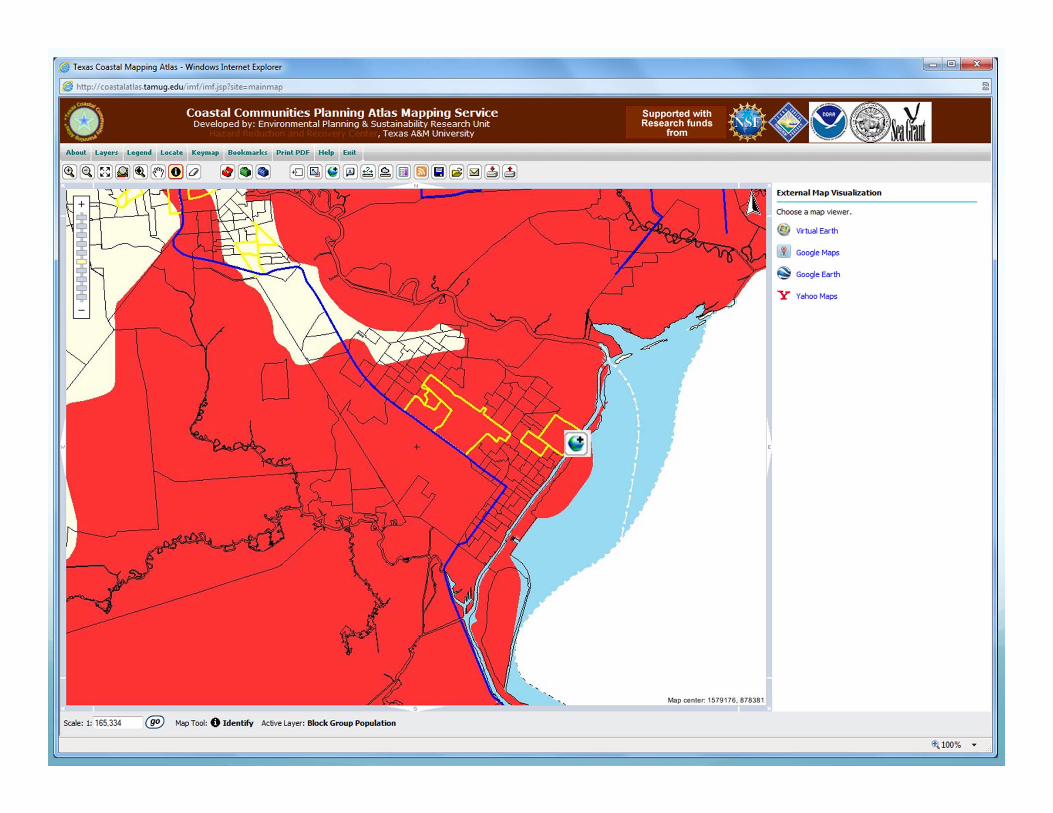
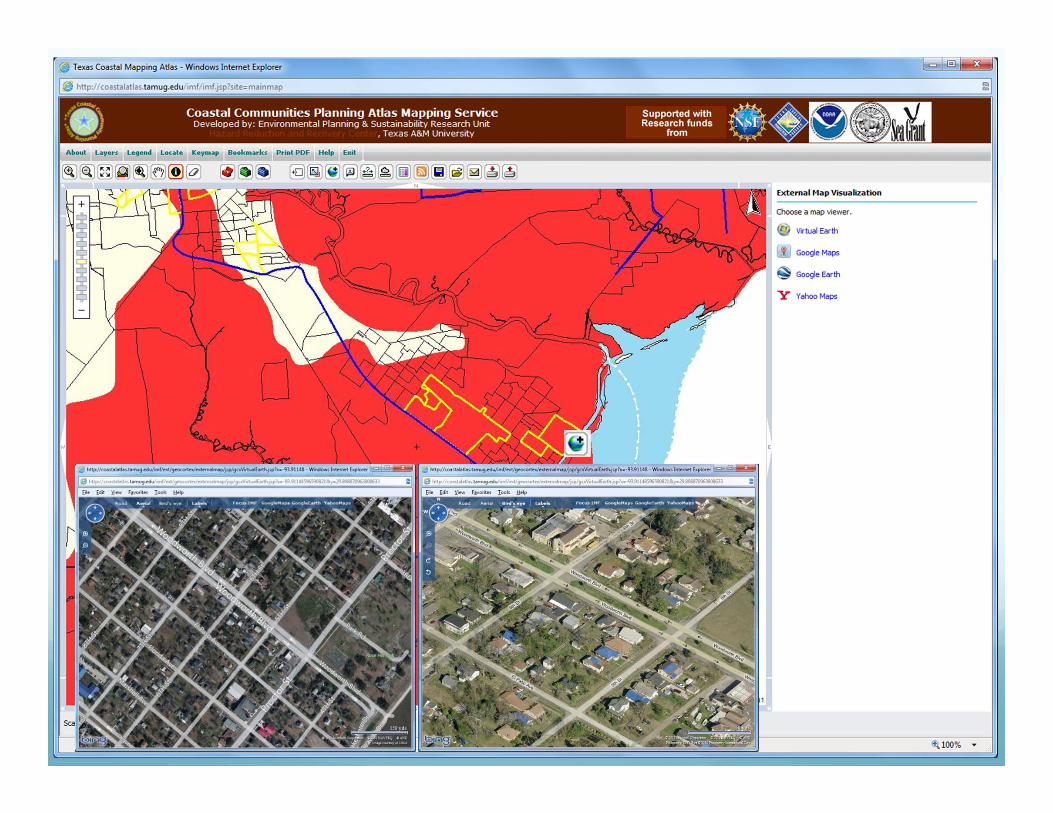
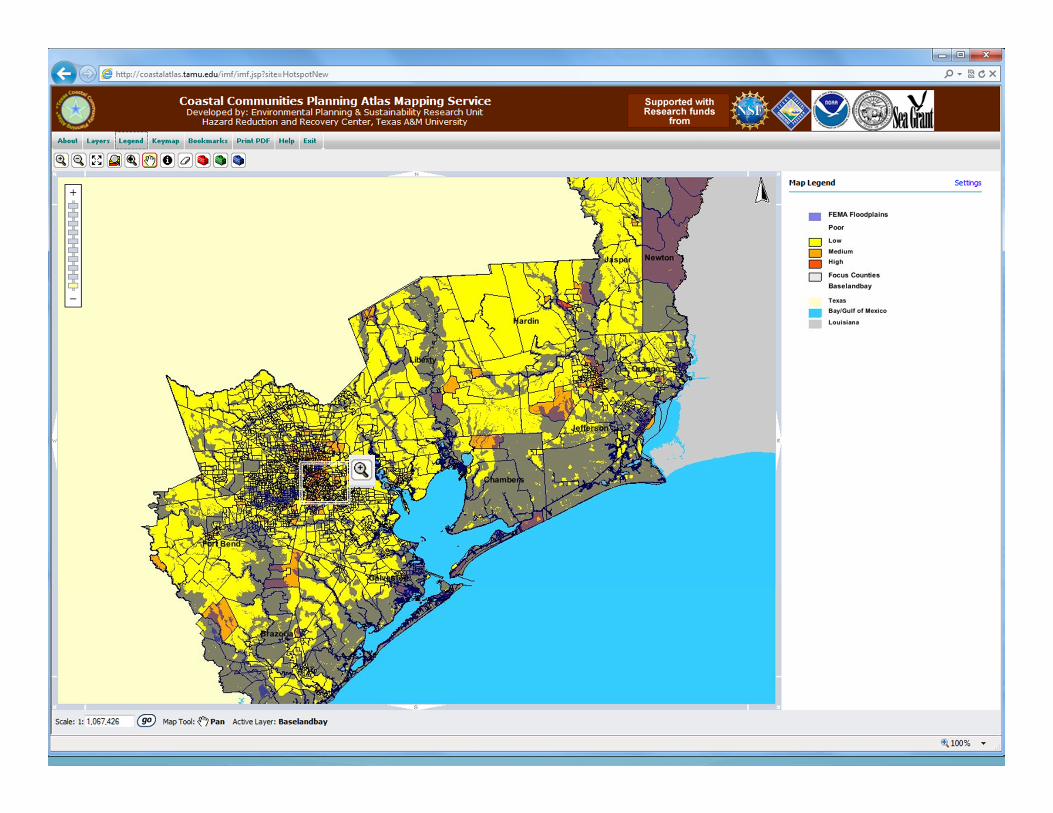
This map is of the 3rd order social vulnerability (SV) measure indicating areas with high concentrations of socially
vulnerable populations with lower ability to prepare and recover from a disaster like Hurricane Ike. The more red the color, the higher the
SV.
*For a more complete discussion of these data, analysis and findings see: Van Zandt et al forthcoming, Peacock et al. forthcoming; Highfield et al. 2011, and Peacock et al 2011.
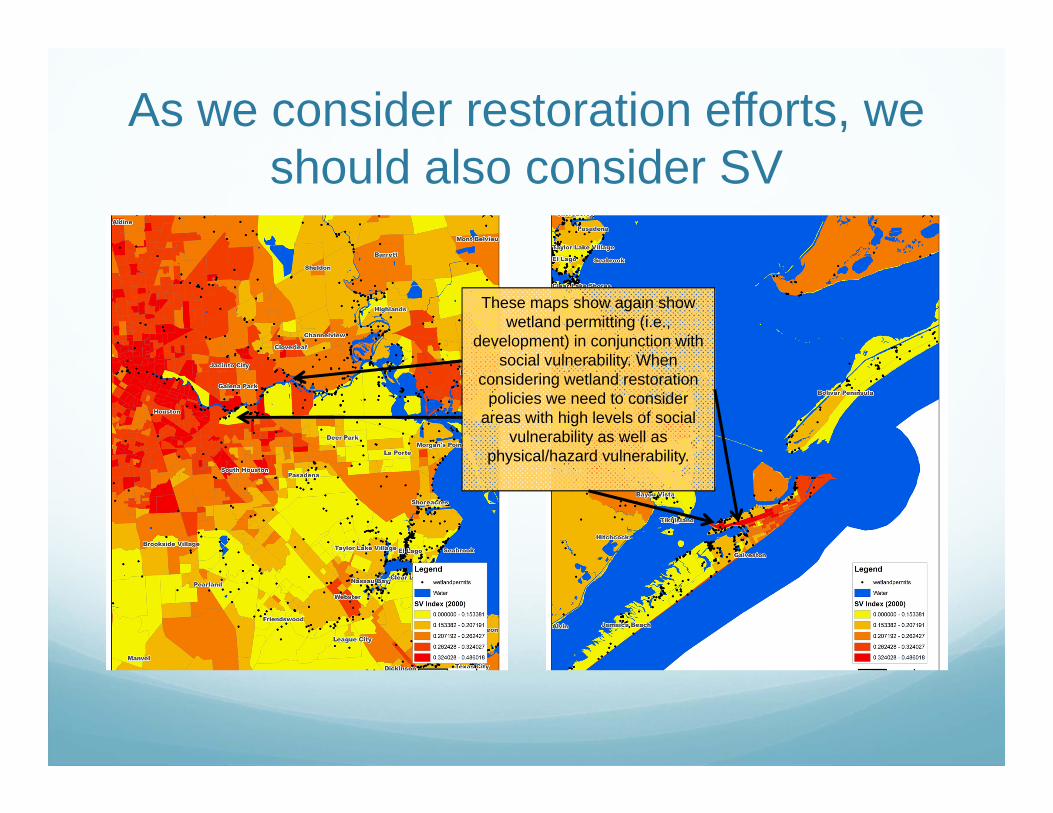
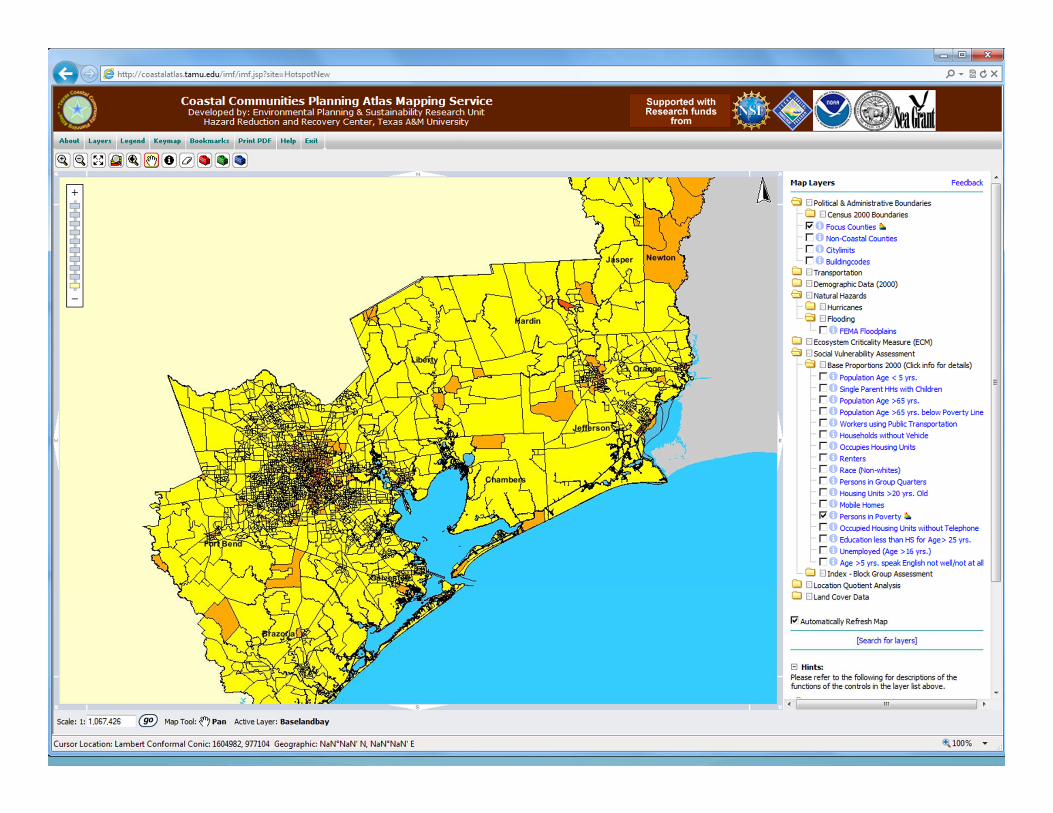
As we consider restoration efforts, we should also consider SV
These maps show again show wetland permitting (i.e.,
development) in conjunction with social vulnerability. When
considering wetland restoration policies we need to consider
areas with high levels of social vulnerability as well as
physical/hazard vulnerability.
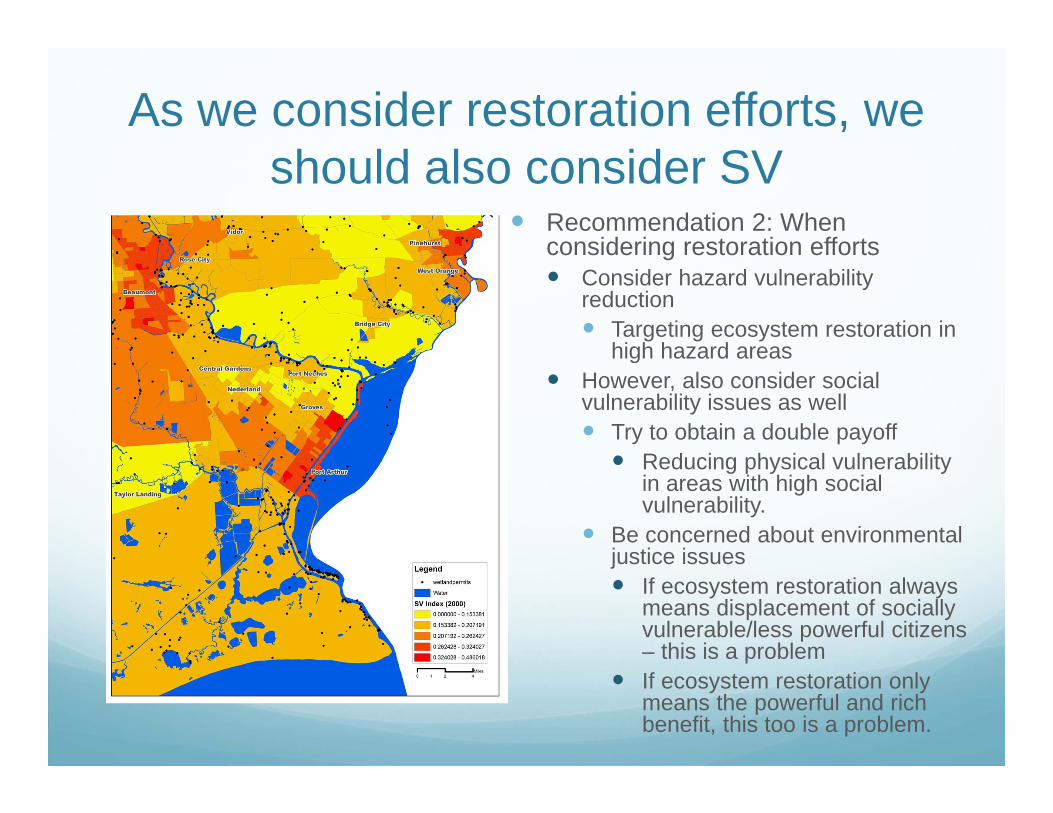
As we consider restoration efforts, we should also consider SV
Recommendation 2: When considering restoration efforts Consider hazard vulnerability
reduction Targeting ecosystem restoration in
high hazard areas However, also consider social
vulnerability issues as well Try to obtain a double payoff Reducing physical vulnerability
in areas with high social vulnerability.
Be concerned about environmental justice issues If ecosystem restoration always
means displacement of socially vulnerable/less powerful citizens – this is a problem
If ecosystem restoration only means the powerful and rich benefit, this too is a problem.

Coastal hazards, social vulnerability, and ecosystem restoration/preservation
Texas coastal counties are highly vulnerable to a variety of coastal hazards (wind, surge, and flooding)
The population of these counties had grown substantially from 1980 to 2010 and has become highly diverse
That population growth has been coupled with substantial development of fragile wetland ecosystems Resulting in
Loss of ecosystem services Increased hazard exposure
There is a marked disconnect between hazard mitigation and ecosystem restoration/preservation
Recommendations: Link hazard mitigation to
ecosystem restoration/preservation particularly with respect to
wetlands and habitat When targeting ecosystem
restoration/preservation Consider hazard reduction
issues AND -- Consider social
vulnerability issues
References
Kang, Jung Eun, Walter Gillis Peacock, and Rahmawati Husein. 2010. An Assessment of Coastal Zone Hazard Mitigation Plans in Texas. Journal of Disaster Research, 5(5):526-34.
Walter Gillis Peacock, Shannon Van Zandt, Dustin Henry, Himanshu Grover and Wesley Highfield. Forthcoming. Social Vulnerability and Hurricane Ike: Using Social Vulnerability Mapping to Enhance Coastal Community Resiliency in Texas. Chapter 7 in Sever Storm Prediction, Impact, and Recovery on the Texas Gulf Coast. Edited by Phillip B. Bedient. College Station, Texas: Texas A&M Press.
Peacock, Walter Gillis, Jung Eun Kang, Yi-Sz Lin, Himanshu Grover, Rahmawati Husein, and Gabriel R. Burns. 2009. Status and Trends of Coastal Hazard Exposure and Mitigation Policies for the Texas Coast: The Mitigation Policy Mosaic of Coastal Texas. A Report Prepared for the Texas General Land Office and The National Oceanic and Atmospheric Administration Under GLO Contract No. 07-005-21. Hazard Reduction and Recovery Center, College of Architecture, Texas A&M University.
Peacock, Walter Gillis, Jung Eun Kang, Rahmawati Husein, Gabriel R. Burns, Carla Prater, Samuel Brody and Tommy Kennedy. 2009. An Assessment of Coastal Zone Hazard Mitigation Plans in Texas. A Report Prepared for the Texas General Land Office and The National Oceanic and Atmospheric Administration Under GLO Contract No. 07-005-21. Hazard Reduction and Recovery Center, College of Architecture, Texas A&M University.
Van Zandt, Shannon, Walter Gillis Peacock, Dustin Henry, Himanshu Grover, Wesley Highfield, and Sam Brody. Forthcoming.Mapping Social Vulnerability to Enhance Housing and Neighborhood Resilience. Housing Policy Debate.
Zahran, Sammy, Samuel D. Brody, Walter Gillis Peacock, Himanshu Grover, Arnold Vedlitz. 2008. Social Vulnerability and Flood Casualties in Texas, 1997-2001. Disasters 32(4): 537-560.


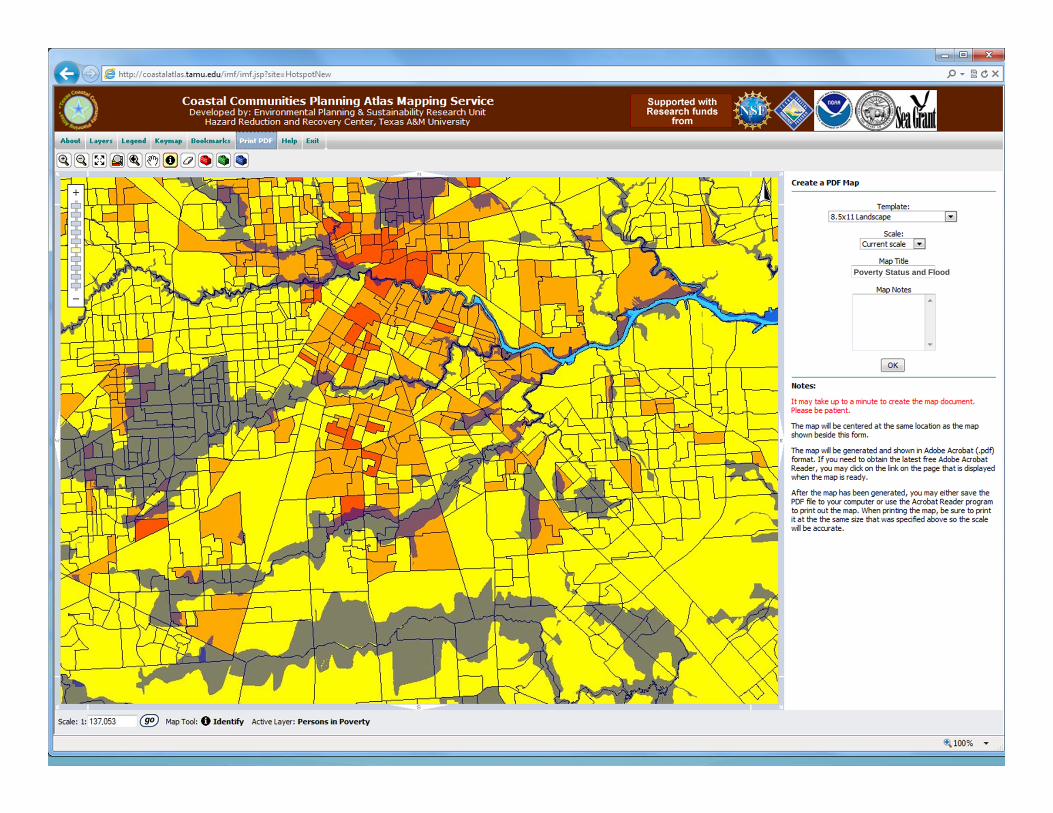
Poverty Status and Flood