Embed Size (px)
Citation preview
Qualitative Text AnalysisUsing Azure and Power BI
Sanil Mhatre@sqlsuperguru
https://sqlwithsanil.wordpress.com/https://github.com/SQLSuperGuru
About me
• Senior Developer – Data Analytics @ WWT
• DBA, Developer, Architect, Amateur Data Scientist
• Oracle, SQL Server, My SQL, DB2, Mongo, Vertica
• Cloud, Big Data & Hadoop, Data Visualization
• Speaking, Blogging & volunteering

Agenda
• From Qualitative to Quantitative
• Employee Survey for Acme Corp.
• AI + Cognitive Services – Text Analytics APIs
• Power BI
• ETL with Power BI & Azure
• Visual Analytics
• Dashboards & Power BI Service
• Gaining useful Insights
• Q&A
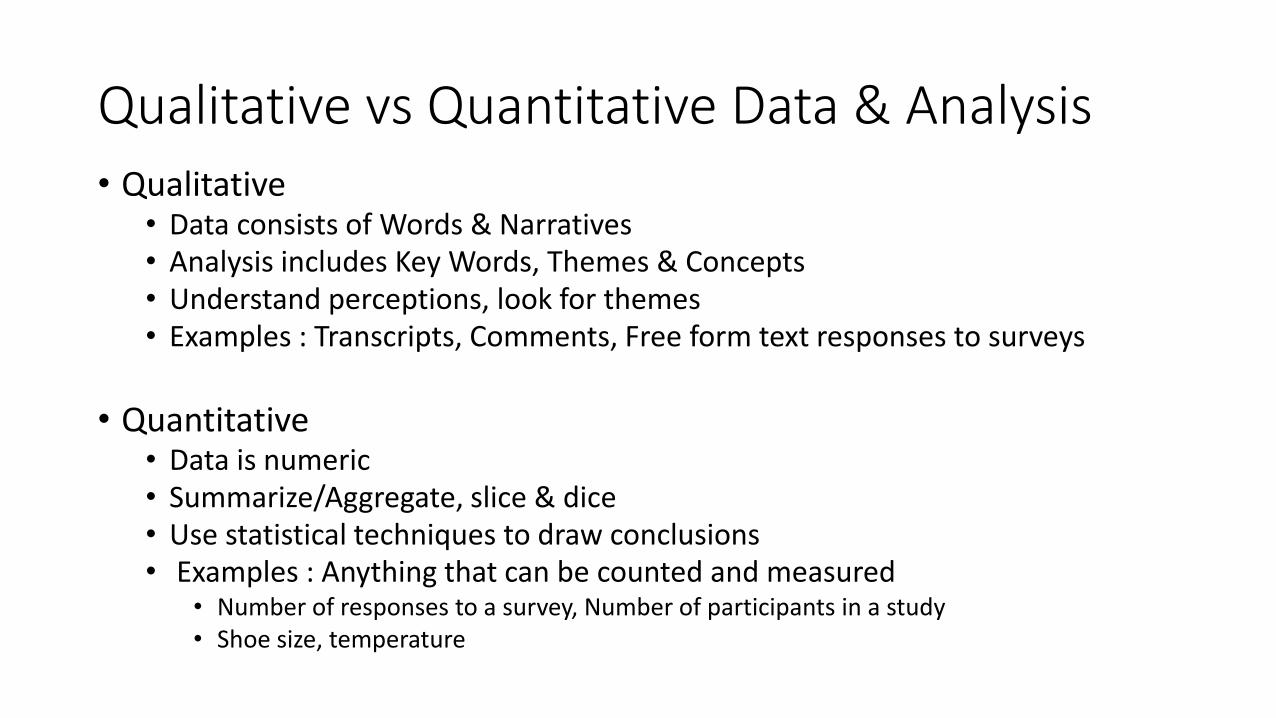
Qualitative vs Quantitative Data & Analysis• Qualitative
• Data consists of Words & Narratives• Analysis includes Key Words, Themes & Concepts• Understand perceptions, look for themes• Examples : Transcripts, Comments, Free form text responses to surveys
• Quantitative• Data is numeric• Summarize/Aggregate, slice & dice• Use statistical techniques to draw conclusions• Examples : Anything that can be counted and measured
• Number of responses to a survey, Number of participants in a study• Shoe size, temperature
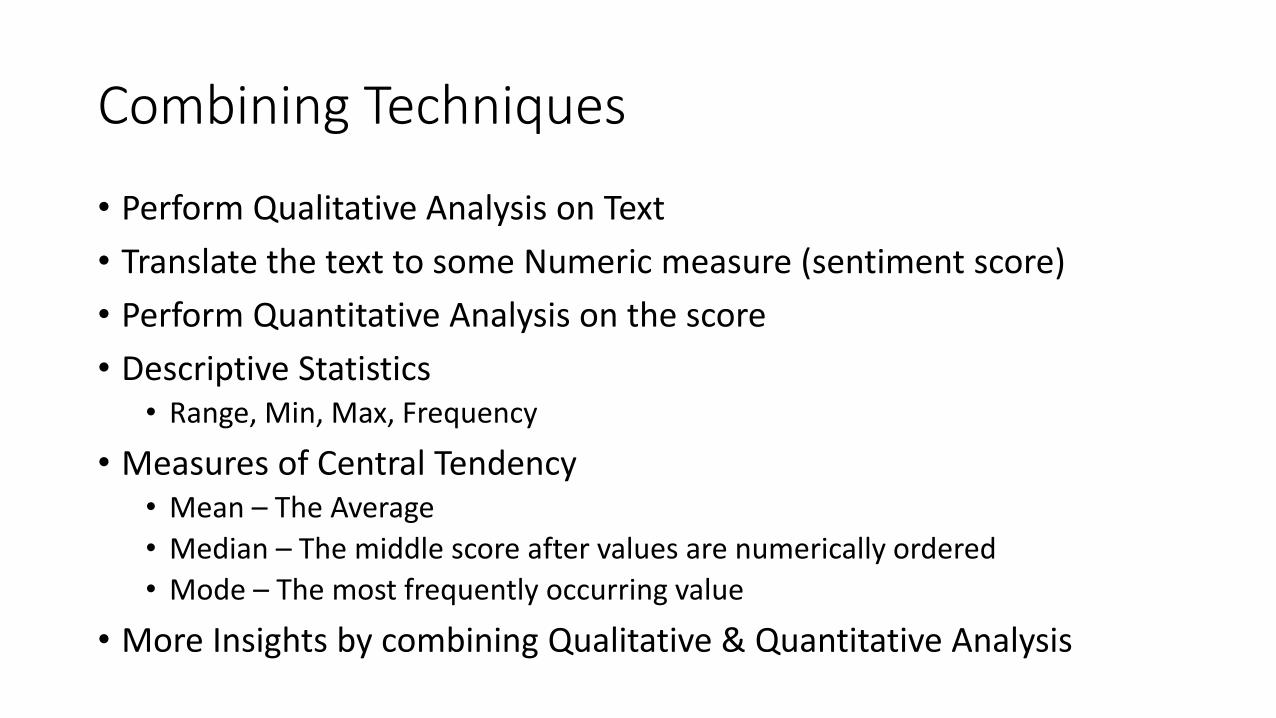
Combining Techniques
• Perform Qualitative Analysis on Text
• Translate the text to some Numeric measure (sentiment score)
• Perform Quantitative Analysis on the score
• Descriptive Statistics• Range, Min, Max, Frequency
• Measures of Central Tendency• Mean – The Average
• Median – The middle score after values are numerically ordered
• Mode – The most frequently occurring value
• More Insights by combining Qualitative & Quantitative Analysis
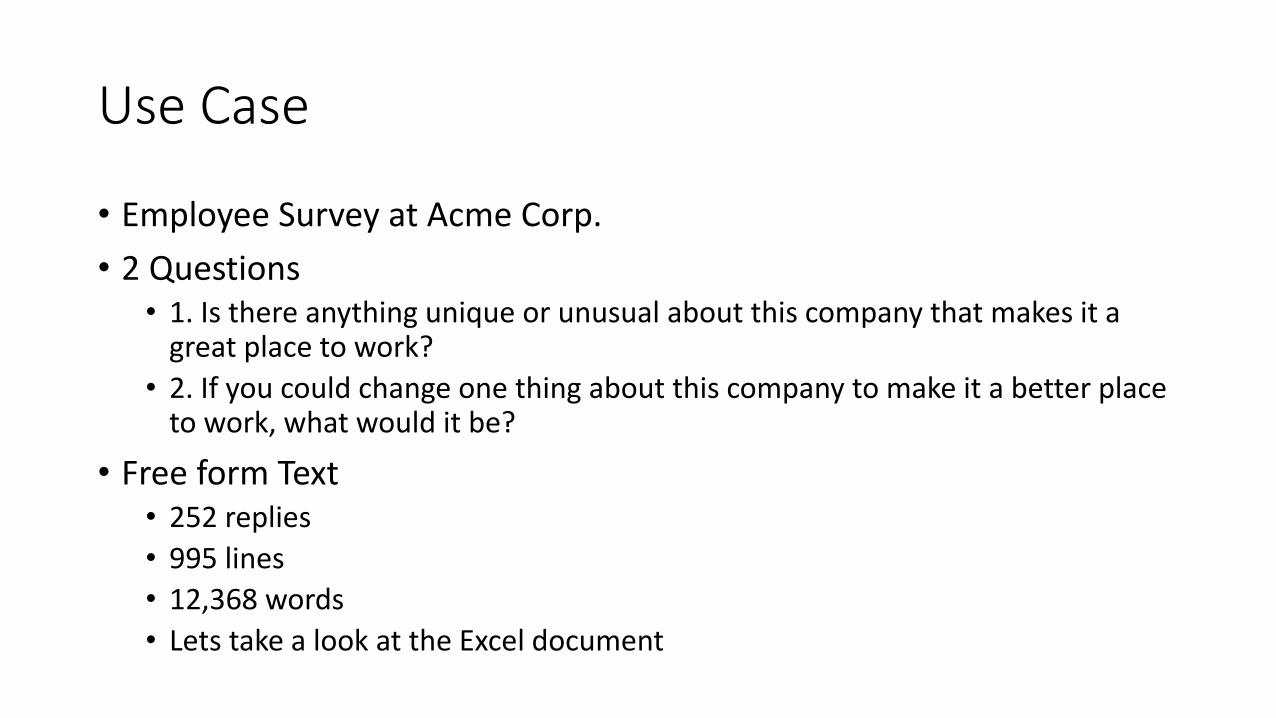
Use Case
• Employee Survey at Acme Corp.
• 2 Questions• 1. Is there anything unique or unusual about this company that makes it a
great place to work?
• 2. If you could change one thing about this company to make it a better place to work, what would it be?
• Free form Text• 252 replies
• 995 lines
• 12,368 words
• Lets take a look at the Excel document

AI + Cognitive Services
• Microsoft AI + Cognitive Services • A collection of machine learning & AI algorithms in the Azure cloud
• Artificial Intelligence• Machine Learning services
• Azure bot service
• Azure Batch AI
• Cognitive Services• Vision
• Speech
• Language (Text Analytics is a part of this group)
• Knowledge
• Search

Text Analytics API
• Cloud based service - natural language processing over raw text
• 3 types of analysis
https://docs.microsoft.com/en-us/azure/cognitive-services/text-analytics/overview

Take it for a spin
• Try out the Text Analytics API - https://azure.microsoft.com/en-
us/services/cognitive-services/text-analytics/
• Create Cognitive Services API Account in Azure
• Demo
• Location – Not available everywhere
• Pricing – Free Tier
• Endpoints
• Access keys
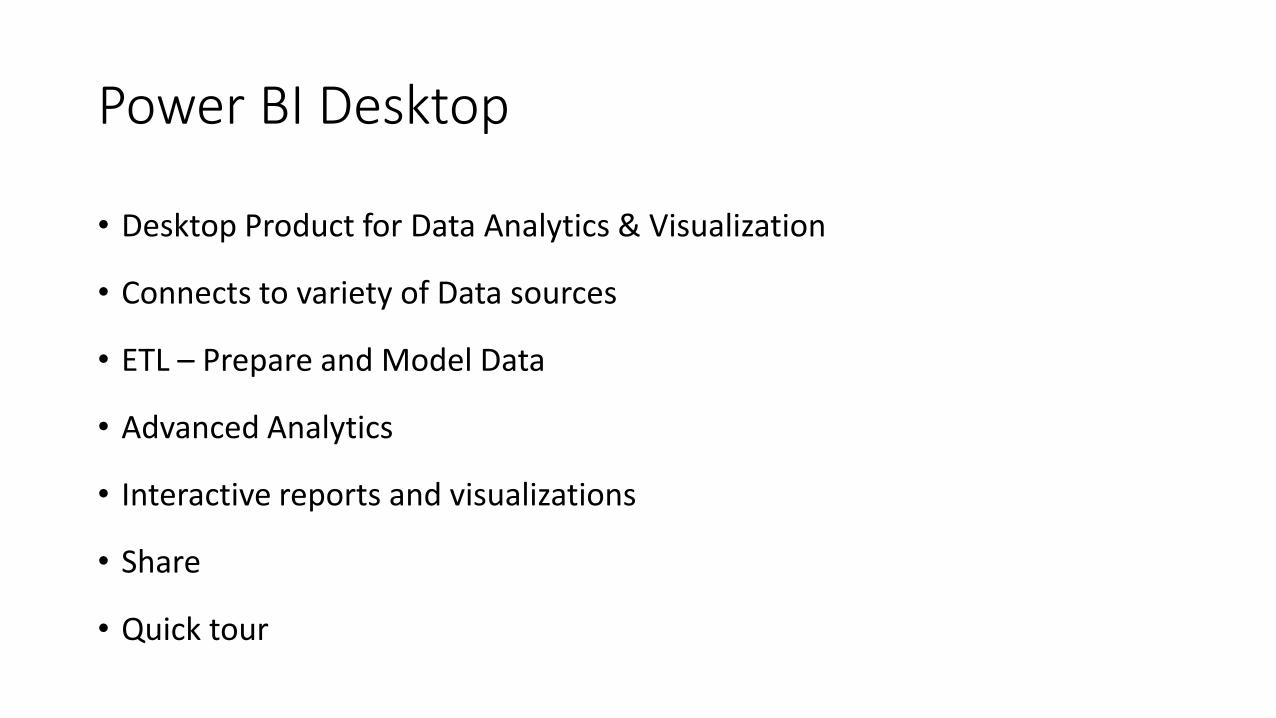
Power BI Desktop
• Desktop Product for Data Analytics & Visualization
• Connects to variety of Data sources
• ETL – Prepare and Model Data
• Advanced Analytics
• Interactive reports and visualizations
• Share
• Quick tour

Power BI Desktop in action
• Demo
• Import the Excel file
• Filter the responses to remove NULL
• See the Relationships Pane
• Create Custom Functions
• Invoke the Custom Functions to add columns for KeyPhrases & SentimentScore
• Adjust Data Source Permission settings if needed
• Round the score to 2 decimals
• Create Bins for Sentiment Score

Visualizations in Power BI Desktop
• Demo
• Summary Page
• Text box
• Cards for # of Questions & # Responses
• Word Cloud (Qualitative)
• Details Page (Descriptive statistics)
• Slicer for filtering by Question
• Score Gauge
• Box & Whiskers Plot – Mean, Median, Max, Min
• Histogram – Frequency
• Responses Page (Curated Raw text)
• Slice by question & Response Score Bin
• See all the associated response texts
Power BI Service
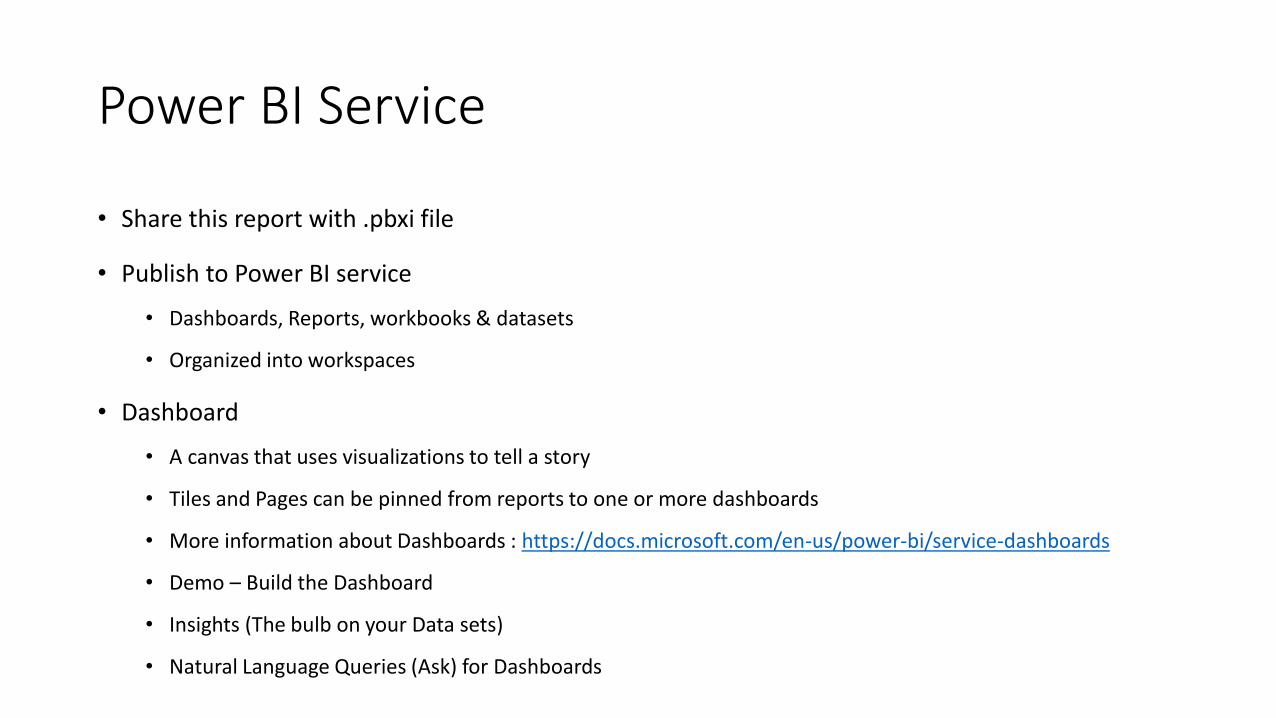
• Share this report with .pbxi file
• Publish to Power BI service
• Dashboards, Reports, workbooks & datasets
• Organized into workspaces
• Dashboard
• A canvas that uses visualizations to tell a story
• Tiles and Pages can be pinned from reports to one or more dashboards
• More information about Dashboards : https://docs.microsoft.com/en-us/power-bi/service-dashboards
• Demo – Build the Dashboard
• Insights (The bulb on your Data sets)
• Natural Language Queries (Ask) for Dashboards

Gaining Useful Insights
• How many employees responded
• Word Cloud – Trends/what are people talking about ?
• Descriptive statistics on Sentiment Scores• What is the overall perception/feeling• Range, Mean, Median, Outliers• Distribution – Responses seem polarizing• How do these numbers compare between the 2 questions
• See the raw response text, sliced by• Question• Response Score Bin
• Share, Collaborate

Tableau vs Power BI
• Power BI• Easier ETL and invoking APIs
• Easier to visualizations
• Tiles are easier to move and size to page/canvas grid
• Slices and Page/Report level filters can create some confusion
• Tableau• Creating some visualizations like Gauge or WordCloud requires several
manual steps
• Filters are easier to work with at both worksheet and Dashboard level
• Moving & sizing various worksheets on a Dashboard manually can get tedious

Other Analytics Tools
• Vertica • Distributed columnar Database & Big Data/Advanced Analytics Platform• Pulse Package for Text Analysis functions• Easy to use SQL Interface• Expensive
• R• Popular for data analytics• Extensive libraries and capabilities• Easy to use , powerful , creative• Requires familiarity with R programming language• Free Desktop• Limited by memory of the machine• Demo

Resources• Qualitative or Quantitative Data - https://cyfar.org/qualitative-or-quantitative-data
• Quantitative Data Analysis - https://cyfar.org/analysis-quantitative-data
• Azure Cognitive Services Text Analytics - https://docs.microsoft.com/en-us/azure/cognitive-services/text-analytics/overview
• Power BI Desktop - https://powerbi.microsoft.com/en-us/desktop/
• Text Analytics with Power BI - https://docs.microsoft.com/en-us/azure/cognitive-services/text-analytics/tutorials/tutorial-power-bi-key-phrases
• Power BI Service - https://docs.microsoft.com/en-us/power-bi/service-basic-concepts
• Dashboards in Power BI Service - https://docs.microsoft.com/en-us/power-bi/service-dashboards
• Tableau - https://www.tableau.com/
• Vertica Pulse -
https://my.vertica.com/docs/8.1.x/HTML/index.htm#Authoring/Pulse/PulseCookbook.htm%3FTocPath%3DVertica%2520Pulse%7CPulse%2520Cookbook%7C_____0
• R Tidytext package - https://cran.r-project.org/web/packages/tidytext/vignettes/tidytext.html
• R syuzhet package - https://cran.r-project.org/web/packages/syuzhet/vignettes/syuzhet-vignette.html
• My GitHub for the R code use in Demos - https://github.com/SQLSuperGuru

Thank youQ&A
Sanil Mhatre@sqlsuperguru
https://sqlwithsanil.wordpress.com/https://github.com/SQLSuperGuru


![Microsoft Power BI on Big Data PlatformMAVEN] Microsoft Power BI on... · Power BI on Microsoft Big Data Platform 아키텍처 Microsoft Power BI는마이크로소프트클라우드애저(Azure)기반Microsoft](https://img.pdfslide.net/doc/110x75/5e2f45833c141d6c322aa715/microsoft-power-bi-on-big-data-maven-microsoft-power-bi-on-power-bi-on-microsoft.jpg)