Embed Size (px)
Citation preview
The Fast, The Slow, and the Unconverted
https://www.flickr.com/photos/dvanzuijlekom/14579895325/
@AndyDavies, NCC Group

“Has it loaded yet?”
http://www.flickr.com/photos/kindofindie/4099768084
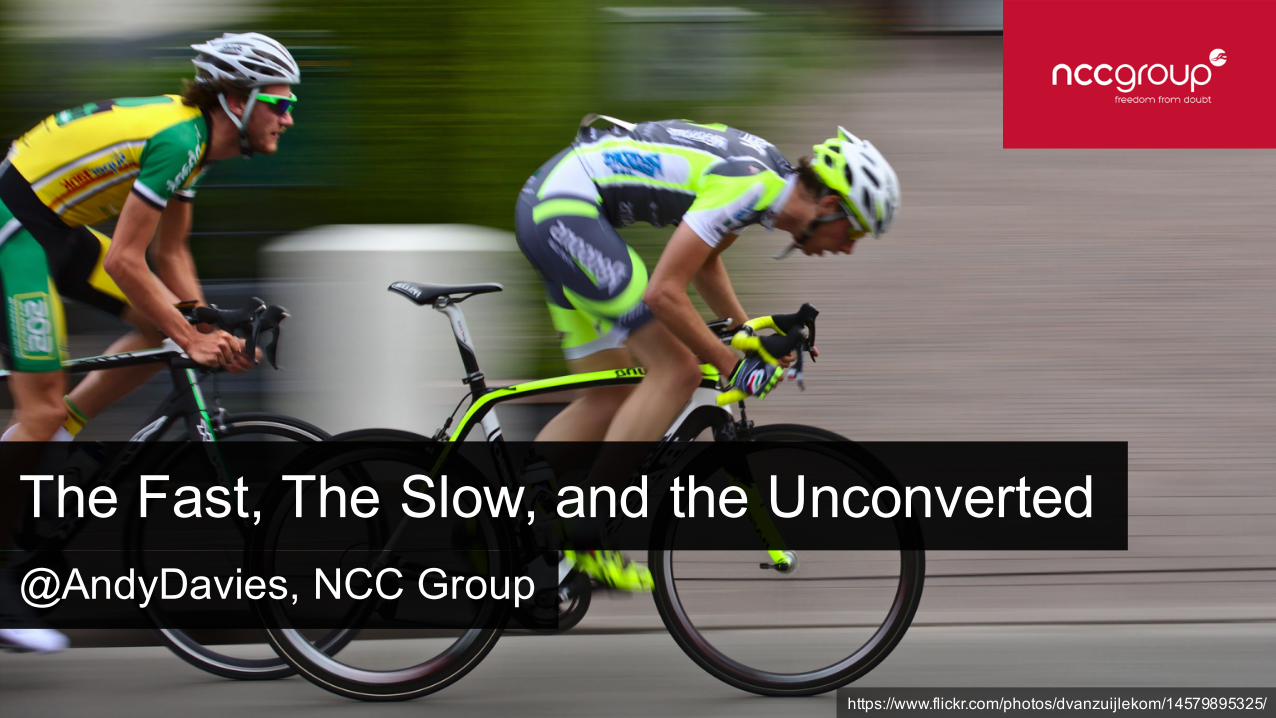
Response Time in Man-computer Conversational TransactionsRobert B. Miller, 1968
How we perceive response times
100ms 1s 10s
IRUK Retail Top 100 : Average 1.8s delay before page starts showing content
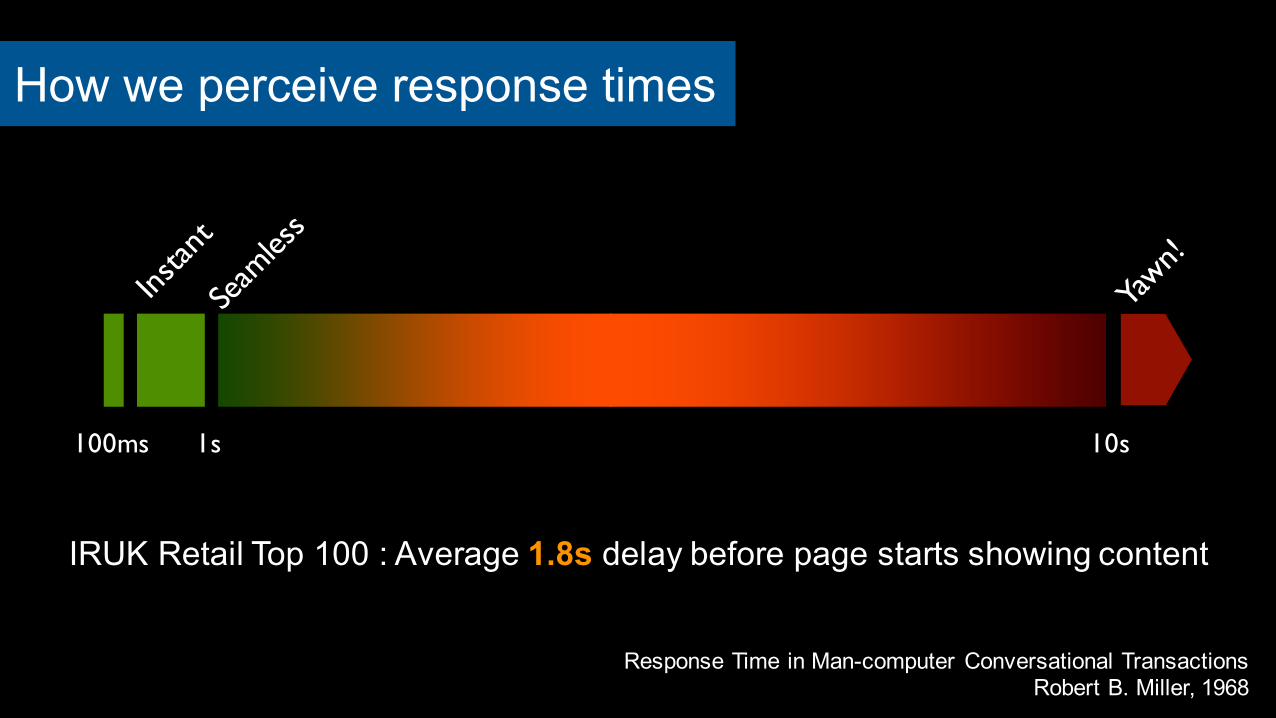
“50% more concentration when using badly performing web sites”
Foviance
http://www.flickr.com/photos/yourdon/3366991042

https://www.flickr.com/photos/editor/57572350
“Stress levels comparable to watching a horror movie”Ericsson Mobility Report 2016
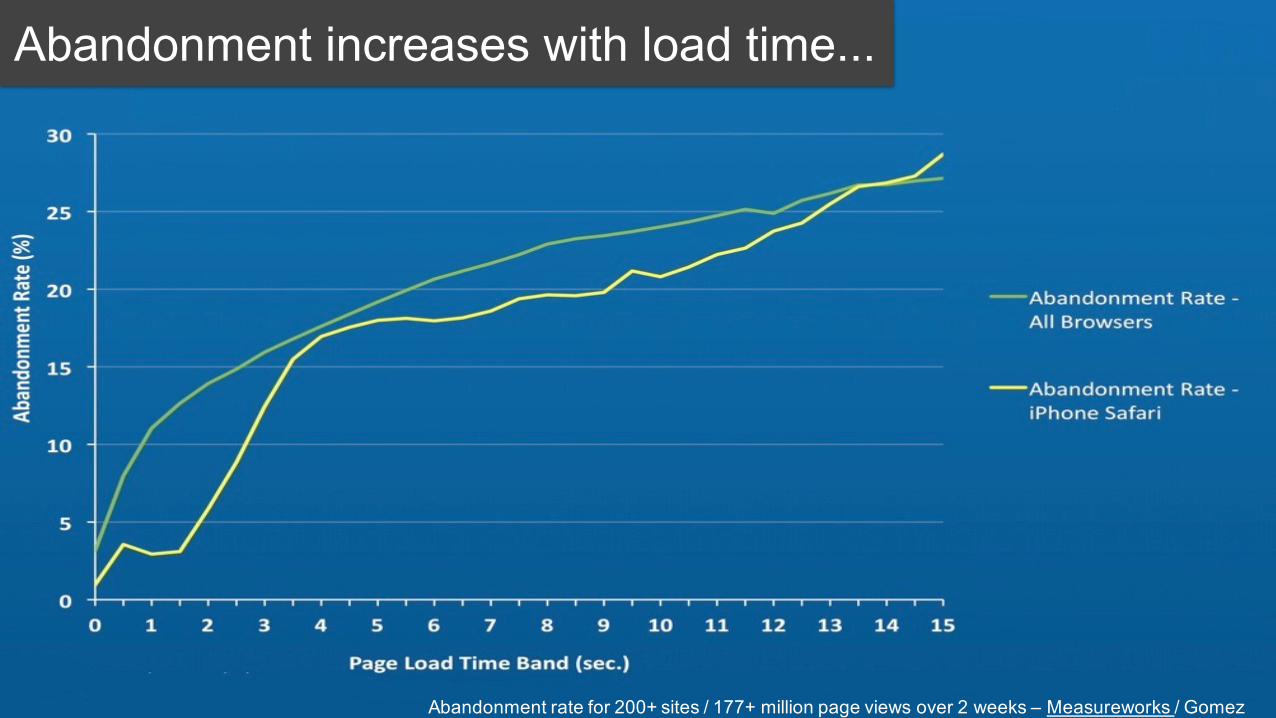
Abandonment rate for 200+ sites / 177+ million page views over 2 weeks – Measureworks / Gomez
Abandonment increases with load time...
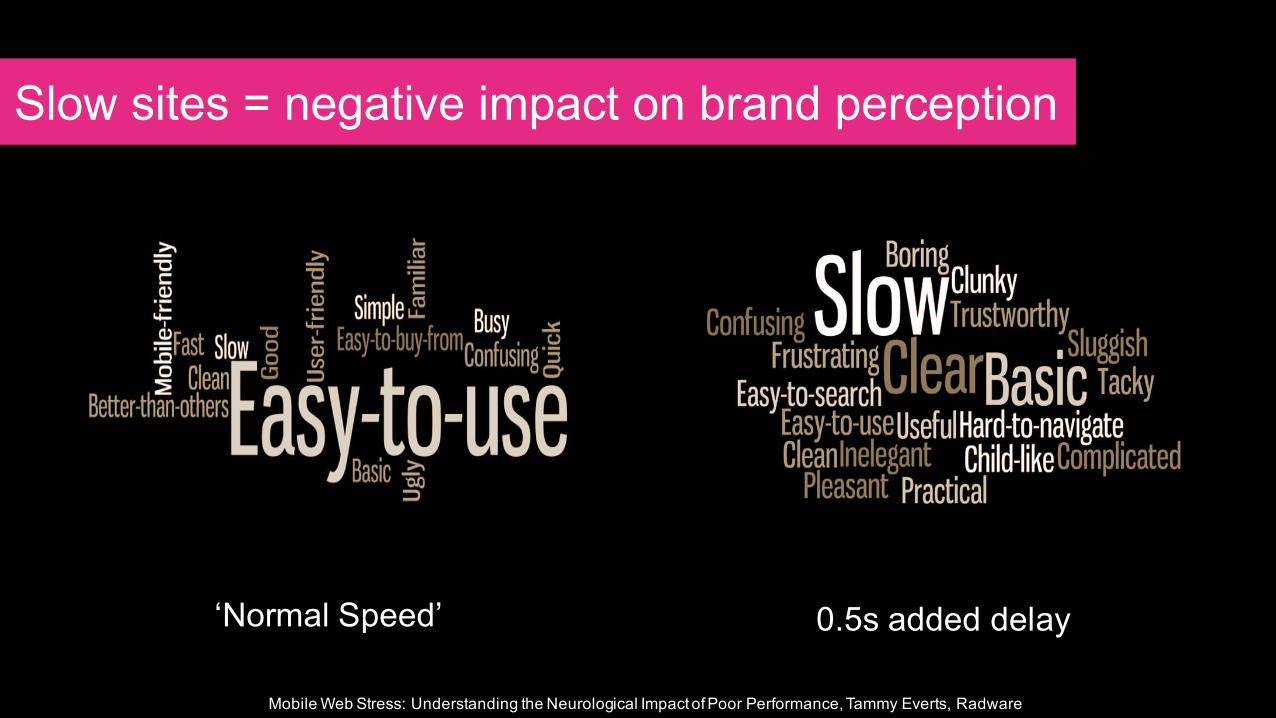
Slow sites = negative impact on brand perception
‘Normal Speed’ 0.5s added delay
Mobile Web Stress: Understanding the Neurological Impact of Poor Performance, Tammy Everts, Radware
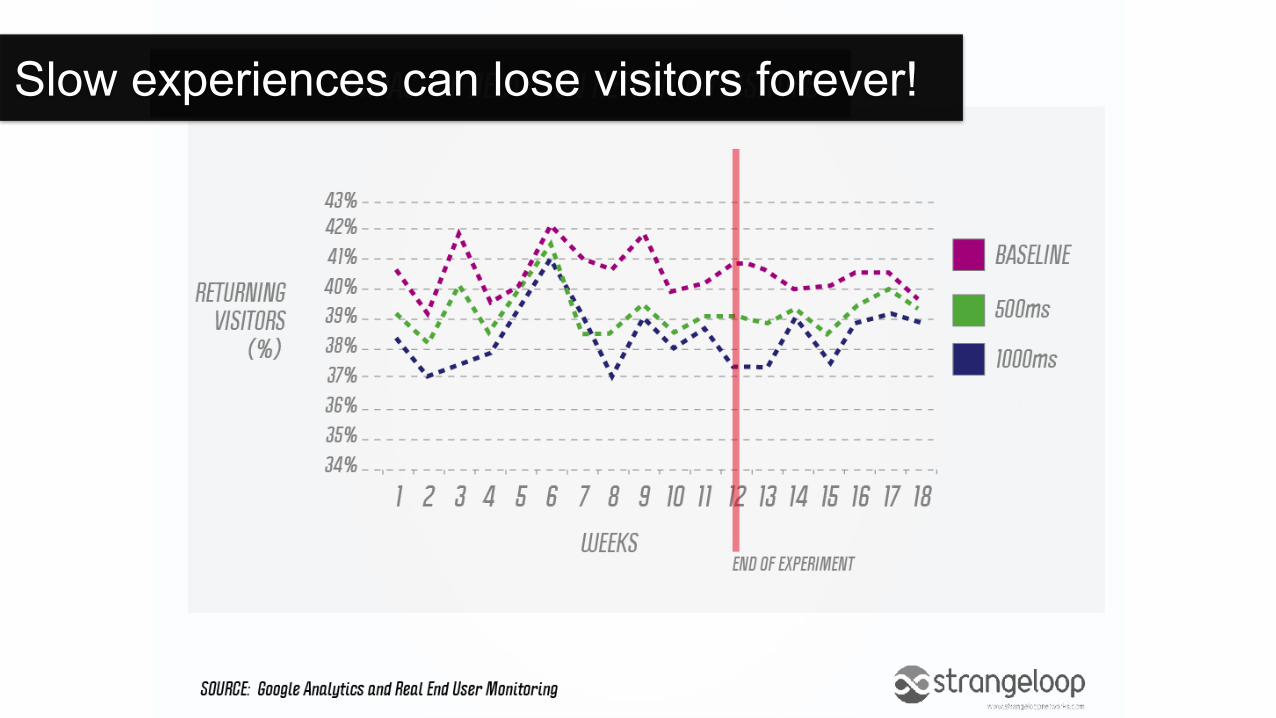
Slow experiences can lose visitors forever!
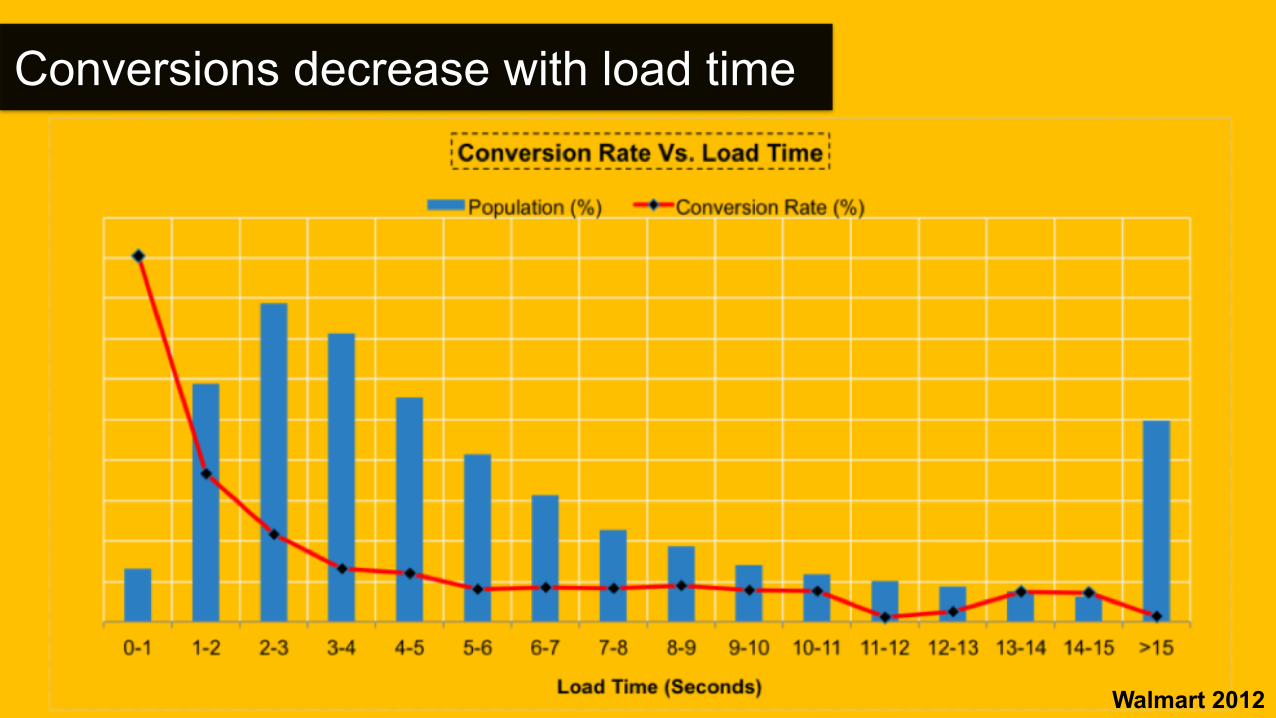
Conversions decrease with load time
Walmart 2012
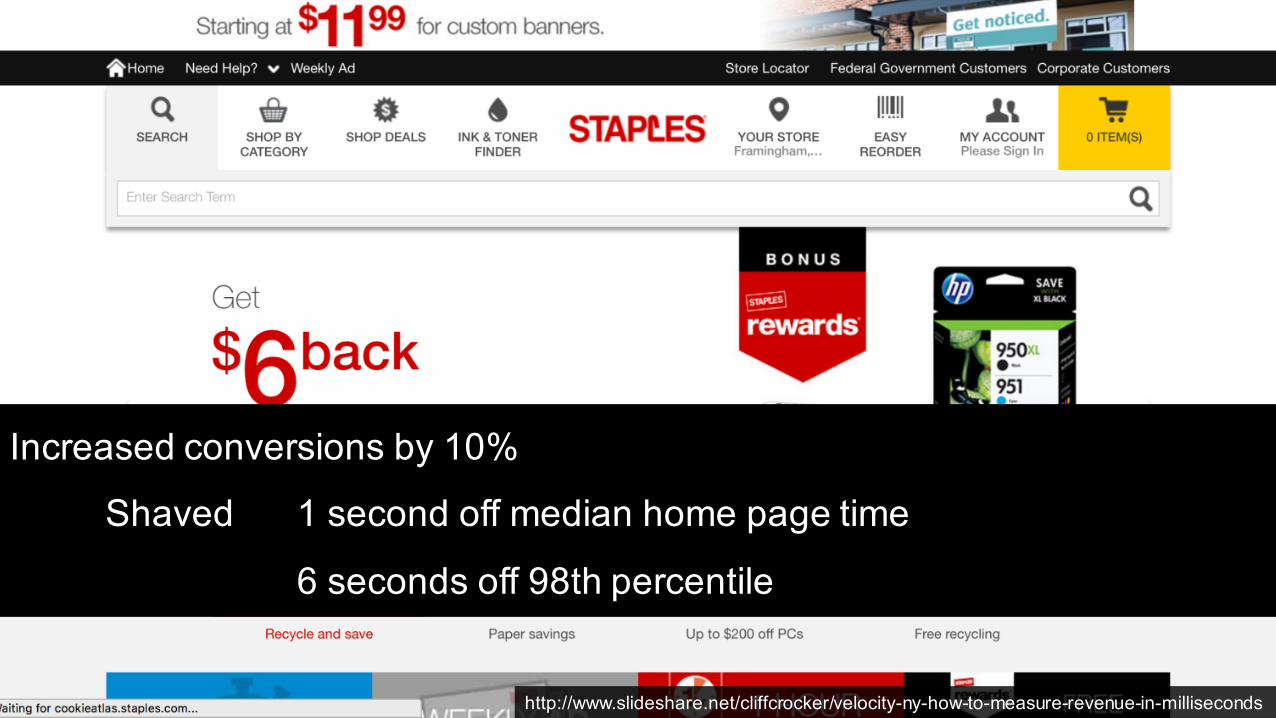
Increased conversions by 10%
Shaved 1 second off median home page time
6 seconds off 98th percentile
http://www.slideshare.net/cliffcrocker/velocity-ny-how-to-measure-revenue-in-milliseconds
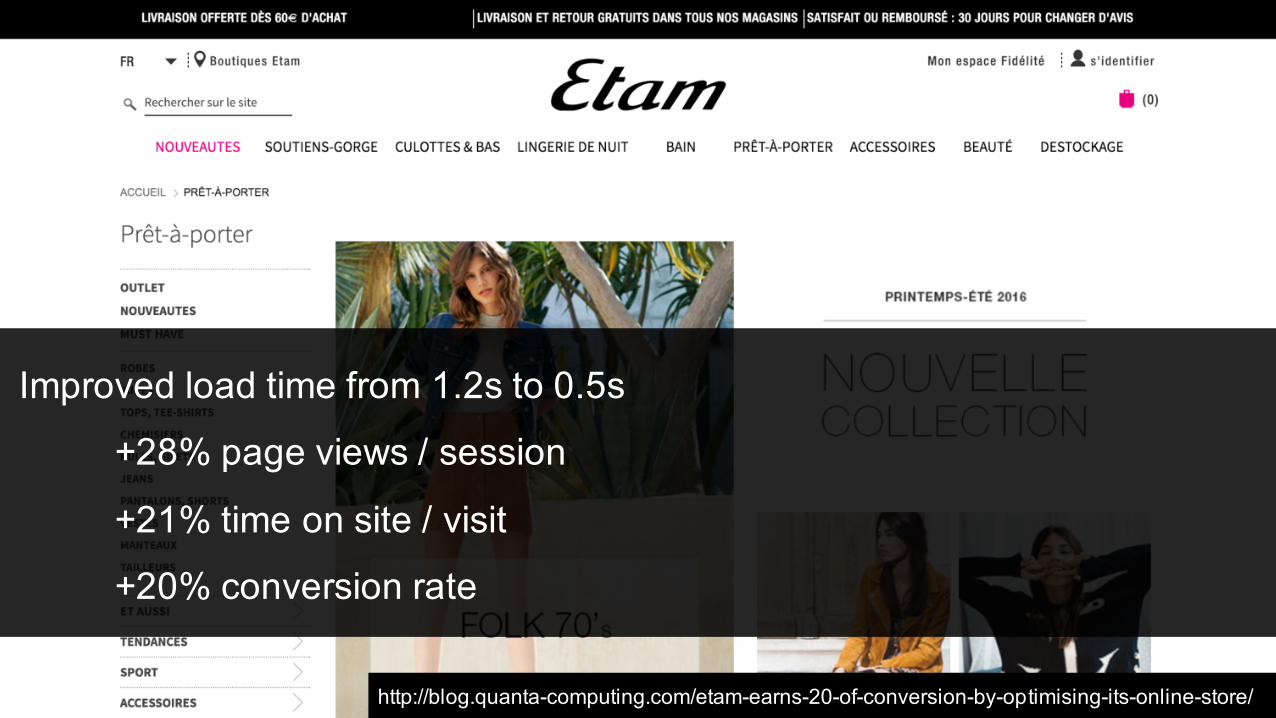
Improved load time from 1.2s to 0.5s
+28% page views / session
+21% time on site / visit
+20% conversion rate
http://blog.quanta-computing.com/etam-earns-20-of-conversion-by-optimising-its-online-store/
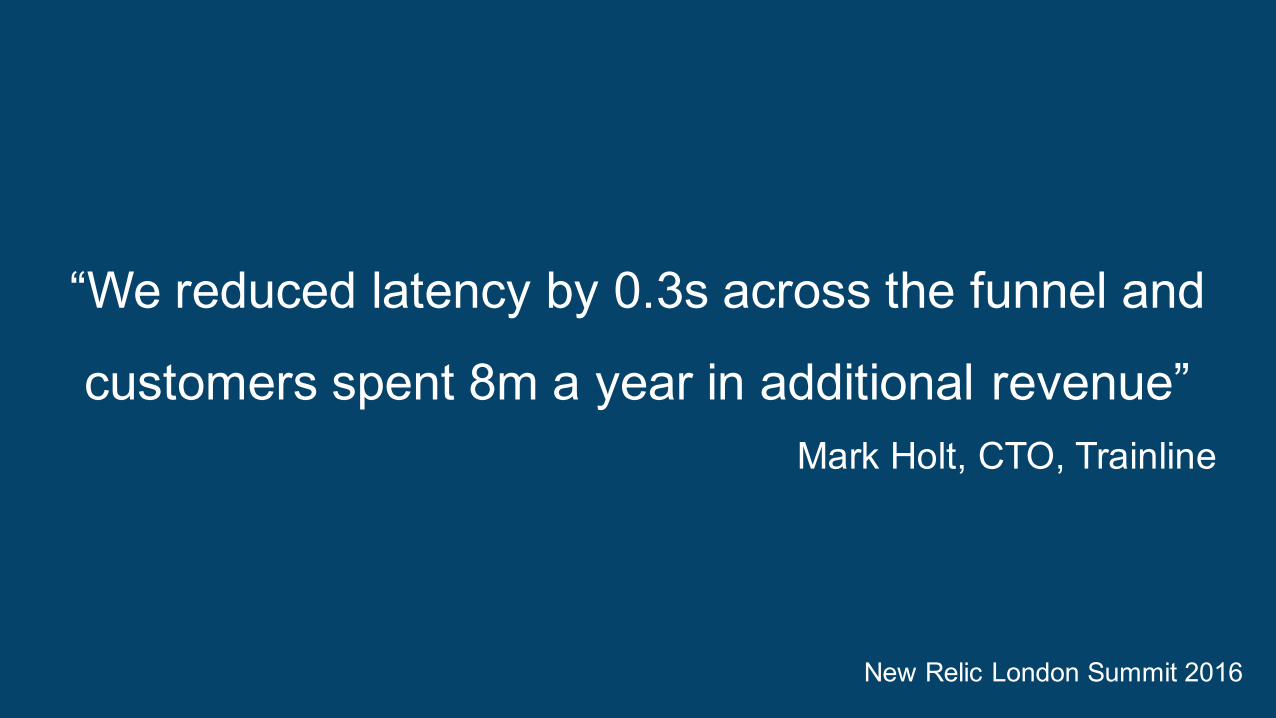
“We reduced latency by 0.3s across the funnel and
customers spent 8m a year in additional revenue”Mark Holt, CTO, Trainline
New Relic London Summit 2016
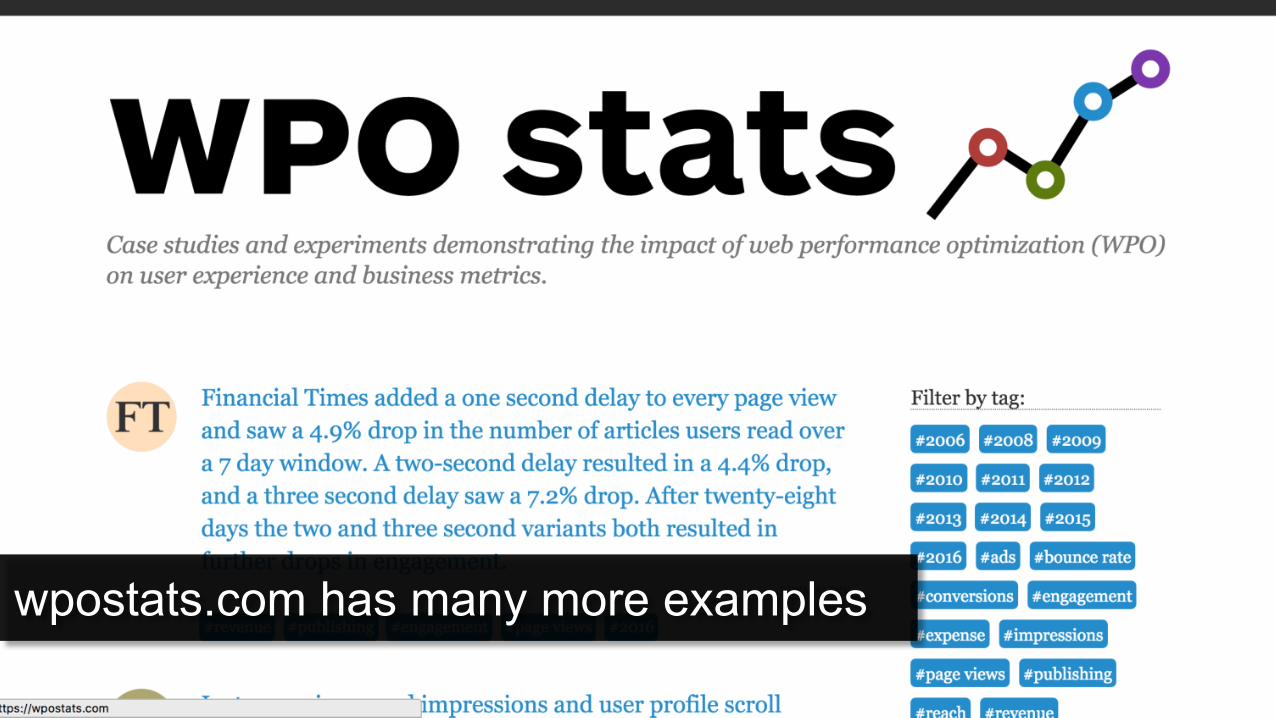
wpostats.com has many more examples

Good performance is
fundamental to the
success of our sites
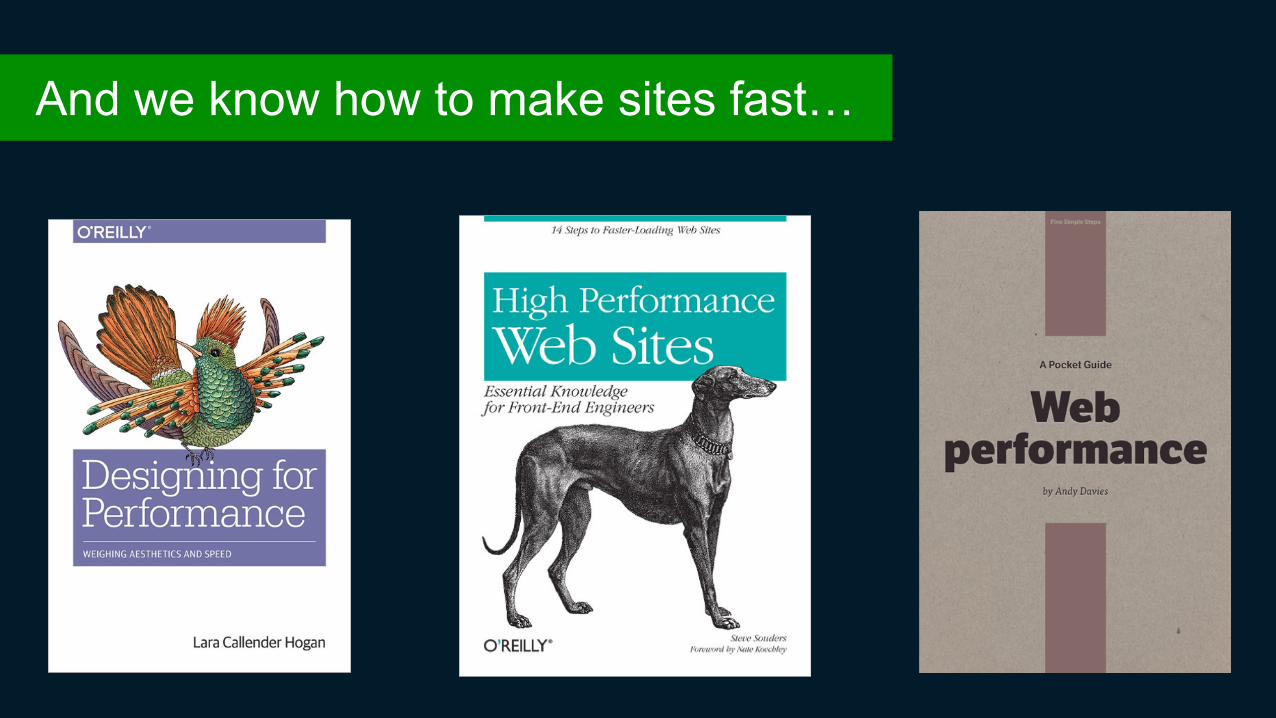
And we know how to make sites fast…

https://www.flickr.com/photos/justinjovellanos/15340862812
But we have another challenge…
https://www.flickr.com/photos/jamescridland/613445810
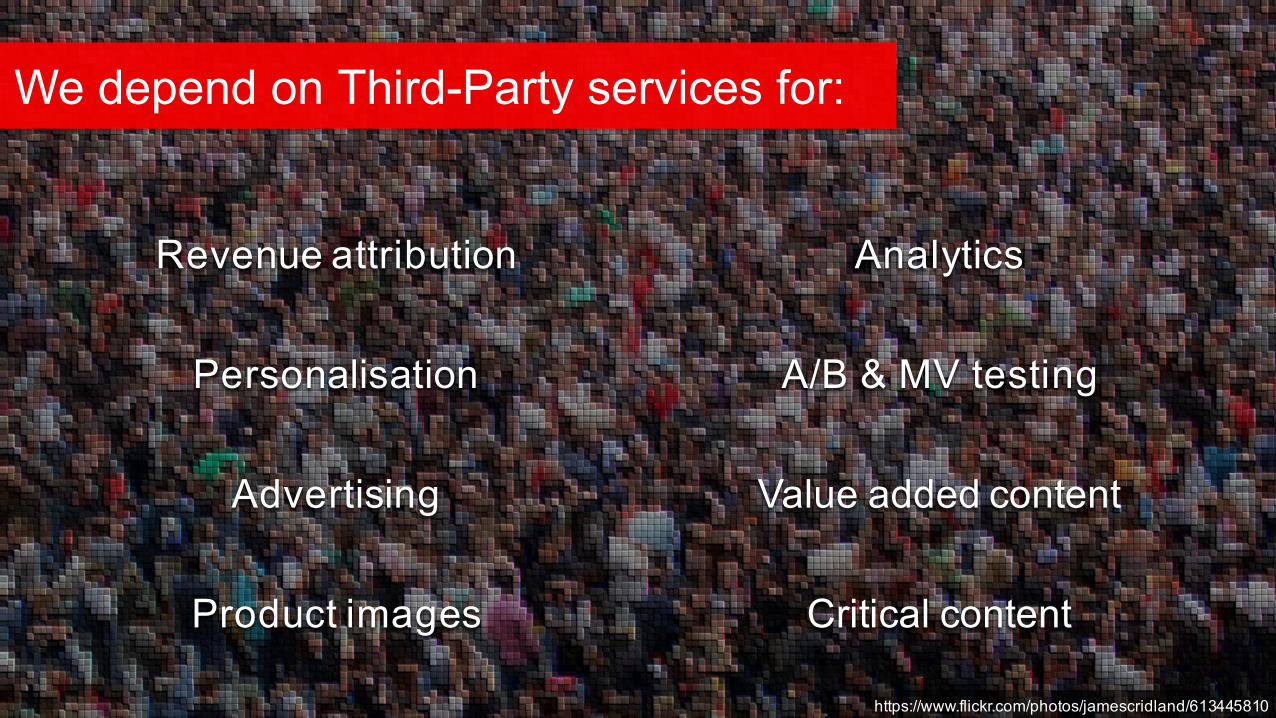
Revenue attribution Analytics
Personalisation A/B & MV testing
Advertising Value added content
Product images Critical content
We depend on Third-Party services for:
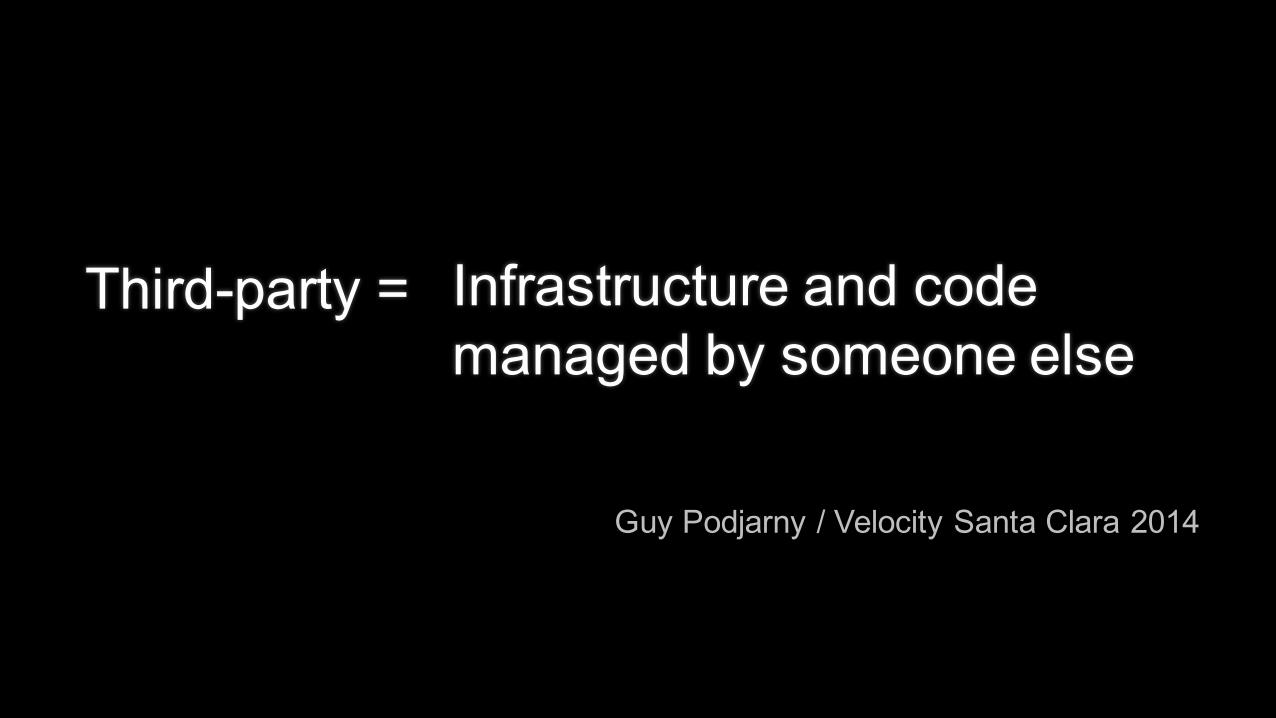
Third-party = Infrastructure and code managed by someone else
Guy Podjarny / Velocity Santa Clara 2014
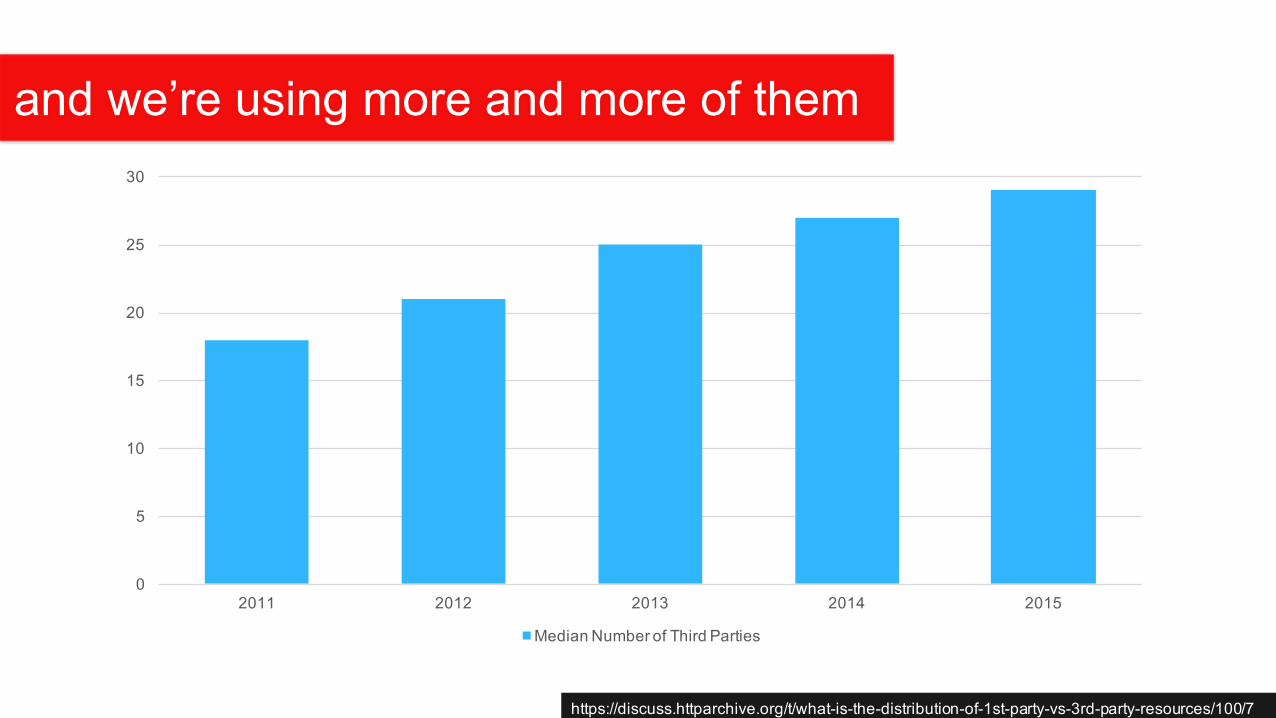
https://discuss.httparchive.org/t/what-is-the-distribution-of-1st-party-vs-3rd-party-resources/100/7
and we’re using more and more of them
0
5
10
15
20
25
30
2011 2012 2013 2014 2015
Median Number of Third Parties
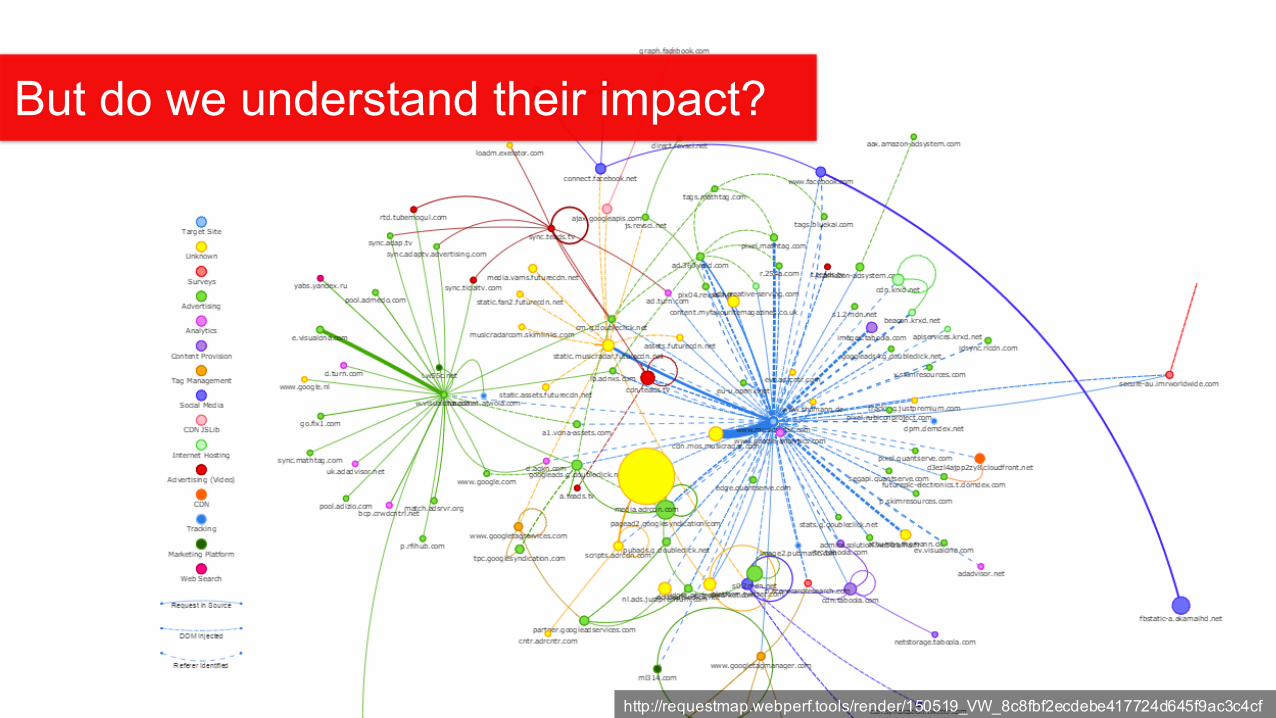
http://requestmap.webperf.tools/render/150519_VW_8c8fbf2ecdebe417724d645f9ac3c4cf
But do we understand their impact?
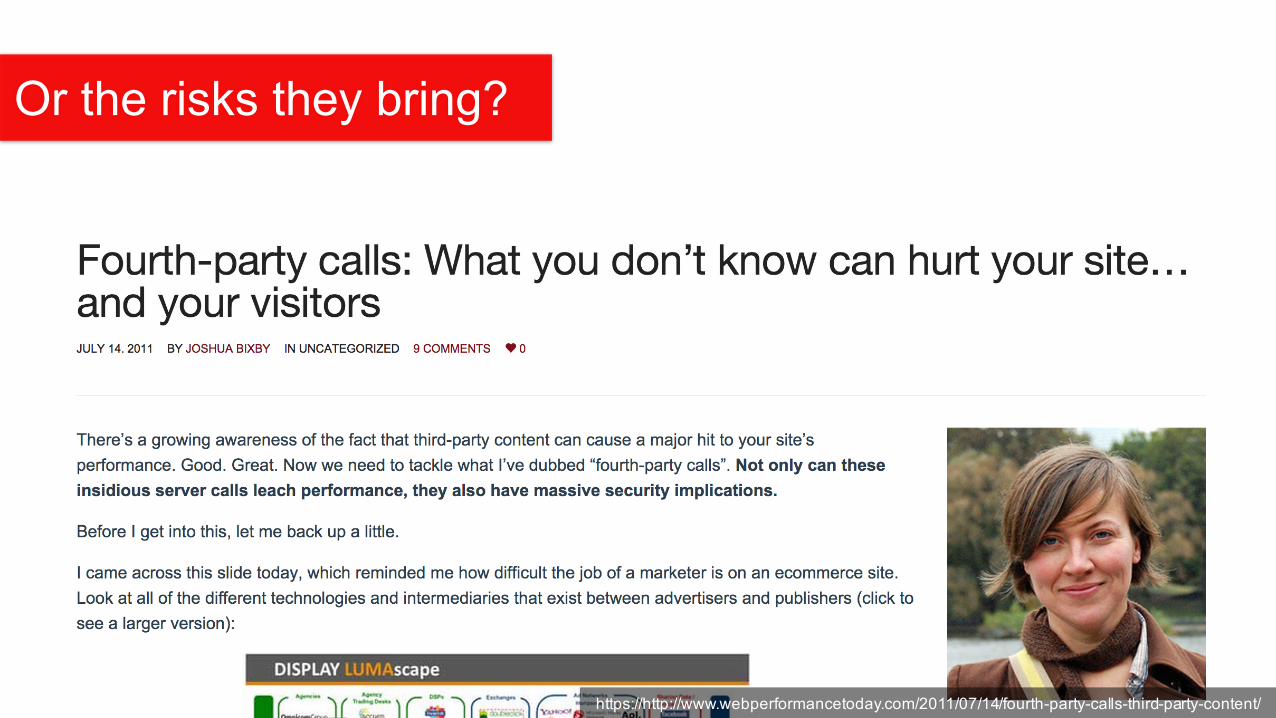
Or the risks they bring?
https://http://www.webperformancetoday.com/2011/07/14/fourth-party-calls-third-party-content/
https://www.flickr.com/photos/devos/163903
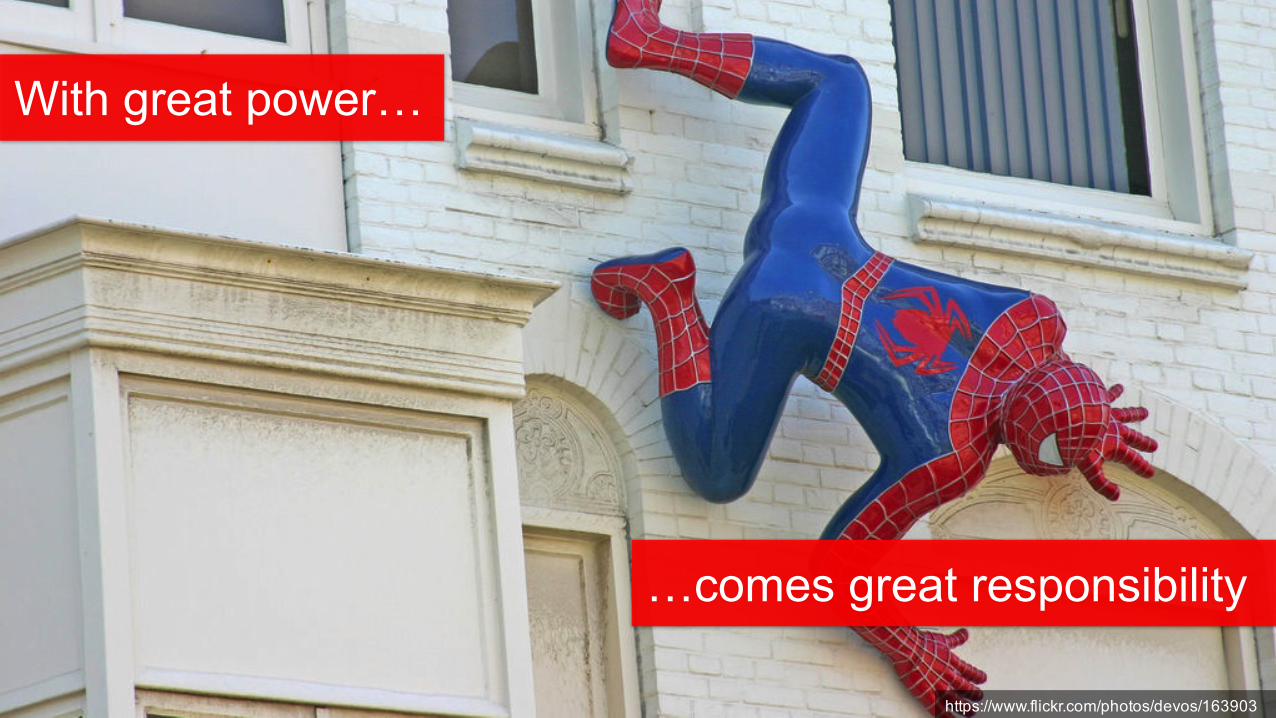
With great power…
…comes great responsibility

https://www.flickr.com/photos/matt512/4065627169
What if a third-party includes something
that’s blocked in China?
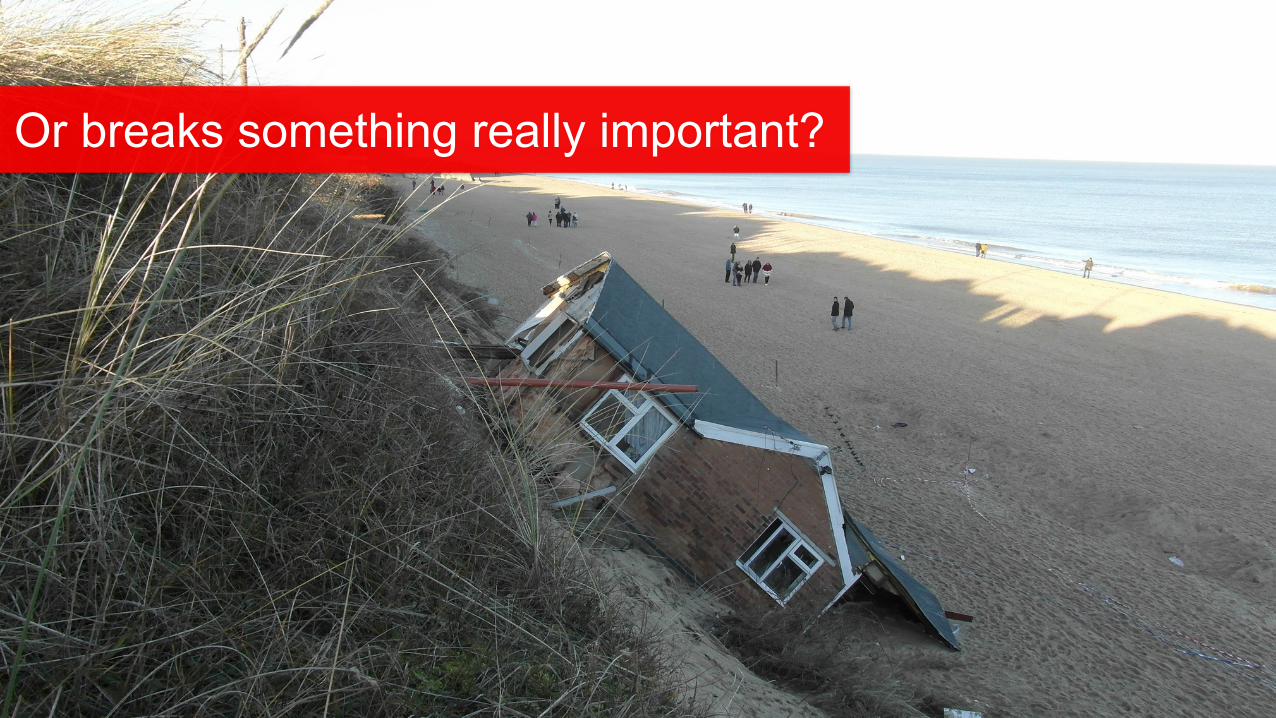
Or breaks something really important?
https://www.flickr.com/photos/derekbruff/9759290413/
What about their impact on speed?
https://www.flickr.com/photos/torek/4444673930
Let’s pick an easy target
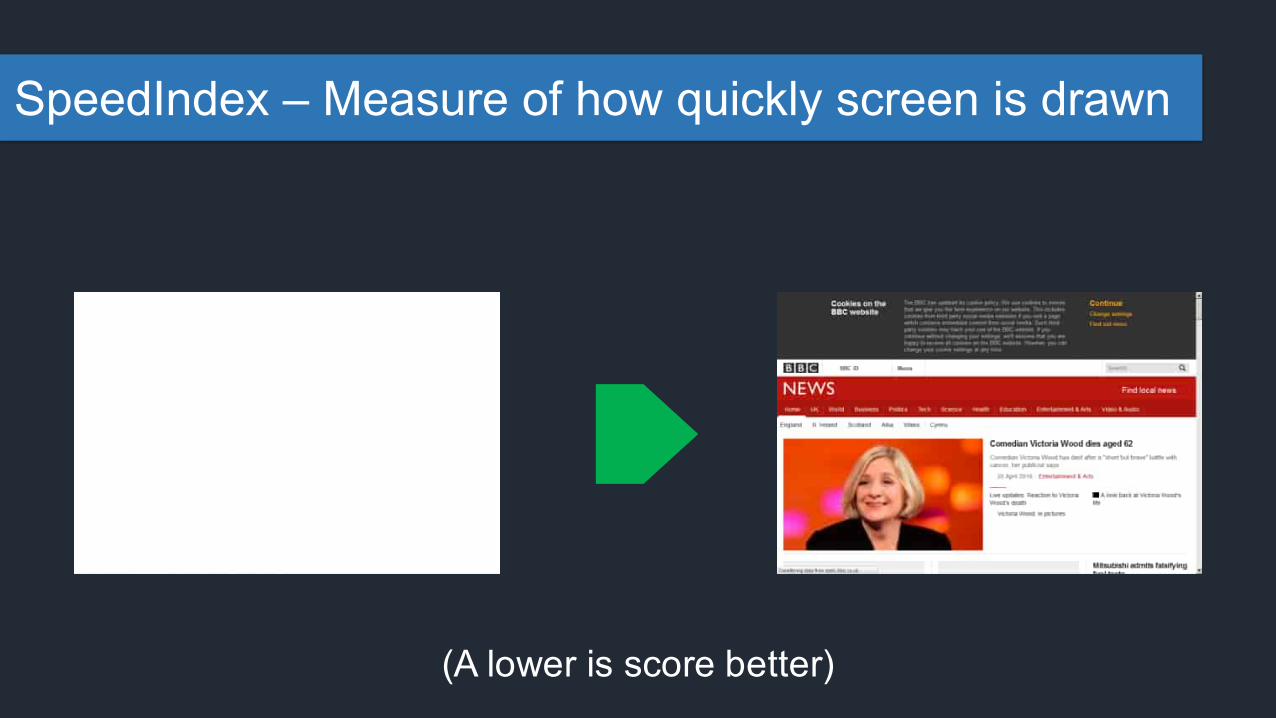
SpeedIndex – Measure of how quickly screen is drawn
(A lower is score better)
0.00%
0.50%
1.00%
1.50%
2.00%
2.50%
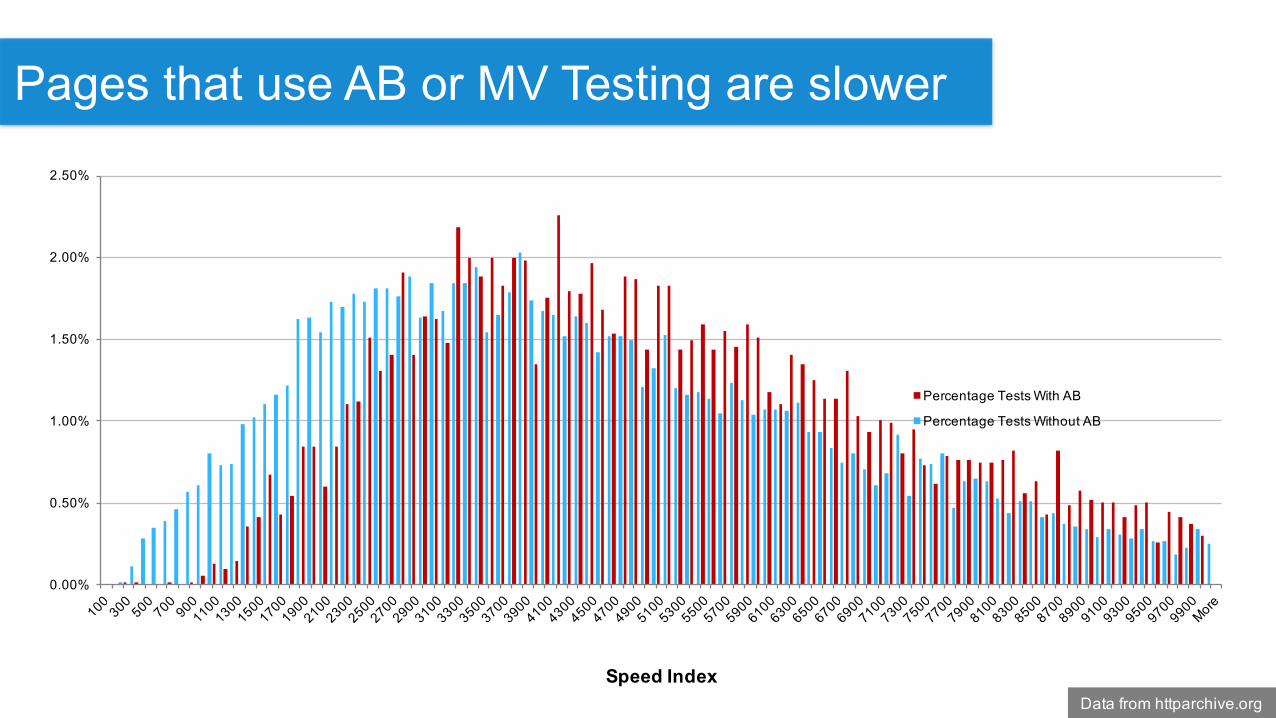
Speed Index
Percentage Tests With AB
Percentage Tests Without AB
Pages that use AB or MV Testing are slower
Data from httparchive.org
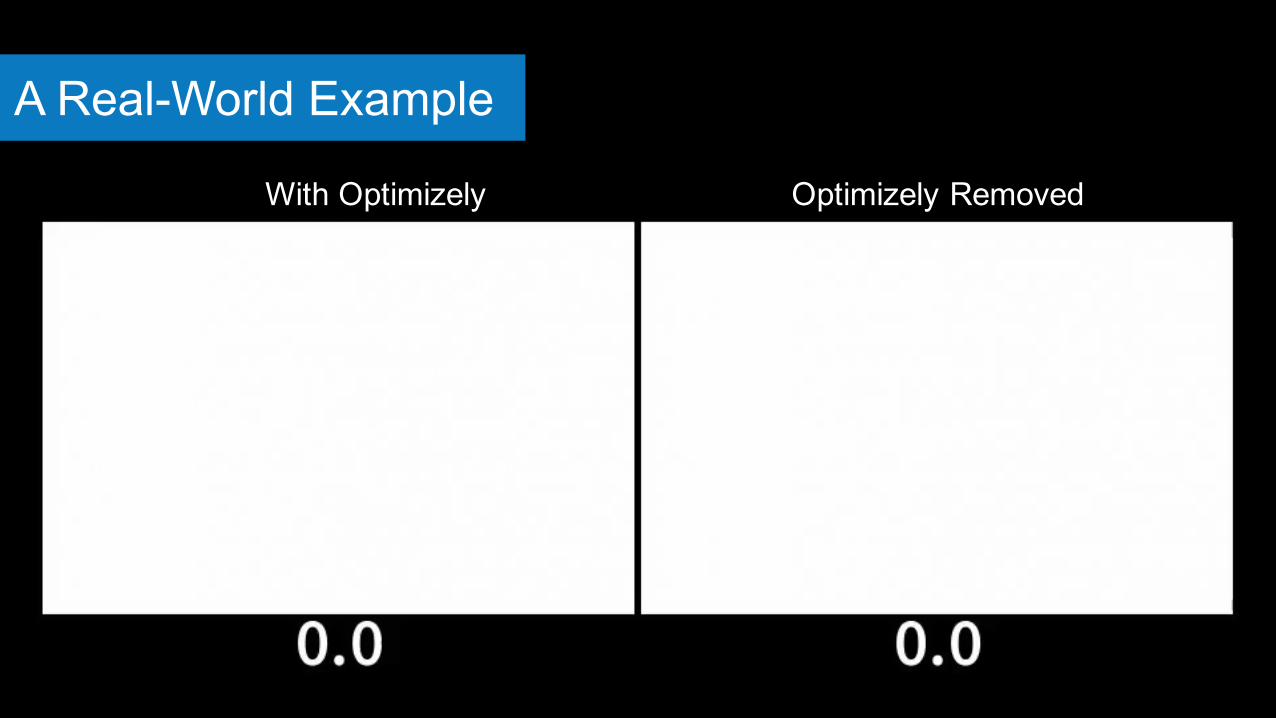
With Optimizely Optimizely Removed
A Real-World Example
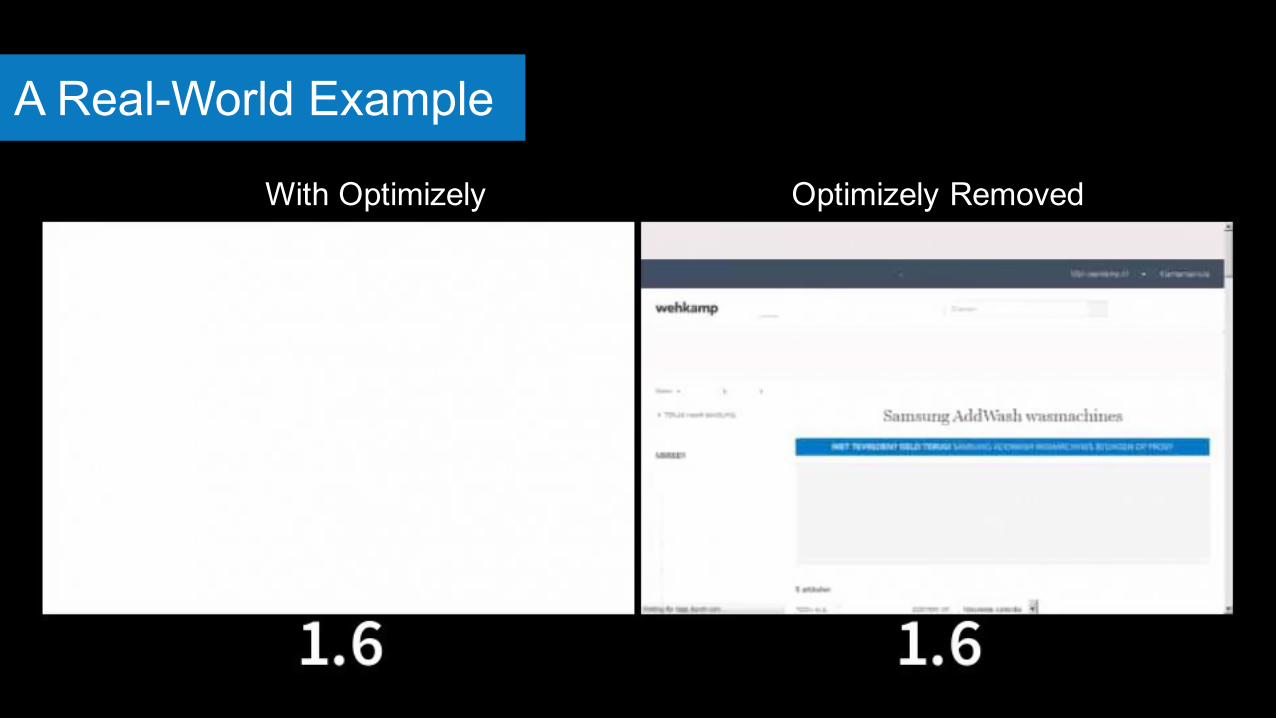
With Optimizely Optimizely Removed
A Real-World Example
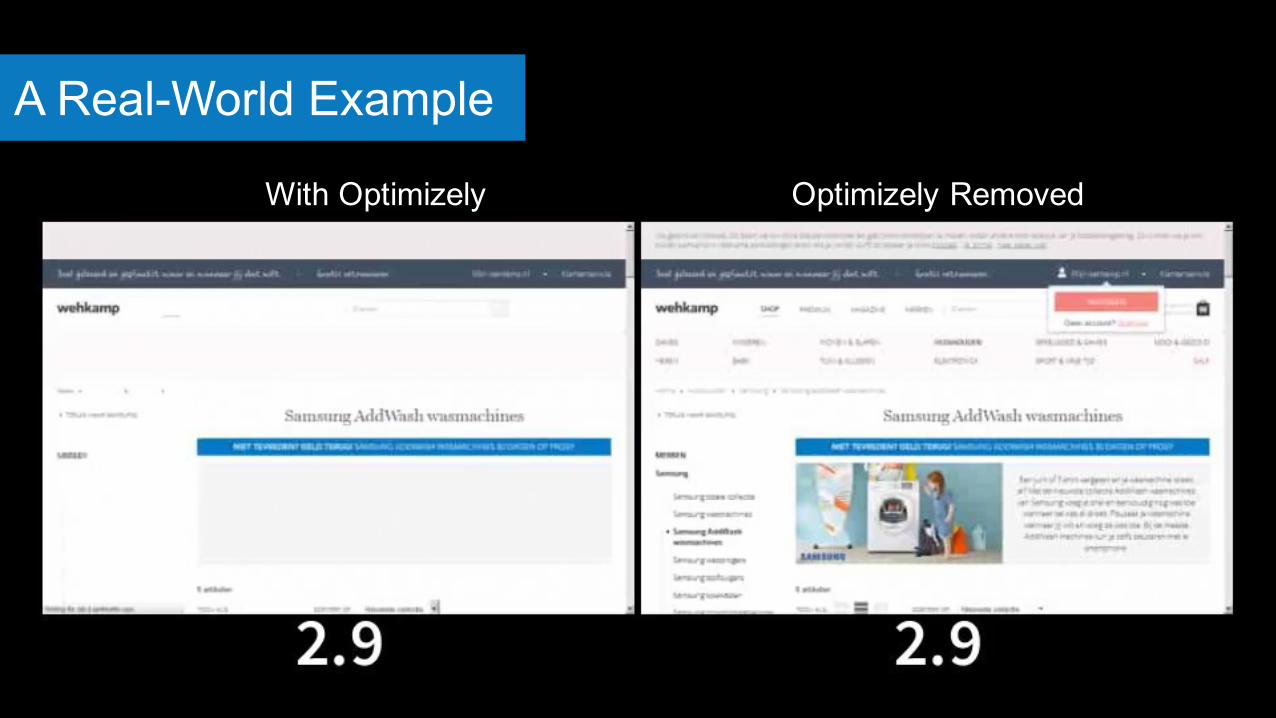
With Optimizely Optimizely Removed
A Real-World Example
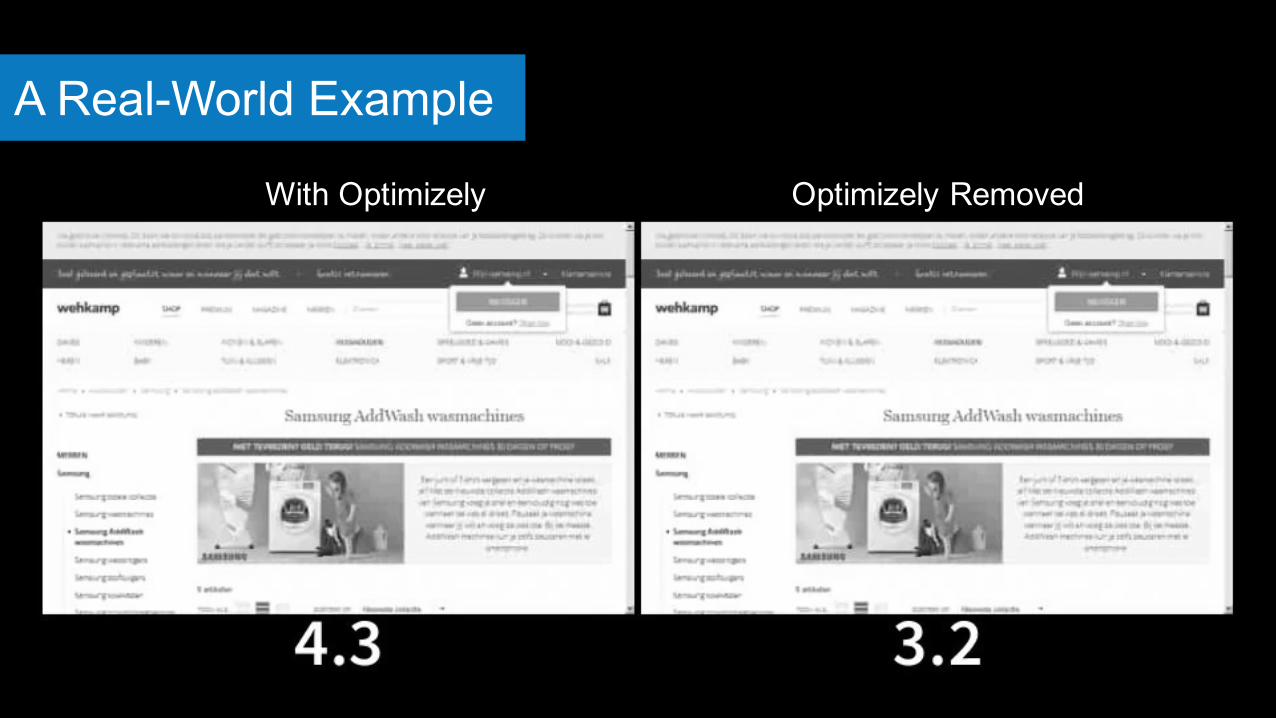
With Optimizely Optimizely Removed
A Real-World Example
Just adding the testing service
changes the visitor’s experience!
https://www.flickr.com/photos/therontrowbridge/2654049085
https://www.flickr.com/photos/87975067@N06/8048048692
Will the value of the tests be larger than the
impact on the visitor’s experience?

Are you brave enough to test
the impact of AB testing?
This is was one example, other types of
third-parties have different impacts
We need to balance third-party benefits
with their impact on performance https://www.flickr.com/photos/synx508/5839490755/
https://www.flickr.com/photos/magickevin/3595741847
Find the third-parties we’re using
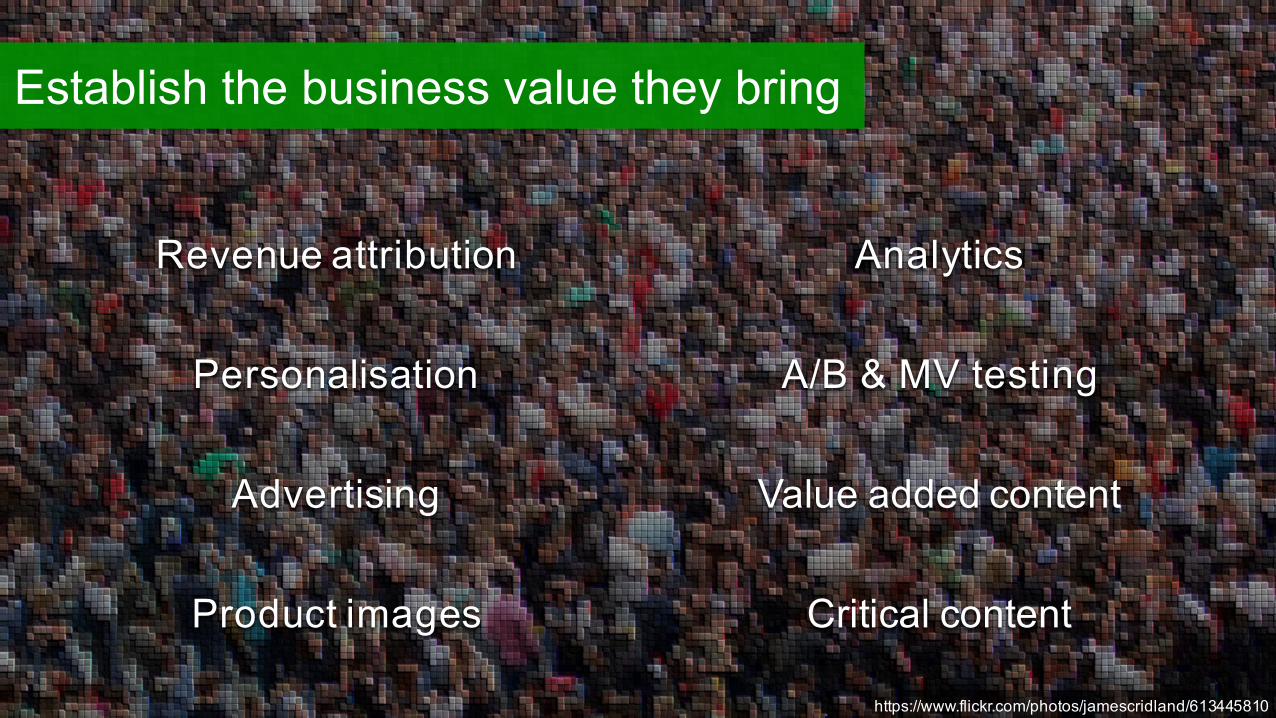
https://www.flickr.com/photos/jamescridland/613445810
Revenue attribution Analytics
Personalisation A/B & MV testing
Advertising Value added content
Product images Critical content
Establish the business value they bring
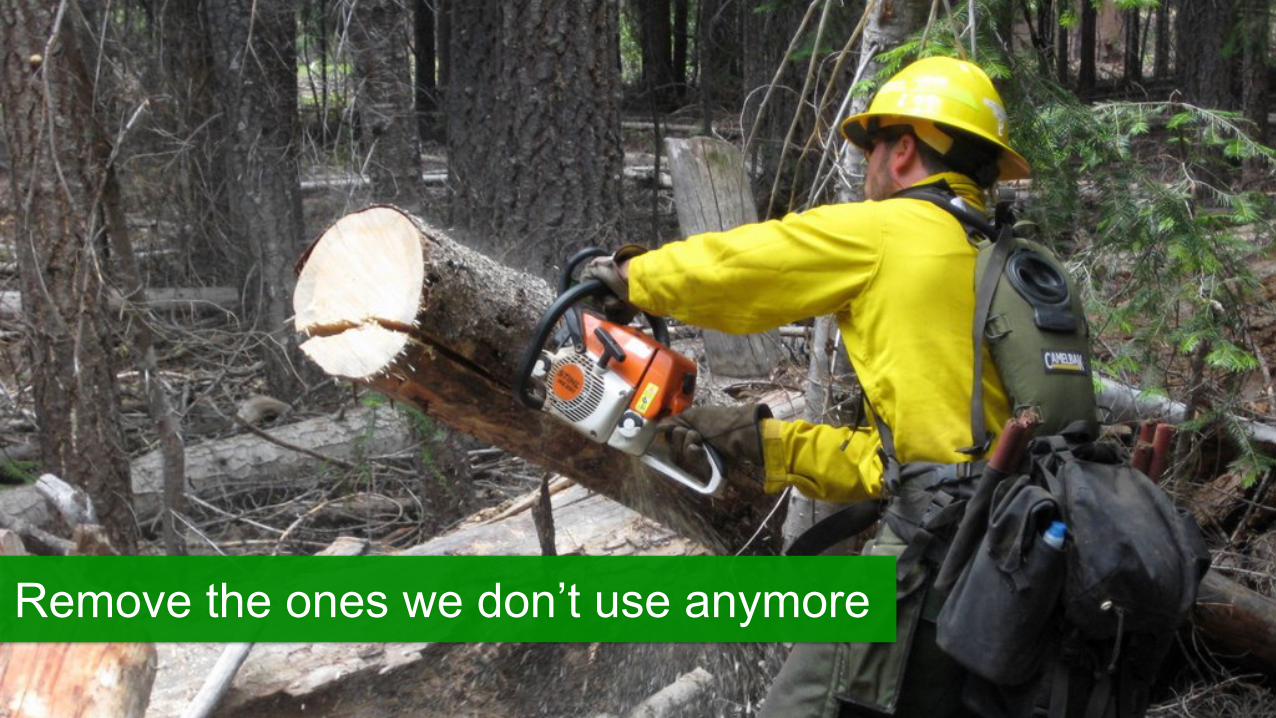
Remove the ones we don’t use anymore
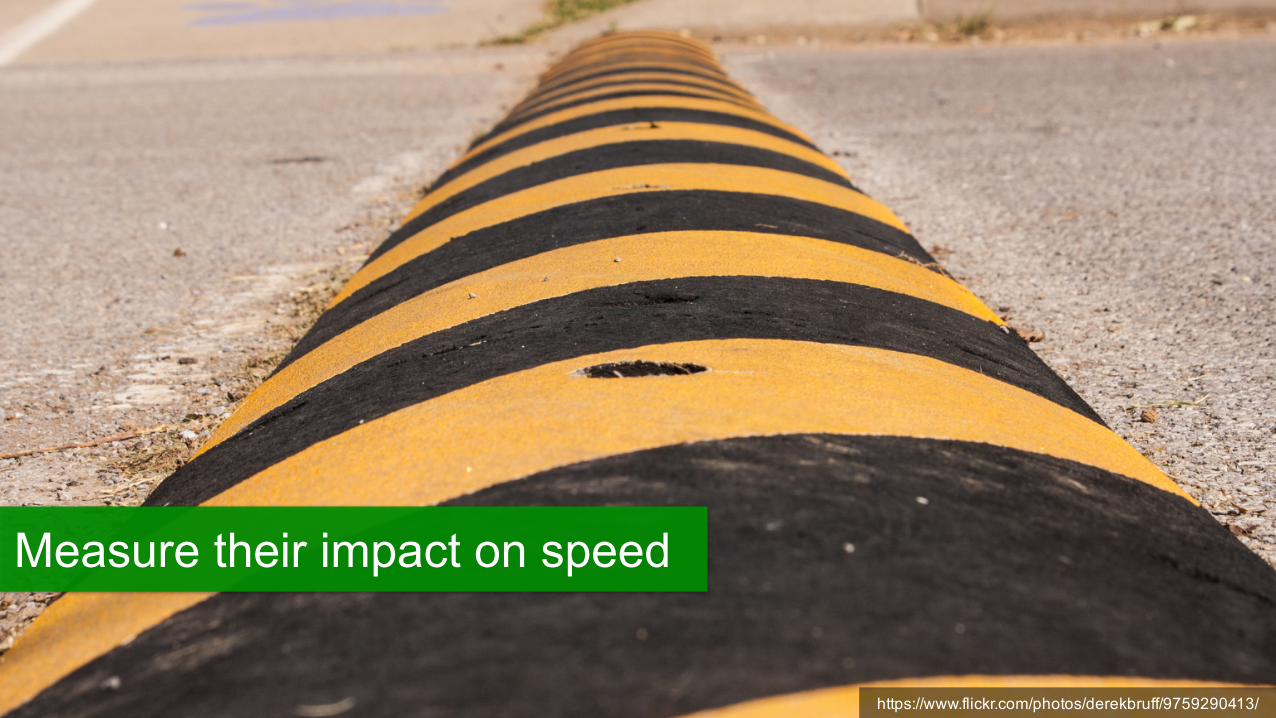
https://www.flickr.com/photos/derekbruff/9759290413/
Measure their impact on speed
https://www.flickr.com/photos/editor/57572350
Use Real User Monitoring to measure visitor’s experiences
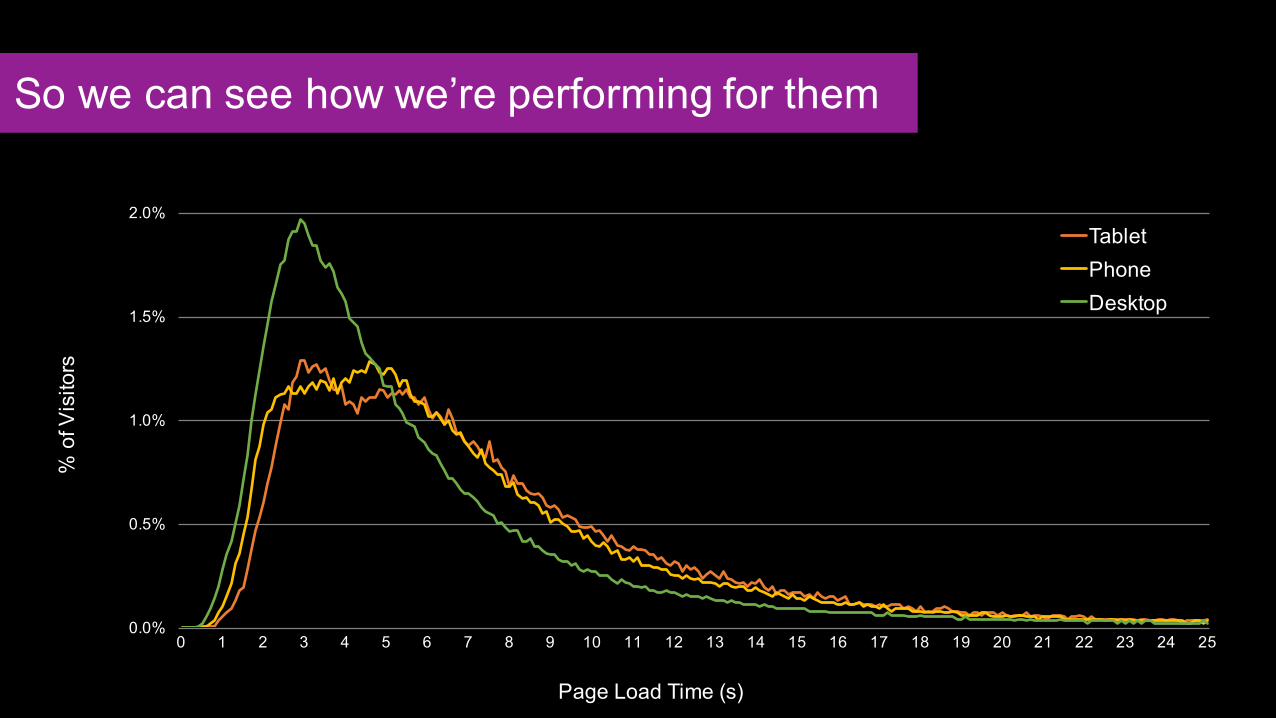
0.0%
0.5%
1.0%
1.5%
2.0%
0 1 2 3 4 5 6 7 8 9 10 11 12 13 14 15 16 17 18 19 20 21 22 23 24 25
% o
f Vis
itors
Page Load Time (s)
TabletPhoneDesktop
So we can see how we’re performing for them

And how it effects their behaviour
https://www.flickr.com/photos/mujitra/5232270530

https://www.flickr.com/photos/borkazoid/221185817
To deliver a great experience we need to be deliberate

@andydavies
http://slideshare.net/andydavies
Thank You!
https://www.flickr.com/photos/nzbuu/4093456029