Embed Size (px)
DESCRIPTION
Martin Bazley slides from MA Wonder Web 10 Jun 09 V&A
Citation preview
Understanding online audiences: How to evaluate your website and why
World wide wonder: Museums on the web V&A Sackler Centre 10 June 2009
Martin Bazley
Online experience consultant
Martin Bazley & Associates
Martin Bazley• Science Museum, London,
Internet Projects (7yrs)• E-Learning Officer, MLA South East
(3yrs)• Chair of E-Learning Group for
Museums• Consultancy, websites, training, user
testing, evaluation …Martin Bazley & Associates
Notes in pack for afterwards


www.martinbazley.com

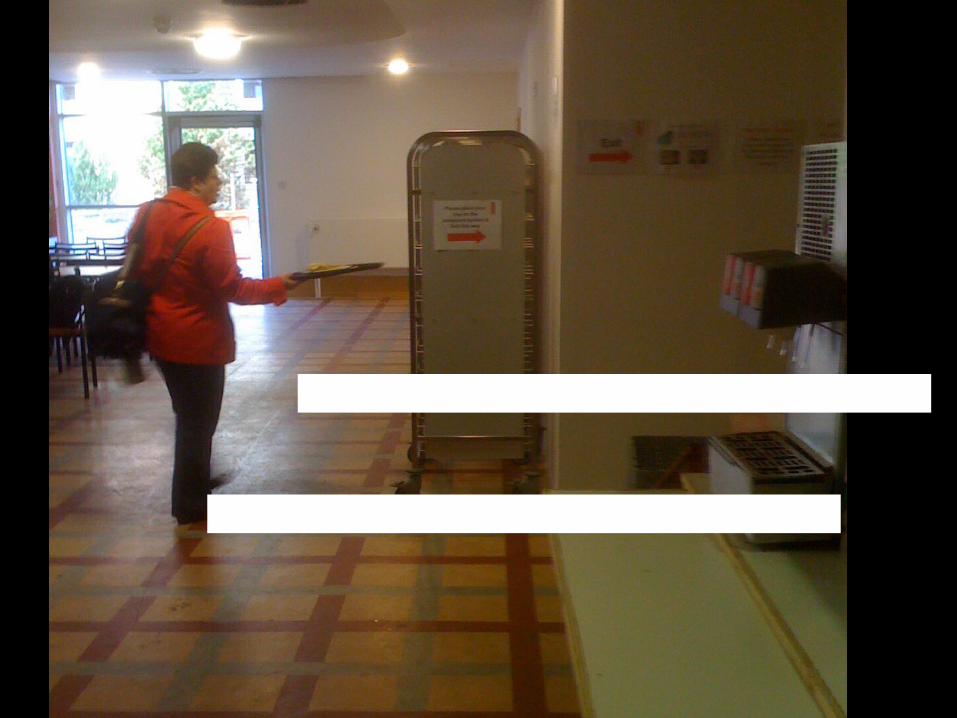
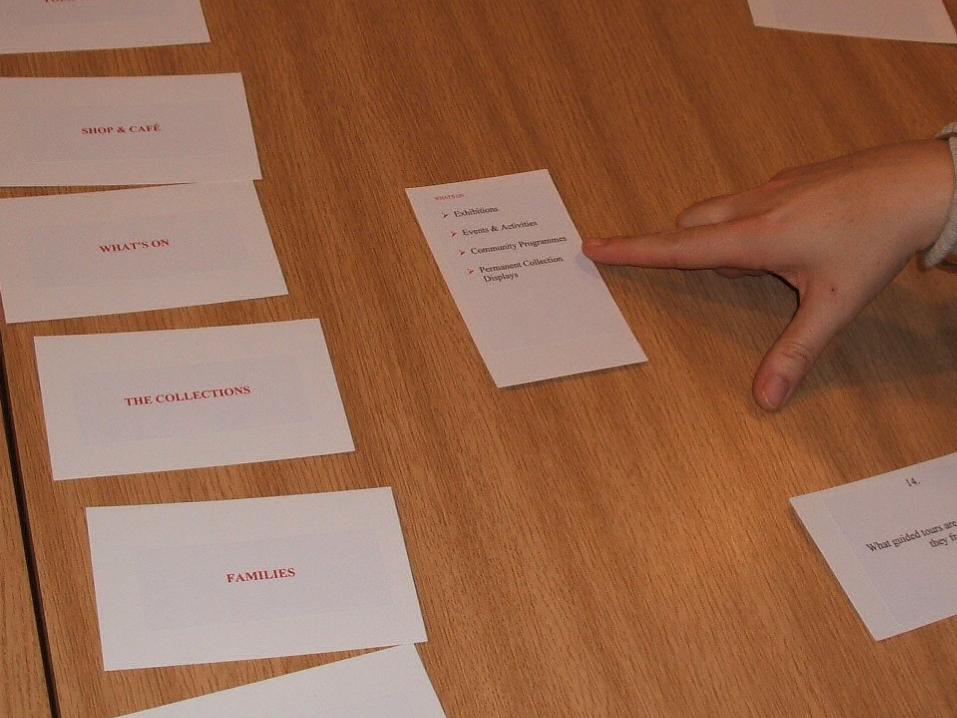
Why do we need to research our online audiences?

Because otherwise users don’t ‘get’ what we are offering:
a real–world example
(10 Jun09: 43% of non-users don’t want web at home - even for free)
Re value/status of Wikipedia – motivation, then information – anyone involved in any serious research will discover errors very quickly – try and get links into museum
content via Wikipedia and other channels
Even a slight difference in viewpoints…
…can cause real problems for users

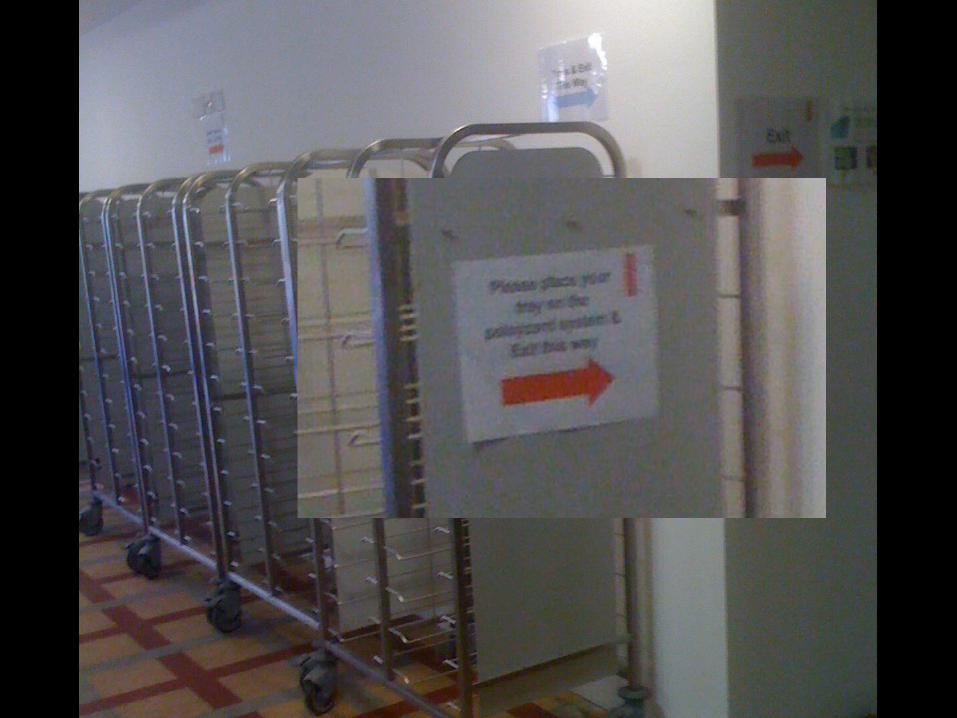
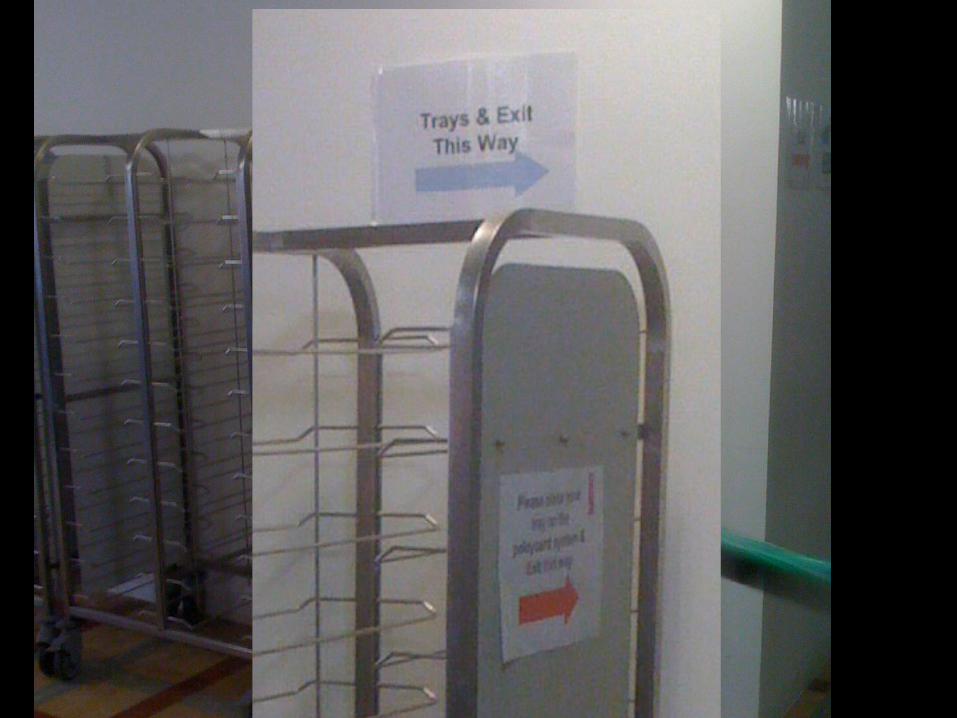
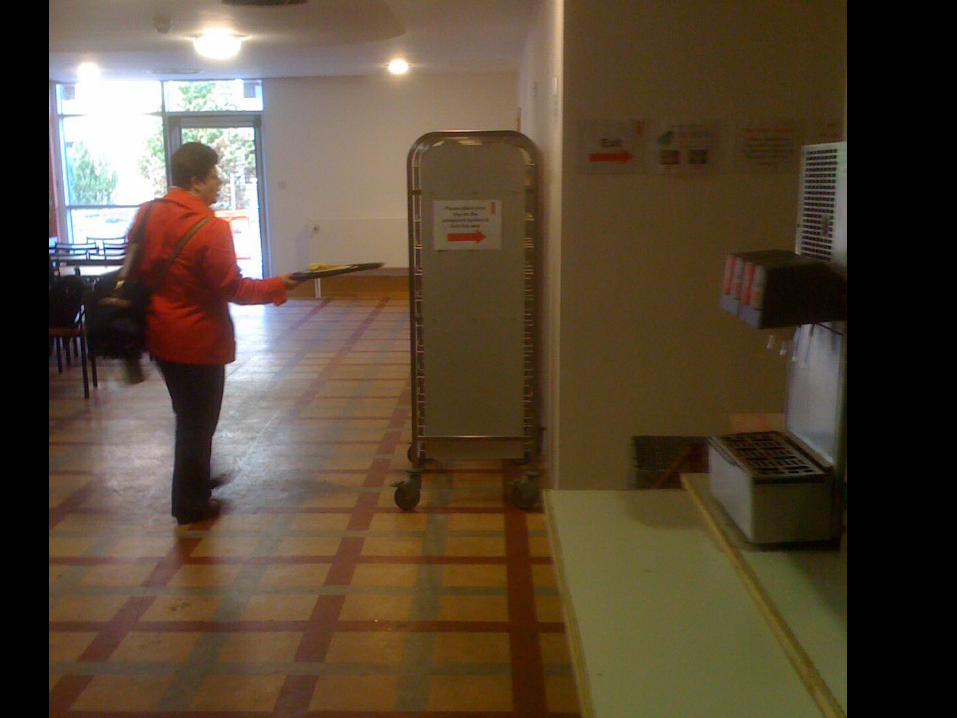


A conflict between visual affordance…
…and written instructions
visual affordance almost always wins

Another example
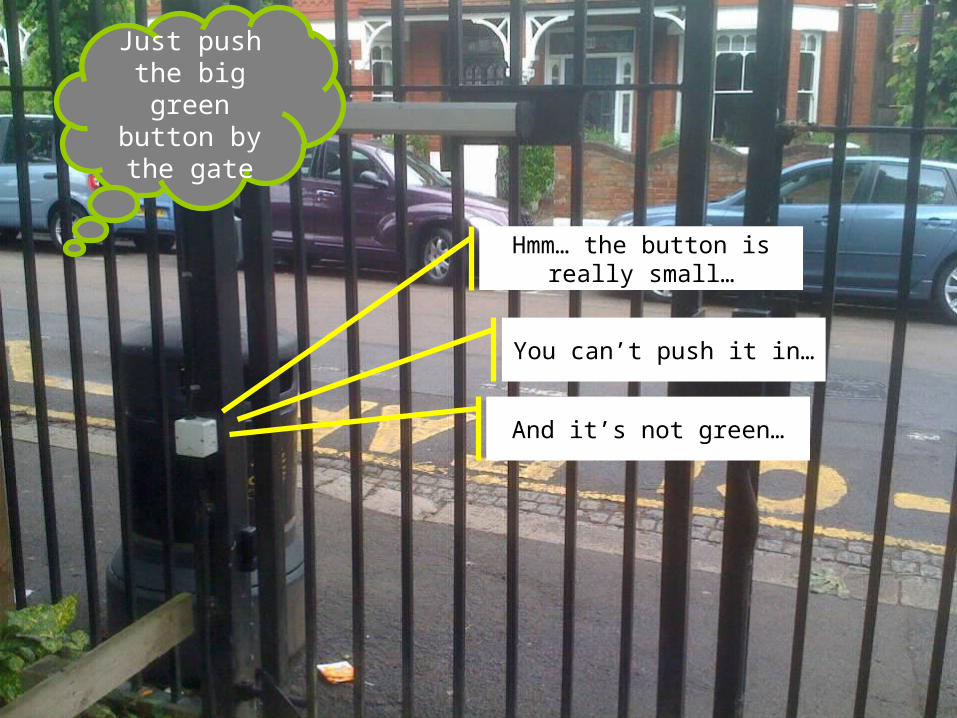
Hmm… the button is really small…
And it’s not green…
You can’t push it in…
Just push the big green
button by the gate
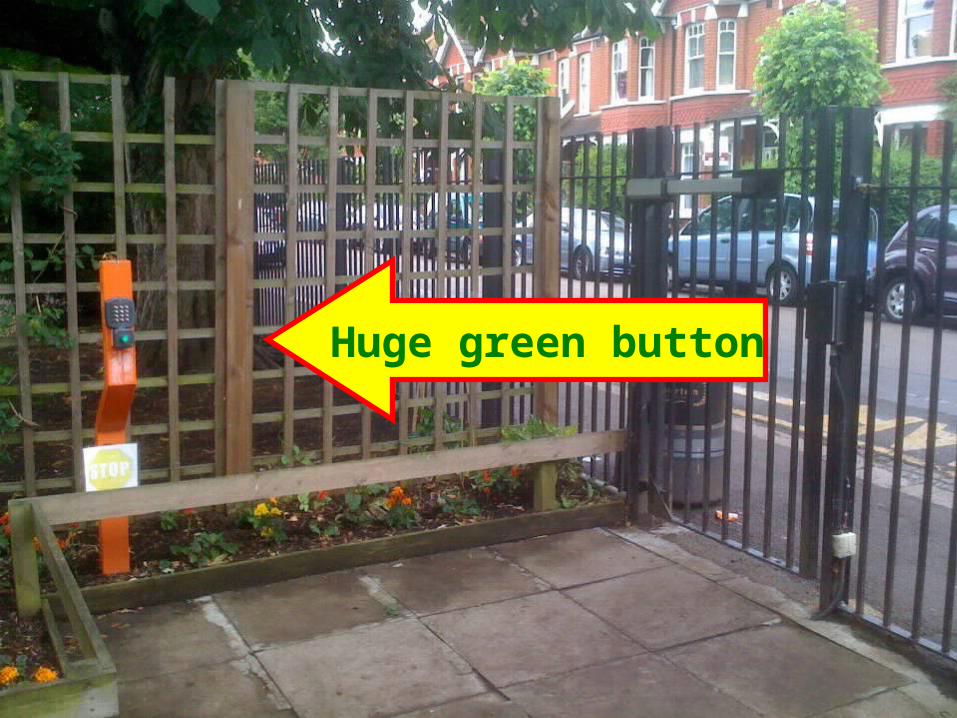
Huge green button

How can we get a sense of who our online visitors are and what they do with our online content?
How do we gather data to help us improve what we do?
How do we measure success from the user's point of view, and against our own objectives and constraints?
For example, how justify investment in social networks etc?
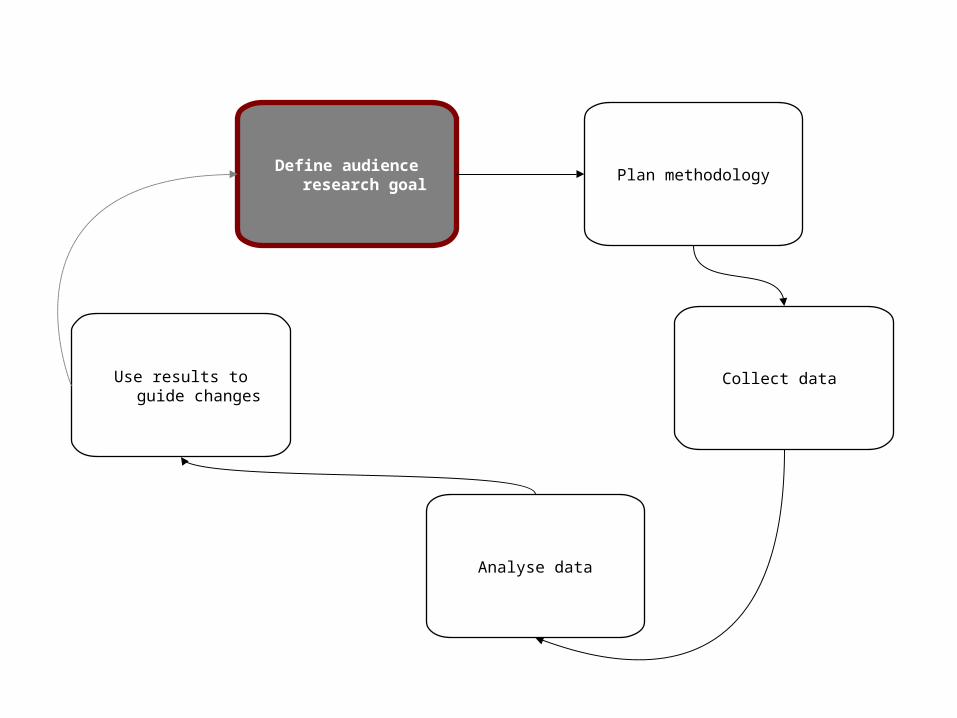
Define audience research goal
Analyse data
Collect data Use results to guide changes
Plan methodology
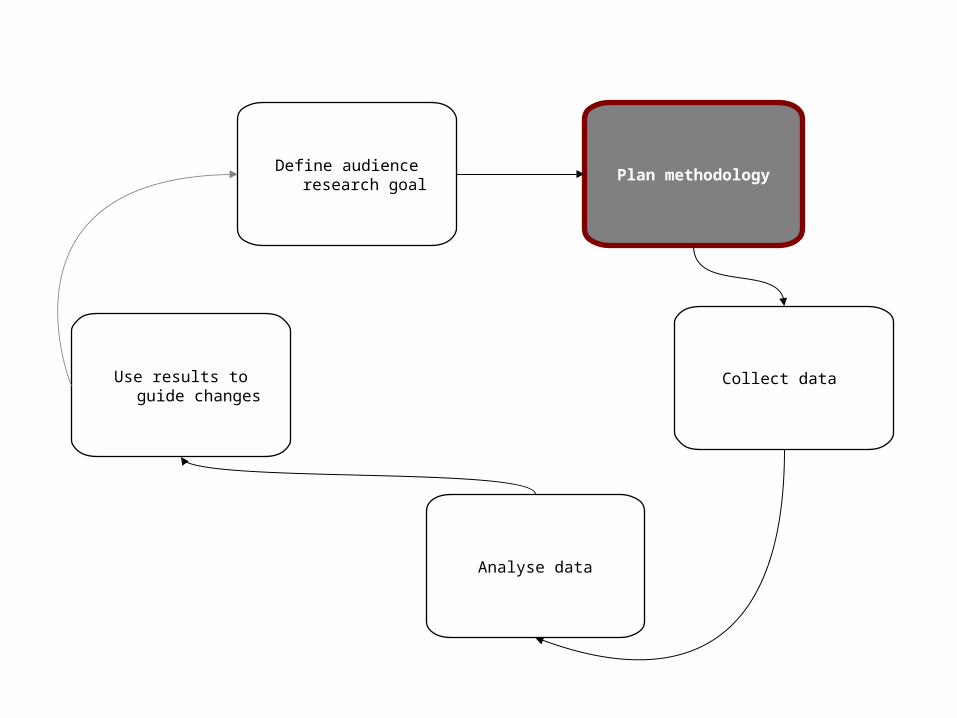
Define audience research goal
Analyse data
Collect data Use results to guide changes
Plan methodology
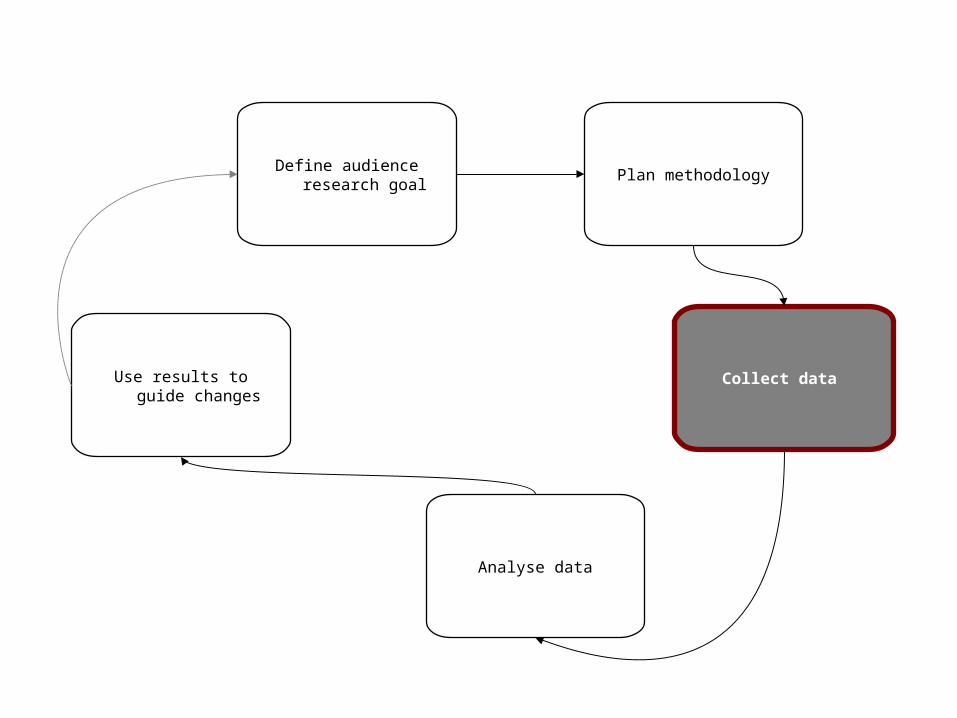
Define audience research goal
Analyse data
Collect data Use results to guide changes
Plan methodology

Define audience research goal
Analyse data
Collect data Use results to guide changes
Plan methodology

Define audience research goal
Analyse data
Collect data Use results to guide changes
Plan methodology

Define audience research goal
Analyse data
Collect data Use results to guide changes
Plan methodology

Reasons for doing audience research:
Evaluation
• Did your project/product/service do what you wanted it to do?
• Provide information for stakeholders
• Gauge audience satisfaction

Reasons for doing audience research:
Promotion
• Improve your offer for your target audiences
• Increase usage
• Widen access
Reasons for doing audience research:
Planning
• Inform development of a new product/service
• Inform business planning
• Prove interest in a related activity (e.g. exhibit)
Tools available
• Qualitative – focus groups, “free text” questions in surveys, interviews
• Quantitative – web statistics, “multiple choice” questions in surveys, visitor tracking
• Observational – user testing, ethnographic

When to evaluate or test and why
• Before funding approval – project planning
• Post-funding - project development
• Post-project – summative evaluation
Testing is an iterative process
Testing isn’t something you do once
Make somethingMake something=> test it => test it
=> refine it=> refine it=> test it again=> test it again
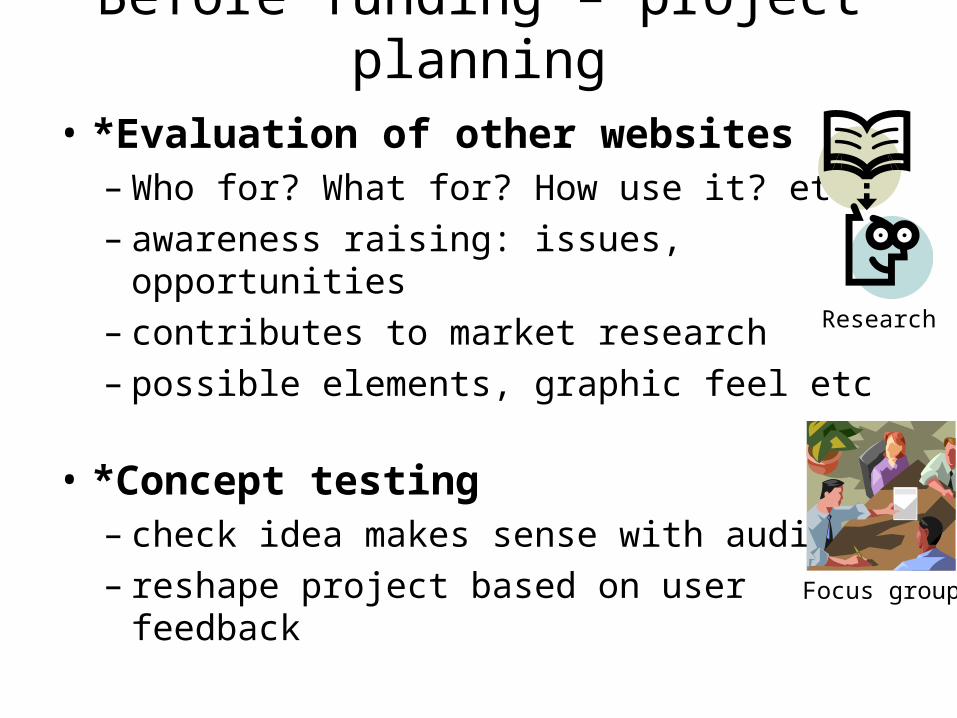
Before funding – project planning• *Evaluation of other websites
– Who for? What for? How use it? etc– awareness raising: issues, opportunities– contributes to market research– possible elements, graphic feel etc
• *Concept testing – check idea makes sense with audience– reshape project based on user feedback
Focus group
Research

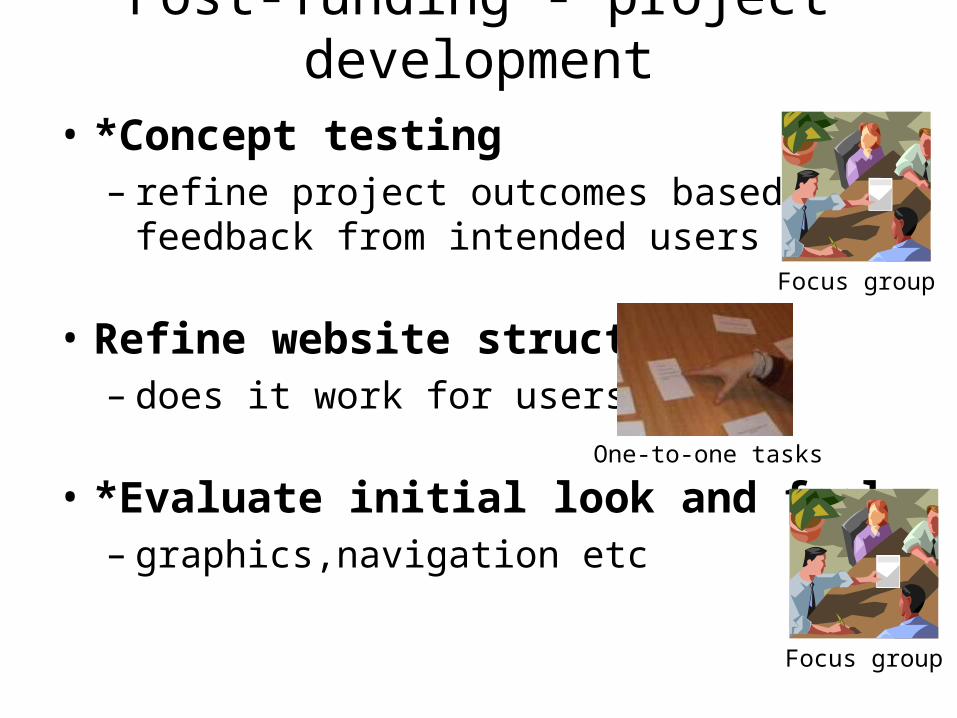
Post-funding - project development• *Concept testing
– refine project outcomes based on feedback from intended users
• Refine website structure– does it work for users?
• *Evaluate initial look and feel – graphics,navigation etc
Focus group
Focus group
One-to-one tasks


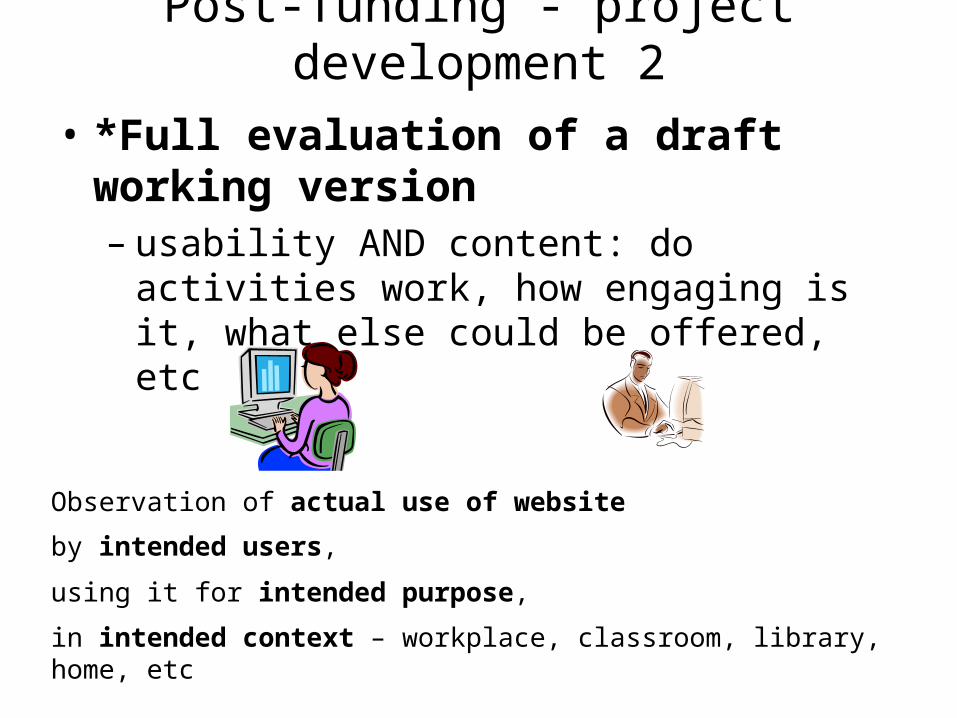
Post-funding - project development 2
• *Full evaluation of a draft working version – usability AND content: do activities work, how
engaging is it, what else could be offered, etc
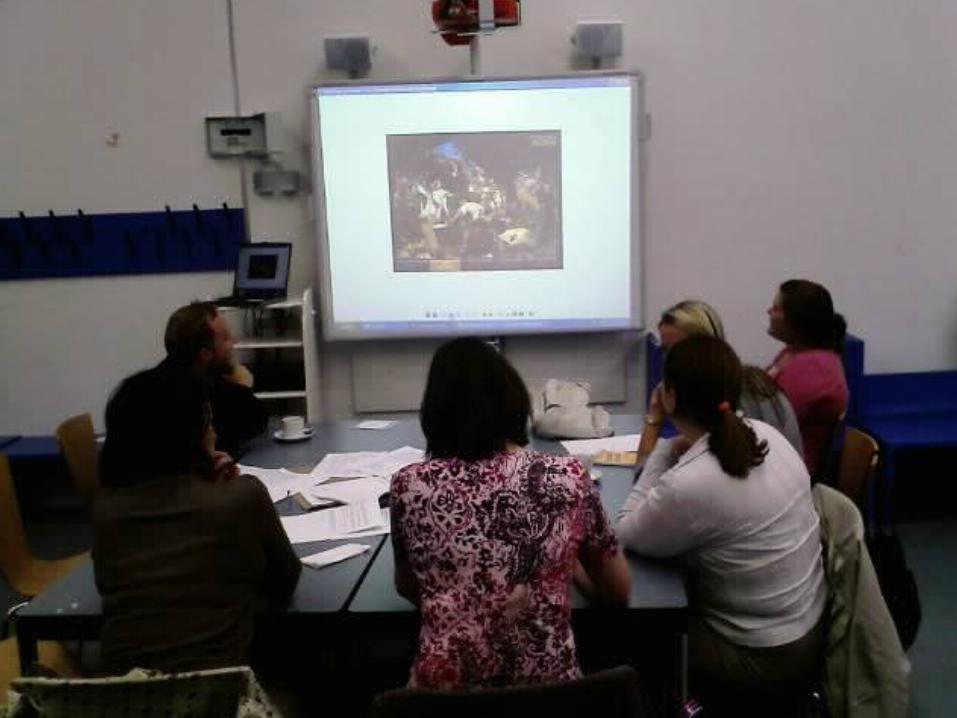
Observation of actual use of website
by intended users,
using it for intended purpose,
in intended context – workplace, classroom, library, home, etc


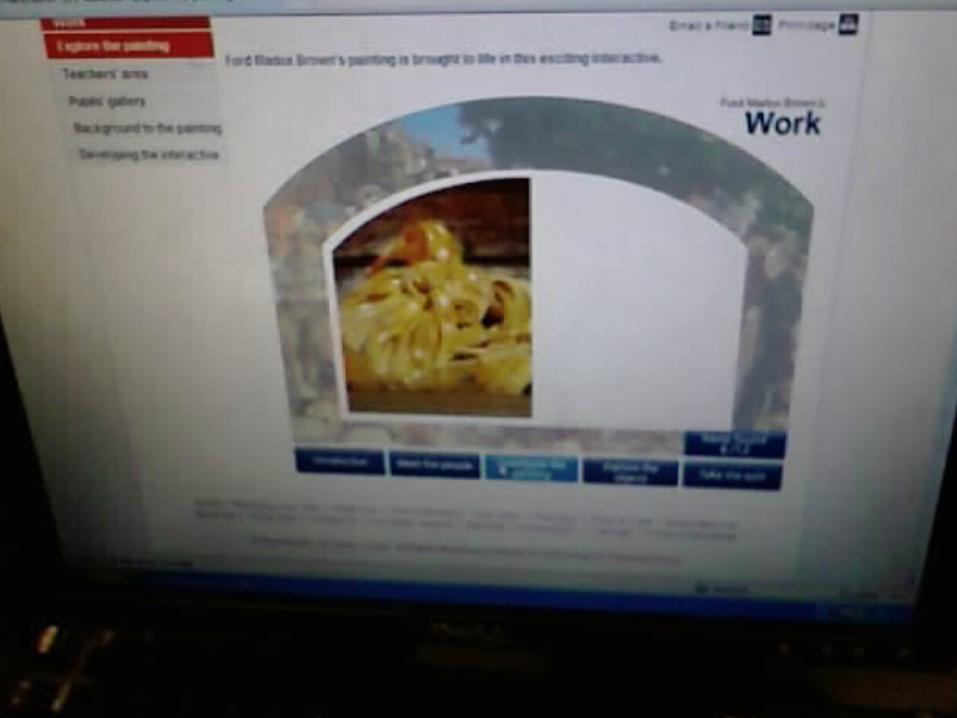


• Video clip Moving Here key ideas not lesson plans


Post-funding - project development 3
• Acceptance testing of ‘finished’ website– last minute check, minor corrections only– often offered by web developers
• Summative evaluation– report for funders, etc– learn lessons at project level for next time

Website evaluation and testingNeed to think ahead a bit:
– what are you trying to find out?
– how do you intend to test it?
– why? what will do you do as a result?
The Why?Why? should drive this process
User test early
Testing one user early on in the project…
…is better than testing 50 near the end

Two usability testing techniques
“Get it” testing- do they understand the purpose, how it
works, etc
Key task testing- ask the user to do something, watch how
well they do
Ideally, do a bit of each, in that order

User testing – who should do it?• The worst person to conduct (or interpret)
user testing of your own site is…– you!you!
• Beware of hearing what you want to hear…
• Useful to have an external viewpoint• First 5mins in a genuine setting tells you
80% of what’s wrong with the site

Extracts fromLondon Museums Hub
Online audience research

Data used for different things:Reporting and diagnostics
• Diagnostics – aimed at improvement of resources, identifying new areas for development, etc
• Reporting – to DCMS and other funders, internal etc

Google Analytics =Most popular web-based web stats
tool. But also Piwik, Mint, Clicky etc
Also AWstats, HitStats, etc
Stats solutions
Exclusion of bots / internal traffic• most people aware of need to do so • but there is also pressure to provide
higher figures…so maybe leave them in?
Issues
Browser-based statistics applications (like GA) cannot be installed on the whole of a site because
a) no access to the code of the site, or
b) there are just too many legacy pages to change
Issues
Barriers to effective usage of web stats
Subsections of websites or microsites have different statistics packages=> separate analysis for each part
Perhaps outside supplier controls access to log files or stats package and are unwilling to add Google Analytics etc
Issues
Off-website activity not reflected in server stats
More of users’ interaction with museum web content is happening away from the museum websites themselves, via blogging, Flickr, YouTube, wikis, etc.
Activity via RSS feeds such as blogs or podcasts can be measured…
Issues
As museums engage further with web 2.0 services their online identities become fuzzier
=> May soon not be feasible for museums to measure impact in absolute numbers

Geffrye Museum web stats linked with events etc
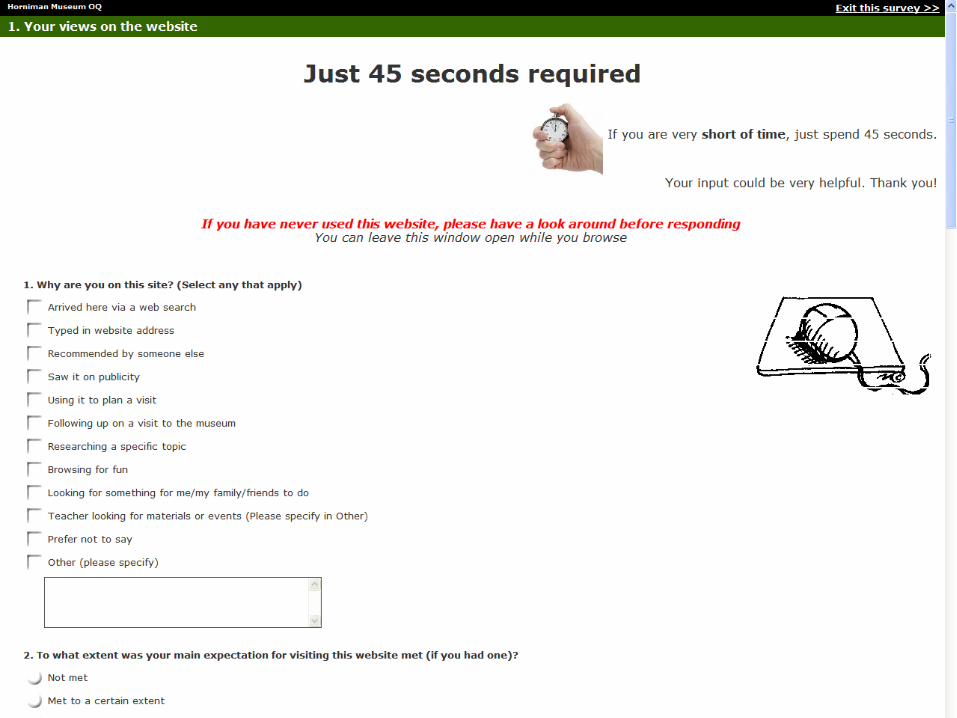
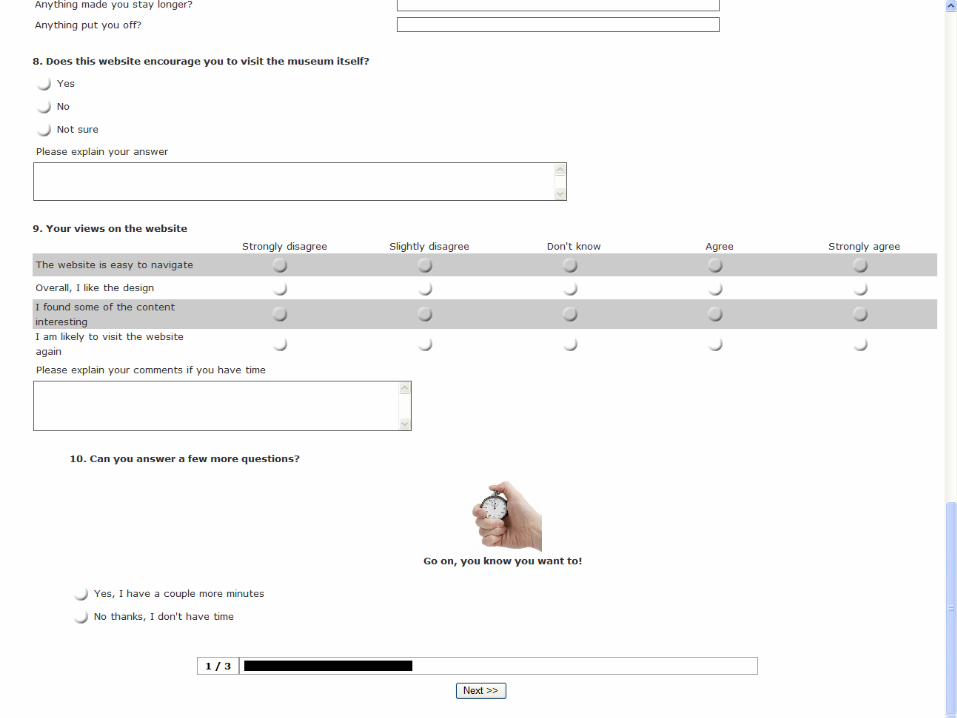
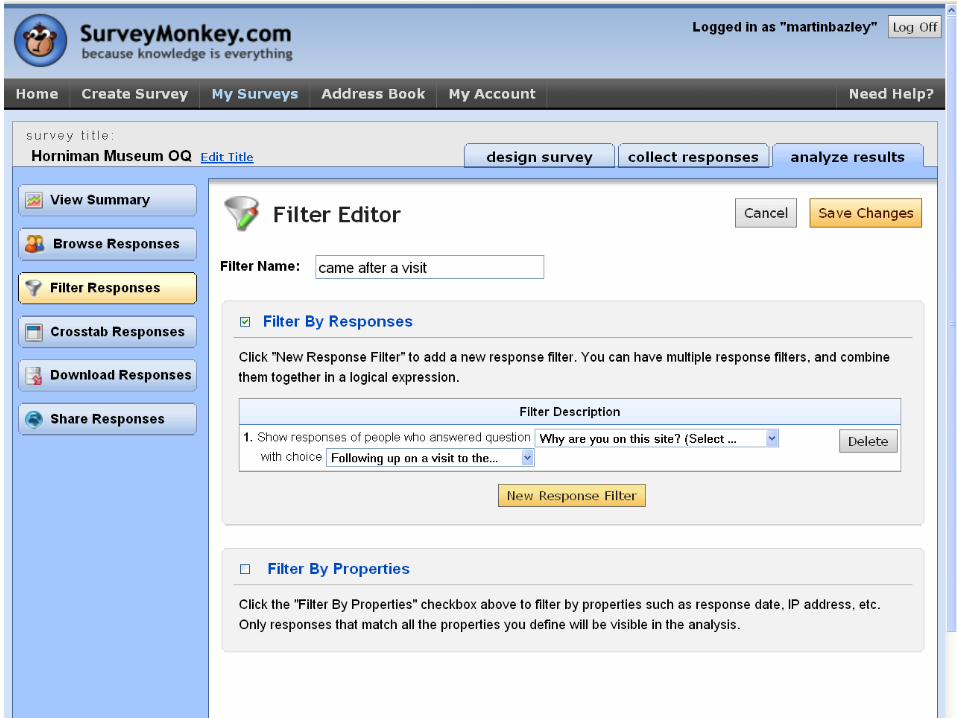
Online questionnaire
• SurveyMonkey – questions developed with museums then refined following trialling– Links to questionnaire added to museum
websites– Run for several months, 000s responses
collected


EM Online collections research by MHM

Visitor survey
• gathered data for comparison with OQs
• recruitment for focus groups

Focus groups
18-24 / families / adults 25+
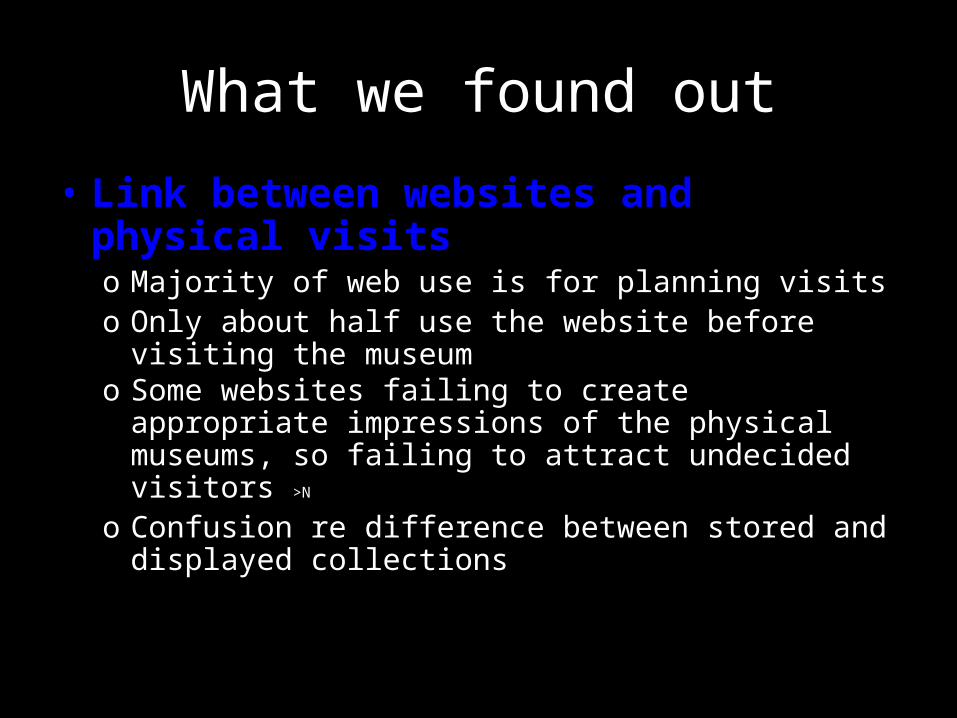
What we found out
• Link between websites and physical visitso Majority of web use is for planning visitso Only about half use the website before visiting
the museumo Some websites failing to create appropriate
impressions of the physical museums, so failing to attract undecided visitors >N
o Confusion re difference between stored and displayed collections

What we found out
•Very little use of websites other than for planning the visit, except:o Teachers – looking for teaching materials
and ideaso Families – looking for online games,
homework etco Comment re online collection browsing:
researching/searching, following, browsing (MHM)
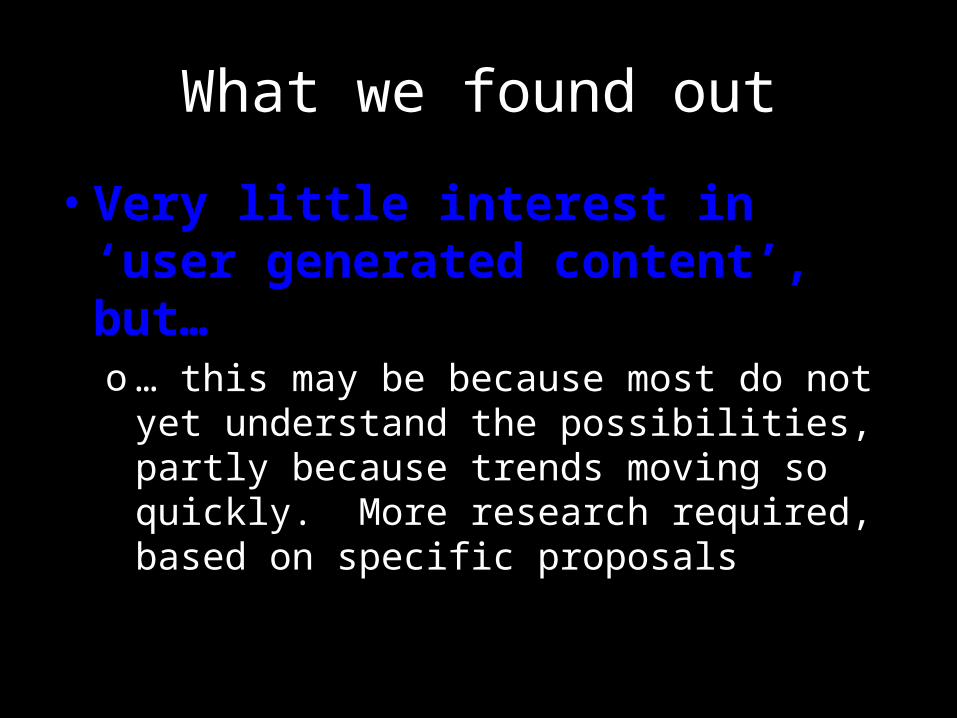
What we found out
•Very little interest in ‘user generated content’, but…o… this may be because most do not yet
understand the possibilities, partly because trends moving so quickly. More research required, based on specific proposals

What we found out
• Demographic data• Motivations for using website• Expectations of website• etc
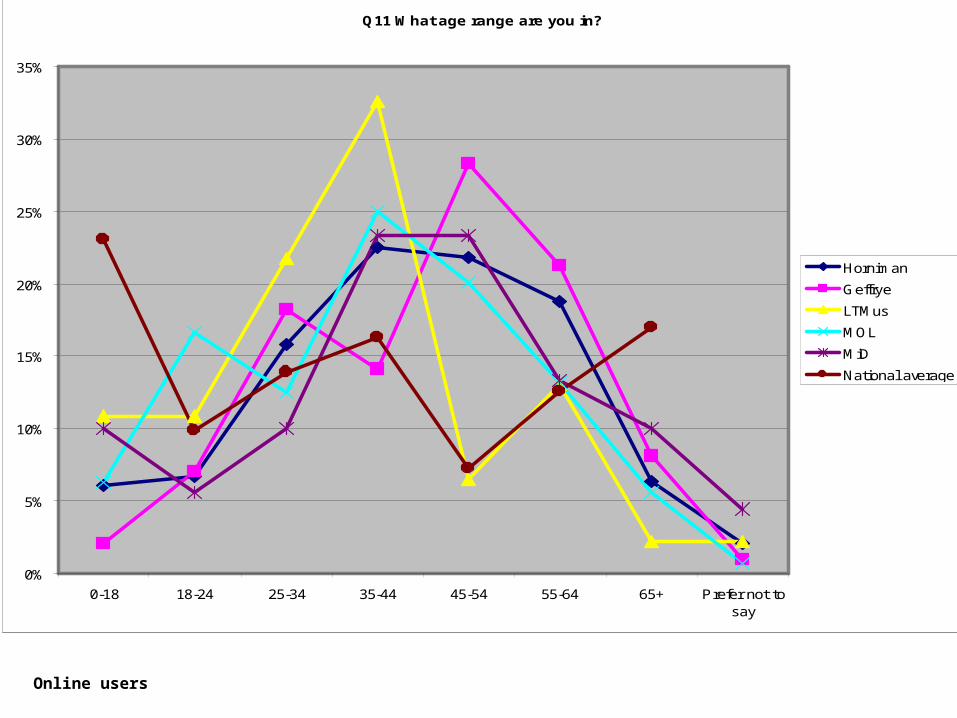
Q11 What age range are you in?
0%
5%
10%
15%
20%
25%
30%
35%
0-18 18-24 25-34 35-44 45-54 55-64 65+ Prefer not tosay
Horniman
Geffrye
LTMus
MOL
MiD
National average
Online users
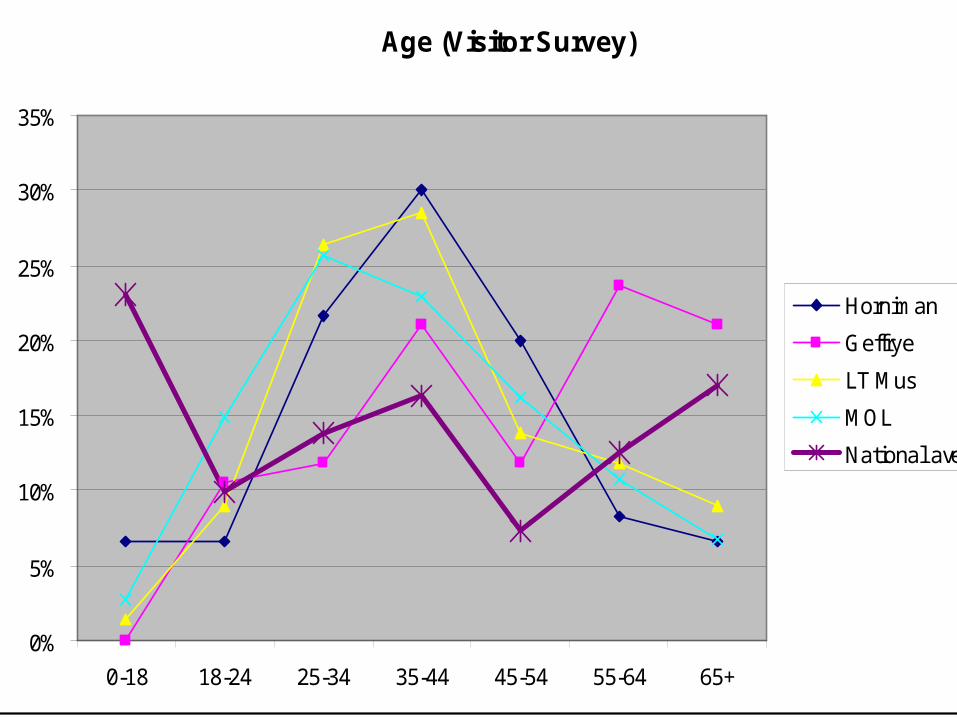
Age (Visitor Survey)
0%
5%
10%
15%
20%
25%
30%
35%
0-18 18-24 25-34 35-44 45-54 55-64 65+
Horniman
Geffrye
LT Mus
MOL
National average

Q11 What age range are you in? (compared to national averages 2006)
-25%
-20%
-15%
-10%
-5%
0%
5%
10%
15%
20%
25%
0-18 18-24 25-34 35-44 45-54 55-64 65+ Prefer not tosay
Horniman
Geffrye
LTMus
MOL
MiD
All 5

Age of visitors to the museum (relative to population averages)
-25%
-20%
-15%
-10%
-5%
0%
5%
10%
15%
20%
0-18 18-24 25-34 35-44 45-54 55-64 65+
Horniman
Geffrye
LT Mus
MOL
All 4
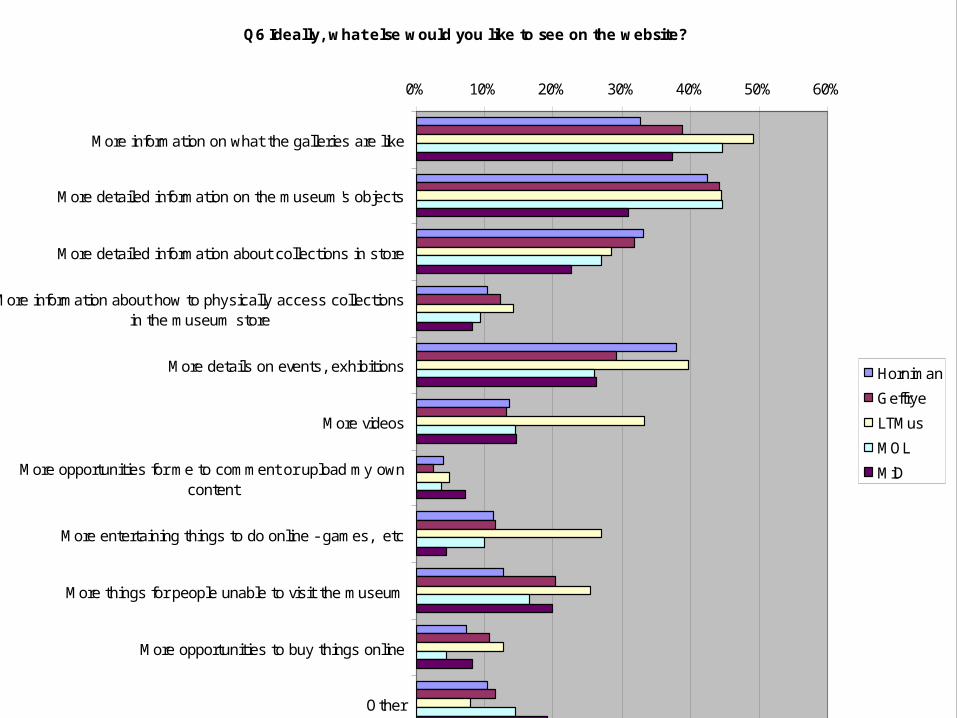
Q6 Ideally, what else would you like to see on the website?
0% 10% 20% 30% 40% 50% 60%
More information on what the galleries are like
More detailed information on the museum's objects
More detailed information about collections in store
More information about how to physically access collectionsin the museum store
More details on events, exhibitions
More videos
More opportunities for me to comment or upload my owncontent
More entertaining things to do online - games, etc
More things for people unable to visit the museum
More opportunities to buy things online
Other
Horniman
Geffrye
LTMus
MOL
MiD
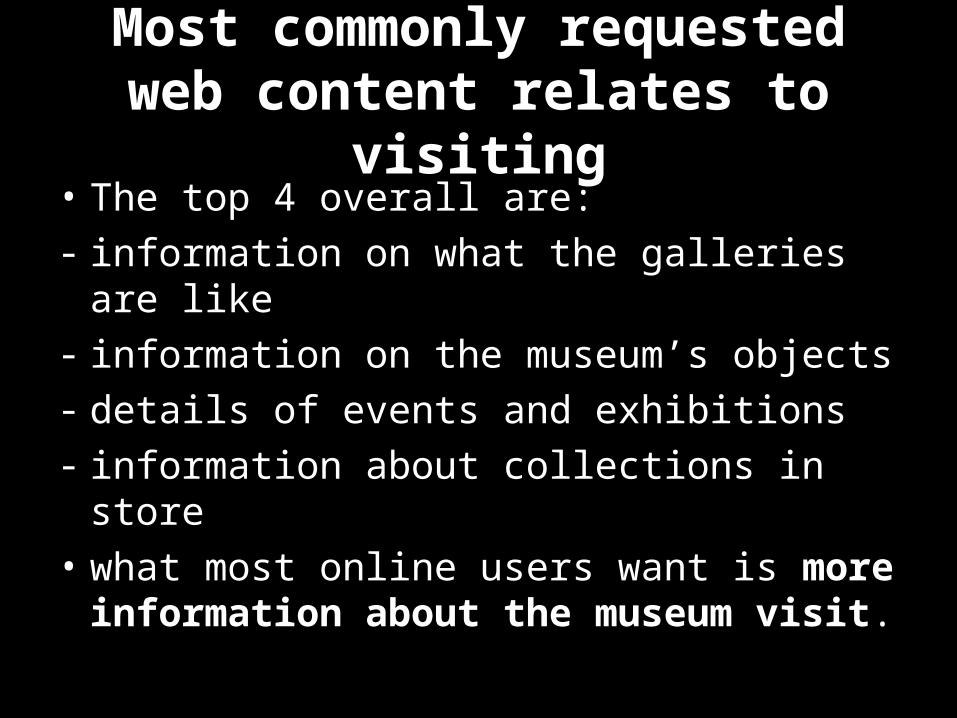
Most commonly requested web content relates to
visiting• The top 4 overall are: - information on what the galleries are
like- information on the museum’s objects- details of events and exhibitions- information about collections in store• what most online users want is more
information about the museum visit.
Value = Reach x Quality


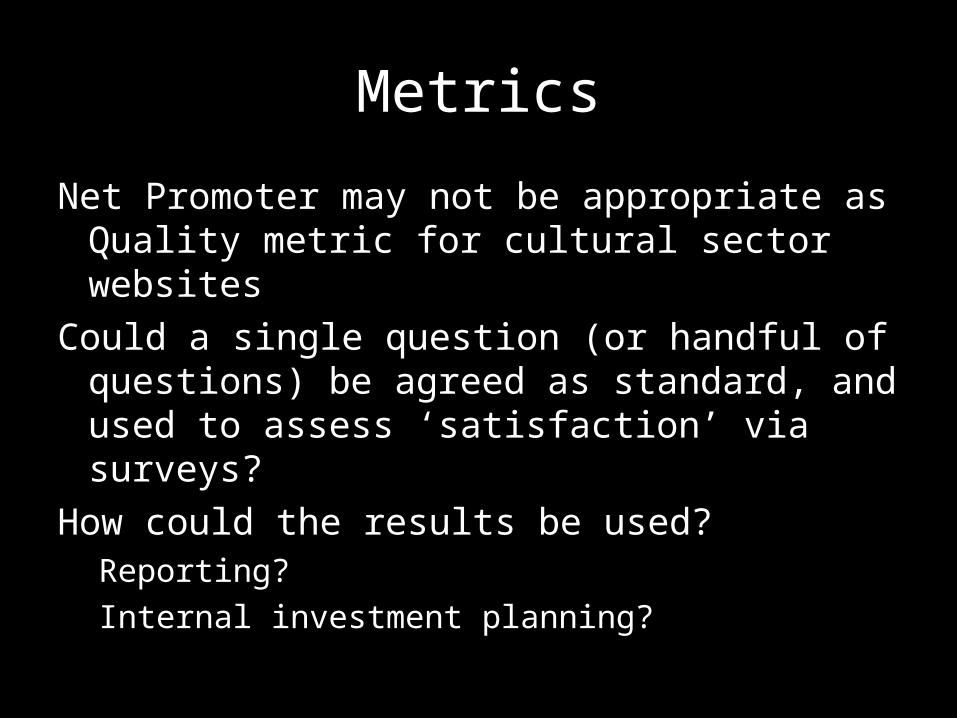
Metrics
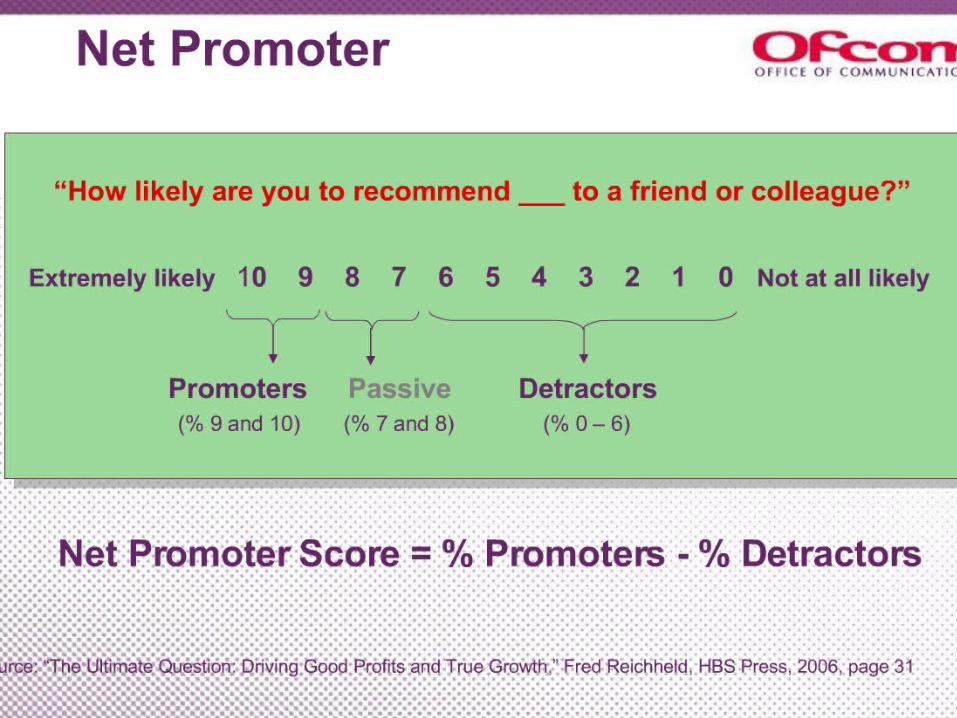
Net Promoter may not be appropriate as Quality metric for cultural sector websites
Could a single question (or handful of questions) be agreed as standard, and used to assess ‘satisfaction’ via surveys?
How could the results be used?Reporting?Internal investment planning?

Defining market share
• ‘Reach’ may be very small for niche topics / audiences – does this matter?
• Could use % of total audience instead?• This would mean
– (a) estimating total audience (often part of project plan / funding application anyway)
– (b) using unique visitors stats or other means to estimate reach
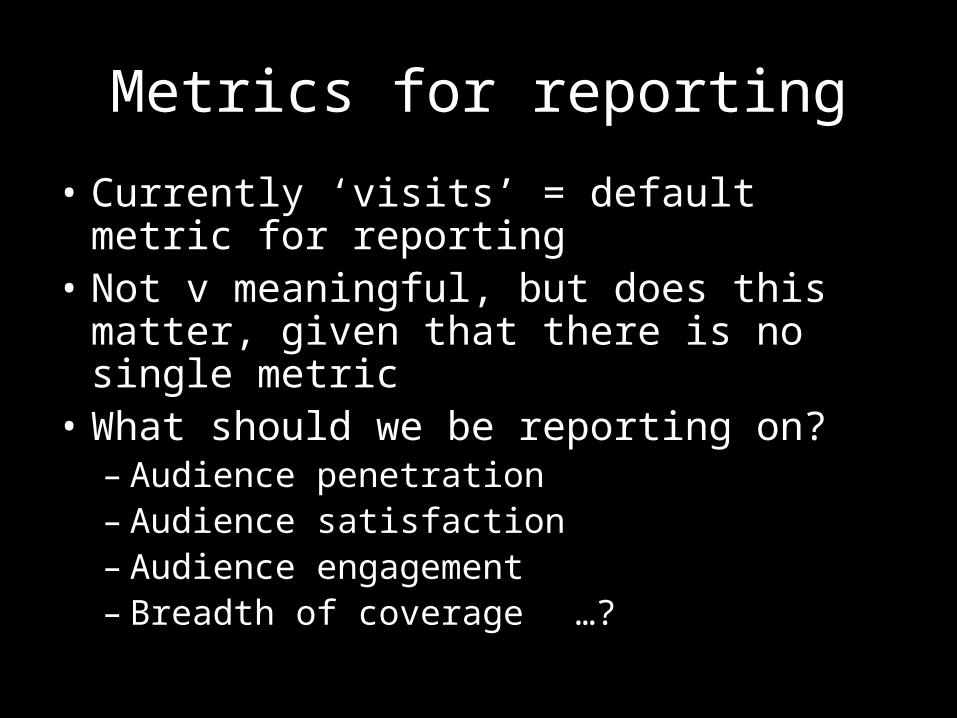
Metrics for reporting
• Currently ‘visits’ = default metric for reporting
• Not v meaningful, but does this matter, given that there is no single metric
• What should we be reporting on?– Audience penetration– Audience satisfaction– Audience engagement– Breadth of coverage …?
Metrics for development
• Use a variety of metrics in combination, based on nature of project issues, future objectives and current sector priorities…
• No magic bullets on horizon – justifying investment still a ‘creative’ decision
• Need balance between flexibility between projects, and shareability of data, for successful analysis and skills development
‘Top tips’ in notes in pack ‘Understanding online audiences’