Embed Size (px)
Citation preview

ASIASPENDER BEHAVIOR AND SENTIMENTS
JUNE 2015
UNDERSTANDING
GAMES MARKET IN THE DIGITAL
Digital Games Spending in Asia, 2015 | Copyright © 2015 SuperData Research and Worldpay. All rights reserved. | www.superdataresearch.com | www.worldpay.com/videogames

Contents
2
03 Introduction
04 Overview Methodology
12 Market Size Asia Regional Digital Games Revenue, 2015E // Asia Total Digital Games Revenue, 2014 - 2017E Segment-Level Regional Revenue and Audience, 2015
19 Playing and Spending Behavior Demographic Breakdown: Gender, Income and Age PC Game Genre Preferences Free-to-Play MMO Conversion and ARPPU, 2015E Subscription MMO Conversion and ARPPU, 2015E Premium PC Game Conversion and ARPPU, 2015E
25 Monetization and Payment Preferences Game Billing Method Preference Likelihood of Repeat In-Game Purchases Spender Preferences by PC Game Billing Type Payment Method Preference by Country Reasons for Incomplete Purchases Factors Likely to Increase Spending
39 Everything Else Terminology Payment Methods Devices Geographies About SuperData Research & Worldpay SuperData Research Market Data Contact
Digital Games Spending in Asia, 2015 | Copyright © 2015 SuperData Research and Worldpay. All rights reserved. | www.superdataresearch.com | www.worldpay.com/videogames

Introduction
3
Asia’s digital games revenue nears $20B with a CAGR of 6.13% by 2017E.*
Asia’s digital games landscape continues to grow at a staggering rate, highlighting its current and future potential. Merchants must be increasingly strategic as to how they navigate this market as each country has a particular payments profile. This report focuses on the PC digital games consumer, and answers the following questions:
• Which digital gaming segments show the greatest potential for growth?
• How does purchasing power differ by country?
• How is spending unique across PC audiences?
• Do consumers prefer free-to-play, subscription or premium PC game billing models and why?
• What payment methods do PC gamers use and how does preference vary across countries?
• What factors can increase spending in key Asian markets?
Digital Games Spending in Asia, 2015 | Copyright © 2015 SuperData Research and Worldpay. All rights reserved. | www.superdataresearch.com | www.worldpay.com/videogames
*SuperData Research

Overview

In this study:
Methodology
5
Data:
*Qualified respondents include residents of China, South Korea and Japan aged 18+ who have made online purchases of digital content for PC/Mac games in the past three months. The data and figures mentioned in this report (including, but not limited to, the relevant percentages) refer to information collected by SuperData Research and Worldpay in the context of the study.
Time Period:6,289,505 unique
transactions and a survey of 1,451 qualified respondents.*
October 2011 to December 2014 (data); March 2015 (survey)
User Base:1,347,101 unique MMO and Digital PC gamers.
Analysis:Comparative analysis based on industry-relevant metrics.
SuperData Research’s Methodology
01 Data
Every month we collect, in an anonymized format, the spending data of millions of unique paying online gamers directly from publishers and developers, totaling 50+ publishers and 450+ game titles.
03 Analysis
We combine the digital point-of-sale data with qualitative consumer insights to speak to the “why” of the market.
02 Collection
We clean, aggregate, and analyze these data to establish market benchmarks and models for all segments of digital games.
04 Reporting
Our research covers everything from worldwide genre benchmarks to title-level KPIs, country-level deep dives to brand equity.
Digital Games Spending in Asia, 2015 | Copyright © 2015 SuperData Research and Worldpay. All rights reserved. | www.superdataresearch.com | www.worldpay.com/videogames

Market Size

Asian digital games market nears $20B in 2015E
Digital games revenue, 2015E
Asia digital games revenue ($bil)2014
2015E
2016E
2017E $22.3B$21.1B
$19.8B$18.8B
Asia market share by country
South Korea and Japan combined account for 65% of Asia’s revenue despite having only a tenth of China’s population. Digital games revenue in Japan and Korea is characterized by high individual spending and slow but steady growth. Meanwhile, China’s revenue increase largely stems from a massive influx of low-spending mobile players.
S. Korea 11%
A robust mobile market and the popularity of free-to-play MMOs fuel strong growth in Asia.
7
China$7.5B
South Korea$2.2B
Japan$8.8B
*Rest of Asia refers to India, Indonesia, Philippines, Saudi Arabia, Thailand, United Arab Emirates and Vietnam.
China 38%
Japan 44%
Rest of Asia* 7%
Digital Games Spending in Asia, 2015 | Copyright © 2015 SuperData Research and Worldpay. All rights reserved. | www.superdataresearch.com | www.worldpay.com/videogames

Social gaming plateaus in Asia at $2.3BDespite attracting some new players, most social spending players are moving to mobile.
Revenue and Audience (MAU)Social games market, 2015E
$67M
$317M
$1.7B
3M11M
468M
China Japan S. Korea China Japan S. Korea
8
Social games stagnate at nearly $2.3B in Asia as its largest market faces an exodus to mobile. Growth in the Chinese social games market is quickly decelerating, with revenue expected to grow by a modest 7% in 2015E, down from 22% in 2014.
Korea’s social games are still recovering from the 2014 Facebook ban. Last September, concerns over casino games spurred the Korean government to ban all Facebook games until they cleared a formal approval process. While some games and players have slowly returned, many have made the switch to mobile social games such as Anipang for Kakao.
20142015E2016E2017E $2.48
$2.33$2.27$2.27
Asia social games monthly active users (mil)
Asia social games revenue ($bil)
20142015E2016E2017E 581
557535
507
Digital Games Spending in Asia, 2015 | Copyright © 2015 SuperData Research and Worldpay. All rights reserved. | www.superdataresearch.com | www.worldpay.com/videogames

Mobile makes up 59% of digital revenue in AsiaMobile is the largest segment in every country and overtakes 71% of revenue in Japan.
Revenue and Audience (MAU)Mobile games market, 2015E
$1.3B
$6.3B
$3.6B
38M
133M
680M
China Japan S. Korea China Japan S. Korea
9
China’s mobile audience will grow by 6% in 2015E. With roughly two-thirds of Asia’s entire mobile audience, China sees a steady influx of new players that continues to drive growth.
Mobile players in Korea and Japan spend over twice as much as players in China. Combined revenue from the two countries surpasses China’s by $4B in 2015E despite having a quarter of the players.
20142015E2016E2017E $13.6
$12.8$11.7
$11.1
Asia mobile games monthly active users (bil)
Asia mobile games revenue ($bil)
20142015E2016E2017E 1.2
1.10.9
0.8
Digital Games Spending in Asia, 2015 | Copyright © 2015 SuperData Research and Worldpay. All rights reserved. | www.superdataresearch.com | www.worldpay.com/videogames

China Japan S. Korea China Japan S. Korea
MMOs earn a fifth of Asia’s digital revenueFree-to-play makes up almost 80% of Asia’s $4.2B MMO market, and continues to grow.
Revenue and Audience (MAU)MMO games market, 2015E
$0.5B
$1.0B
$1.5B
11M24M
103M
China Japan S. Korea China Japan S. Korea
10
$77M
$216M
$512M
1M2M
8M
Free-‐to-‐play
Subscrip1on
Free-to-play MMO players outnumber pay-to-play 13-to-1. In 2015E, free-to-play adds four million new players as pay-to-play’s audience continues to slowly contract. Successful publishers such as Korea’s Nexon and NCSOFT have thus focused on making free-to-play MMOs for Asia’s audiences.
Free-to-play MMO revenue gains 11% in 2015E as pay-to-play revenue drops 12%. On average, pay-to-play MMO players spend one-tenth what their free-to-play counterparts spend.
Asia MMO games revenue ($bil)
Asia MMO games monthly active users (mil)
$0.8$0.8
$0.9$1.0
$3.8$3.5
$3.3$3.0
1011
1212
170166
1601562014
2015E2016E2017E
20142015E2016E2017E
Digital Games Spending in Asia, 2015 | Copyright © 2015 SuperData Research and Worldpay. All rights reserved. | www.superdataresearch.com | www.worldpay.com/videogames

Digital console is the smallest segment in Asia Revenue from console totals 3% of the Asian digital games market due to China’s lack of participation.
Revenue and Audience (MUU)Digital console games market,
$95M
$504M
$40M
5M
15M
12M
China Japan S. Korea China Japan S. Korea
11
China and Korea account for only a fifth of Asia’s console revenue. A 14-year ban on consoles in China and a PC-focused eSports culture in Korea have prevented the segment from finding an addressable audience in either country.
Japan earns almost four times as much revenue from digital console as China and Korea combined. Home to Sony and Nintendo, Japan is at the core of the global digital console market and its audience has steadily transitioned to the newest generation’s digital focus.
20142015E2016E2017E $712
$703$689
$637
Asia digital console games monthly unique users (mil)
Asia digital console games revenue ($mil)
20142015E2016E2017E 37
3636
34
2015E
Digital Games Spending in Asia, 2015 | Copyright © 2015 SuperData Research and Worldpay. All rights reserved. | www.superdataresearch.com | www.worldpay.com/videogames

Digital PC has a small but dedicated audienceHigh spending in Japan and Korea earn the two markets 79% of Asia’s digital PC revenue.
Revenue and Audience (MUU)Digital PC games market, 2015E
$217
$481
$122
4M
7M
17M
China Japan S. Korea China Japan S. Korea
12
Revenue for digital PC in Asia will continue to grow at an average rate of 11% year-over-year. High-spending players drive growth in Korea and Japan, adding an additional $65MM in revenue by year’s end with popular titles like Diablo III and StarCraft II.
Digital PC struggles with China’s free-to-play culture. Digital PC games in China are mostly overlooked in favor of free-to-play MMOs, which earn 25 times the revenue with an audience 12 times larger.
Developers are localizing in China by customizing platforms and payment schemes to the market. Console franchises like Call of Duty, and NBA 2K are being adapted as free-to-play PC games to capitalize on China’s massive but low-spending player base.*
20142015E2016E2017E $991
$914$895
$781
Asia digital PC games monthly unique users (mil)
Asia digital PC games revenue ($mil)
20142015E2016E2017E 36
3431
29
Digital Games Spending in Asia, 2015 | Copyright © 2015 SuperData Research and Worldpay. All rights reserved. | www.superdataresearch.com | www.worldpay.com/videogames
*Chris Morris, “Why China Allowing Gaming Consoles Won’t Help Game Makers," CNBC, Feb. 2, 2013 (http://www.cnbc.com/id/100427839)

Playing & Spending Behavior

14
Chinese PC spenders make less than half the income of their Korean and Japanese counterparts. Adjusted for purchasing power, the average income in China is one fifth the income in the U.S.* Despite their lower spending power, Chinese players have access to new PC games due to the popularity of internet cafés.
Half of Korean PC spenders are women. Korea’s long history of PC gaming has made it a mainstream activity across genders. Alternatively, roughly a third of PC spenders in China and Japan are women.
Paying PC gamers in Japan are older and more affluent than those in Korea or China. Younger players in Japan gravitate toward mobile and handheld gaming while players who grew up playing on PCs are more likely to be payers on the platform.
females 50%
males 50%
South Korea
Average age
Average income
$30,659
33
China
Average age
Average income
$14,867
34females 36%
males 64%
females 34%
males 66%
Japan
Average age
Average income
$38,359
40
Demographics of PC spenders PC payers in China have the lowest spending power
*Purchasing Power Parity Gross Domestic Product Per Capita (American Enterprise Institute)
Digital Games Spending in Asia, 2015 | Copyright © 2015 SuperData Research and Worldpay. All rights reserved. | www.superdataresearch.com | www.worldpay.com/videogames

15
S. Korea
More than a quarter of spenders in Japan prefer action-adventure games.MMOs lead the PC market in China and Korea
MMOs are the most preferred genre in China and Korea. Almost 30% of Korean payers prefer MMOs while in China roughly 40% favor the genre. Free-to-play MMOs such as League of Legends appeal particularly to low-spending Chinese players because of their low barrier to entry.
Nearly half of spenders in Japan prefer action-adventure and role-playing games. These two genres are popular on consoles, a platform that has a rich history in Japan. Thus, Resident Evil Revelations 2 and other successful PC games in the region are those primarily intended for the console audience.
Q: In the past 3 months, in which of the following PC/Mac game genres did you make the MOST online purchases for digital content?
Genre preference for PC spenders
China Japan
MMO/MMOG28%
Ac1on-‐ Adventure
14%First-‐person shooter11%
Role-‐playing12%
Simula1on10%
Other26%
MMO/MMOG39%
Ac1on-‐ Adventure
15%
First-‐person shooter11%
Role-‐playing11%
Racing7%
Other16%
MMO/MMOG
27%
Ac1on-‐ Adventure
18%17%Role-‐playing
8%
Collec1ble card6%
Other24%
Simula1on
Digital Games Spending in Asia, 2015 | Copyright © 2015 SuperData Research and Worldpay. All rights reserved. | www.superdataresearch.com | www.worldpay.com/videogames

Korean and Japanese players are almost twice as likely as those in China to purchase free-to-play MMO content. Only 7% of Chinese players pay, and they are unlikely to stick with games that have restrictive paywalls due to their lower purchasing power and the plethora of free games from which they can choose.
Korean and Japanese payers spend nearly double that of their Chinese counterparts. Monthly spending in Japan and Korea is almost $30 for free-to-play MMOs. Despite having a combined audience that accounts for less than 40% of China’s user base, their joint revenue is equal to that of China.
Chinese spending increases with growing spending power and market maturation. A 7% increase in disposable income over the past year* helps boost spending in free-to-play MMOs by 12% year-over-year. China’s market still shows a high potential for growth as opposed to more mature markets like the U.S. and Western Europe, where spending growth is less than 10%.†
16
Free-to-play MMO spending, 2015E
On the other hand, Chinese players spend roughly half that of their Asian counterparts.F2P MMO spending nears $30 in Japan and Korea
12.1%
11.8%
7.0%CN
JP
KR
Conversion Average revenue per paying user (ARPPU)
$29.18
$29.73
$17.79CN
JP
KR
*China Bureau of Statistics †SuperData Research
Digital Games Spending in Asia, 2015 | Copyright © 2015 SuperData Research and Worldpay. All rights reserved. | www.superdataresearch.com | www.worldpay.com/videogames

17
Japanese spenders pay up to two times more for subscriptions than spenders in China and Korea. In Korea and China, subscribers can pay hourly instead of monthly, so casual players pull down average spending figures. However, even Japanese players spend less on subscription fees than their counterparts in the U.S. and Western Europe, where the average is roughly $15.
Only 1 in 10 Korean and Japanese players pays for additional content in subscription MMOs. Players in these regions are more than 30% likelier to buy additional content than those in China due to their higher spending power.
Subscription MMO spending, 2015E
Japanese spenders pay the most for both subscription fees and additional content.Subscription MMO spending is highest in Japan
$8.70
$10.92
$5.37
Average monthly spending on subscription fees
CNJPKR
Additional content ARPPU
$14.84$16.15
$12.07CNJPKR
CN
JP
KR
Additional content conversion
11.8%11.4%
8.2%
Digital Games Spending in Asia, 2015 | Copyright © 2015 SuperData Research and Worldpay. All rights reserved. | www.superdataresearch.com | www.worldpay.com/videogames

CNJPKR
18
Additional content ARPPU for premium games is more than 30% higher in Korea and Japan than in China. Full-game ARPPU is over $33 in all three countries, but payers in Korea and Japan spend roughly $10 more than Chinese payers on additional content each month.
Premium games still have difficulty enticing players to purchase content after their initial full game purchase. After buying a full game upfront, less than 3% of players in the region purchase additional content.
Digital PC full game spending, 2015E
Players in Korea and Japan are over six times more likely to buy full games.Chinese gamers rarely pay for PC games upfront
CNJPKR
Additional content conversion
6.0%7.1%
0.6%
Additional content ARPPU
$23.12$26.92
$15.58
Digital PC additional content spending, 2015E
CNJPKR
Full game conversion
9.4%10.5%
1.5%CNJPKR
Full game ARPPU
$36.09$37.20
$33.49
Less than 2% of Chinese PC players buy digital PC games. Unlike in Korea and Japan, premium games (games purchased upfront) have never been mainstream in China. Therefore, the Chinese addressable audience has already moved on to game types with a lower barrier to entry.
Full game conversion in Japan and Korea is comparable to mature western markets. Full game conversion in most western markets vacillates between 8% and 10%, putting Japan and Korea on par with mature markets like the U.S. and the U.K.
Digital Games Spending in Asia, 2015 | Copyright © 2015 SuperData Research and Worldpay. All rights reserved. | www.superdataresearch.com | www.worldpay.com/videogames

Monetization & Payment Preference

20Q: Rank the following PC/Mac game digital billing types in order of preference.
F2P P2P Premium
PC game billing method preference
China Japan S. Korea
16%17%
67%
22%19%
59%
24%21%
55%
PC spenders in China most strongly prefer the free-to-play billing model. Chinese payers are 14% more likely than Koreans and 23% more likely than Japanese to favor free-to-play PC games thanks to the flexible spending they offer.
F2P P2P Premium F2P P2P Premium
Digital Games Spending in Asia, 2015 | Copyright © 2015 SuperData Research and Worldpay. All rights reserved. | www.superdataresearch.com | www.worldpay.com/videogames

21Q: In the past 3 months, once you purchased digital content in ANY PC/Mac game, how often did you make another purchase in that same game?
Likelihood of repeat purchases in a single gameAlways Often Sometimes Rarely Never
6%22%46%25%2%
29%39%22%6%4%
15%27%49%7%3%
China
Japan
S. Korea
More than two-thirds of Japanese spenders rarely or never buy content more than once in the same game. Japanese spenders show a preference for upfront spending as they are the most likely to favor premium games. After making their first purchase, Chinese spenders are almost three times likelier than those in Japan or Korea to make continue making purchases in the same game. China’s strong preference for free-to-play means payers often make cheap, but frequent, in-game purchases.
Digital Games Spending in Asia, 2015 | Copyright © 2015 SuperData Research and Worldpay. All rights reserved. | www.superdataresearch.com | www.worldpay.com/videogames
Despite being least likely to spend, a quarter of Chinese payers often spend more after the first purchase.Chinese are likeliest to make repeat purchases

22
Reasons PC spenders prefer free-to-play
Almost half of Chinese and Korean spenders use F2P’s low barrier to entry to recruit friends.F2P payers prioritize flexible spending & social play
25%38%41%
66%
21%36%
13%
68%
41%41%45%56%
ChinaJapanKorea
Choosing how much to spend
No spending commitment
Ease of getting friends to play
Selection of purchasable items
The majority of spenders in all three markets enjoy the ability to control their spending with free-to-play. For those willing to make in-game purchases, free-to-play games offer a highly customizable experience.
A low barrier to entry for friends is a benefit of free-to-play for almost half of Chinese and Korean spenders. Free-to-play billing lets payers in these countries easily recruit friends to join them in multiplayer PC games. The ease of social play increases the perceived value of a game and creates an incentive to engage with a single game longer.
Two out of five Chinese spenders prefer free-to-play games because they can choose to play without spending. Chinese spenders are over 60% more likely to prefer free-to-play for its lack of a spending commitment than their Japanese and Korean counterparts. Q: Why do you prefer a FREE-TO-PLAY billing model for the PC/Mac genres you selected above?
Digital Games Spending in Asia, 2015 | Copyright © 2015 SuperData Research and Worldpay. All rights reserved. | www.superdataresearch.com | www.worldpay.com/videogames

23
Reasons PC spenders prefer subscriptions
More than half of spenders who prefer P2P or premium games want to pay upfront.Fixed costs attract subscription & premium payers
16%30%
50%53%
12%24%
42%49%
19%
45%55%60%
China Japan Korea
Knowing monthly costs
Q: Why do you prefer a SUBSCRIPTION billing model for the PC/Mac genres you selected above? | Q: Why do you prefer a PREMIUM billing model for the PC/Mac genres you selected above?
Reasons PC spenders prefer premium billing
Ability to stop paying
Full game access
No ads
20%
41%
77%
16%
38%
64%
16%
52%
74%
Paying once for full game access
Knowing cost of full game access
No ads
Predictable monthly costs are the biggest draw for subscription games. Chinese payers are over 10% more likely than those in Japan or Korea to prefer pay-to-play since subscription fees are easier to budget in advance than free-to-play spending.
Roughly seven out of ten spenders who prefer the premium billing model look to avoid in-game charges. Premium games have the lowest additional content conversion rates as most premium players only want to pay for a game once.
Digital Games Spending in Asia, 2015 | Copyright © 2015 SuperData Research and Worldpay. All rights reserved. | www.superdataresearch.com | www.worldpay.com/videogames

Alipay UPI Bank VISA Debit Alipay VISA Bank UPI Debit Alipay UPI VISA Bank Debit
24
Alipay’s localized payment platform is a long-trusted brand amongst Chinese spenders.Roughly 60% of Chinese PC spenders prefer Alipay
5%6%7%8%
61%
7%7%8%8%
57%
5%7%8%8%
56%
Over half of PC spenders in China prefer local mainstay Alipay over global alternatives. Alibaba’s Alipay offers no transaction fees, convenience and localization to Chinese spenders. The ewallet’s omnipresence in China means merchants who do not offer it lose out on more than half of potential spenders. Tencent fails to find the same success for its payment method as it does for online games. Tencent’s rival to Alipay, Tenpay, is not one of China’s five most popular payment methods for PC games even though Tencent operates several of China’s biggest games.
Q: In the past 3 months, what payment method did you use MOST to make purchases in FREE-TO-PLAY/SUBSCRIPTION/FULL PC/Mac games?
Payment brand preferences in China
CardTransferCardTransferCardTransfer
Free-to-play vs. Subscription vs. Premium
Digital Games Spending in Asia, 2015 | Copyright © 2015 SuperData Research and Worldpay. All rights reserved. | www.superdataresearch.com | www.worldpay.com/videogames

Reasons for Chinese PC spender payment preferences
25Q: Why did you use the payment method you used MOST when making purchases in FREE-TO-PLAY SUBSCRIPTION-BASED PC/Mac games?
Three quarters of Chinese spenders choose their preferred payment method for its convenience. Mobile eWallets like Alipay provide a convenient and trusted payment method for spenders who play games in public Internet cafés.
12%12%
25%28%
73%
15%13%
25%27%
75%
11%14%
32%30%
75% Free-to-playSubscriptionPremium
Most convenient
Most secure Preferred for all game
purchases
No other payment methods offered
Only payment method
available to user
Digital Games Spending in Asia, 2015 | Copyright © 2015 SuperData Research and Worldpay. All rights reserved. | www.superdataresearch.com | www.worldpay.com/videogames

VISA JCB Bank MasterCard Debit VISA JCB Bank MasterCard Debit VISA JCB Bank MasterCard Debit
26
Over 60% of spenders favor credit cards, with VISA and JCB securing top spots.Credit cards overtake Japanese payment preference
4%6%12%15%
44%
5%8%10%16%
44%
4%8%13%18%
44%
Q: In the past 3 months, what payment method did you use MOST to make purchases in FREE-TO-PLAY/SUBSCRIPTION/FULL PC/Mac games?
Payment brand preferences in Japan
CardTransferCardTransferCardTransfer
Free-to-play vs. Subscription vs. Premium
Cash on delivery services like konbini (convenience store) payments account for close to 40% of some Worldpay merchants’ e-transactions. Konbini is a payment method wherein consumers pay their online transactions at a convenience store and, once payment is confirmed, their goods are shipped or released. While global credit card VISA is preferred by two out of five spenders, local card JCB captures almost a quarter of spender preferences. JCB is the only local credit card to gain popularity with more than 10% of spenders. Bank transfers still take hold of over a tenth of spenders’ preferred methods. Bank transfers are the most popular non-credit card payment method but are being edged out by the popularity of credit cards.
12% of e-transactions in
Japan are done through konbini
payments.
Digital Games Spending in Asia, 2015 | Copyright © 2015 SuperData Research and Worldpay. All rights reserved. | www.superdataresearch.com | www.worldpay.com/videogames

27Q: Why did you use the payment method you used MOST when making purchases in FREE-TO-PLAY SUBSCRIPTION-BASED PC/Mac games?
9%13%
17%
31%
52%
11%8%
19%
26%
56%
9%9%
18%
30%
56%
Free-to-playSubscriptionPremium
Most convenient
Most securePreferred for all game
purchases
No other payment methods offered
Only payment method
available to user
More than a quarter of Japanese spenders use the same payment method for all gaming purchases. While convenience plays an important role when it comes to payment preference, almost a third of Japanese spenders stick with just one payment method.
Reasons for Japanese PC spender payment preferences
Digital Games Spending in Asia, 2015 | Copyright © 2015 SuperData Research and Worldpay. All rights reserved. | www.superdataresearch.com | www.worldpay.com/videogames
VISA Local Bank BC Mobile VISA Local Bank BC MasterCard VISA Local Bank MasterCard BC
28
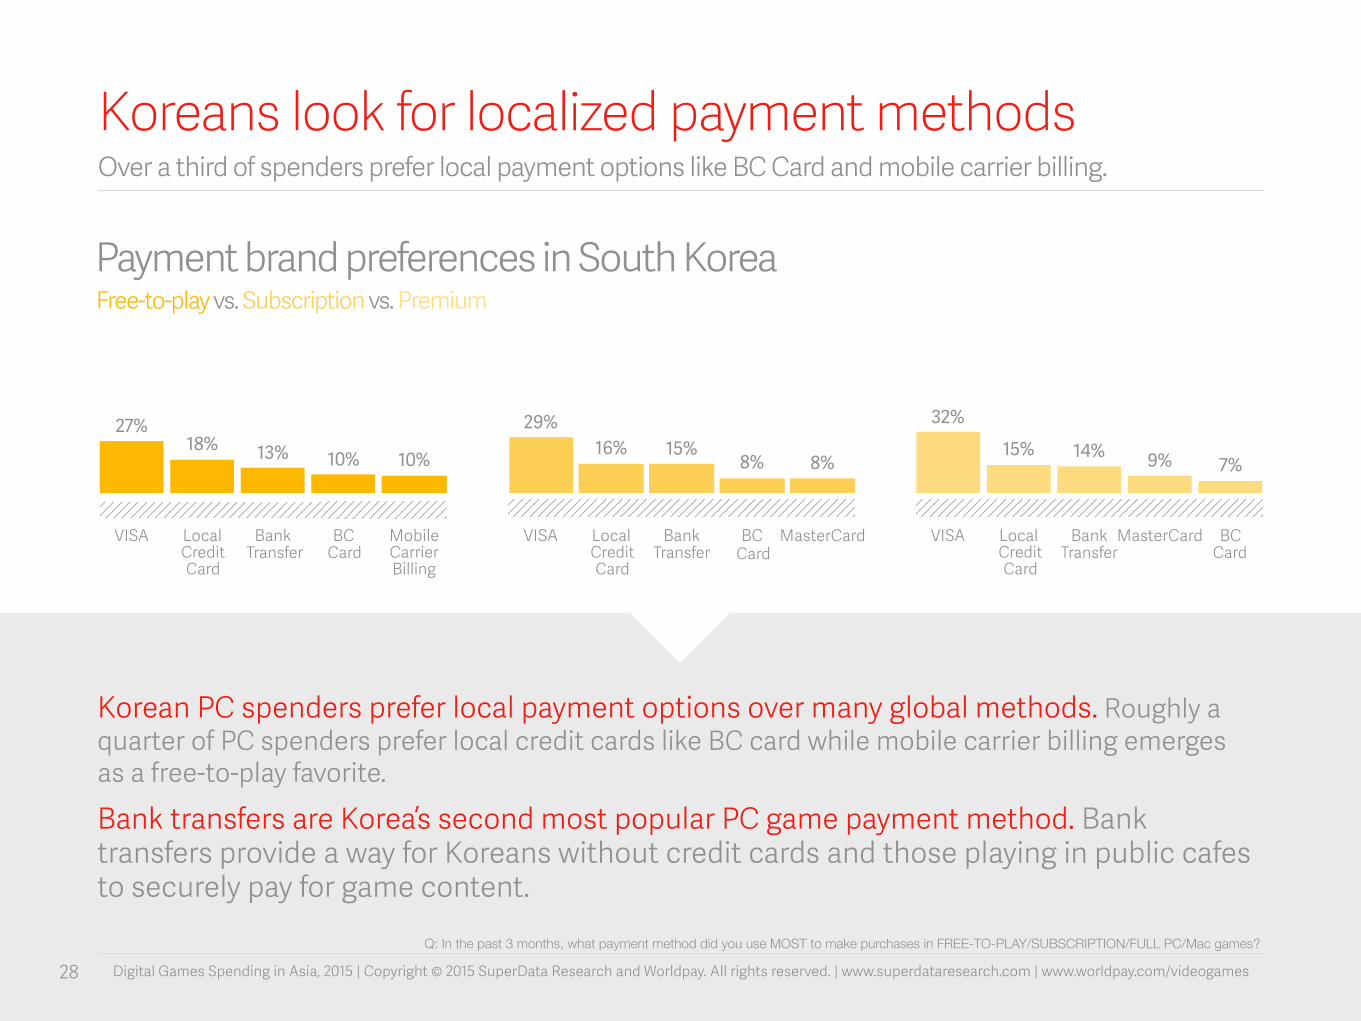
Over a third of spenders prefer local payment options like BC Card and mobile carrier billing.Koreans look for localized payment methods
10%10%13%18%27%
8%8%15%16%
29%
7%9%14%15%32%
Q: In the past 3 months, what payment method did you use MOST to make purchases in FREE-TO-PLAY/SUBSCRIPTION/FULL PC/Mac games?
Payment brand preferences in South Korea
CardTransferTransferTransfer
Free-to-play vs. Subscription vs. Premium
Credit Card
Credit Card
CardCredit Card
Card Carrier Billing
Korean PC spenders prefer local payment options over many global methods. Roughly a quarter of PC spenders prefer local credit cards like BC card while mobile carrier billing emerges as a free-to-play favorite. Bank transfers are Korea’s second most popular PC game payment method. Bank transfers provide a way for Koreans without credit cards and those playing in public cafes to securely pay for game content.
Digital Games Spending in Asia, 2015 | Copyright © 2015 SuperData Research and Worldpay. All rights reserved. | www.superdataresearch.com | www.worldpay.com/videogames

29Q: Why did you use the payment method you used MOST when making purchases in FREE-TO-PLAY SUBSCRIPTION-BASED PC/Mac games?
11%
16%17%18%
60%
11%
16%17%
21%
69%
11%13%
15%18%
71%Free-to-playSubscriptionPremium
Most convenient
Most secure Preferred for all game
purchases
No other payment methods offered
Only payment method
available to user
Reasons for Korean PC spender payment preferences
Free-to-play and subscription spenders are over 10% more likely than premium spenders to choose a payment option for its convenience. These spenders buy in-game content more often than premium spenders and care more about easy-to-use checkouts.
Digital Games Spending in Asia, 2015 | Copyright © 2015 SuperData Research and Worldpay. All rights reserved. | www.superdataresearch.com | www.worldpay.com/videogames

30
Reasons PC spenders do not complete purchases
Roughly a quarter of spenders abandon purchases due to security fears.Long or non-secure checkouts lose PC sales
5%12%11%17%19%
26%29%
7%3%7%11%20%
13%24%
6%7%14%14%25%30%31%
ChinaJapanKorea
Concerns that payment info is
not secure
Q: Have there ever been instances when you have not completed a purchase for digital gaming content due to issues with the payment process? If so, what were the issues?
Too many checkout steps
Checkout system
complexity
Prices in foreign currency
Preferred payment method not
accepted
Pop-up ads Poor checkout site appearance
Security concerns are the chief reason for incomplete checkouts. Roughly 3 out of 10 spenders in Korea and China leave a checkout if it is not clear their payment information will be secure. The prevalence of Internet cafes means more than a third of Korean and Chinese PC spenders are turned off by long checkout processes. Alternatively, Japanese spenders are less deterred by the number of checkout steps and more concerned with how difficult the checkout process is to understand. Almost a fifth of Koreans abandon checkouts without localized pricing. Korean PC spenders are roughly 20% more likely than Chinese spenders and over 50% more likely than Japanese spenders to leave a checkout due to foreign pricing.
Digital Games Spending in Asia, 2015 | Copyright © 2015 SuperData Research and Worldpay. All rights reserved. | www.superdataresearch.com | www.worldpay.com/videogames

31Q: What would make you more likely to purchase digital gaming content for your PC?
30%34%
63%
43%
27%
35%
27%
46%
65%
ChinaJapanS. Korea
More items/games worth purchasing
Reasons PC spenders would make more purchases
Easier checkout process
More payment options
Content is king for spenders in China and South Korea. More than 60% of payers in these markets would increase their purchases if there was more game content worth buying. Easier checkout processes would entice almost half of Chinese payers to spend more. While many Chinese players still spend despite complications, nearly a third say they have abandoned checkouts that are too complicated due to things like website re-directs or unclear digital to real-life currency conversions. Forty-three percent (43%) of Japanese spenders point to more varied payment options as a way to purchase more. More than a quarter of Japanese spenders favor using one payment method for all game purchases, so if their preferred payment method is not available, they are less likely to spend.
Digital Games Spending in Asia, 2015 | Copyright © 2015 SuperData Research and Worldpay. All rights reserved. | www.superdataresearch.com | www.worldpay.com/videogames

Executive Summary
32
Convenience is key for converting Chinese players who depend on localized payments. Merchants can lose roughly a third of potential consumers due to lack of payment convenience in China. Worldpay has developed a partnership with Alipay, the most popular payment brand amongst PC spenders, that is already helping major game companies enter the market. Offering Alipay can facilitate payment convenience for over 50% of a merchants’ potential users.
Localizing for South Korea or China may not work for players in Japan. Japanese players are unique in Asia since they tend to spend more and have a higher acceptance of subscription and premium billing models than their Korean and Chinese counterparts. The maturity of Japan’s digital games market has placed a high importance on the availability of local and alternative payment options. Cash-based payments like Konbini and bank transfers are popular in the country, along with local card schemes like JCB, making it essential for merchants to work with a partner that has nurtured a relationship with these payment types. Worldpay has a local acquiring presence in the market and long-standing relationships with JCB, VISA and Konbini. Since more than a quarter of gamers us the same method for every purchase, providing consumers their payment method of choice can secure higher conversion rates.
It can be a challenge to cater to the varied payment preferences of Korean players. As with China, Korean players are accustomed to the free-to-play billing model. Thus, it is vital to offer an array of local and alternative payment methods while providing a convenient way for consumers to make smaller impulse purchases. In an environment like this it is ever-important to work with an experienced payments parter in order to build a localized strategy.
To find out more about Worldpay’s capabilities in Asia, head to worldpay.com/dropusaline.
Asia cannot be treated as one market; each country has distinct preferences across payments and billing models and should be nurtured with this in mind.
Digital Games Spending in Asia, 2015 | Copyright © 2015 SuperData Research and Worldpay. All rights reserved. | www.superdataresearch.com | www.worldpay.com/videogames

Everything Else

Terminology
34
Additional Content: Downloadable add-ons available for purchase after the original installation of a full game, including map packs, expansions, premium content, vanity items, in-game currency, etc.
Average Revenue Per Paying User (ARPPU): The average revenue generated by a paying user within a particular month.
• Additional Content Revenue: Defined as: MUU x Additional Content Conversion x Additional Content ARPAverage Revenue Per Paying User (ARPPU): The average revenue generated by a paying user within a particular month.
• Additional Content ARPPU refers to the average additional content revenue generated by a paying monthly active user within a particular month.
• Microtransaction ARPPU refers to the average microtransaction revenue generated by a paying monthly active user within a particular month.
Conversion Rate: The percentage or rate of monthly active users who have shifted from non-paying to paying users.
• Additional Content Conversion Rate refers to the percentage of monthly active users who have made at least one additional content purchase within a particular month.
• Microtransaction Conversion Rate refers to the percentage of monthly active users who have made at least one in-game microtransaction purchase within a particular month.
Digital games: Games and additional content downloaded and played on a digitally-capable device such as a smartphone, tablet, PC/Mac, console or handheld gaming device. This does not include physical copies of games.
Downloadable Content: Refers to both full game downloads and additional content downloads. The two major channels of distribution are Console and PC. Defined as the sum: Full Game Downloads + Additional Content Downloads.
Digital Games Spending in Asia, 2015 | Copyright © 2015 SuperData Research and Worldpay. All rights reserved. | www.superdataresearch.com | www.worldpay.com/videogames

Terminology, cont’d
35
Free-to-Play/Freemium (F2P): Offering a game, product or service free of charge (such as software, web services or other) while charging a premium for advanced features, functionality, or related products like virtual goods and services.
Full game: A base game that is purchased and/or installed, not including any additional content or in-game items that are purchasable and/or downloadable after the initial installation.
In-Game Purchase: The purchase of virtual goods within a game after its initial installation.
Microtransactions: Small in-game purchases of economy-based downloadable content, such as in-game currency, vanity items, weapons, songs, vehicles and class unlocks.
Mobile: Games played on smart mobile devices such as smartphones and tablets that are strictly not played on a social networking platform. These games are purchased and/or downloaded through an app store and earn digital revenue from one-off app purchases and in-game purchases. Does not include Social Mobile Data.
Monthly Average Users (MAU): The number of users who log in and play a game at least once over the course of a month, including trial and free users. Users can be counted more than once within a particular game if they log in through multiple accounts, or within a particular genre/category if they log into multiple games.
Monthly Unique Users (MUU): The number of unique users who log in and play a game at least once over the course of a month, including trial and free users. Multiple account users and multiple game users are adjusted to prevent counting unique individuals more than once.
Pay-to-Play (P2P): Requiring a purchase or subscription in order to gain full access to a game, product or service, while sometimes also charging a premium for virtual goods or additional content.
Platform: A specific combination of hardware and software in order to play a certain game category. E.g., console, PC, smartphone, handheld gaming device, etc.
Digital Games Spending in Asia, 2015 | Copyright © 2015 SuperData Research and Worldpay. All rights reserved. | www.superdataresearch.com | www.worldpay.com/videogames

Terminology, cont’d
36
Revenue (category or genre definition): Defined as: MAU or MUU x Conversion x ARPPU. The sum of revenue generated by full-game sales and/or in-game purchases.
• Additional Content Revenue: Defined as: MUU x Additional Content Conversion x Additional Content ARPPU. Total digital sale of map packs, expansions, premium content, and vanity items.
• Digital Revenue: Defined as the sum of all Full Game Revenue, Microtransaction Revenue, Subscription Revenue, and Additional Content Revenue, each where applicable. Revenue generated from downloadable content.
• Full Game Revenue: Revenue generated from the sale and delivery of a base game. Does not include Additional Content/Microtransaction revenue.
• Microtransaction Revenue: Defined as: MUU or MAU x Microtransaction Conversion Rate x Microtransaction ARPPU.
• Subscription Revenue: Defined as: Subscriptions x Average Subscription Fee. Revenue generated from digital subscription fees.
Segment: A game category that has requirements unique to other categories. E.g., Social, Mobile, MMO, PC, Console, etc.
Virtual Goods: In-game items or game-related services, such as a virtual currency or temporary subscriptions that enable or enhance game play.
Digital Games Spending in Asia, 2015 | Copyright © 2015 SuperData Research and Worldpay. All rights reserved. | www.superdataresearch.com | www.worldpay.com/videogames

Payment Methods
37
Bank Transfer refer to both online (real-time) and offline bank transfers. Online (real-time) bank transfers send payment instantly from a users bank account to the receiver. Offline bank transfers require the payer to generate an invoice online with a unique barcode, present the invoice to a bank in-person or online and pay the invoice in full. It can take several days for payment to be confirmed and goods to be released.
Cash on Delivery services are similar to offline bank transfers in that they allow the user to generate an invoice and pay for goods at a specified location like a convenience store. Goods are rendered upon confirmation that the merchant has received payment. E.g., Konbini.
Credit Cards allow cardholders to pay for goods with a credit line provided by a financial institution with the promise that they will reimburse the institution, often with interest, for their purchases. E.g., VISA, MasterCard, American Express.
Debit Cards are used like credit cards but take funds from the user’s bank account instead of a credit line and do not accrue interest.
Ewallets allow users to store their payment information for a variety of methods, including credit cards, debit cards, and bank transfers. E.g., Alipay.
Local Credit Cards generally service residents of the country where their financial institutions are based. E.g., JCB, UPI (China UnionPay), BC Card.
Mobile Carrier Billing services make a payment for goods on behalf of the consumer and then places the charge on the consumer’s phone bill. E.g., Boku, Mopay
Digital Games Spending in Asia, 2015 | Copyright © 2015 SuperData Research and Worldpay. All rights reserved. | www.superdataresearch.com | www.worldpay.com/videogames

Devices
38
Console: A device that connects to a television in order to allow for video gameplay. Newer generations of consoles (2005 and after) allow for media consumption outside of video games such as downloaded and streaming television, movies and music. E.g., Nintendo Entertainment System (NES), Sega Genesis, PlayStation, Xbox One, Xbox 360, PS4, Wii U.
Feature phone: Mobile phones that have more features than a standard call and text capable mobile but less features than a smartphone. Less expensive than smartphones but have limited third party application integration.
Handheld gaming device/console: A dedicated handheld gaming device that is portable and has a built-in screen, controller and audio output. E.g., GameBoy, PlayStation Portable, Nintendo 3DS, NVIDIA SHIELD portable.
PC/Mac: A desktop or laptop computer with the capabilities to install and run video games.
Smartphone: Mobile phones with computer-enabled features such as data storage, high-speed Internet access, media playback, and email capabilities. Support third party application integration. E.g., iPhone, Samsung Galaxy, HTC, Nokia Lumia, Amazon Fire Phone.
Tablet: Portable devices that combine the capabilities of a smartphone and a laptop while being larger than the former but smaller than the latter. Support third party application integration. E.g., iPad, Samsung Galaxy Tab, Microsoft Surface, Kindle Fire.
Digital Games Spending in Asia, 2015 | Copyright © 2015 SuperData Research and Worldpay. All rights reserved. | www.superdataresearch.com | www.worldpay.com/videogames

Geographies
39
Asia: China, India, Indonesia, Japan, Philippines, Saudi Arabia, South Korea, Thailand, United Arab Emirates and Vietnam.
Europe: Austria, Belarus, Belgium, Bulgaria, Czech Republic, Denmark, Estonia, Finland, France, Germany, Greece, Hungary, Iceland, Ireland, Italy, Latvia, Lithuania, Luxembourg, Monaco, Netherlands, Norway, Poland, Portugal, Romania, Russia, Serbia. Slovakia, Spain, Sweden, Switzerland, Turkey, Ukraine and the United Kingdom.
Latin America: Argentina, Bolivia, Brazil, Chile, Colombia, Costa Rica, Cuba, Dominican Republic, Ecuador, El Salvador, French Guyana, Guatemala, Guyana, Mexico, Nicaragua, Panama, Paraguay, Peru, Puerto Rico, Suriname, Uruguay and Venezuela.
North America: Canada and the United States.
Rest of World: Oceania and Africa.
Digital Games Spending in Asia, 2015 | Copyright © 2015 SuperData Research and Worldpay. All rights reserved. | www.superdataresearch.com | www.worldpay.com/videogames

About us
40
Worldpay are one of world’s leading payment processing companies, powering ecommerce across the globe. Working with innovative high growth start-ups to massive multi-national enterprises, we help optimise their payments and support them as they expand globally. We have the experience needed to deliver useful insights through our analytics, to help you choose the right payment mix and setup when moving into new markets or optimising existing ones, and do this with dedicated support and a collaborative work process.
To find out more about Worldpay, head to worldpay.com/videogames, or get in touch at worldpay.com/dropusaline.
SuperData Research provides market intelligence on the online, digital and mobile games industry. By collecting behavioral data directly from publishers and developers, SuperData identifies key trends, establishes revenue estimates, and analyzes market changes for popular online games, including MMOs, FPS, casino, virtual worlds, mobile and social games.
SuperData publishes industry-relevant key performance indicators. Using our proprietary data set—pulled directly from publishers and developers—on millions of paying digital gamers, we establish monthly benchmarks such as ARPPU, conversion rates, lifetime value, and revenues. Customers use our data to evaluate their performance, identify key growth opportunities, assess revenue potential, optimize their efforts, and better understand their audience’s wants and needs. SuperData’s client base includes brand owners, developers, retailers, publishers, VCs, and payment service providers.
Worldpay and SuperData Research compiled this report. Its findings are based on extensive surveys of PC digital game spenders across China, Japan and South Korea.
Digital Games Spending in Asia, 2015 | Copyright © 2015 SuperData Research and Worldpay. All rights reserved. | www.superdataresearch.com | www.worldpay.com/videogames

©SuperData Research and Worldpay 2015. All rights reserved. This document and its content are proprietary to Worldpay and may not be reproduced, published or resold. The information is provided on an “AS IS” basis for information purposes only and Worldpay makes no warranties of any kind including in relation to the content or suitability. Terms and Conditions apply to all our services. Worldpay (UK) Limited (Company No: 07316500/ FCA No: 530923), Worldpay Limited (Company No: 03424752 / FCA No: 504504), Worldpay AP Limited (Company No: 5593466 / FCA No: 502597). Registered Office: The Walbrook Building, 25 Walbrook, London EC4N 8AF and authorised by the Financial Conduct Authority under the Payment Service Regulations 2009 for the provision of payment services. Worldpay (UK) Limited is authorised and regulated by the Financial Conduct Authority for consumer credit activities. Worldpay, the logo and any associated brand names are all trade marks of the Worldpay group of companies.
Contact us
41
Senior Analyst, Consumer Insights Stephanie Llamas [email protected]
To find out more about Worldpay, head to worldpay.com/videogames, or get in touch at worldpay.com/dropusaline.
For questions about this report: