Embed Size (px)
Citation preview
Using e-Infrastructures for Biodiversity Conservation
Gianpaolo Coro ISTI-CNR, Pisa, Italy
• Geospatial data: description and access• Catalogues• Visualisation• Processing• Processing examples• Use Case: the European Geothermal Information
Platform
Module 2 - Outline
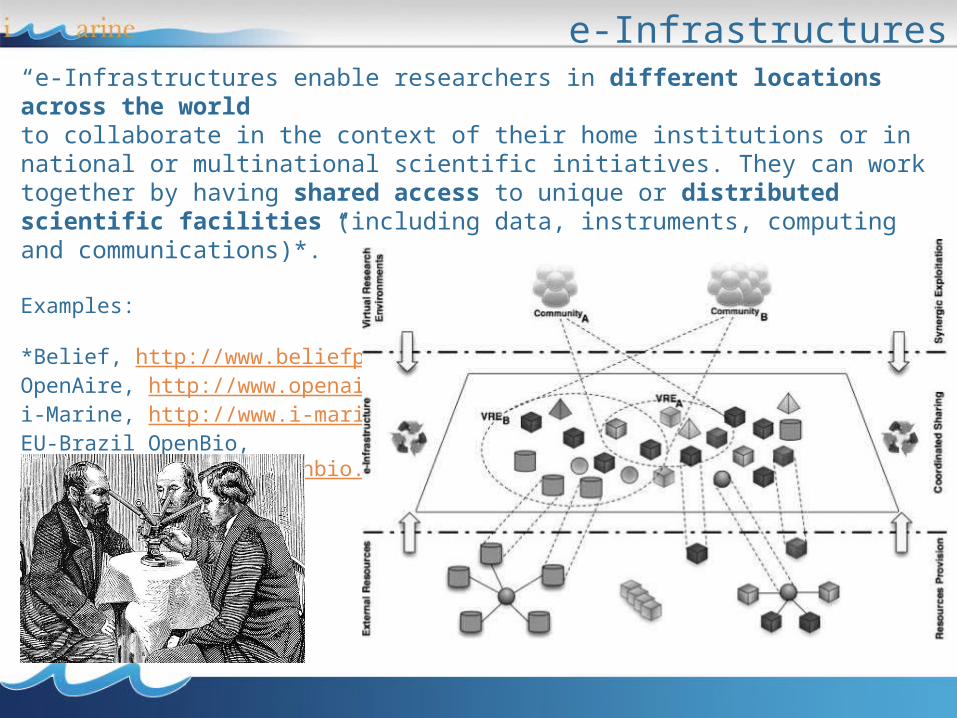
e-Infrastructures“e-Infrastructures enable researchers in different locations across the worldto collaborate in the context of their home institutions or in national or multinational scientific initiatives. They can work together by having shared access to unique or distributed scientific facilities (including data, instruments, computing and communications)*.”
Examples:
*Belief, http://www.beliefproject.org/OpenAire, http://www.openaire.eu/i-Marine, http://www.i-marine.eu/EU-Brazil OpenBio, http://www.eubrazilopenbio.eu/
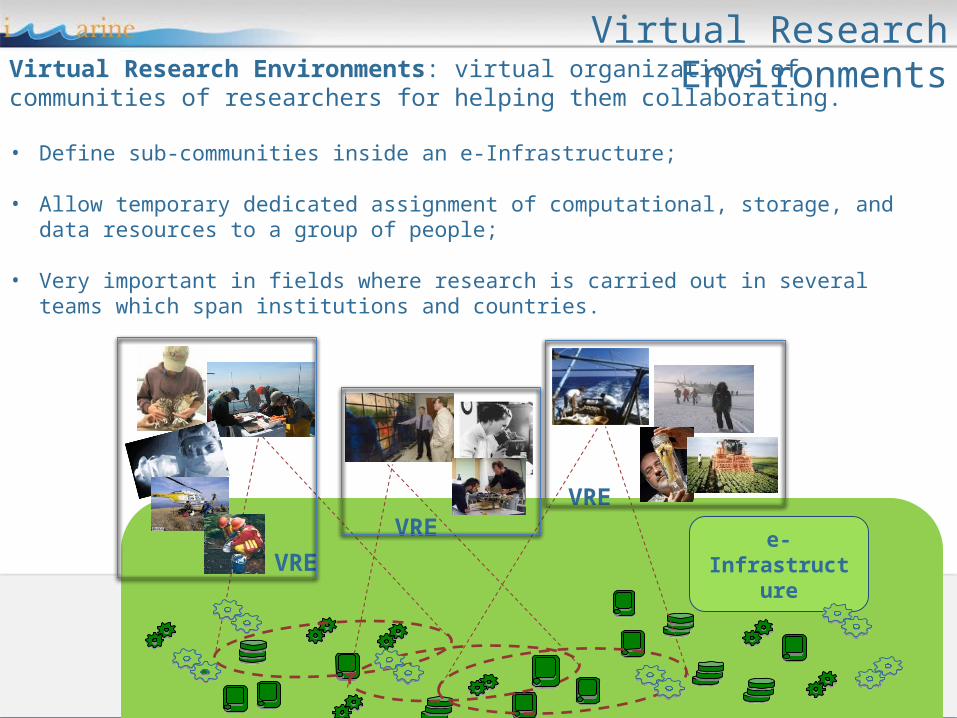
Virtual Research EnvironmentsVirtual Research Environments: virtual organizations of communities of researchers for helping them collaborating.
• Define sub-communities inside an e-Infrastructure;
• Allow temporary dedicated assignment of computational, storage, and data resources to a group of people;
• Very important in fields where research is carried out in several teams which span institutions and countries.
e-InfrastructureVREVRE
VRE
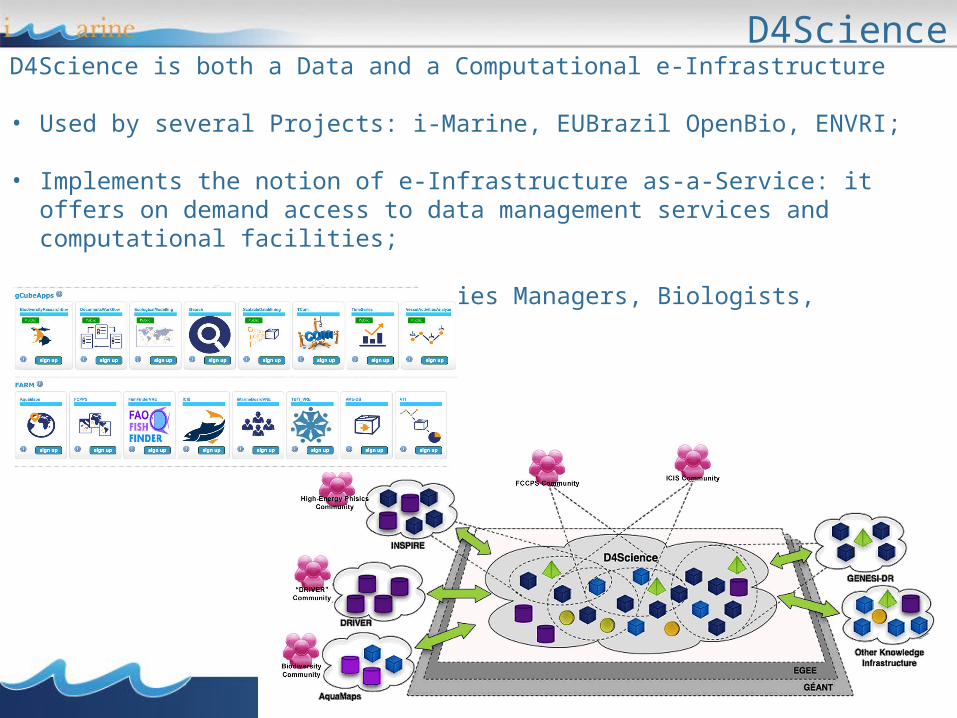
D4ScienceD4Science is both a Data and a Computational e-Infrastructure
• Used by several Projects: i-Marine, EUBrazil OpenBio, ENVRI;
• Implements the notion of e-Infrastructure as-a-Service: it offers on demand access to data management services and computational facilities;
• Hosts several VREs for Fisheries Managers, Biologists, Statisticians…and Students.
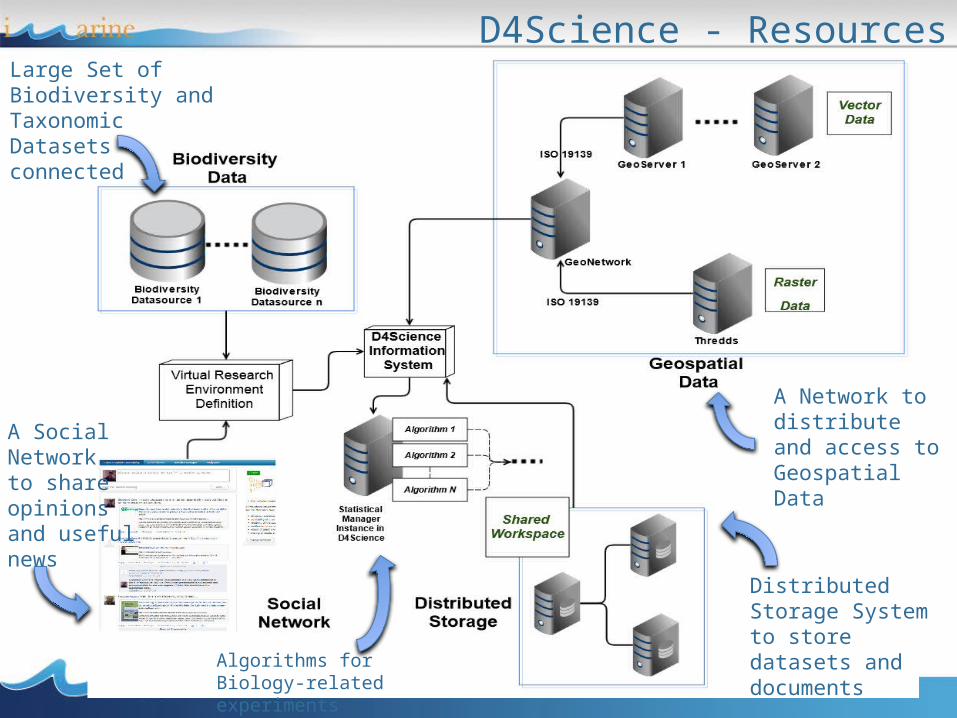
D4Science - ResourcesLarge Set of Biodiversity and Taxonomic Datasets connected
A Network to distribute and access to Geospatial Data
Distributed Storage System to store datasets and documents
A Social Networkto share opinions and useful news
Algorithms for Biology-related experiments
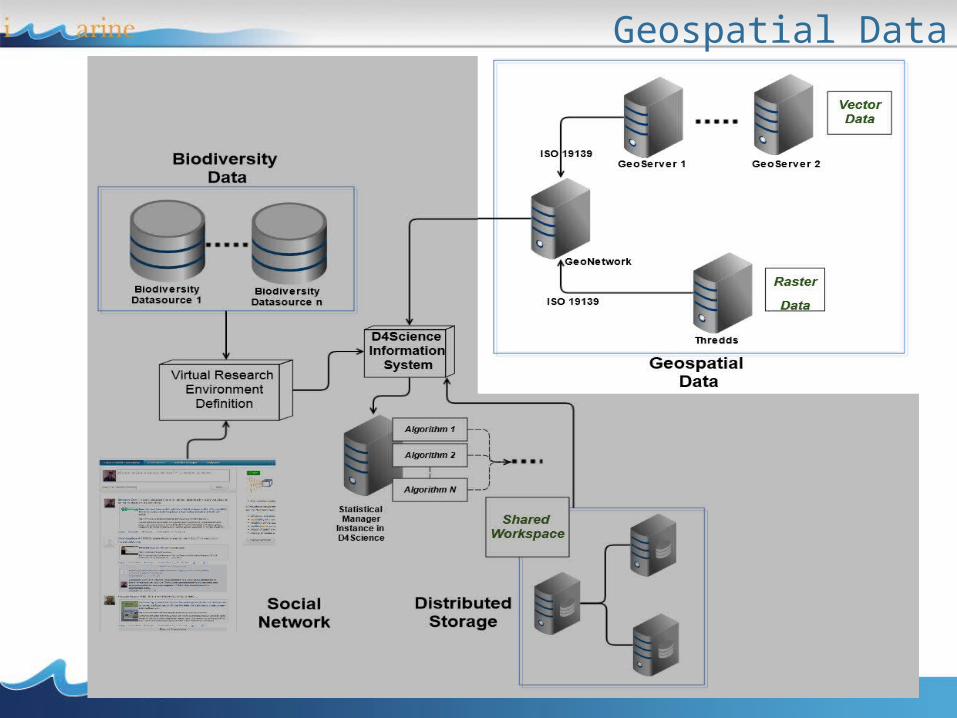
Geospatial Data
• Geospatial data: description and access• Catalogues• Visualisation• Processing• Processing examples• Use Case: the European Geothermal Information
Platform
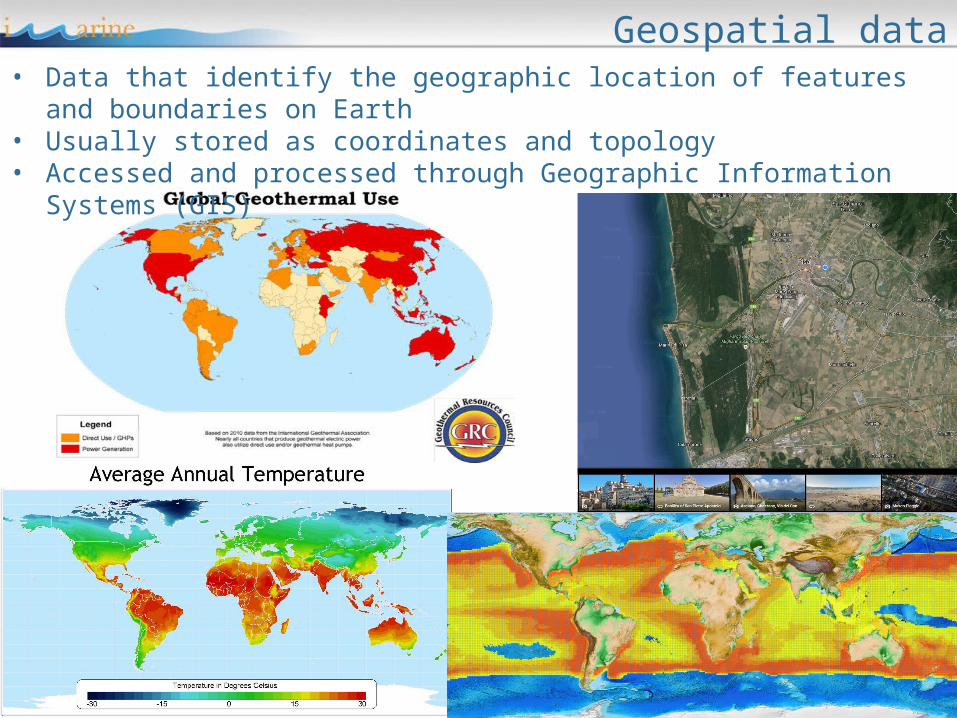
Geospatial data• Data that identify the geographic location of features and boundaries on Earth• Usually stored as coordinates and topology• Accessed and processed through Geographic Information Systems (GIS)
Projections
• Spatial feature need to be referenced to a location:– to permit flexible georeferenced visualization– to permit correct measurements– to permit operations between datasets based on
different reference systems • Spatial reference systems allow defining positions
on the Earth‘s surface• Issue: the Earth is irregular and has spherical shape
Coordinates Systems
• Several solutions are possible as coordinates systems:– Cartesian: coordinate values locate a point in relation to
mutually perpendicular axes– Polar: coordinates locate a point by angular direction(s)
and distance from center. – Spherical: point on surface located by angular
measurements from center (latitude, longitude)
Earth representation
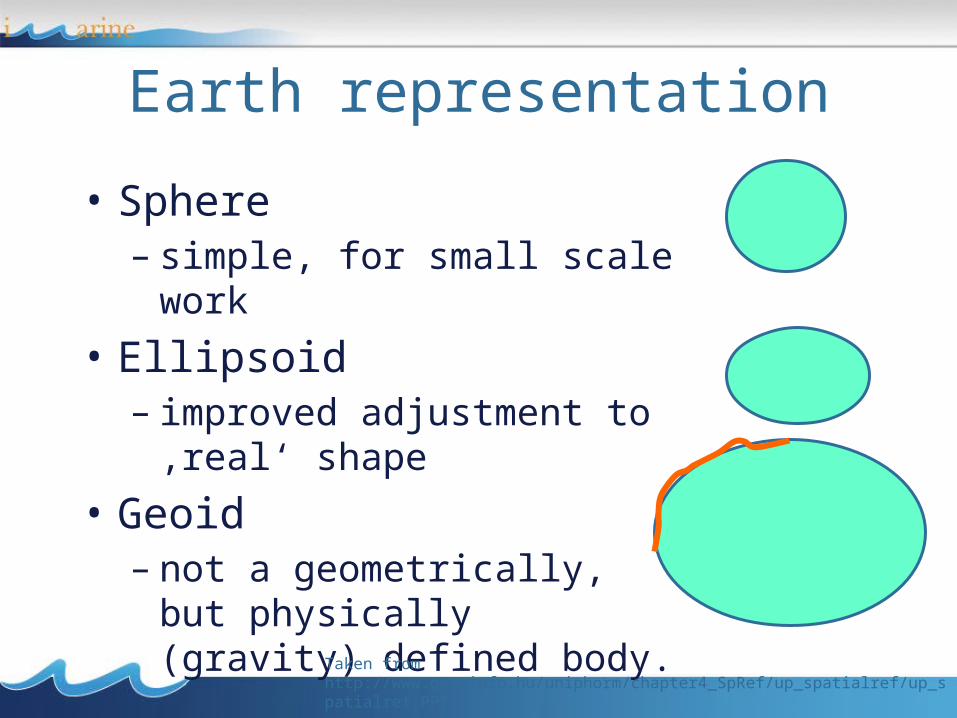
• Sphere – simple, for small scale work
• Ellipsoid– improved adjustment to ‚real‘
shape• Geoid
– not a geometrically, but physically (gravity) defined body.
Taken from http://www.geo.info.hu/uniphorm/chapter4_SpRef/up_spatialref/up_spatialref.PPT
• Coordinate systems are defined by– number of dimensions (1, 2 or 3)– sequence/name of coordinate values (x, y, z)– unit scaling factor and system (meters)– origin of axes– direction of axes
• Coordinate systems can be based on a geodetic reference (datum) and a map projection
Coordinate systems
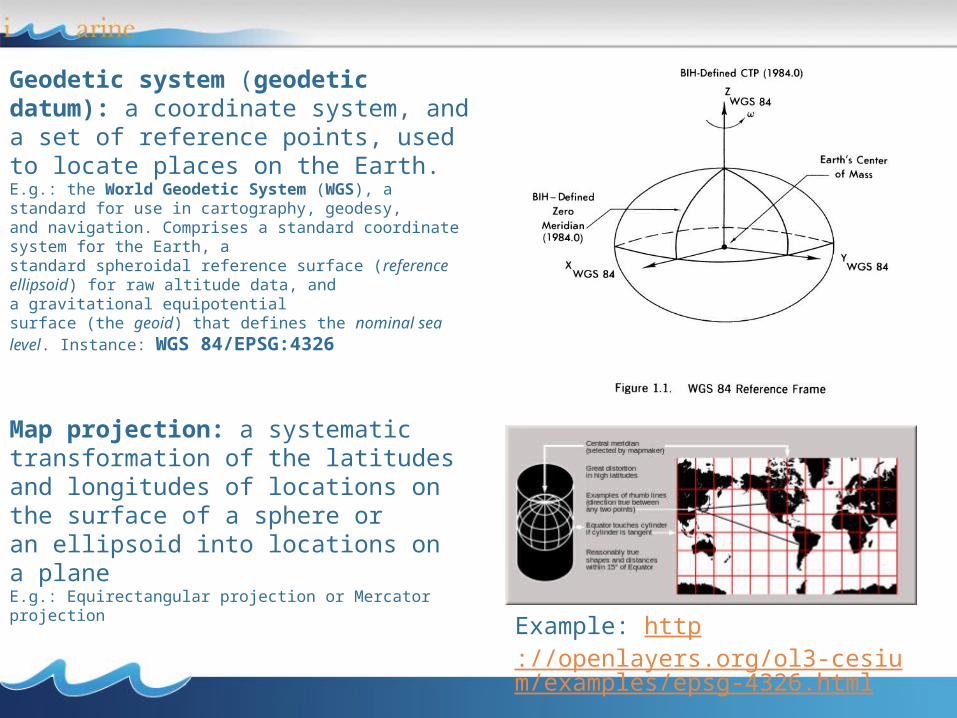
Geodetic system (geodetic datum): a coordinate system, and a set of reference points, used to locate places on the Earth.E.g.: the World Geodetic System (WGS), a standard for use in cartography, geodesy, and navigation. Comprises a standard coordinate system for the Earth, a standard spheroidal reference surface (reference ellipsoid) for raw altitude data, and a gravitational equipotential surface (the geoid) that defines the nominal sea level. Instance: WGS 84/EPSG:4326
Map projection: a systematic transformation of the latitudes and longitudes of locations on the surface of a sphere or an ellipsoid into locations on a planeE.g.: Equirectangular projection or Mercator projection
Example: http://openlayers.org/ol3-cesium/examples/epsg-4326.html
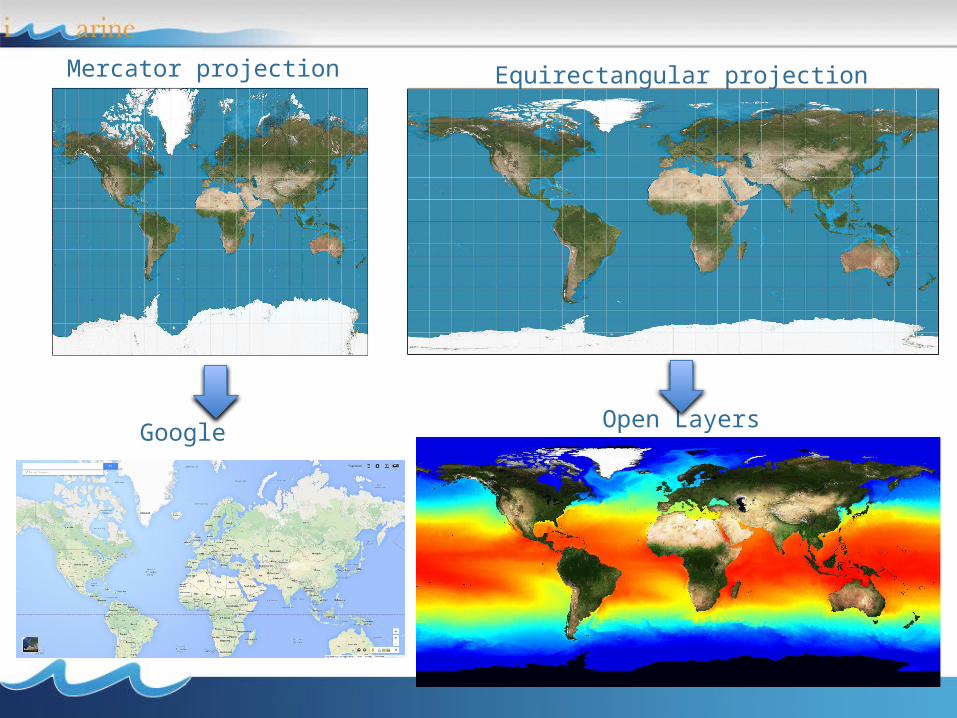
Mercator projection
Google Open Layers
Equirectangular projection
OGC Standards
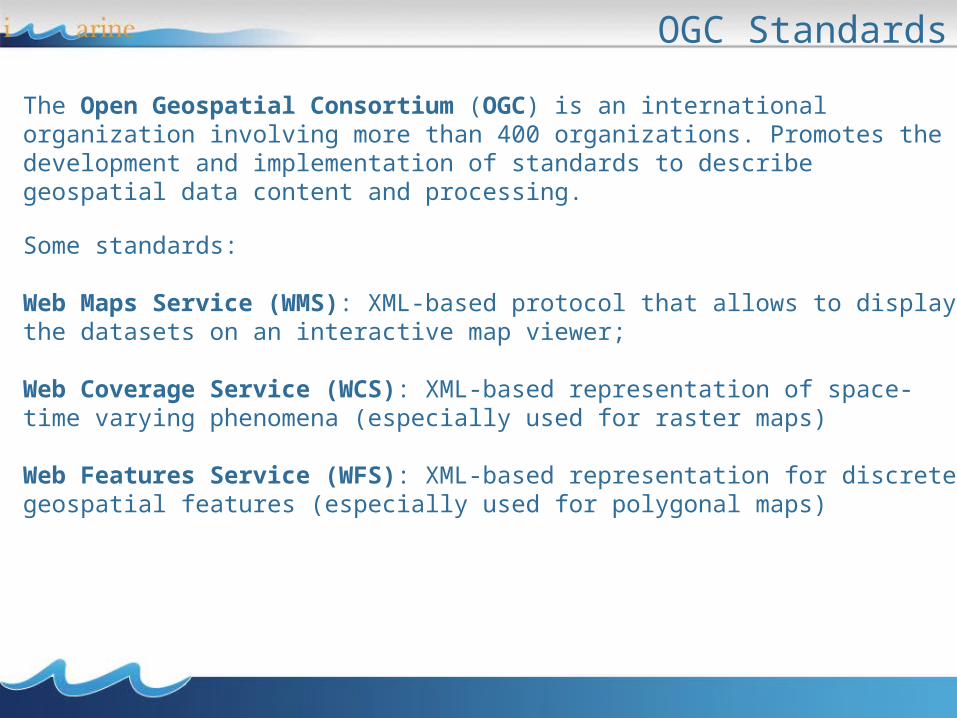
Some standards:
Web Maps Service (WMS): XML-based protocol that allows to display the datasets on an interactive map viewer;
Web Coverage Service (WCS): XML-based representation of space-time varying phenomena (especially used for raster maps)
Web Features Service (WFS): XML-based representation for discrete geospatial features (especially used for polygonal maps)
The Open Geospatial Consortium (OGC) is an international organization involving more than 400 organizations. Promotes the development and implementation of standards to describe geospatial data content and processing.
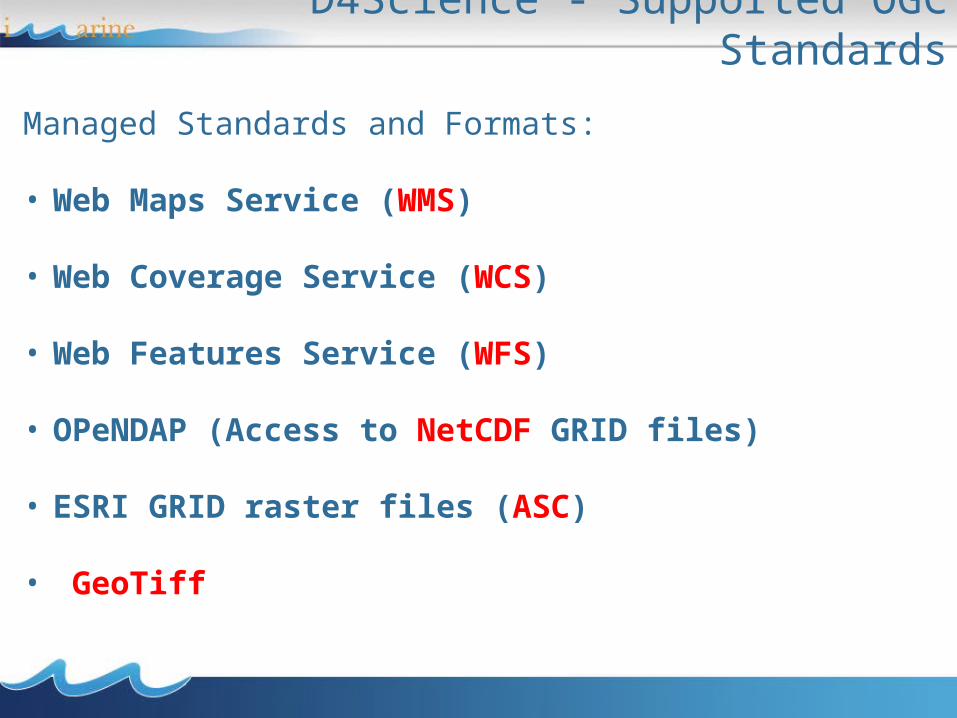
Managed Standards and Formats:
• Web Maps Service (WMS)
• Web Coverage Service (WCS)
• Web Features Service (WFS)
• OPeNDAP (Access to NetCDF GRID files)
• ESRI GRID raster files (ASC)
• GeoTiff
D4Science - Supported OGC Standards
• Geospatial data: description and access• Catalogues• Visualisation• Processing• Processing examples• Use Case: the European Geothermal Information
Platform
Data Catalogues• Describe metadata for a geospatial dataset
in a structured and standardized way• Indispensable for
– all kinds of data transfers– interoperability
• Include ISO / CEN / OGC work
Data Catalogues Usage• Changing from one projection to another• Transformations:
– from geographical coordinates to projection– from a source projection, via geographical
coordinates, towards target projection– vector data projection– raster data projection
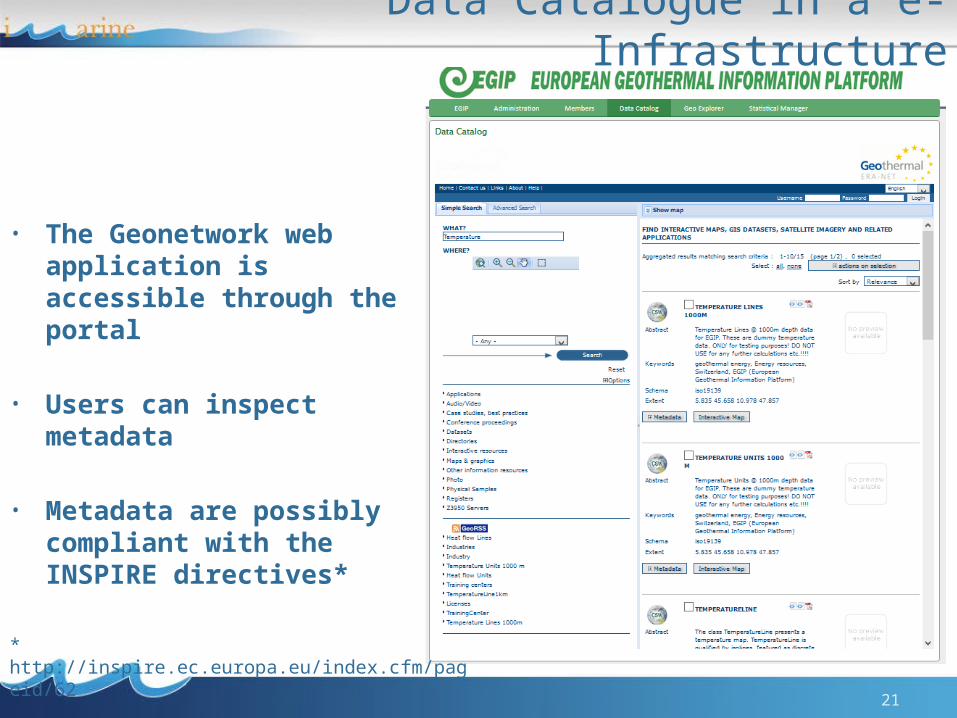
Data Catalogue in a e-Infrastructure
21
• The Geonetwork web application is accessible through the portal
• Users can inspect metadata
• Metadata are possibly compliant with the INSPIRE directives*
* http://inspire.ec.europa.eu/index.cfm/pageid/62
Online examples: GeoNetwork
http://geonetwork.d4science.org/geonetwork/http://
geonetwork.geothermaldata.d4science.org/geonetwork/srv/en/main.home
• Geospatial data: description and access• Catalogues• Visualisation• Processing• Processing examples• Use Case: the European Geothermal Information
Platform
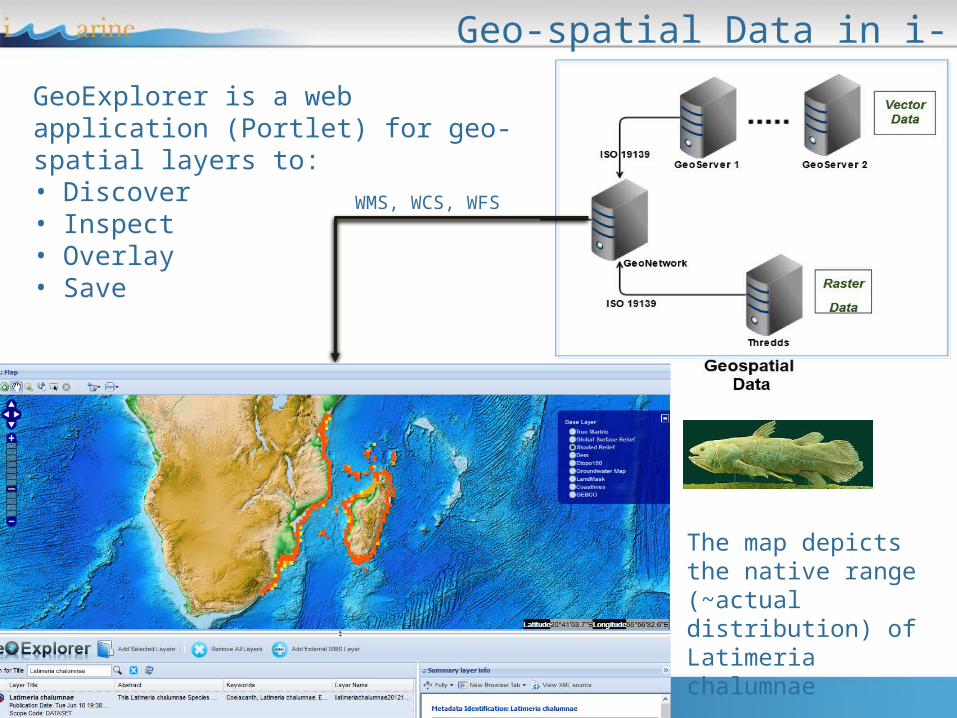
Geo-spatial Data in i-Marine
GeoExplorer is a web application (Portlet) for geo-spatial layers to:• Discover • Inspect• Overlay• Save
WMS, WCS, WFS
The map depicts the native range (~actual distribution) of Latimeria chalumnae
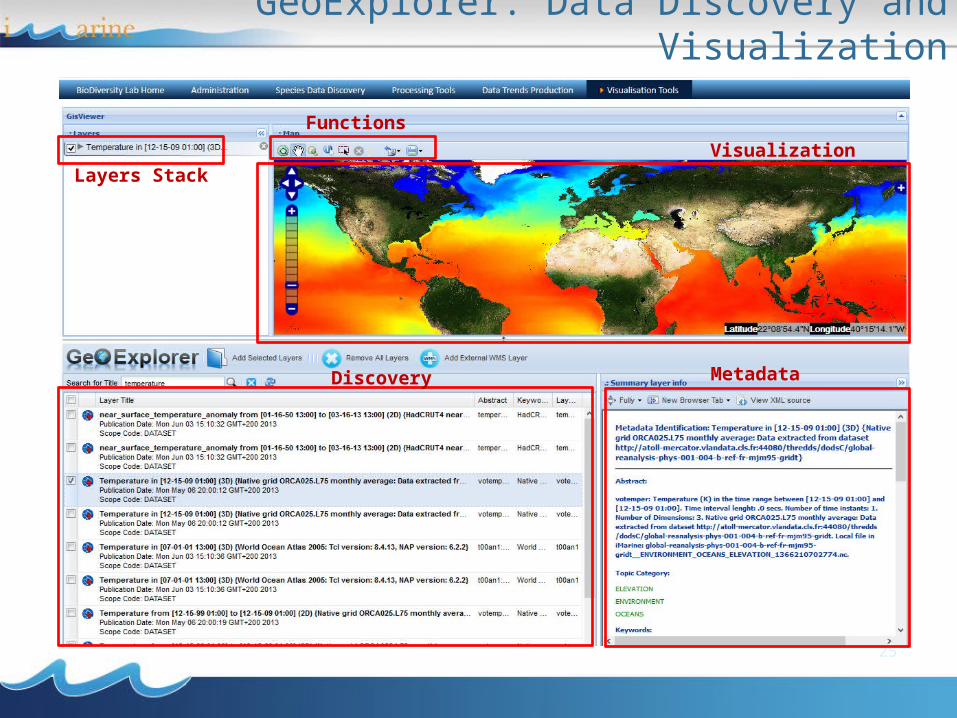
GeoExplorer: Data Discovery and Visualization
25
Layers Stack
FunctionsVisualization
Discovery Metadata
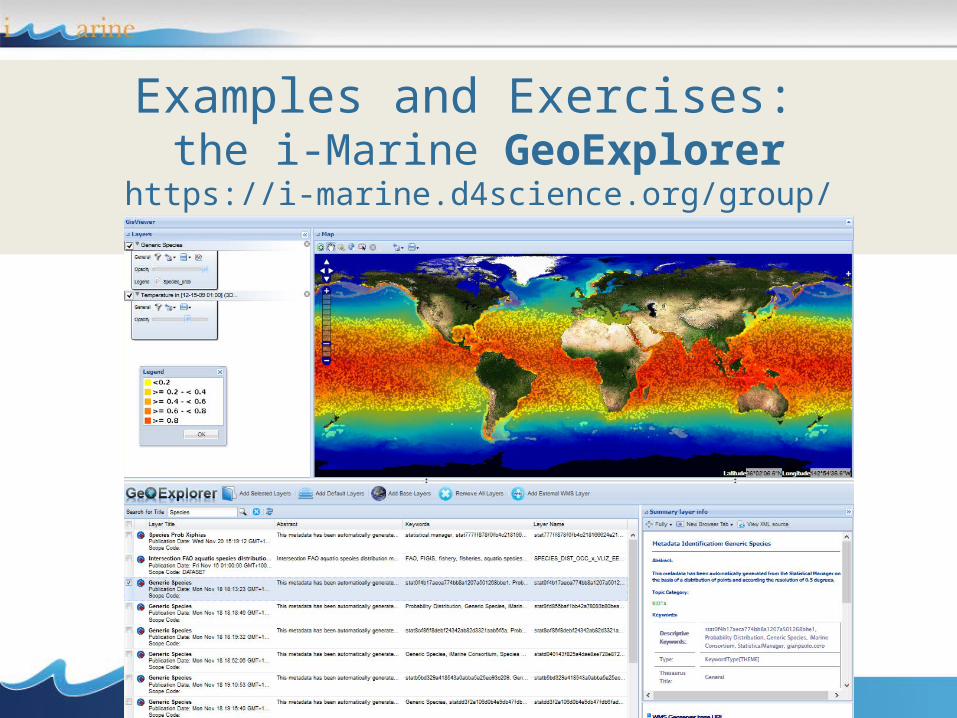
Examples and Exercises: the i-Marine GeoExplorer
https://i-marine.d4science.org/group/biodiversitylab/geo-visualisation
• Geospatial data: description and access• Catalogues• Visualisation• Processing• Processing examples• Use Case: the European Geothermal Information
Platform
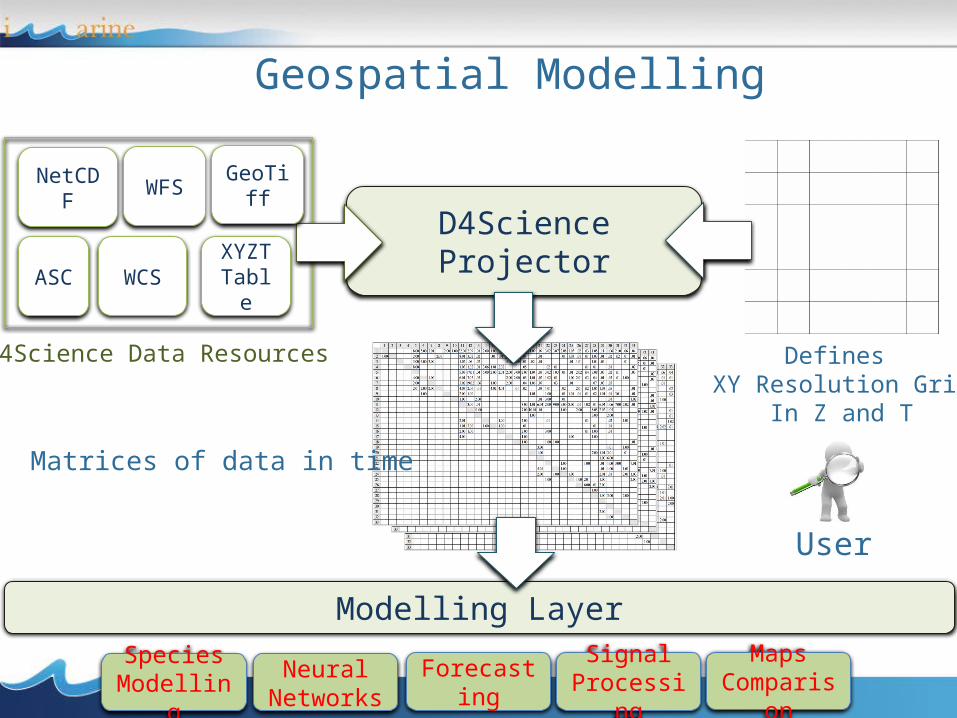
Geospatial Modelling
NetCDF
ASC
WFS
WCSXYZTTable
SpeciesModelling
Neural Networks
Forecasting Signal Processing
MapsComparison
User
Defines XY Resolution Grid
In Z and T
D4Science Data Resources
D4Science Projector
Modelling Layer
Matrices of data in time
GeoTiff
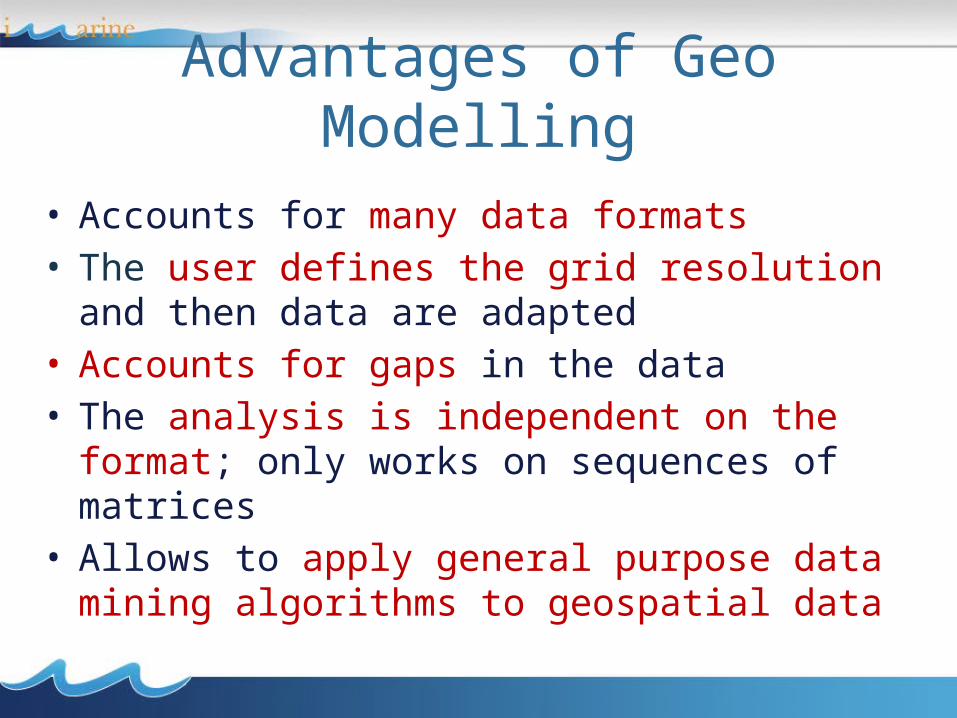
Advantages of Geo Modelling
• Accounts for many data formats• The user defines the grid resolution and then data
are adapted• Accounts for gaps in the data• The analysis is independent on the format; only
works on sequences of matrices• Allows to apply general purpose data mining
algorithms to geospatial data
• Geospatial data: description and access• Catalogues• Visualisation• Processing• Processing examples• Use Case: the European Geothermal Information
Platform
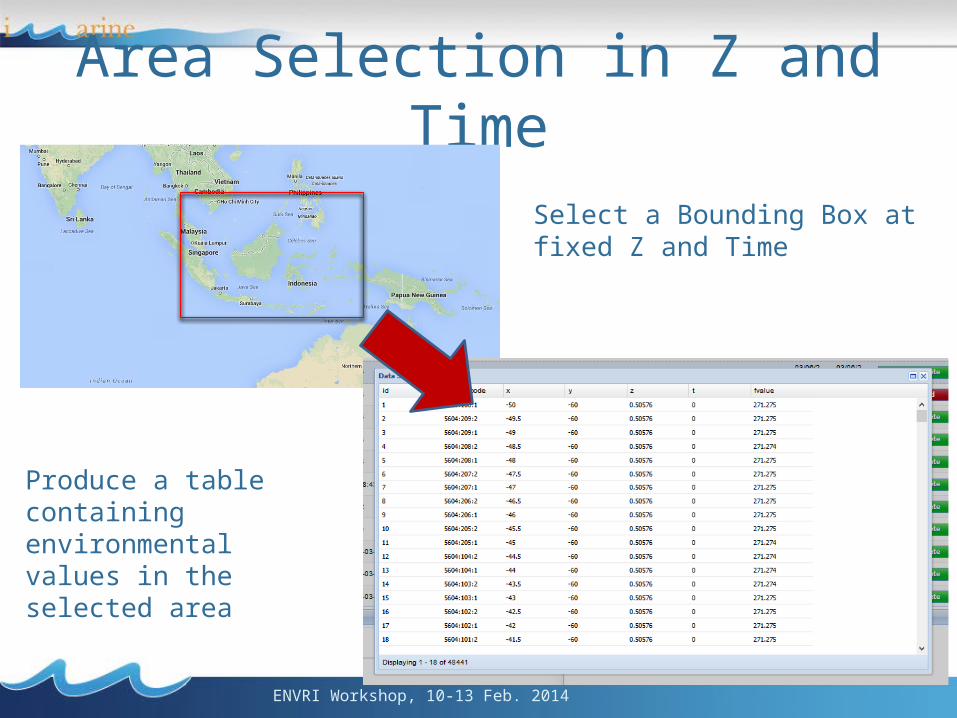
Area Selection in Z and Time
Select a Bounding Box at fixed Z and Time
Produce a table containing environmental values in the selected area
ENVRI Workshop, 10-13 Feb. 2014
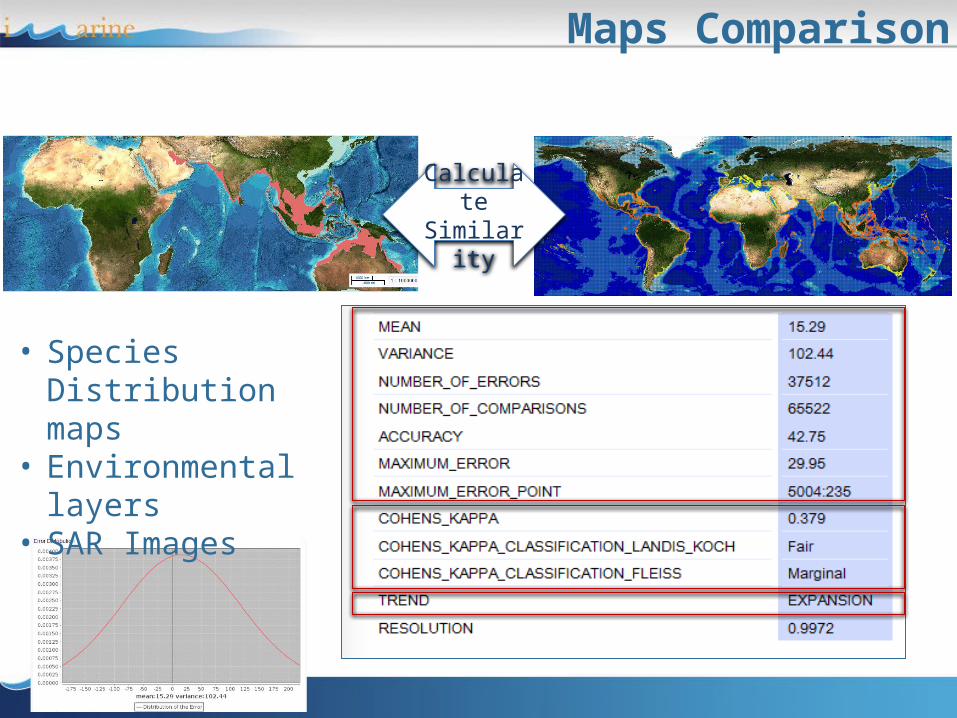
Maps Comparison
CalculateSimilarity
• Species Distribution maps
• Environmental layers• SAR Images
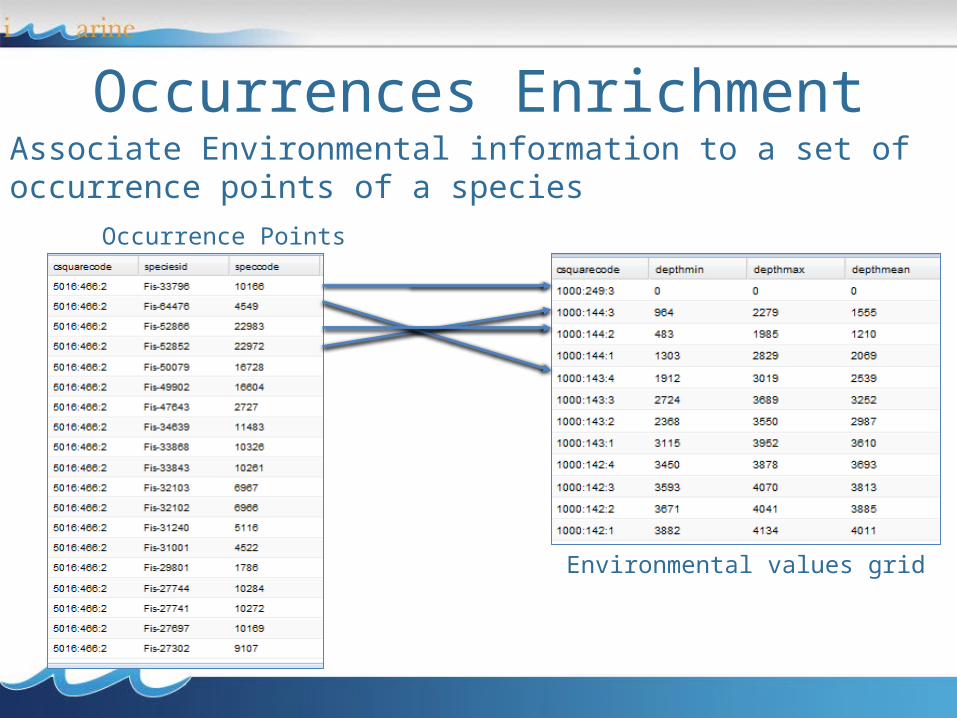
Occurrences EnrichmentAssociate Environmental information to a set of occurrence points of a species
Environmental values grid
Occurrence Points
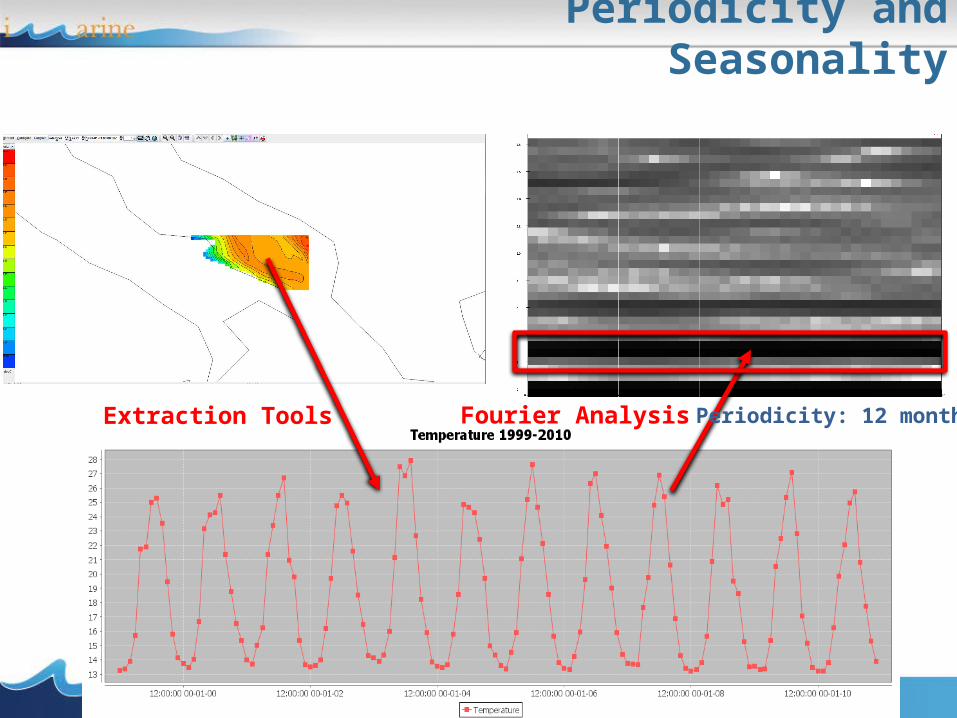
Periodicity and Seasonality
Periodicity: 12 monthsExtraction Tools Fourier Analysis
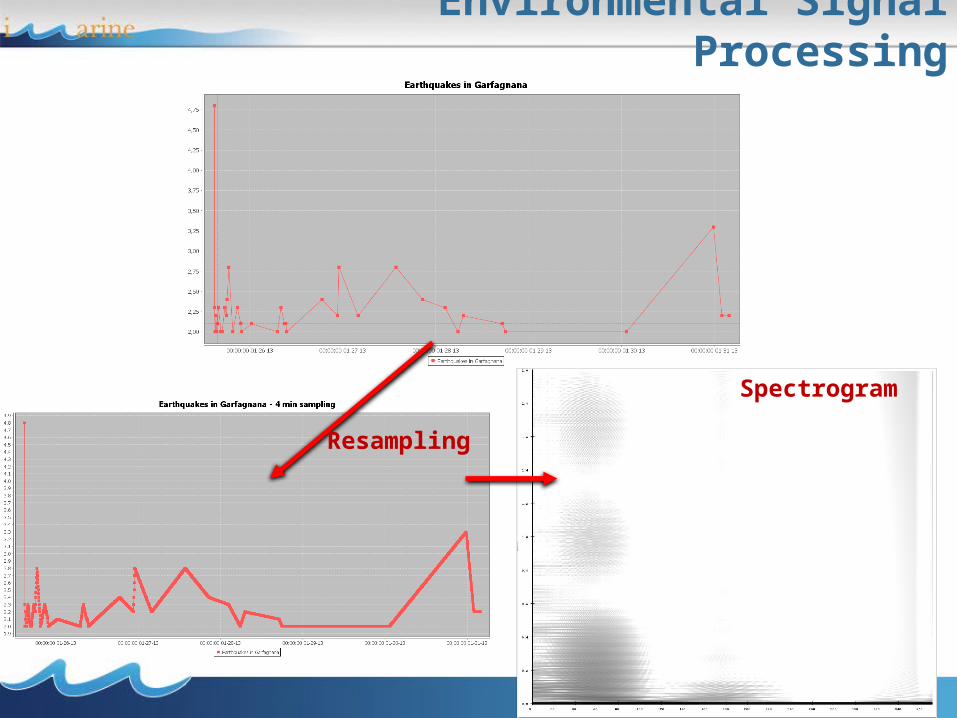
Environmental Signal Processing
Resampling
Spectrogram
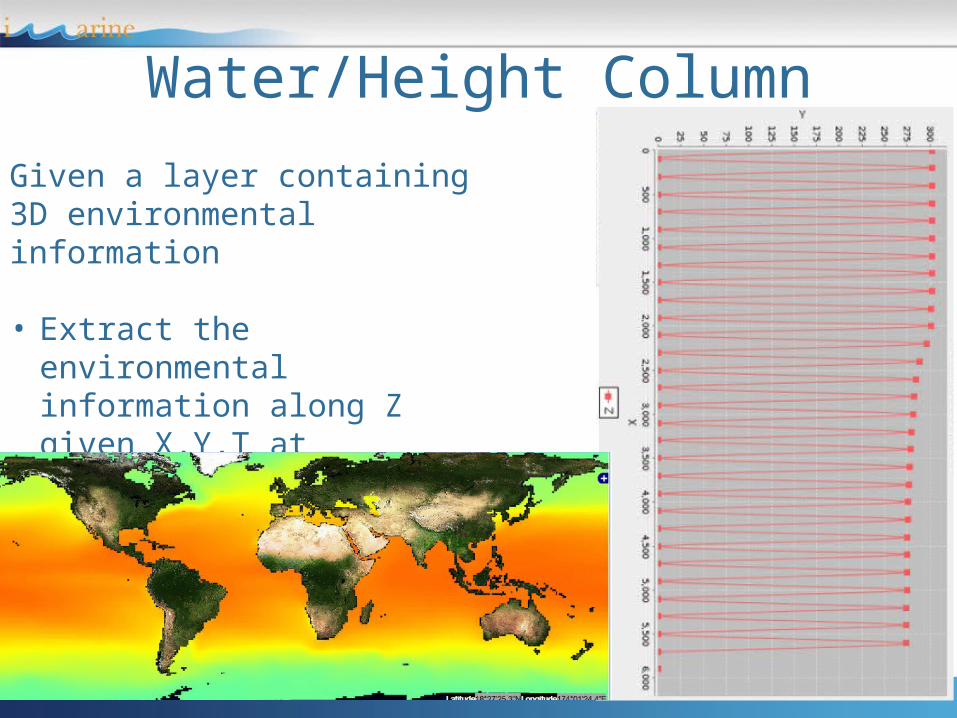
Water/Height ColumnGiven a layer containing 3D environmental information
• Extract the environmental information along Z given X,Y,T at resolution R
• Produce charts and ranges
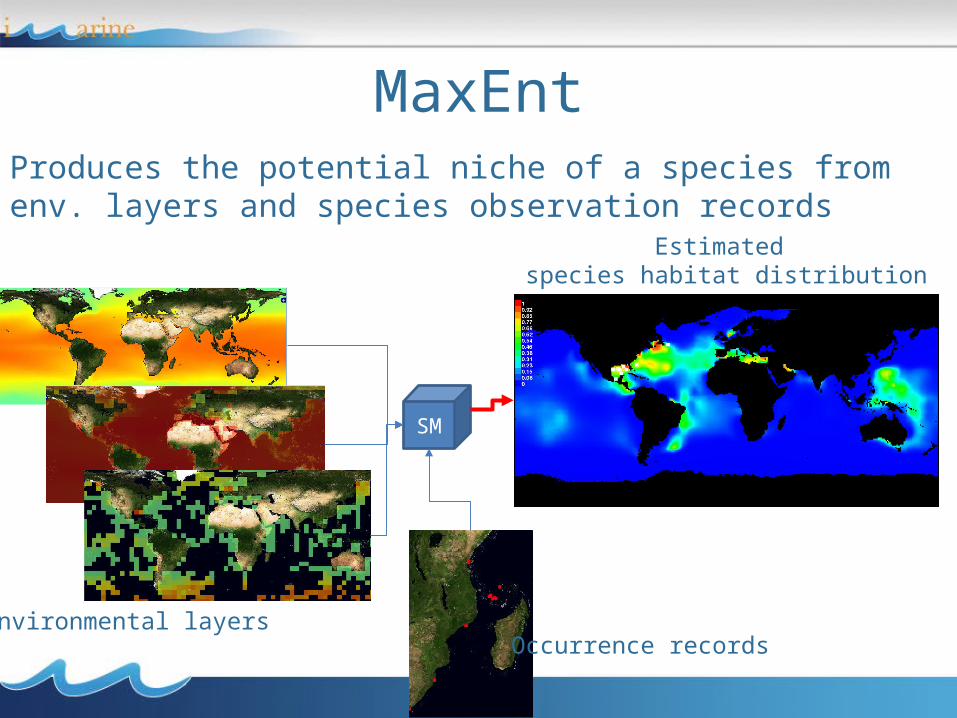
MaxEntProduces the potential niche of a species from env. layers and species observation records
Environmental layersOccurrence records
Estimated species habitat distribution
SM
• Geospatial data: description and access• Catalogues• Visualisation• Processing• Processing examples• Use Case: the European Geothermal Information
Platform
An Infrastructure for Geothermal data: the EGIP case
• European Geothermal Information Platform (EGIP): makes disperse and heterogeneous data available to stakeholder communities in the Geothermal domain
• A Pilot e-Infrastructure instance has been created: egip.d4science.org
39
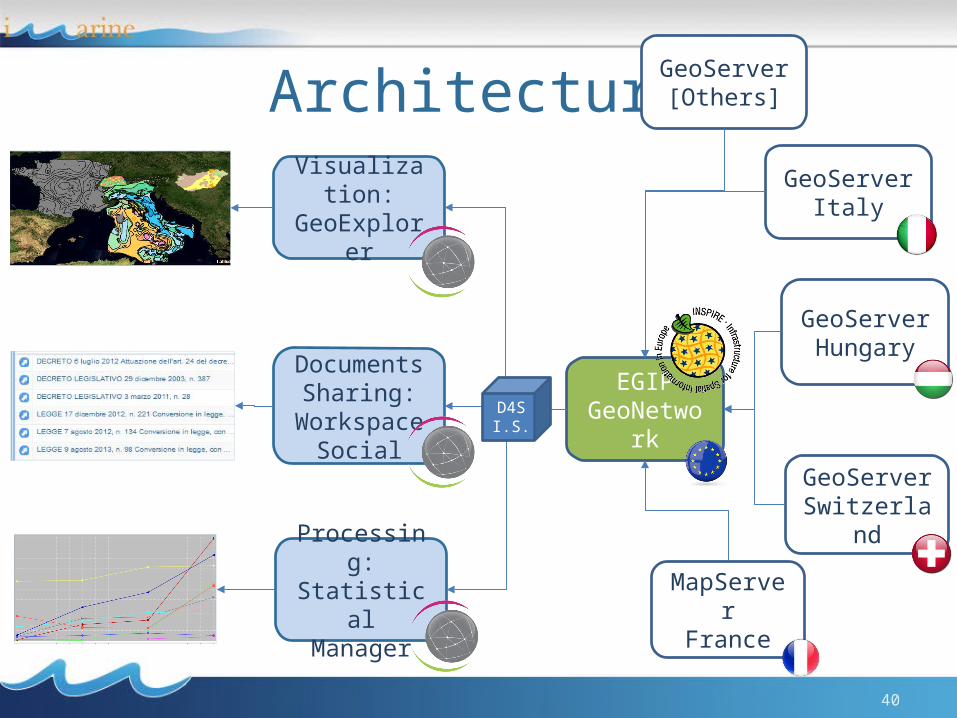
Architecture
40
Visualization: GeoExplorer
Processing: Statistical Manager
DocumentsSharing:
WorkspaceSocial
EGIPGeoNetwork
GeoServerItaly
GeoServerHungary
GeoServerSwitzerland
MapServerFrance
D4SI.S.
GeoServer[Others]
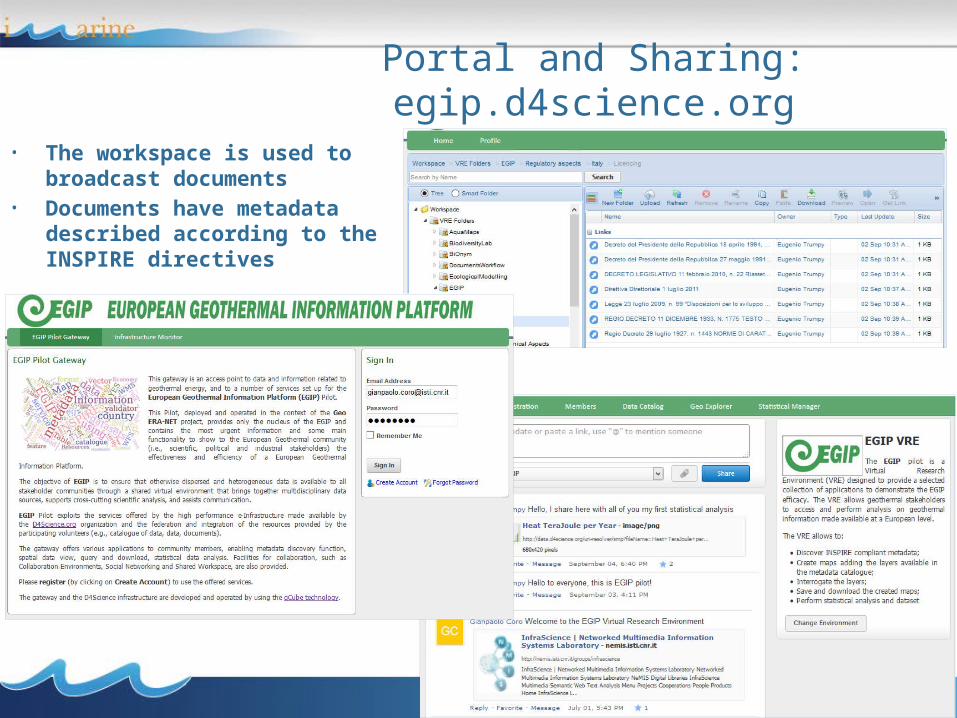
Portal and Sharing: egip.d4science.org
41
• The workspace is used to broadcast documents
• Documents have metadata described according to the INSPIRE directives
42
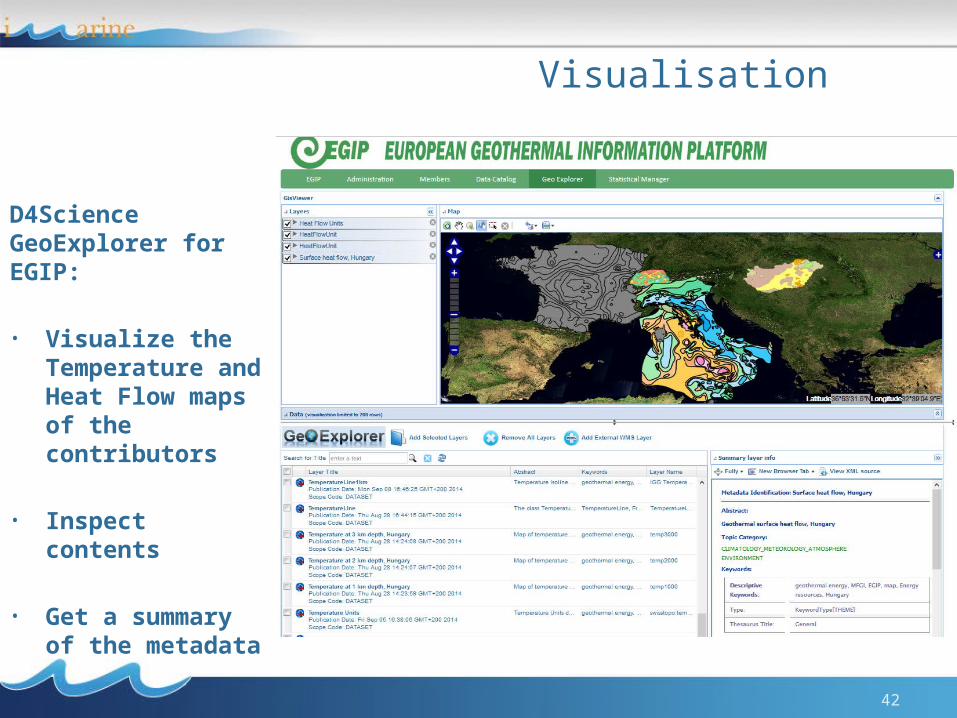
Visualisation
D4Science GeoExplorer for EGIP:
• Visualize the Temperature and Heat Flow maps of the contributors
• Inspect contents
• Get a summary of the metadata
43
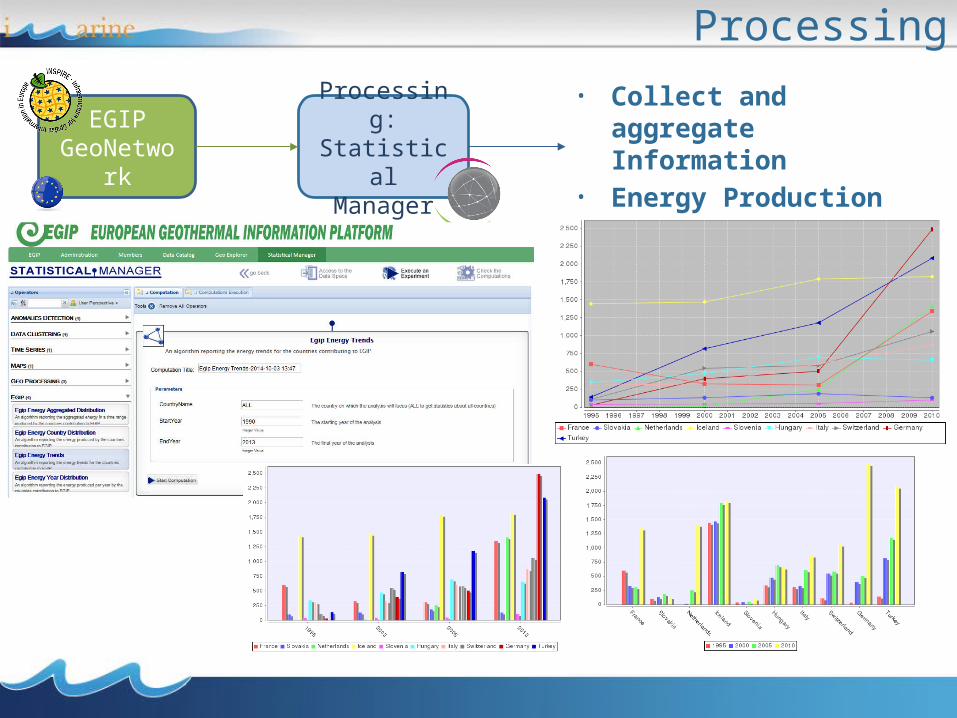
Processing
EGIPGeoNetwork
Processing: Statistical Manager
• Collect and aggregate Information
• Energy Production Trends per country and year
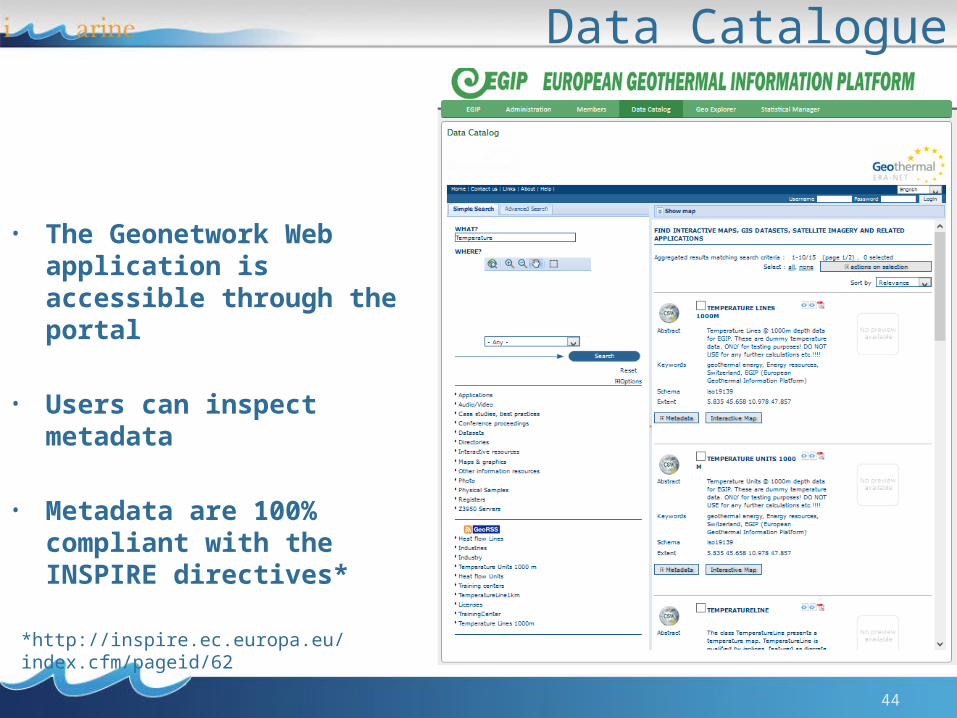
Data Catalogue
44
• The Geonetwork Web application is accessible through the portal
• Users can inspect metadata
• Metadata are 100% compliant with the INSPIRE directives*
*http://inspire.ec.europa.eu/index.cfm/pageid/62
Online example: The EGIP Web portal
http://egip.d4science.org