Embed Size (px)
Citation preview

Watch Re-runs On Your SQL Server!
David [email protected]
All slides and content available on my blog:http://bit.ly/1HicQw9
http://www.imdb.com/find?s=all&q=good%20times

David CobbSQL Trainer / ConsultantMCT, MCSE Data Platform for SQL 2012
PresenterPast Roles: Tech Support, Network Admin, Web Developer, DBACurrent:Systems Architect for CheckAlt.com
Training SQL Since: 2002
Favorite Techs of the Moment: PowerShell & Azure


Free 8-part series THURSDAYS, 6:00 PM – 9:00 PM
Session 3: Legal & IP, 3d Printing (May 28)Session 4: Design UIUX & Machine Learning (Jun 4)Session 5: Finance & Programming services for IoTSession 6: KPIs & Test-to-Manufacture Session 7: Distribution & Programming DronesSession 8: Funding/Investments & Programming Wearables
Details and Registration: aka.ms/micmeetup
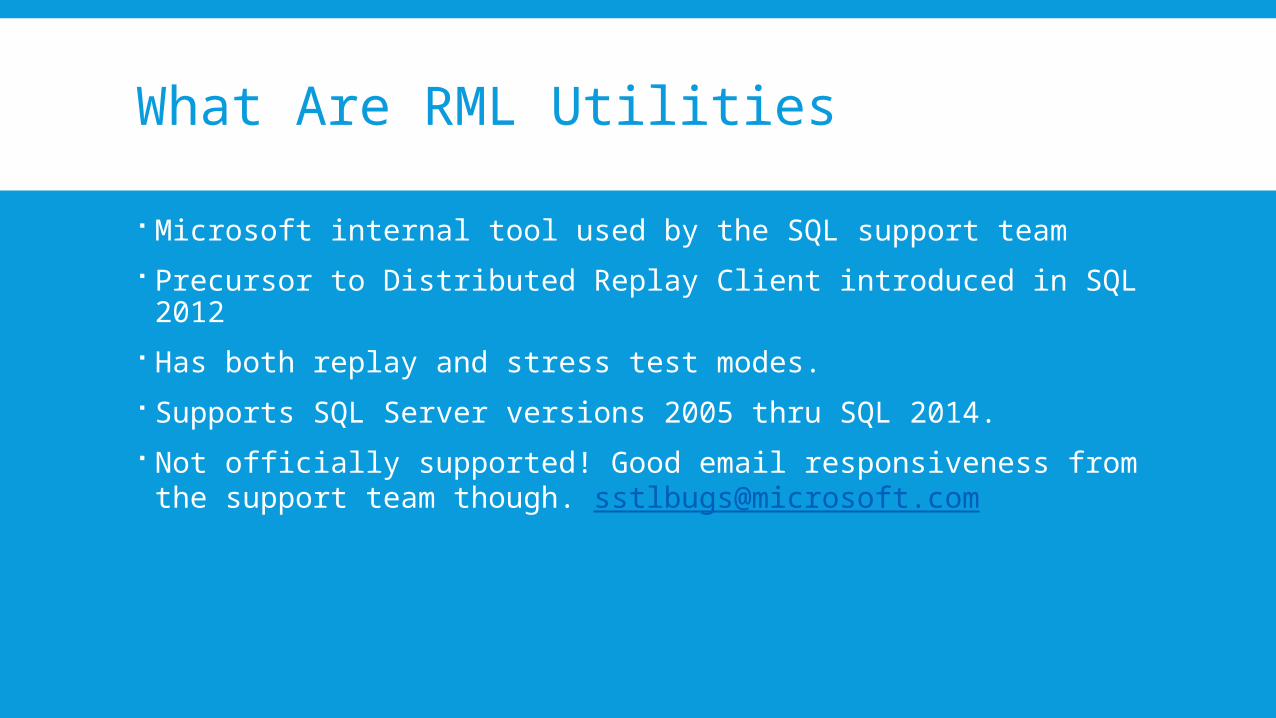
What Are RML Utilities
Microsoft internal tool used by the SQL support team
Precursor to Distributed Replay Client introduced in SQL 2012
Has both replay and stress test modes.
Supports SQL Server versions 2005 thru SQL 2014.
Not officially supported! Good email responsiveness from the support team though. [email protected]

Why Would I Use Them?
PRE-SQL 2012 (otherwise look at the Distributed Replay Client, it IS supported)
Testing effect on SQL statement performance from environment changes using real production query load (including inserts/updates/deletes) . Test with new version of SQL (or hotfix, CU, or SP) Test with different server or database settings (MAXDOP changes, RCSI)
Test with different files or disks (additional files, filegroups, different RAID or LUN, SSDs)
Test index changes Etc.
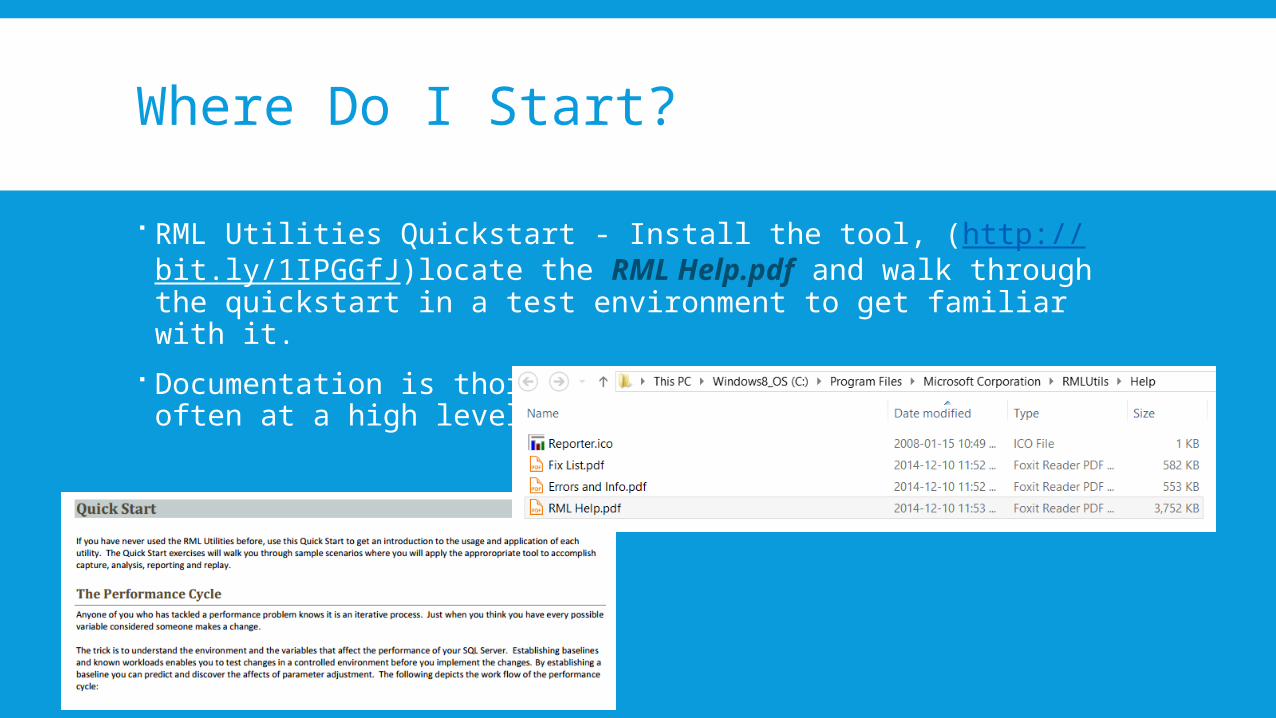
Where Do I Start?
RML Utilities Quickstart - Install the tool, (http://bit.ly/1IPGGfJ)locate the RML Help.pdf and walk through the quickstart in a test environment to get familiar with it.
Documentation is thorough, covering many use cases, but often at a high level of technical detail.
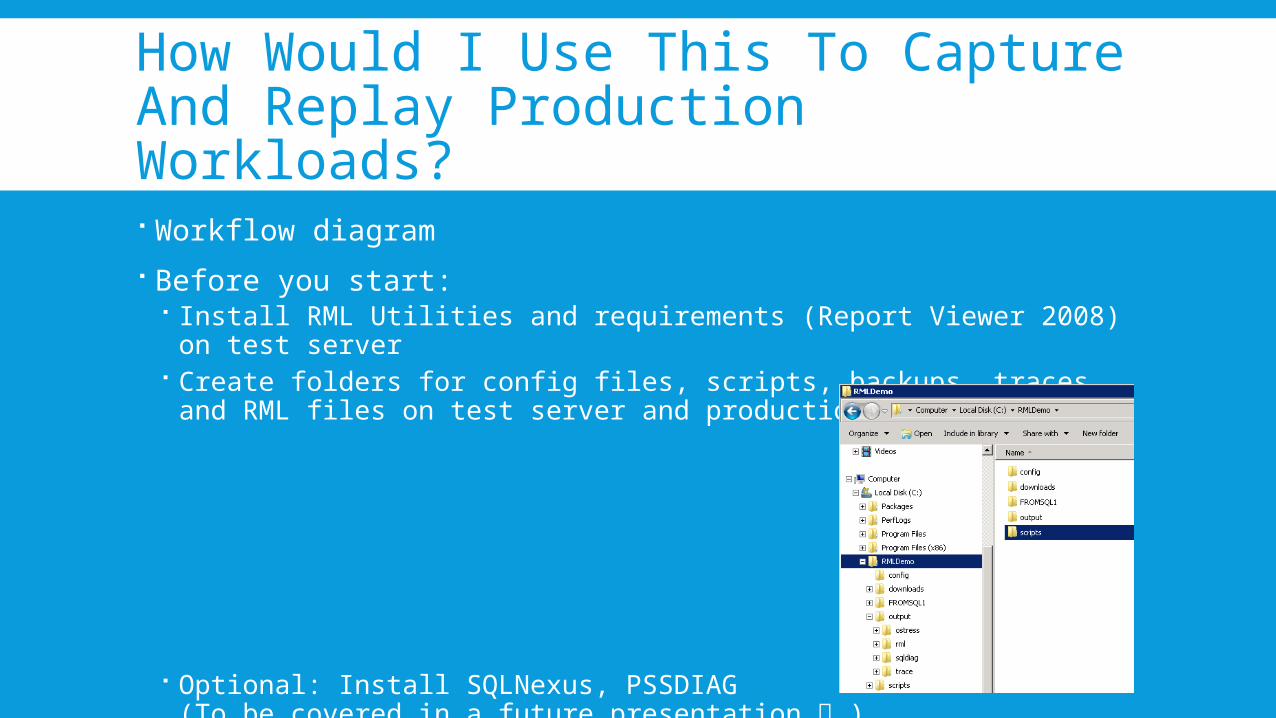
How Would I Use This To Capture And Replay Production Workloads?
Workflow diagram
Before you start: Install RML Utilities and requirements (Report Viewer 2008) on test
server Create folders for config files, scripts, backups, traces and RML files on
test server and production
Optional: Install SQLNexus, PSSDIAG (To be covered in a future presentation )
Overview Of The RML Replay Process:
RML Utilities Basic Workflow Diagram (github link)
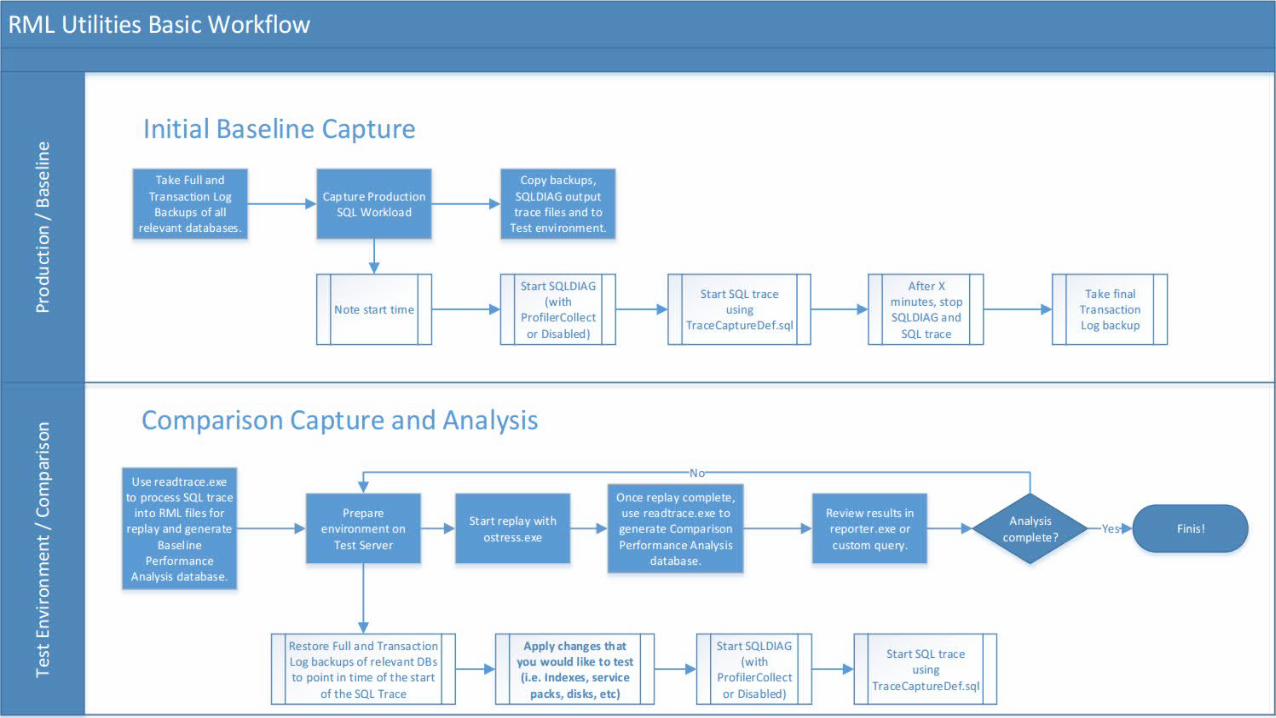
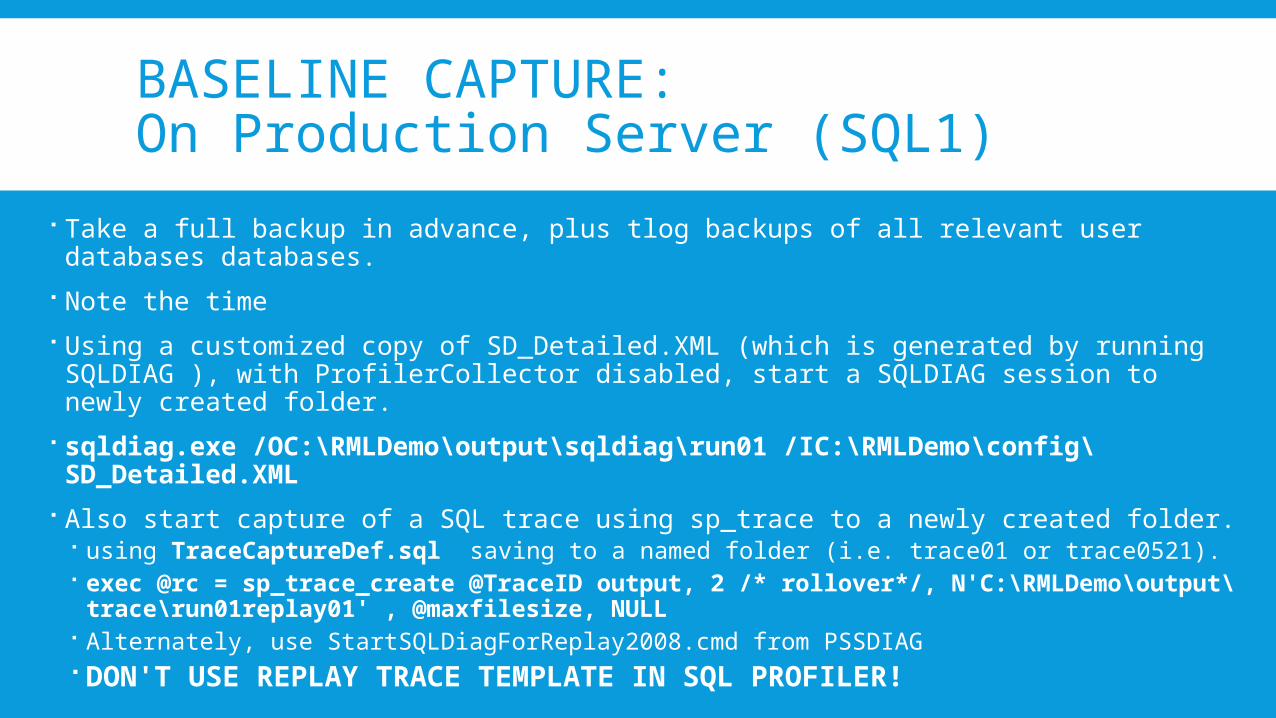
BASELINE CAPTURE: On Production Server (SQL1)
Take a full backup in advance, plus tlog backups of all relevant user databases databases.
Note the time
Using a customized copy of SD_Detailed.XML (which is generated by running SQLDIAG ), with ProfilerCollector disabled, start a SQLDIAG session to newly created folder.
sqldiag.exe /OC:\RMLDemo\output\sqldiag\run01 /IC:\RMLDemo\config\SD_Detailed.XML
Also start capture of a SQL trace using sp_trace to a newly created folder. using TraceCaptureDef.sql saving to a named folder (i.e. trace01 or trace0521). exec @rc = sp_trace_create @TraceID output, 2 /* rollover*/, N'C:\RMLDemo\output\trace\run01replay01' , @maxfilesize, NULL
Alternately, use StartSQLDiagForReplay2008.cmd from PSSDIAG DON'T USE REPLAY TRACE TEMPLATE IN SQL PROFILER!

BASELINE CAPTURE : Continued..
Start simulated workload if testing, or wait for production activity
When capture of production load is complete (timeframe up to you, 15 minutes, 1 hour?) stop the trace and SQLDIAG (ctrl-C in SQLDIAG window)
Take final tlog backups, then copy the following from production to the test server (or other server that will analyze the results): Trace files SQLDIAG output Full and TLog backups

DEMO: BASELINE CAPTURE
From RML Help.pdf, pg 17
DEMO : ReadTrace
I’m performing the demos that take some time so I can talk while they run..

PROCESS : On Test Server (SQL2)Using the ReadTrace tool
Use readtrace.exe from RML Cmd Prompt on the test server (or any other), to process the trace files into replayable RML files ReadTrace consumes as input trace (.TRC) or (.XEL) files and .CAB or .ZIP files which contain .TRC files from a SQL Trace or Extended Events
It generates .RML (Replay Mark-up Language) files and the Performance Analysis (PerfAnalysis) database. (A populated performance analysis database is required for reporter.exe functionality.)
TIP! Save your command line statements in text file and paste to console. Track what statements and parameters were used exactly,
and when. Minimize typos.
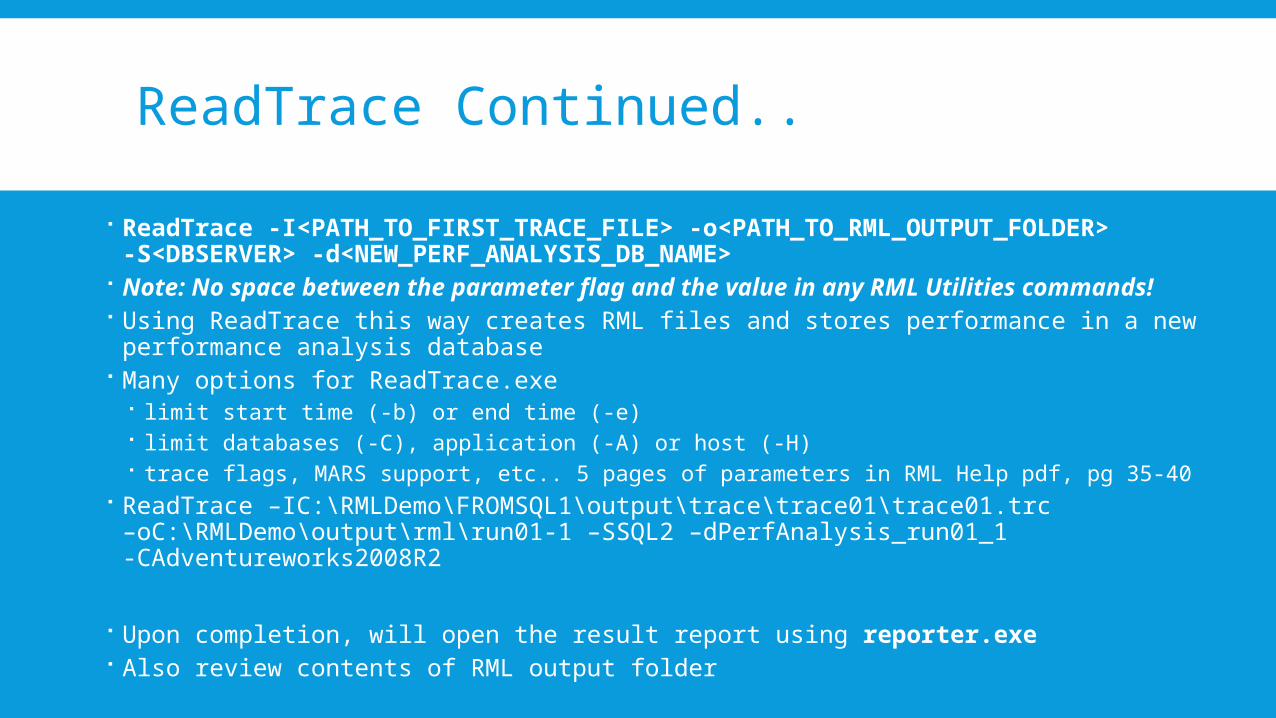
ReadTrace Continued..
ReadTrace -I<PATH_TO_FIRST_TRACE_FILE> -o<PATH_TO_RML_OUTPUT_FOLDER> -S<DBSERVER> -d<NEW_PERF_ANALYSIS_DB_NAME>
Note: No space between the parameter flag and the value in any RML Utilities commands!
Using ReadTrace this way creates RML files and stores performance in a new performance analysis database
Many options for ReadTrace.exe limit start time (-b) or end time (-e) limit databases (-C), application (-A) or host (-H) trace flags, MARS support, etc.. 5 pages of parameters in RML Help pdf, pg 35-40
ReadTrace –IC:\RMLDemo\FROMSQL1\output\trace\trace01\trace01.trc –oC:\RMLDemo\output\rml\run01-1 –SSQL2 –dPerfAnalysis_run01_1 -CAdventureworks2008R2
Upon completion, will open the result report using reporter.exe Also review contents of RML output folder

REPLAY : On Test Server (SQL2)
Prepare environment on test server Ensure you won't have access to / affect production! Restore databases up to point in time that you began the trace
Start SQLDIAG Session, just like on production
sqldiag.exe /OC:\RMLDemo\output\sqldiag\run01replay01 /IC:\RMLDemo\config\SD_Detailed.XML
Also start capture of a replay trace using sp_trace, just like on production exec @rc = sp_trace_create @TraceID output, 2 /rollover*/, N'C:\RMLDemo\output\trace\run01' , @maxfilesize, NULL

DEMO : Ostress
Again, I’m performing the demos that take some time so I can talk while they run..

OSTRESS : The Replay Command
OStress is a scalable, ODBC based application which can replay database commands in two modes:
Replay mode orchestrates the order of the commands, to accurately simulate OLTP activity. (i.e. Insert table 1, when done then update table 2, then delete table 3..)
Note that replay mode can take around 5 times longer that original capture, due to orchestration overhead
Stress mode plays back SQL statements as quickly as possible, based on parameters you provide. (i.e. Firehose mode)
No respecting order of statements, not useful for Inserts/Updates/Deletes with Foreign Key relationships.
Many parameters for this tool as well
RML Help.pdf pg 93
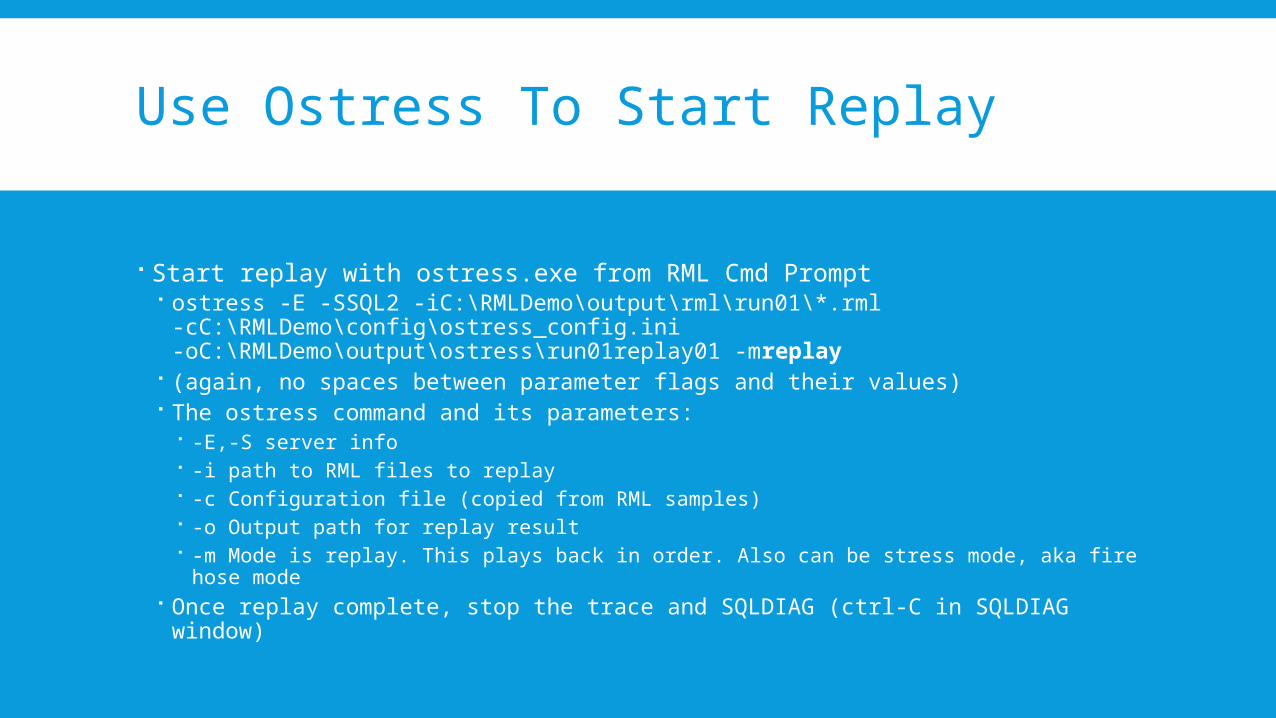
Use Ostress To Start Replay
Start replay with ostress.exe from RML Cmd Prompt ostress -E -SSQL2 -iC:\RMLDemo\output\rml\run01\*.rml -cC:\RMLDemo\config\ostress_config.ini -oC:\RMLDemo\output\ostress\run01replay01 -mreplay
(again, no spaces between parameter flags and their values) The ostress command and its parameters:
-E,-S server info -i path to RML files to replay -c Configuration file (copied from RML samples) -o Output path for replay result -m Mode is replay. This plays back in order. Also can be stress mode, aka fire hose
mode Once replay complete, stop the trace and SQLDIAG (ctrl-C in SQLDIAG window)
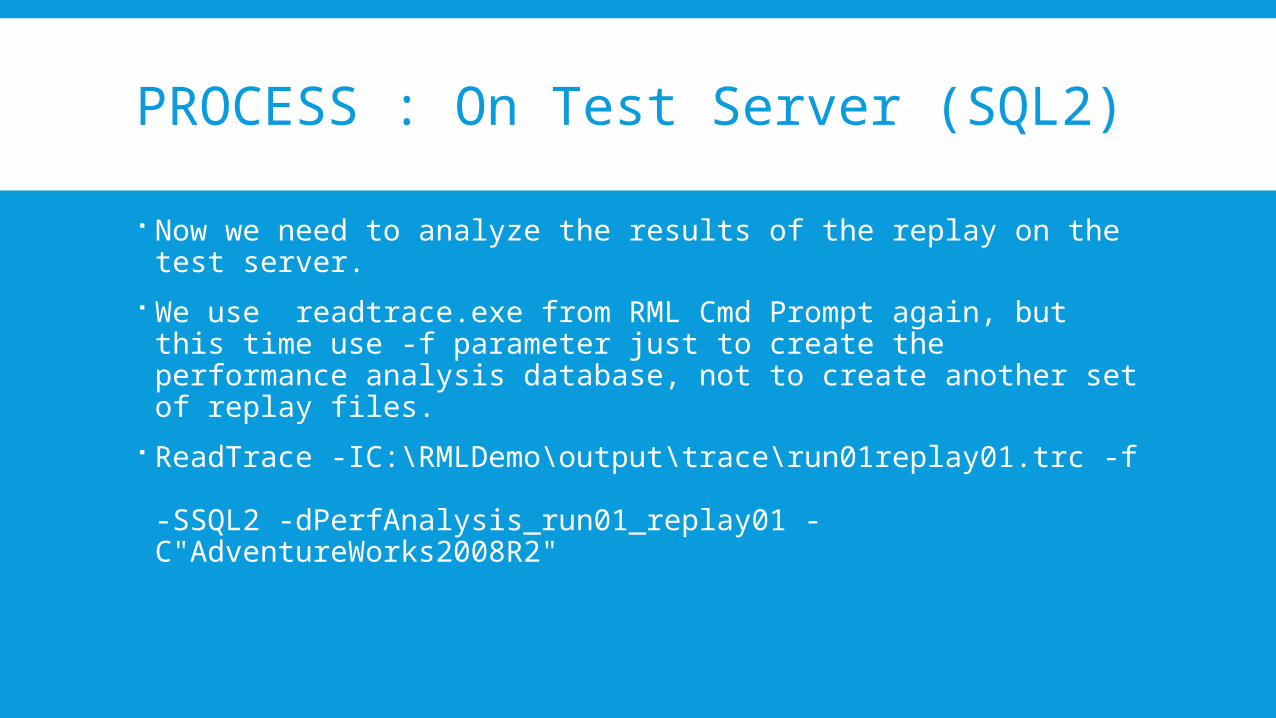
PROCESS : On Test Server (SQL2)
Now we need to analyze the results of the replay on the test server.
We use readtrace.exe from RML Cmd Prompt again, but this time use -f parameter just to create the performance analysis database, not to create another set of replay files.
ReadTrace -IC:\RMLDemo\output\trace\run01replay01.trc -f
-SSQL2 -dPerfAnalysis_run01_replay01 -C"AdventureWorks2008R2"

ANALYZE : On Test Server (SQL2)
reporter.exe runs once readtrace.exe is complete. From Properties tab, enter the names of both the performance analysis databases (Baseline and test) for reports that compare results.
Review ER Schema of the PerfAnalysis database. Understand how we can query these tables for our own analysis
Use Performance Analysis Comparison Script.sql Dave is on github!
https://github.com/dave-007/RML-Utilities-Demo

BUT WAIT, THERE'S MORE!
SQLNexus Visual reports from SQL traces (generated using PSSDIAG script) and
SQLDIAG http://sqlnexus.codeplex.com/
PSSDIAG Manager RML Utilities big brother. More features https://diagmanager.codeplex.com/
PAL Gathers performance monitor logs and generates visual reports. Compares metrics to thresholds defined by Microsoft geniuses! https://pal.codeplex.com/
RESOURCE LINKS
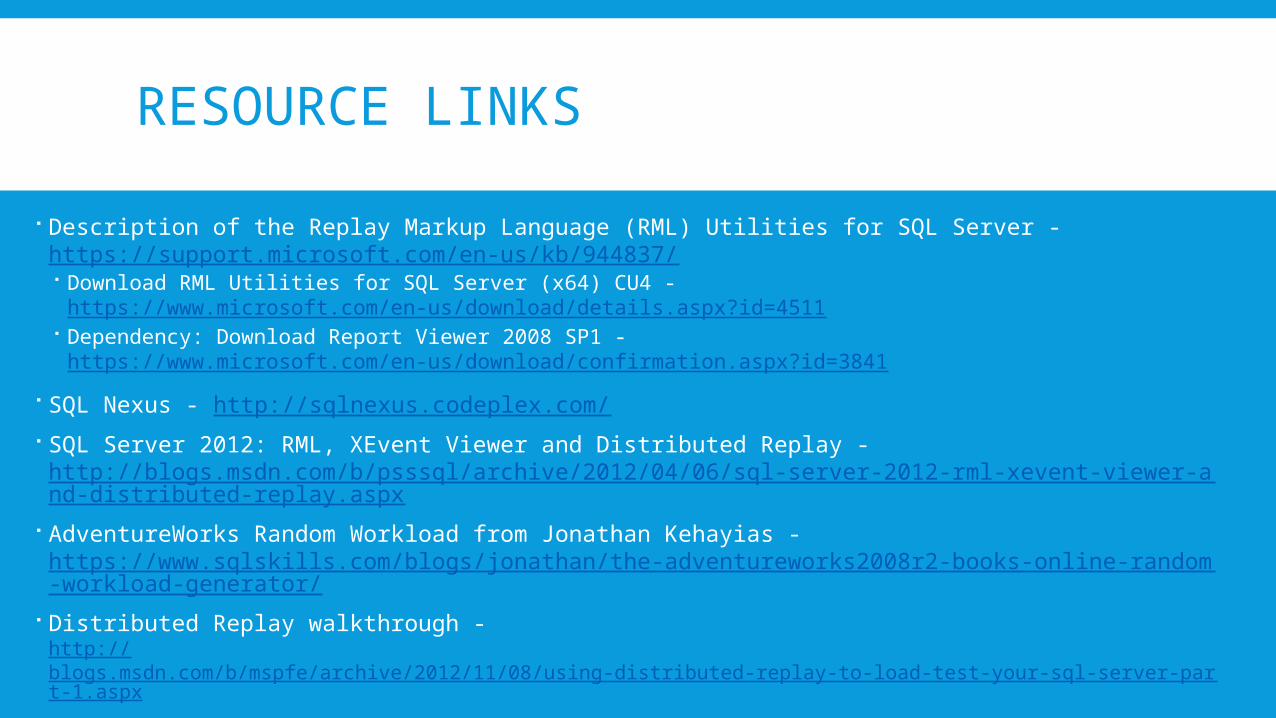
Description of the Replay Markup Language (RML) Utilities for SQL Server - https://support.microsoft.com/en-us/kb/944837/ Download RML Utilities for SQL Server (x64) CU4 -
https://www.microsoft.com/en-us/download/details.aspx?id=4511 Dependency: Download Report Viewer 2008 SP1 -
https://www.microsoft.com/en-us/download/confirmation.aspx?id=3841
SQL Nexus - http://sqlnexus.codeplex.com/
SQL Server 2012: RML, XEvent Viewer and Distributed Replay - http://blogs.msdn.com/b/psssql/archive/2012/04/06/sql-server-2012-rml-xevent-viewer-and-distributed-replay.aspx
AdventureWorks Random Workload from Jonathan Kehayias - https://www.sqlskills.com/blogs/jonathan/the-adventureworks2008r2-books-online-random-workload-generator/
Distributed Replay walkthrough -http://blogs.msdn.com/b/mspfe/archive/2012/11/08/using-distributed-replay-to-load-test-your-sql-server-part-1.aspx
RML Demo files on Github: https://github.com/dave-007/RML-Utilities-Demo