Embed Size (px)
Citation preview
December 2014
Web Performance is a KPI
How RUM Bridges Insight to Impact


© 2014 Keynote 5
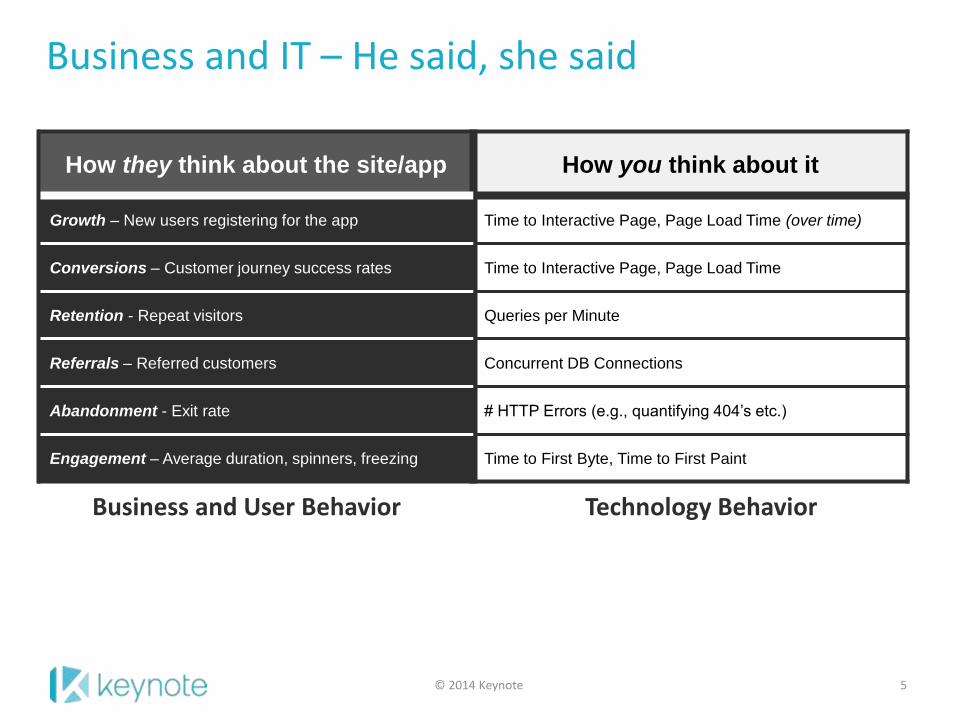
Business and IT – He said, she said
How they think about the site/app How you think about it
Growth – New users registering for the app Time to Interactive Page, Page Load Time (over time)
Conversions – Customer journey success rates Time to Interactive Page, Page Load Time
Retention - Repeat visitors Queries per Minute
Referrals – Referred customers Concurrent DB Connections
Abandonment - Exit rate # HTTP Errors (e.g., quantifying 404’s etc.)
Engagement – Average duration, spinners, freezing Time to First Byte, Time to First Paint
Business and User Behavior Technology Behavior
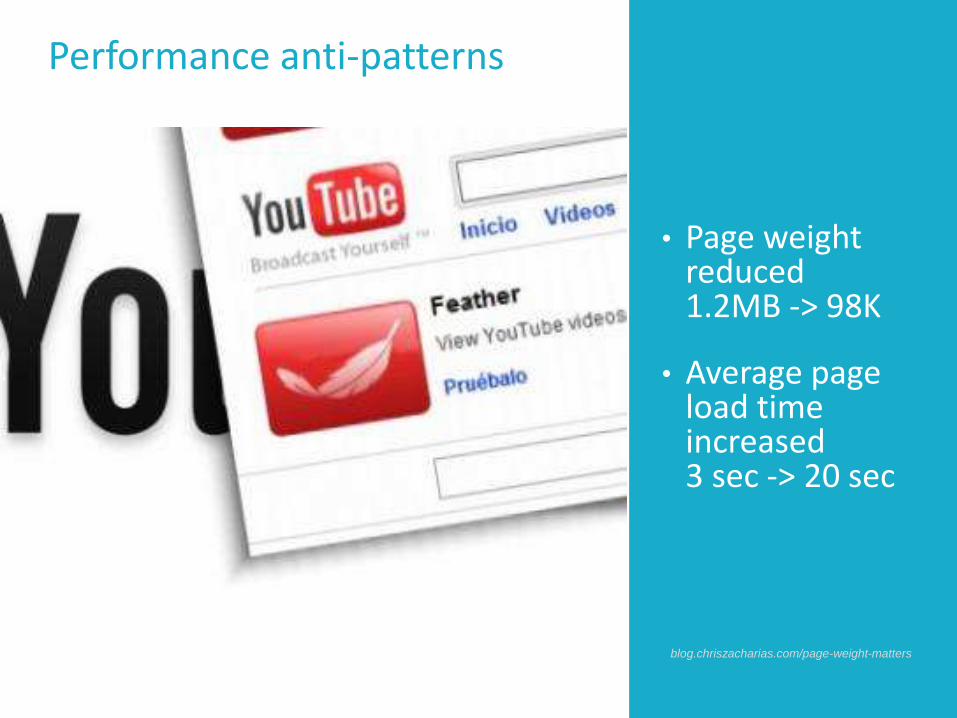
Performance anti-patterns
• Page weight reduced 1.2MB -> 98K
• Average page load time increased 3 sec -> 20 sec
blog.chriszacharias.com/page-weight-matters
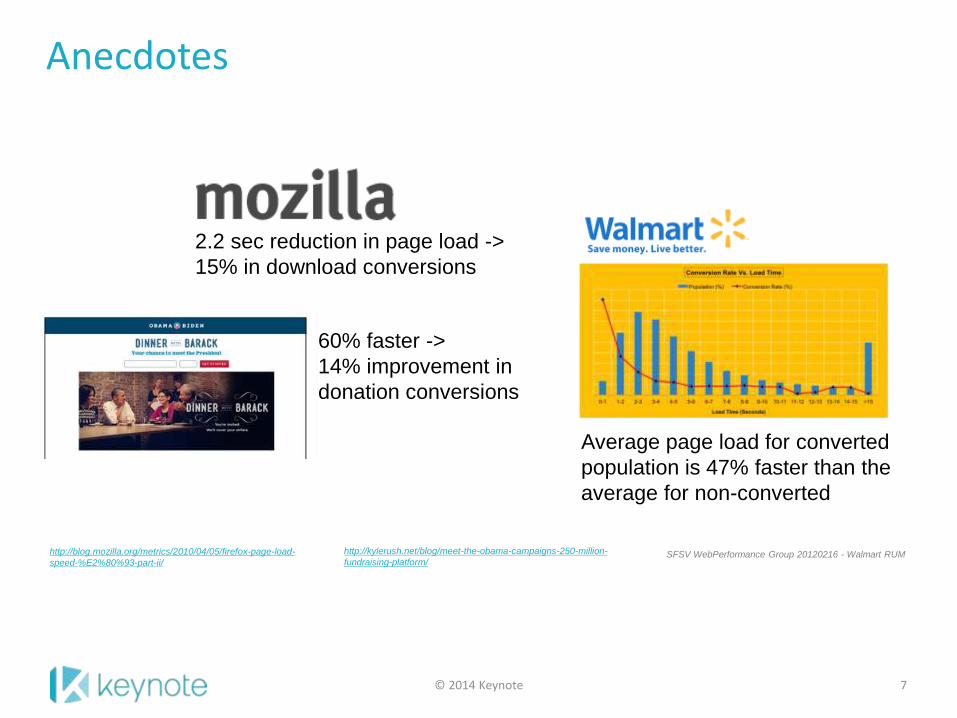
Anecdotes
© 2014 Keynote 7
60% faster ->
14% improvement in
donation conversions
Average page load for converted
population is 47% faster than the
average for non-converted
2.2 sec reduction in page load ->
15% in download conversions
http://kylerush.net/blog/meet-the-obama-campaigns-250-million-
fundraising-platform/http://blog.mozilla.org/metrics/2010/04/05/firefox-page-load-
speed-%E2%80%93-part-ii/SFSV WebPerformance Group 20120216 - Walmart RUM
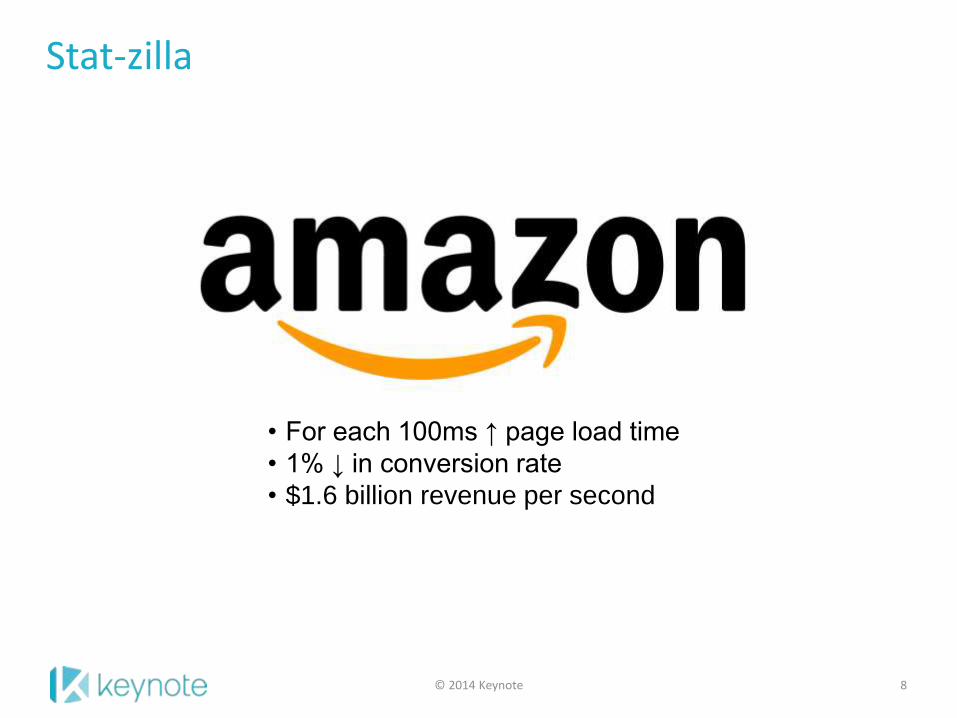
Stat-zilla
© 2014 Keynote 8
• For each 100ms ↑ page load time
• 1% ↓ in conversion rate
• $1.6 billion revenue per second
POLLAre you tracking key user behavior metrics along with your web performance indicators?
Which metrics are you correlating?
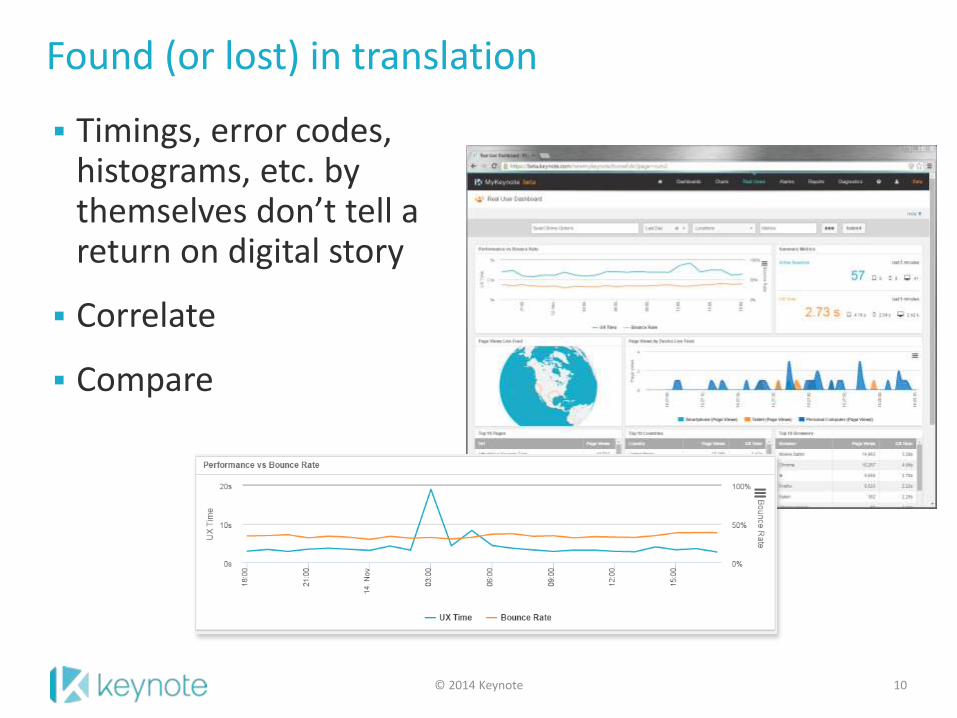
Found (or lost) in translation
© 2014 Keynote 10
Timings, error codes, histograms, etc. by themselves don’t tell a return on digital story
Correlate
Compare
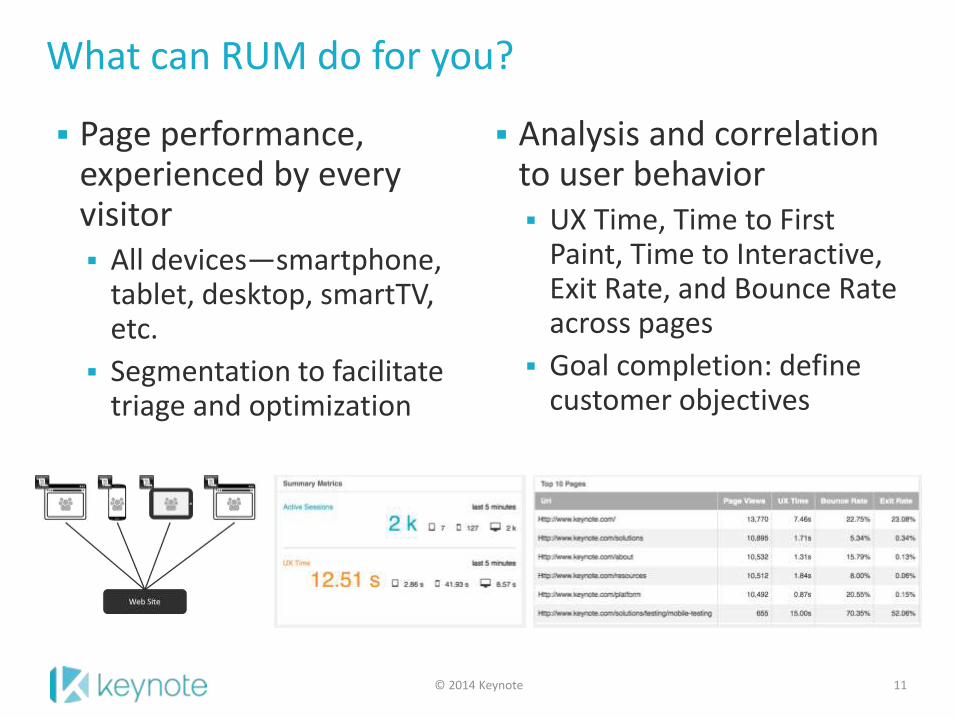
What can RUM do for you?
© 2014 Keynote 11
Page performance, experienced by every visitor All devices—smartphone,
tablet, desktop, smartTV, etc.
Segmentation to facilitate triage and optimization
Analysis and correlation to user behavior UX Time, Time to First
Paint, Time to Interactive, Exit Rate, and Bounce Rate across pages
Goal completion: define customer objectives
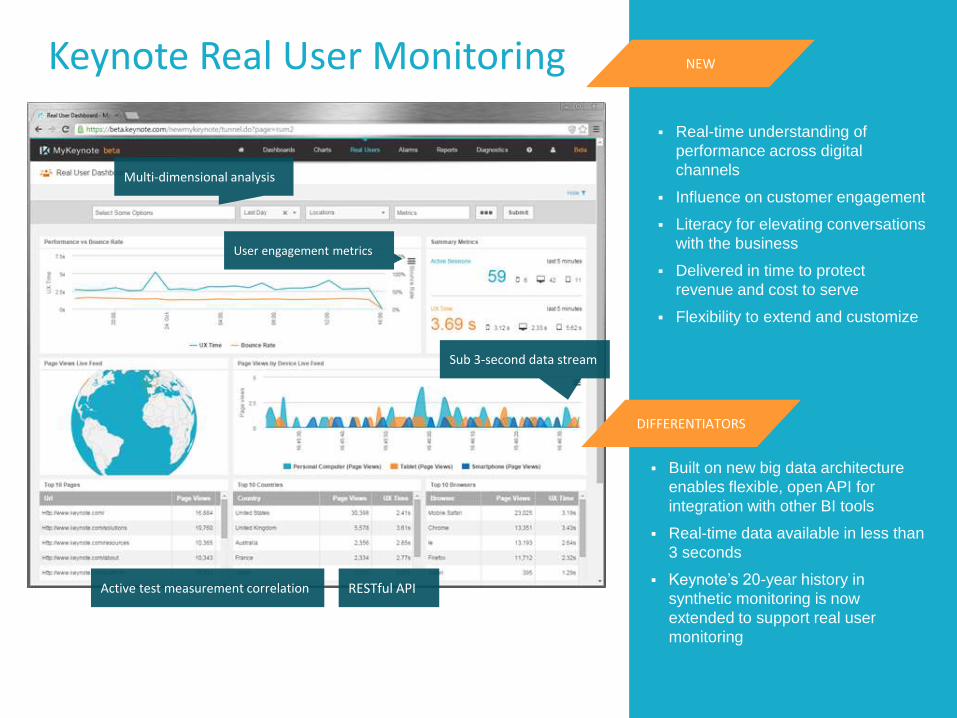
Keynote Real User Monitoring
Sub 3-second data stream
User engagement metrics
Active test measurement correlation
Multi-dimensional analysis
RESTful API
Real-time understanding of
performance across digital
channels
Influence on customer engagement
Literacy for elevating conversations
with the business
Delivered in time to protect
revenue and cost to serve
Flexibility to extend and customize
NEW
DIFFERENTIATORS
Built on new big data architecture
enables flexible, open API for
integration with other BI tools
Real-time data available in less than
3 seconds
Keynote’s 20-year history in
synthetic monitoring is now
extended to support real user
monitoring
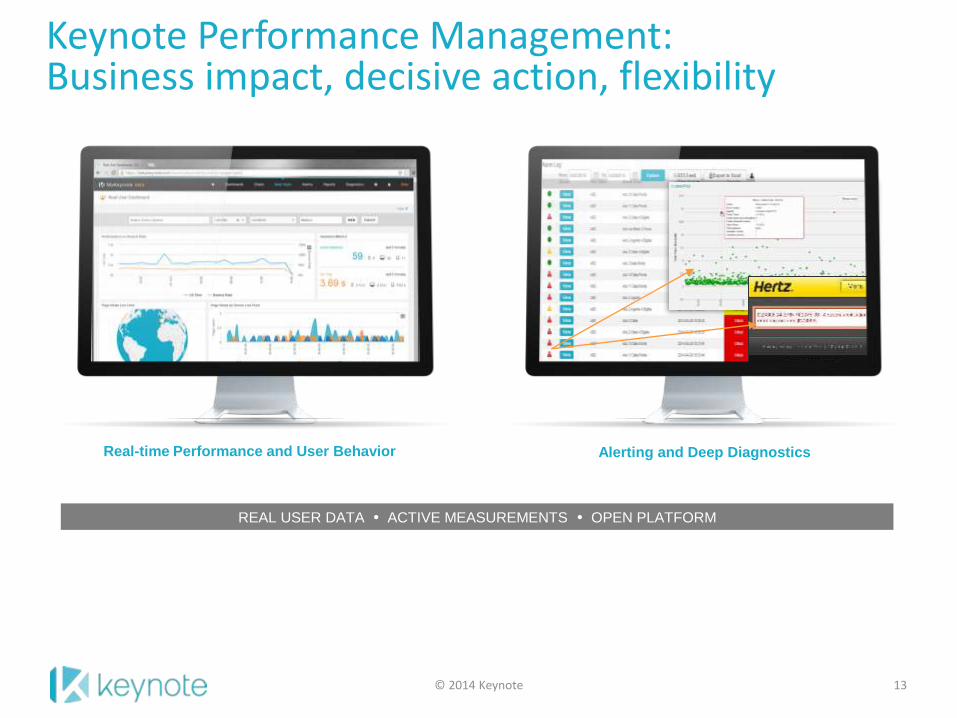
Keynote Performance Management: Business impact, decisive action, flexibility
© 2014 Keynote 13
Real-time Performance and User Behavior Alerting and Deep Diagnostics
REAL USER DATA ACTIVE MEASUREMENTS OPEN PLATFORM
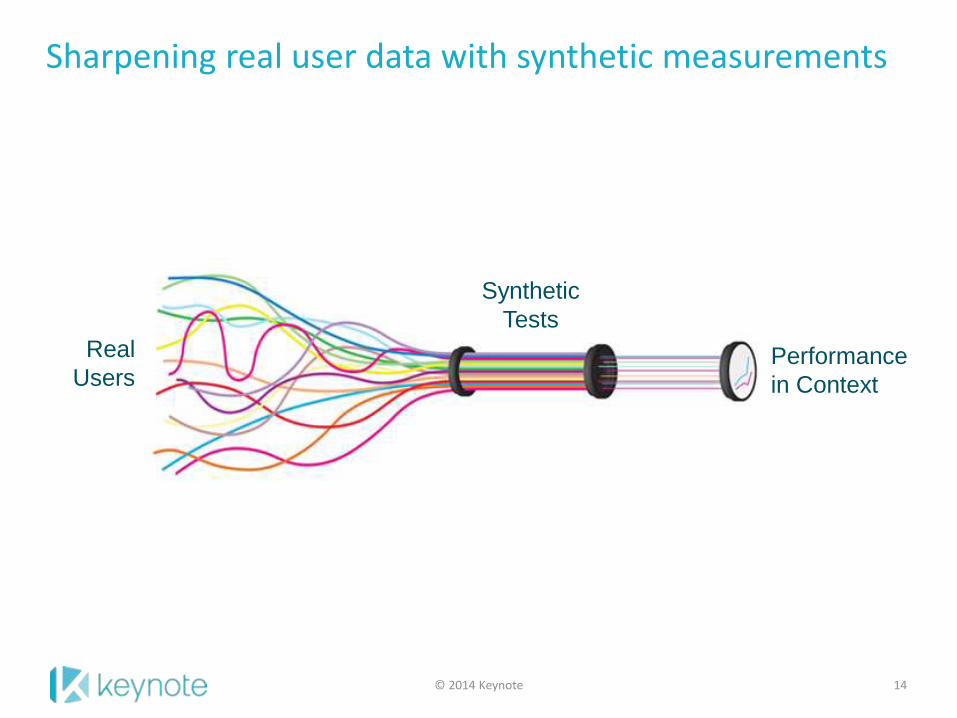
Sharpening real user data with synthetic measurements
© 2014 Keynote 14
Real
Users
Synthetic
Tests
Performance
in Context
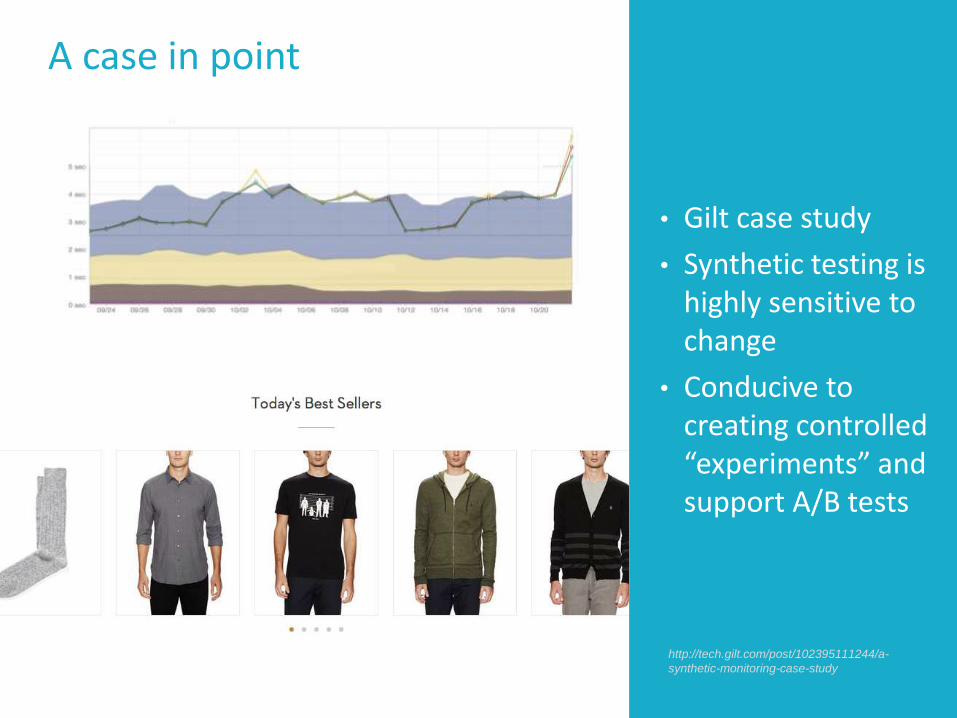
A case in point
• Gilt case study
• Synthetic testing is highly sensitive to change
• Conducive to creating controlled “experiments” and support A/B tests
http://tech.gilt.com/post/102395111244/a-
synthetic-monitoring-case-study
Elevate the conversation
© 2014 Keynote 16
Web performance isa key performance indicator…
In the context of influence oncustomer behavior
In the context of all digital channels
In the context of competitive alternatives
TARDIS-trans on en.wikipedia

Thank You!Please submit your questions in the Q & A panel now.
Learn more about Keynote Real User Monitoring by visiting keynote.com/solutions/monitoring/real-user-monitoring
Feedback and additional questions: [email protected]