Embed Size (px)
Citation preview

Where should we target Infection
and Treatment Method (ITM)
distribution? A GIS based approach applied to Kenya, Malawi, Tanzania
and Uganda
Jan 2012
Prepared by P. Ochungo, I. Baltenweck, H. Kiara, J. Poole and W. Theuri
(ILRI)

Background on East Coast Fever
East Coast Fever (ECF), also known as Theileriosis, is a devastating tick-borne disease in East, Central and Southern Africa, that puts 28 million cattle at risk of mortality and causes production losses to the tune of $121million per year (Mcleod &Randolph, 2000). It is caused by Theileria parva parasites and transmitted by the vector Rhipicephalus appendiculatus (brown ear) ticks.
It is the major cattle disease in the smallholder dairy and pastoral production systems in East Africa and is responsible for about 50% calf morbidity and 75% mortality (IFAD,2007).
Mortality rates due to ECF can be as high as 80 – 100% when introduced to susceptible cattle.
References:
McLeod, R. and Randolph, T.(2000). Product Development Plan: East Coast Fever Vaccine for Africa. Unpublished Report to the International Livestock Research Institute,
Nairobi, Kenya, 44 pp.
IFAD, (2007). Programme for Enhancing the Impact of Immunization Against East Coast Fever with an Improved Sub Unit Vaccine on the Smallholder Dairy Sector in Eastern
Africa [online]. Available at http://www.ifad.org/lrkm/tags/376.htm. [Accessed January 2012]
Map showing distribution of ECF in Africa

Preventive methods against ECF
Pros Method Cons
Acaricides – most common
preventive measure employed
in E Africa.
Easy to access
Relatively cheap per treatment
Resistance of ticks to acaricides.
Higher cost of newer acaricides
Environmental pollutants that may also
contaminate milk and meat.
Rearing of tick
resistant breeds
Controlled grazing – rotational
and zero grazing
ITM vaccination – Infection and
Treatment method. A vaccine
technology that was developed
over 30 years ago. Involves innoculating
live Theileria parva parasites into the
animal while simultaneously treating
with a long acting antibiotic.
Requires only one vaccination
in a lifetime.
Works effectively if used under
proper supervision.
Delivery of the technology is complex, requiring a ‘cold
chain’ infrastructure.
Relatively expensive.
Sources:
Minjaw, B & Mcleod, A. (2003) Tick Borne Diseases and Poverty.
Natural resistance to TBDs
Herd management problems can develop.
Labour and knowledge intensive
Not applicable everywhere.
Animals are not exposed
to TBDs
IFAD, (2007). Programme for Enhancing the Impact of Immunization Against East Coast Fever with an Improved Sub Unit Vaccine on the
Smallholder Dairy Sector in Eastern Africa [online]. Available at http://www.ifad.org/lrkm/tags/376.htm. [Accessed January 2012]
Disease resistant breeds often have
less productive traits so are less
preferred.
Long periods required to breed in
sufficient numbers.

A vet or Community Animal Health Worker Vaccinating
Tanzania Maasai animals against ECF

Objectives of the Study
To estimate spatially the number of cattle that can be
potentially vaccinated against ECF using ITM, and where
these cattle are. Current estimates are based on broad figures
of cattle population (irrespective of breed, ECF risk and
farming system).
This might guide GalvMed and commercial players in
identifying market demand for the vaccine.

Hypotheses
ECF being the single most important cattle disease, farmers
are likely to invest in order to prevent it.
Exotic cattle (pure or cross bred) are higher value and their
owners are more likely to invest in prevention.

Methodology
Cattle population
map
Farming systems
map
Breed
differentiated
map (local/
exotic cattle)
Step 1: Apply survey data or expert opinion data
to farming systems map to get proportions of breeds in herd
Step 2: Apply these proportions into cattle population
map to derive numbers of local/exotic cattle
Step 1: Deriving a breed differentiated map

Methodology
Step 2: Calculating number of cattle needing vaccination by
ITM
We use the following formula to calculate number of cattle needing ITM vaccination:
CattleITM= (ExoticCPop x 100% + IndigenousCPop x 30%) x ECF%
Where:
CattleITM is defined as the estimated number of heads of cattle to be ITM vaccinated per kmsq
in a specific location.
ExoticCpop = No. of exotic cattle in the herd
IndigenousCpop = No of indigenous cattle in the herd
ECF% = ECF risk%
Note: the weights on exotic and indigenous cattle were set at 100% and 30% respectively,
representing the estimated mortality rates due to ECF for these genotypes.
Assumption: farmers facing a x% mortality rate will vaccinate x% of their herd.
Countries: Kenya, Malawi, Tanzania and Uganda

Deriving cattle breeds using farming system maps –
Kenya and Uganda
Countr
y Farming system (S&S)
Local
cattle (%)
Crossbred
cattle (%)
Kenya LG – arid/ semi-arid 100 0
LG – humid/subhumid 100 0
LG- hyperarid 100 0
LG- temperate 100 0
MR- arid/ semi-arid 86.3 13.7
MR- humid/ subhumid 76.55 23.45
MR- temperate 38.05 61.95
Countr
y Farming system (S&S)
Local
cattle (%)
Crossbred cattle
(%)
Uganda LG- arid/ semi-arid 100 0
LG-humid/ subhumid 100 0
LG- hyperarid 100 0
LG-temperate 100 0
MR- arid/ semi-arid 86.3 13.7
MR- humid/subhumid 76.55 23.45
MR- temperate 38.05 61.95
Data source for MR systems: EADD Baseline survey, 2008- EADD sites are located only in MR systems. Data source for LG systems: Expert opinion. Farming systems: Global Sere and Steinfield, Version 4, 2000.
LG- Livestock only systems
MR- Mixed rainfed systems

Deriving cattle breeds using farming system maps –
Tanzania and Malawi
Country Farming system (S&S)
Local cattle
(%)
Crossbred
cattle (%)
Tanzania LG- arid/ semiarid 92.525 7.475
LG – humid/ subhumid 98.2 1.8
MR- arid/ semiarid 97.92857143 2.07142857
MR-arid/semiarid-LGP60 41.95 58.05
MR-humid/subhumid
LG60 98.16667 1.83333
Countr
y
Farming system
(S&S)
Local cattle
(%)
Crossbred cattle
(%)
Malawi LG- arid/ semiarid 100 0
LG-humid/subhumid 100 0
LG- temperate 100 0
MR-arid/ semiarid 99.9969 0.003067
Data source: Tanzania bureau of statistics,
2008
Data source: Chiwayula et.al., 2010 (FAO Repository documents) LG- Livestock only systems
MR- Mixed rainfed systems
Derived breed maps – Local cattle density
Cattle density Farming
systems with
% local cattle
Local cattle
density
Sources- Cattle density - Gridded Livestock Population
of The World (FAO, 2007); Farming Systems: Global
Sere and Steinfield Version 4, 2000.
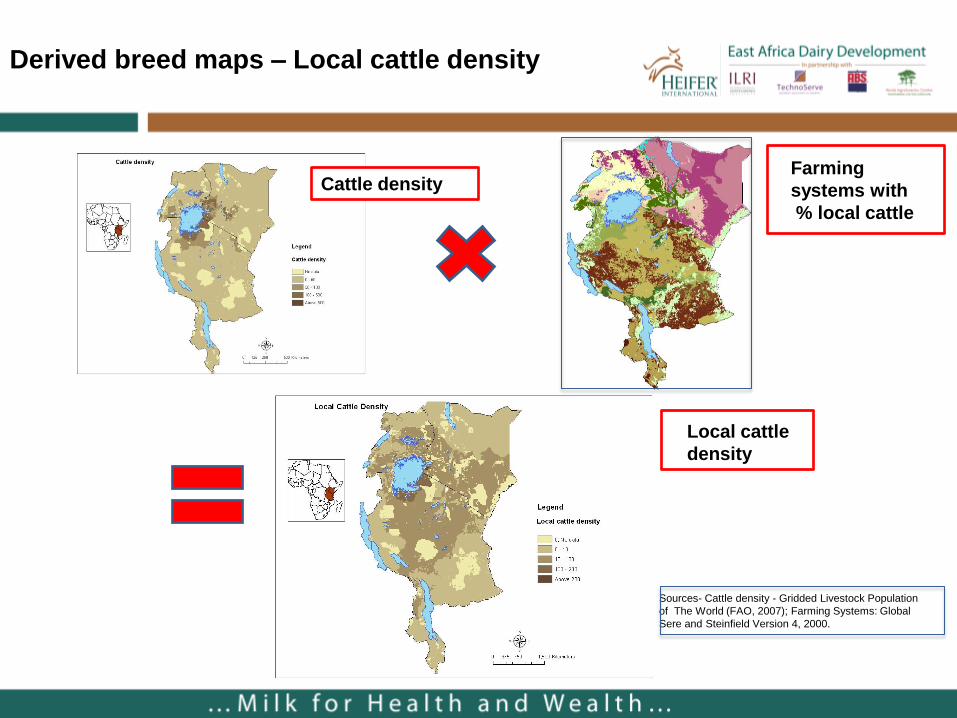
Derived breed maps – Exotic cattle density
Cattle density Farming
systems map
with % exotic
cattle
exotic cattle
density
Sources- Cattle density - Gridded Livestock Population
of The World (FAO, 2007); Farming Systems: Sere and
Steinfield V4

ECF Risk Map
Values in the map represent probability of disease occurrence
ECF Risk map:
• Based on predicted values of habitat
suitability for Rhipicephalus
appendiculatus.
• Predictions based on a logistic
regression of reported presence/
absence of tick species against 49
remotely sensed & interpolated
environmental variables.
Pros of this map
• presents a good estimate of areas at
risk from ECF disease
Cons of this map
• based on presence/ absence
of tick whereas abundance of
vectors should also be
considered.
• probability of ECF risk is poorly
correlated with farmers perception
of disease risk.
Source: Minjaw, B & Mcleod, A. (2003) Tick Borne Diseases and Poverty. The impact of ticks and tiick borne diseases on the livelihood of small scale
and marginal livestock owners in India and eastern and southern Africa. Research report, DFID Animal Health Programme, Centre for Tropical Veteri-
nary Medicine, University of Edinburgh, UK.

Approach for generating the map showing
potential number of cattle needing ITM
vaccination
Local cattle
density 30%
Breed maps were weighted according to the formula
and then multiplied by ECF risk map
Exotic cattle
density 100%
ECF
Risk
CattleITM
Numbers of cattle requiring ITM vaccination were then
calculated from this map, at country level and then at province/
region level.

CattleITM map (Total numbers of animals):
Potential density of cattle to be vaccinated using ITM
The resulting map shows numbers of cattle that can be potentially vaccinated against ITM
154,976
4,884,543
1,836,925
4,519,803

Summaries of numbers of cattle to vaccinated by
administrative region/province
Kenya
Uganda
Malawi
Tanzania
Source: CattleITM map

Conclusions and way forward
■ The largest demand is in Tanzania (42%) with 2 main zones (Central and the Lake region) although the demand is relatively dispersed, making set up of distribution networks more complex
■ The demand is more concentrated in Kenya (Central and Western regions) and Uganda (Eastern and Western regions) where ECF risk is relatively high and exotic cattle are kept
■ Given the paucity of spatially distributed data, these results are based on assumptions that can be modified if more reliable data become available.
■ We didn’t take into account feeding system (open grazing versus stall feeding where risk of ECF may be lower due to lower exposure to ticks) due to data unavailability for all the systems and countries under consideration.
■ Despite these limitations, these results can guide scale and targeting of distribution networks of the ITM vaccine in East Africa

Contacts
For More Information, please contact:
Pamela Ochungo,
Isabelle Baltenweck,