Embed Size (px)
Citation preview
ECONOMIC IMPACTS OF TRANSFRONTIER
CONSERVATION AREAS:
BASELINE OF TOURISM IN THE
KAVANGO–ZAMBEZI TFCA
Helen Suich, Jonah Busch and Nathalie Barbancho
Paper No. 4
2005
Table of contents
EXECUTIVE SUMMARY....................................................................................................................... 1 1. INTRODUCTION ...................................................................................................................... 2
1.1 The proposed Kavango–Zambezi TFCA....................................................................... 4
2. METHODOLOGY..................................................................................................................... 5 3. RESULTS................................................................................................................................. 9
3.1 Accommodation, northern Botswana............................................................................ 9 3.2 Accommodation, Livingstone, Zambia........................................................................ 13 3.3 Large hotels, Victoria Falls, Zimbabwe...................................................................... 19 3.4 Accommodation, Upper Zambezi, Zambia.................................................................. 22 3.5 Accommodation, Caprivi, Namibia............................................................................. 27 3.6 Accommodation, Kavango–Zambezi TFCA................................................................ 31 3.7 Tour operators, northern Botswana ........................................................................... 34 3.8 Tour operators, Livingstone, Zambia ......................................................................... 38 3.9 Tour operators, Kavango–Zambezi TFCA.................................................................. 41 3.10 Summary of tourism activity in the Kavango–Zambezi TFCA.................................... 43
4. DISCUSSION.......................................................................................................................... 45 4.1 Sustainable tourism..................................................................................................... 46 4.2 Additional challenges.................................................................................................. 50
5. CONCLUSION........................................................................................................................ 51 REFERENCES.................................................................................................................................... 53 APPENDIX 1 ACCOMMODATION ESTABLISHMENT SURVEY ............................................................ 55 APPENDIX 2 TOUR OPERATOR SURVEY ........................................................................................... 59 APPENDIX 3 TOURISM BUSINESS INVENTORY ................................................................................. 63
List of tables, figures and maps Map 1 The proposed Kavango–Zambezi TFCA region................................................................................................... 6 Figure 1 Opening date of northern Botswana Establishments (n=20) ............................................................................ 11 Figure 2 Opening date of Livingstone establishments (n=42) ........................................................................................ 16 Figure 3 Opening date of Upper Zambezi establishments (n=16) .................................................................................. 24 Figure 4 Opening date of Caprivi establishments (n=26) ............................................................................................... 28 Figure 5 Opening date of establishments in the KAZA TFCA region............................................................................ 32 Figure 6 Opening date of tour operators in the KAZA TFCA region............................................................................. 42 Table 1 Sample and population size of establishments open in 2004 surveyed, by region, 2004.................................... 7 Table 2 Exchange rates for the period 1 January to 31 December, 2004......................................................................... 8 Table 3 Capacity per night of northern Botswana establishments, 2004 .......................................................................... 9 Table 4 Share of accommodation sector by ownership type, northern Botswana, 2004................................................. 10 Table 5 Share of accommodation sector by owners residence and ethnicity, northern Botswana, 2004........................ 10 Table 6 Origin of guests, northern Botswana, 2004 ...................................................................................................... 10 Table 7 Guests by category, northern Botswana, 2004................................................................................................... 10 Table 8 Method of booking accommodation, northern Botswana, 2004 ........................................................................ 10 Table 9 Revenue and operating expenditures (’000s), northern Botswana, 2004........................................................... 11 Table 10 Employment in accommodation establishments, northern Botswana, 2004.................................................... 12 Table 11 Local financial impacts of accommodation establishments (’000s), northern Botswana, 2004 ...................... 12 Table 12 Source of knowledge of KAZA TFCA, northern Botswana, 2005.................................................................. 12 Table 13 Expected effect on business by KAZA TFCA, northern Botswana, 2005....................................................... 13 Table 14 Potential activities with KAZA TFCA, northern Botswana, 2005 .................................................................. 13 Table 15 Expected effect of KAZA TFCA on park resource quality, northern Botswana, 2005 ................................... 13 Table 16 Capacity per night of Livingstone guesthouses, 2004 ..................................................................................... 14 Table 17 Capacity of Livingstone non-guesthouses, 2004 ............................................................................................. 14 Table 18 Share of accommodation sector by ownership type, Livingstone, 2004.......................................................... 14 Table 19 Share of accommodation sector by owner residence and ethnicity, Livingstone, 2004................................... 15 Table 20 Origin of guests, Livingstone, 2004................................................................................................................. 15 Table 21 Guests by category, Livingstone, 2004............................................................................................................ 15 Table 22 Method of booking accommodation, Livingstone, 2004 ................................................................................. 16 Table 23 Revenue and operating expenditures (’000s), Livingstone guest houses, 2004............................................... 16
Table 24 Revenue and operating expenditures (’000s), Livingstone non-guest houses, 2004 ....................................... 17 Table 25 Revenue and operating expenditures (’000s), Livingstone all establishments, 2004....................................... 17 Table 26 Employment in Livingstone guest houses, 2004 ............................................................................................. 17 Table 27 Employment in Livingstone non-guest houses, 2004 ...................................................................................... 17 Table 28 Local financial impacts of accommodation establishments (’000s), Livingstone, 2004 ................................. 18 Table 29 Source of knowledge of KAZA TFCA, Livingstone, 2005 ............................................................................. 18 Table 30 Expected effect on business by KAZA TFCA, Livingstone, 2005.................................................................. 18 Table 31 Potential activities with KAZA TFCA, Livingstone, 2005.............................................................................. 19 Table 32 Expected effect of KAZA TFCA on park resource quality, Livingstone, 2005 .............................................. 19 Table 33 Capacity per night of large hotels, Victoria Falls, 2004 .................................................................................. 20 Table 34 Share of accommodation sector by ownership type, Victoria Falls, 2004 ....................................................... 20 Table 35 Share of accommodation sector by owners residence and ethnicity, Victoria Falls, 2004 .............................. 20 Table 36 Origin of guests, Victoria Falls, 2004.............................................................................................................. 20 Table 37 Guests by category, Victoria Falls, 2004 ......................................................................................................... 20 Table 38 Method of booking accommodation, Victoria Falls, 2004 .............................................................................. 21 Table 39 Revenue and operating expenditures (’000s), Victoria Falls, 2004 ................................................................. 21 Table 40 Employment in accommodation establishments, Victoria Falls, 2004 ............................................................ 21 Table 41 Local financial impacts of accommodation establishments (’000s), Victoria Falls, 2004............................... 21 Table 42 Source of knowledge of KAZA TFCA, Victoria Falls, 2005 .......................................................................... 22 Table 43 Expected effect on business by KAZA TFCA, Victoria Falls, 2005 ............................................................... 22 Table 44 Potential activities with KAZA TFCA, Victoria Falls, 2005........................................................................... 22 Table 45 Expected effect of KAZA TFCA on park resource quality, Victoria Falls, 2005............................................ 22 Table 46 Capacity of Upper Zambezi establishments, 2004........................................................................................... 23 Table 47 Share of accommodation sector by ownership type, Upper Zambezi, 2004.................................................... 23 Table 48 Share of accommodation sector by owner residence and ethnicity, Upper Zambezi, 2004............................. 23 Table 49 Origin of guests, Upper Zambezi, 2004........................................................................................................... 23 Table 50 Guests by category, Upper Zambezi, 2004...................................................................................................... 23 Table 51 Method of booking, Upper Zambezi, 2004...................................................................................................... 24 Table 52 Revenue and operating expenditures (’000s), Upper Zambezi, 2004 .............................................................. 25 Table 53 Employment in accommodation establishments, Upper Zambezi, 2004 ......................................................... 25 Table 54 Local financial impacts of accommodation establishments (’000s), Upper Zambezi, 2004............................ 25 Table 55 Source of knowledge of KAZA TFCA, Upper Zambezi, 2005 ....................................................................... 26 Table 56 Expected effect on business by KAZA TFCA, Upper Zambezi, 2005 ............................................................ 26 Table 57 Potential activities with KAZA TFCA, Upper Zambezi, 2005........................................................................ 26 Table 58 Expected effect of KAZA TFCA on park resource quality, Upper Zambezi, 2005......................................... 26 Table 59 Capacity per night of Caprivi establishments, 2004 ........................................................................................ 27 Table 60 Share of accommodation sector by ownership type, Caprivi, 2004................................................................. 27 Table 61 Share of accommodation sector by owner residence and ethnicity, Caprivi, 2004.......................................... 27 Table 62 Origin of guests, Caprivi, 2004........................................................................................................................ 28 Table 63 Guests by category, Caprivi, 2004................................................................................................................... 28 Table 64 Method of booking accommodation, Caprivi, 2004 ........................................................................................ 28 Table 65 Revenue and operating expenditures (’000s), Caprivi, 2004........................................................................... 29 Table 66 Employment in accommodation establishments, Caprivi, 2004 ...................................................................... 29 Table 67 Local financial impacts of accommodation establishments (’000s), Caprivi, 2004......................................... 29 Table 68 Source of knowledge of KAZA TFCA, Caprivi, 2005 .................................................................................... 30 Table 69 Expected effect on business by KAZA TFCA, Caprivi, 2005......................................................................... 30 Table 70 Potential activities with KAZA TFCA, Caprivi, 2005..................................................................................... 30 Table 71 Expected effect of KAZA TFCA on park resource quality, Caprivi, 2005...................................................... 30 Table 72 Capacity of accommodation establishments, KAZA region, 2004.................................................................. 31 Table 73 Share of accommodation sector by ownership type, KAZA region, 2004....................................................... 31 Table 74 Share of accommodation sector by owner residence and ethnicity, KAZA region, 2004 ............................... 32 Table 75 Origin of guests, accommodation sector, KAZA region, 2004........................................................................ 32 Table 76 Guests by category, accommodation sector, KAZA region, 2004................................................................... 32 Table 77 Method of booking accommodation, KAZA region, 2004 .............................................................................. 32 Table 78 Revenue and operating expenditures, accommodation sector (’000s), KAZA region, 2004........................... 33 Table 79 Employment in accommodation establishments, KAZA region, 2004............................................................ 33 Table 80 Local financial impacts of accommodation establishments (’000s), KAZA region, 2004 .............................. 34 Table 81 Capacity of tour operations, northern Botswana, 2004.................................................................................... 35 Table 82 Share of tour sector by owner residence and ethnicity, northern Botswana, 2004 .......................................... 35 Table 83 Origin of tour operator guests, northern Botswana, 2004................................................................................ 35 Table 84 Tour purchaser by category, northern Botswana, 2004 ................................................................................... 35 Table 85 Method of booking tours, northern Botswana, 2004 ....................................................................................... 35 Table 86 Destinations of tours offered, northern Botswana, 2004.................................................................................. 35
Table 87 Revenue and operating expenditures, accommodation sector (’000s), northern Botswana, 2004................... 36 Table 88 Employment in the tour sector, northern Botswana, 2004............................................................................... 36 Table 89 Local financial impacts of the tour sector (’000s), northern Botswana, 2004 ................................................. 36 Table 90 Source of knowledge of KAZA TFCA, tour sector northern Botswana, 2005 ................................................ 37 Table 91 Expected effect on business by KAZA TFCA, tour sector northern Botswana, 2005..................................... 37 Table 92 Potential activities with KAZA TFCA, northern Botswana, 2005 .................................................................. 37 Table 93 Expected effect of KAZA TFCA on park resource quality, tour sector northern Botswana, 2005.................. 37 Table 94 Capacity of tour operations, Livingstone, 2004............................................................................................... 38 Table 95 Share of tour sector by owner residence and ethnicity, Livingstone, 2004...................................................... 38 Table 96 Origin of tour operator guests, Livingstone, 2004 ........................................................................................... 38 Table 97 Tour purchaser type, Livingstone, 2004 .......................................................................................................... 38 Table 98 Method of booking tours, Livingstone, 2004................................................................................................... 38 Table 99 Destinations of tours offered, Livingstone, 2004............................................................................................. 39 Table 100 Revenue and operating expenditures, accommodation sector (’000s), Livingstone, 2004 ............................ 39 Table 101 Employment in the tour sector, Livingstone, 2004........................................................................................ 39 Table 102 Local financial impacts of the tour sector (’000s), Livingstone, 2004........................................................... 40 Table 103 Source of knowledge of KAZA TFCA, tour sector Livingstone, 2005 ......................................................... 40 Table 104 Expected effect on business by KAZA TFCA, tour sector Livingstone, 2005 .............................................. 40 Table 105 Potential activities with KAZA TFCA, tour sector Livingstone, 2005.......................................................... 40 Table 106 Expected effect of KAZA TFCA on park resource quality, tour sector Livingstone, 2005........................... 40 Table 107 Capacity of operators, KAZA region, 2004................................................................................................... 41 Table 108 Share of tourism market by owner residence and ethnicity, KAZA region, 2004 ......................................... 41 Table 110 Origin of guests, KAZA region operators, 2004............................................................................................ 41 Table 111 Guests by category, KAZA region operators, 2004....................................................................................... 41 Table 112 Method of booking tours, KAZA region, 2004 ............................................................................................. 42 Table 113 Destination of tours, KAZA region, 2004...................................................................................................... 42 Table 114 Revenue and operating expenditures (’000s), KAZA region operators, 2004............................................... 42 Table 115 Employment in KAZA region operators, 2004.............................................................................................. 43 Table 116 Local financial impacts of tour operators (’000s), KAZA region, 2004........................................................ 43 Table 117 Share of tourism market by ownership type, total KAZA region, 2004 ........................................................ 43 Table 118 Share of tourism market by owner residence and ethnicity, total KAZA region, 2004 ................................. 44 Table 119 Revenue and operating expenditures (’000s), total KAZA region, 2004....................................................... 44 Table 120 Employment in total KAZA region, 2004 ..................................................................................................... 44 Table 121 Local financial impacts (’000s), total KAZA region, 2004 ........................................................................... 45
Acknowledgements
The authors gratefully acknowledge all survey respondents, whose participation made this work possible. In particular, thanks go to the Livingstone office of the Zambia National Tourism Board, the Victoria Falls Tourism Information Centre, Kasane office of the Botswana Ministry of Tourism, and Francois Viljoen of Open Africa. This publication was financed by the Swiss Agency for Development and Cooperation. Data collection and analysis was supported by the National Science Foundation under Grant No. 0114437.
Acronyms
BWP Botswana Pula FTE full time equivalent KAZA Kavango–Zambezi NAD Namibian Dollar OUZIT Okavango Upper Zambezi International Tourism initiative TFCA Transfrontier Conservation Area ZMK Zambian Kwacha ZNTB Zambia National Tourism Board ZWD Zimbabwean Dollar $US/USD United States Dollar
Tourism in the Kavango–Zambezi Transfrontier Conservation Area 1
EXECUTIVE SUMMARY The Kavango–Zambezi Transfrontier Conservation Area (KAZA TFCA) is a multi-objective
initiative involving parts of Angola, Botswana, Namibia, Zambia and Zimbabwe. The concept of a
major tourism destination based on the extensive network of protected areas and wildlife
populations has been discussed and developed over the last decade. Recently, the idea has been
revitalised by the ministers of those five countries, who seek to establish a world-class transfrontier
conservation area and tourism destination in the Okavango and Zambezi river basin regions of
those countries, within the context of sustainable development.
In recognition of the importance of tourism to the economic development objectives of TFCA
implementation, this study was undertaken to determine the current size of the tourism industry
within the KAZA TFCA, focussing on accommodation providers and tour operators. The survey was
conducted in northern Botswana, Livingstone, parts of Victoria Falls1, along the Upper Zambezi
and in Caprivi. Almost 60 per cent of accommodation establishments and almost 40 per cent of tour
operators that were trading in 2004 were surveyed. The research focuses only on direct impacts
only – that is, the economic activity generated by the activities of tourists. Indirect and induced
effects are expected to be relatively small in the region, which is characterised by a relatively non-diverse economy.
In 2004, accommodation establishments in the KAZA region had the capacity to house 8,312 guests
each night; the tour operators were able to host 2,926 guests per day. Of the available
accommodation capacity, 35 per cent was in Livingstone, 32 per cent in Victoria Falls, 17 in
northern Botswana, 12 per cent in Caprivi and just four per cent along the Upper Zambezi. It is
estimated that just over 318,640 guests spent one or more nights in the accommodation enterprises,
and 782,200 bednights were sold in the region. Livingstone made 39 per cent of total KAZA TFCA
sales, Victoria Falls made 25 per cent, northern Botswana made 23 per cent., Caprivi sold nine per
cent of total bednights and establishments along the Upper Zambezi sold the remaining four per
cent.
Just 34 per cent of tour operator capacity was found in northern Botswana, with 66 per cent in
Livingstone. Approximately 314,200 guests were taken on a tour by operators in 2004. Despite the
differences in capacity, sales were split evenly between operators in the two regions.
Total revenue generated by accommodation establishments and tour operations exceeded $US100
million in 2004. Accommodation establishments accounted for approximately 89 per cent of total
revenue generation in the KAZA TFCA. The sector generated approximately $US89.3 million in
that year. Accommodation services generated 64 per cent of total accommodation sector revenue,
restaurant and bar sales generated 31 per cent, four per cent was generated by tour services and
one per cent by ‘other’ (curio and shop sales, casino operations, golf courses, sales of firewood,
transfers and commissions on tour sales). 34 per cent of accommodation sector revenue was
generated in Victoria Falls, 28 per cent in Livingstone, 26 per cent in northern Botswana, and just
six per cent each in Caprivi and the Upper Zambezi.
Tour operators generated approximately $US10.8 million (11 per cent of total revenue). 96 per cent
of revenue earned was generated by sales of tours, with four per cent by sales of food and
beverages. Northern Botswana operators generated 64 per cent of total tour revenue, with
Livingstone generating the remaining 34 per cent.
1 Only the nine largest hotels in Victoria Falls were able to be sampled. No tour operators in Victoria Falls were
surveyed, so these results almost certainly underestimate the total importance of the town as a tourist hub.
Tourism in the Kavango–Zambezi Transfrontier Conservation Area 2
The accommodation sector provided 89 per cent (4,913) of employment, with the tour operators
providing the remaining 11 per cent (616). Within KAZA tourism businesses, local employees made
up 94 per cent of the total workforce, non-local national employees two per cent, KAZA employees
comprised one per cent, and expatriates made up the remaining three per cent of the workforce.
Total employment in surveyed establishments was reported to be 5,529.
In 2004, a total of 5,204 local workers, 689 of them in part-time jobs, were employed in the tourism
industry. Local wages paid as a proportion of the total wage and salary bill across the KAZA
region were just 73 per cent, despite 94 per cent of employees being locally employed. Across the
region and across both sectors, males make up 61 per cent of the local workforce, with 39 per cent
of positions filled by women. In the accommodation sector, women accounted for 38 per cent of the
local workforce; in the tour operator sector, they accounted for only 22 per cent of local employees.
Just 48 per cent of non-wage operating costs were spent locally across the whole region, though the
proportion varied massively between regions and enterprises. Only 20 per cent of the profit
generated in the industry was earned by local owners, and it is assumed that virtually all profit
made by corporate and foreign owned enterprises is remitted out of the KAZA TFCA (as
headquarters of these companies are outside the region). The combination of non-wage operating
costs made outside of KAZA, and remitted profits represent considerable leakages from the local
economy.
A summary of strategies which could be adopted to assist the KAZA TFCA maximise the local
economic benefits from tourism, based on the principles of sustainable tourism, is presented. Such
strategies could include increasing local employment, improving the skills of local employees,
increasing the number of local enterprise owners, improving the financial sustainability of local
tourism enterprises and supporting joint venture partnerships between the private sector and rural
communities. Increasing local procurement, ensuring the equitable distribution of benefits,
mitigating the costs facing rural communities living with wildlife and ensuring the provision of
appropriate infrastructure and services will also be important components of a benefit maximising
strategy. A number of challenges facing policy makers have also been identified – including those
relating to policy harmonisation, ensuring the meaningful participation of rural communities in
planning and decision making processes, and ensuring that some of the financial resources
generated by tourism contribute to the costs of managing the wildlife populations and protected
areas that are essential to the sustainability of the tourism industry in the KAZA TFCA.
1. INTRODUCTION Transfrontier conservation areas (TFCAs) are areas of land and/or sea that straddle international (or sub-national) borders, that are jointly or cooperatively managed for conservation and/or sustainable natural resource utilisation. The concept recognises that borders are political rather than ecological, and aim to ensure that key ecological processes continue to function where borders have divided ecosystems, river basins and/or wildlife migration routes. The ecological rationale associated with transfrontier conservation areas is very similar to that of simply increasing land area under sustainable management, but TFCAs attempt to improve the cooperative management of shared resources, increase the area available for wildlife and plant populations (reducing their vulnerability to shocks) and re-establish migratory routes that may have been disrupted by a lack of coordinated management between countries. TFCAs are also said to improve the livelihoods of communities whose traditional lands have been divided by international boundaries, particularly through the facilitation of the resumption and/or legalisation of cross border movements (in order, partly, to support cultural ties and traditions). Finally, cross border cooperation is thought to increase the efficiency of monitoring and managing natural resources, reduce and/or eliminate duplication of efforts, and create economies of scale, as well as enhance
Tourism in the Kavango–Zambezi Transfrontier Conservation Area 3
economic opportunities (e.g. through increased tourism potential and revenues) as the economic basis for TFCAs (Singh, 1999; DN-Consult, 2004). In southern Africa, 22 sites have been identified as having the potential to become a transfrontier park2 or TFCA (Hall-Martin and Modise, 2002). These initiatives are being given increasing support from a wide range of stakeholders including local and national governments, NGOs and donor agencies, and have been endorsed by both the New Partnership for African Development and the Southern African Development Community, as instruments that can contribute to local economic development, regional integration and cooperation, and poverty alleviation through biodiversity conservation activities (SADC, 1999; NEPAD, 2001). Indeed, all of the international agreements relating to transfrontier parks and TFCAs so far in southern Africa refer specifically to tourism (implying nature-based tourism rather than stating it specifically) as a means to achieve economic development and poverty alleviation objectives, as can be seen from the following statements3 drawn from official agreements regarding transfrontier parks and TFCAs:
‘… to encourage the potential of the Parks and surrounding areas which will
bring economic benefits to the Republic of Botswana and the Republic of
South Africa, especially to the local communities adjacent to the Park …’4
‘… to develop an integrated community-based conservation and
development programme … to facilitate a sustainable (including
environmental, social and economic sustainability) nature conservation
development and ecotourism investment programme based on the natural,
social and cultural resources of the area … to facilitate cooperation between
Lesotho and South Africa on sustainable development …’5
‘… to facilitate the establishment and maintenance of a sustainable
sub-regional economic base through appropriate development frameworks,
strategies and workplans … to develop trans-border eco-tourism as a means
of fostering regional socio-economic development …’6
It can be seen that these strategies are extremely broad, and heavily dependent on increasing the size of the local tourism industry as the means of improving local economic development, and unfortunately these objectives are rarely supported by any detailed means to achieve them. Further, the empirical evidence to support the hypothesis that tourism will contribute significantly to economic development and poverty alleviation within TFCAs is not yet available. The purpose of this paper is to provide a baseline of the tourism industry in the proposed Kavango-Zambezi Transfrontier Conservation Area (KAZA TFCA), as part of a long-run monitoring programme to determine the economic impacts of transfrontier conservation areas. KAZA is one of two study sites – the other being the proposed Greater !Gariep TFCA shared between Namibia and South Africa. The KAZA initiative involves five countries – Angola, Botswana, Namibia, Zambia and Zimbabwe – and has a long history, beginning in the early 1990s, but receiving recent impetus to move the process forward.
2 A transfrontier park typically only includes state protected areas, thus differing from TFCAs which can include a
variety of conservation and multiple use areas under different land tenures – including state protected areas, game and wildlife management areas, forest reserves, community and private conservation areas, etc.
3 To date, all of the transfrontier park/conservation area treaties signed in southern Africa have involved South Africa as one of the partner countries.
4 Government of the Republic of Botswana/Government of the Republic of South Africa, 1999. 5 Government of the Kingdom of Lesotho/ Government of the Republic of South Africa, 2001. 6 Government of the Republic of Mozambique/ Government of the Republic of South Africa/ Government of the
Republic of Zimbabwe, 2002; Government of the Republic of Namibia/ Government of the Republic of South Africa, 2003.
Tourism in the Kavango–Zambezi Transfrontier Conservation Area 4
1.1 The proposed Kavango–Zambezi TFCA The concept of a Southern African Wildlife Sanctuary was presented at a Regional Workshop on Water Resource Management as long ago as 1993. The idea was then taken up by the Development Bank of Southern Africa as part of their Spatial Development Initiatives, in partnership with the Regional Tourism Organisation of Southern Africa, who transformed it into the Okavango Upper Zambezi International Tourism Initiative (OUZIT), publishing a preliminary project scan in 1999. The OUZIT initiative was conceived as an opportunity for the five countries to take advantage of the regions’ network of protected areas, wildlife and natural resources and cultural heritage to become one of the premier eco-, cultural and adventure tourism destinations in the world. It was also seen as a useful vehicle to facilitate infrastructure development and rural investment in the region. The initiative was based almost entirely on tourism growth and development, integrating conservation activities in order to protect the sources and wetlands of water systems falling within the region – primarily the Okavango, Zambezi and the Kwando/Linyanti/Chobe systems (DN-Consult, 1999). These initiatives both focussed on the ‘four corners’ region (the point at which Botswana, Namibia, Zambia and Zimbabwe meet, around Impalila Island in Namibia), and included Angola because of its importance as the source of most of the regions’ rivers. The OUZIT concept was then linked with similar initiatives on both the Indian and Atlantic coasts to form the expanded OUZIT, which was agreed to in 2001 by the Southern African Development Community tourism ministers. A number of transboundary natural resource management programmes were undertaken in this time, though the agreement by tourism ministers in 2001 did not give the expanded OUZIT the jump-start they had hoped for, in terms of planning and implementation of activities. After several years of limited activity relating to OUZIT, the five original governments undertook to move forward, and in July 2003 their tourism ministers held a meeting where they agreed to ‘revitalise’ the idea, and ‘seize the golden opportunity to take complete ownership … to sharpen its focus so that it can complement the socio-economic development efforts of … respective countries’ (Hon. S Nujoma, President of Namibia, 2003). President Nujoma also called upon the countries represented at the meeting to ‘promote cooperation in order to strengthen the management strategies of natural resources to enhance economic development of countries.’ (2003). At that meeting, the Ministers clarified the purpose of the TFCA as seeking to ‘establish a world-class transfrontier conservation area and tourism destination in the Okavango and Zambezi river basin regions of Angola, Botswana, Namibia, Zambia and Zimbabwe within the context of sustainable development’. Seven key elements were outlined as crucial to the success of the KAZA TFCA: 1. securing and improving the management of the natural resource base; 2. collaborative management planning toward harmonised land use, including a joint inventory of
resources, monitoring and research; 3. adjustment of policy and legal frameworks as required; 4. active support for sustainable tourism development, i.e. ecologically and socio-economically
sustainable tourism; 5. creating a framework for public and private sector investment and community participation in
tourism and other economic activities based on the natural resources of the area; 6. establishing institutional mechanisms to coordinate and facilitate the implementation of the
initiative by the five countries; 7. a programme to identify and mobilise resources (financial support and human resources) to
achieve the overall objective of the initiative (Anon., n.d.).
Tourism in the Kavango–Zambezi Transfrontier Conservation Area 5
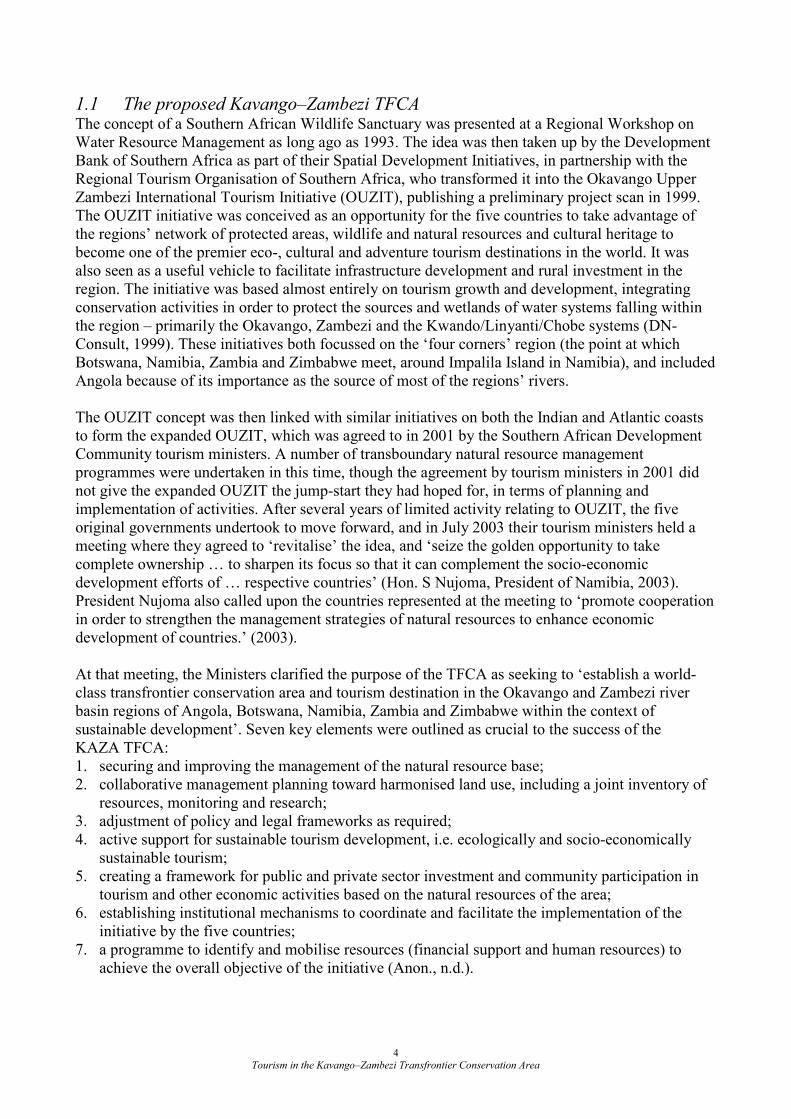
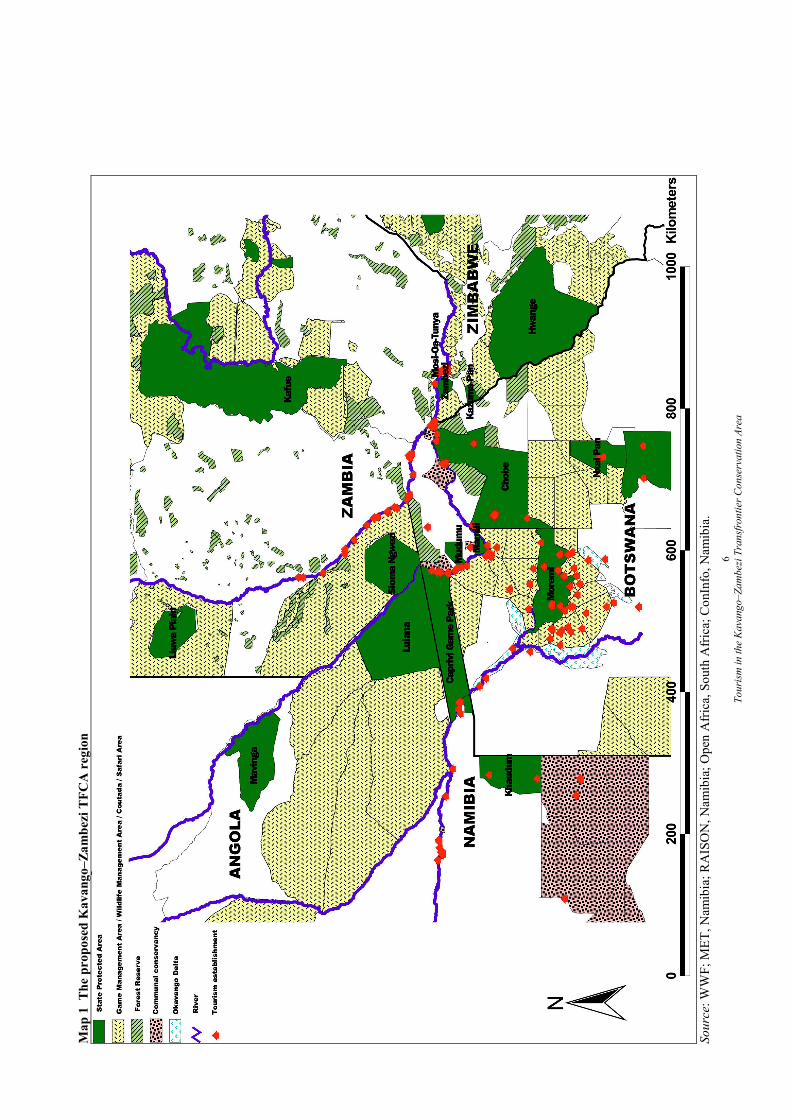
The basis for future tourism developments are the many natural assets – encompassing terrestrial wildlife populations of international importance (including the largest contiguous population of elephants on the continent (Hanks, 2005)), the Victoria Falls, the Okavango Delta, the Zambezi, Chobe–Linyanti, Kwando and Cuito river systems, considerable cultural diversity, many historical attractions, as well as high potential for developing and diversifying adventure- and water-based tourism activities. A lengthy description of the tourism attractions and the biodiversity value of the region will not be provided in this report as they are both comprehensively covered elsewhere (see Perkins, 2005; Hanks, 2005; DN-Consult, 2004; Hall-Martin and Modise, 2002; DHV Consultants, 1999). Though the proposed area of the TFCA is not finalised, it is likely to include, in Botswana, the Okavango Delta, the Chobe system; in Zambia, Kafue, Sioma Ngwezi and Mosi-oa-Tunya National Parks, the West Zambezi game management area; in Zimbabwe Hwange, Zambezi, Victoria Falls and Kazuma Pan National Parks; in Angola, the Luiana Partial Reserve, the Mukosso, Luenge, Luiana and Longa-Mavinga Coutadas; in Namibia, the Caprivi Game Reserve, Mudumu and Mamili National Parks, the Caprivi State Forest, community conservancies; and other land to be determined by the migratory movement of wildlife (see Map 1) (Anon., n.d.). Recognising the perceived importance of tourism to the economic development objectives of TFCA implementation, this study has focussed on determining the current level of tourism characteristic products7 provided from within the region – including accommodation providers (including their additional services such as restaurants and bars, tours, etc.) and tour operators acting independently from hotels/lodges in the region. The methodology of the surveys, and their subsequent analysis used in this study is outlined in the next section, followed by the presentation of the survey results. Implications and impacts of these results are discussed in Section 4, followed by the conclusions drawn.
2. METHODOLOGY Due to the absence of recently available (and reliable) information regarding the tourism industry for the KAZA region, this research was designed to determine the level of characteristic tourism products provided within the region for the calendar year of 2004. The range of establishments surveyed included both accommodation providers (covering aspects of their additional services including restaurants and bars, tours, etc.) and independent tour operators in the region. Other usual tourism characteristic products were not considered, as very few are provided by operators within the region, and thus much of their economic impact would be felt either at national level rather than within the KAZA region specifically, or would leak out of southern Africa altogether. The questionnaires (see Appendices 1 and 2) were developed based on an earlier questionnaire used in a similar project in the proposed Greater !Gariep TFCA region. Several aspects were covered in the survey – the type of business (e.g. capacity, origin of guests, type of ownership, owner residence and ethnicity), the financial aspects of the business, and employment in the industry. A section of the survey was designed to determine the initial knowledge and impressions of industry participants regarding the KAZA TFCA and the opportunities it may offer. An inventory of all accommodation establishments and tour operators was compiled for each region of the study area (see Appendix 3). Sources for this inventory included national tourism bureaux, tourist information centres, business directories and guidebooks. These inventories were extensively updated to remove defunct businesses, include newly opened operations and combine businesses (especially tour operations) operating under multiple names. Using this inventory, the survey team intended to survey each establishment that was operational during the 2004 calendar year.
7 Tourism characteristic products as defined by the UN et al., are ‘those products which in most countries would
cease to exist in meaningful quantities, or those for which the level of consumption would be significantly reduced in the absence of visitors’ (2000:35).
Tourism
in the Kavango–Zambezi Transfrontier Conservation Area
6
Map 1
The
pro
pose
d K
avango–Zam
bez
i TFC
A r
egio
n
Source: W
WF; M
ET, Nam
ibia; RAIS
ON, Nam
ibia; Open
Africa, South A
frica; C
onInfo, Nam
ibia.
Tourism in the Kavango–Zambezi Transfrontier Conservation Area 7
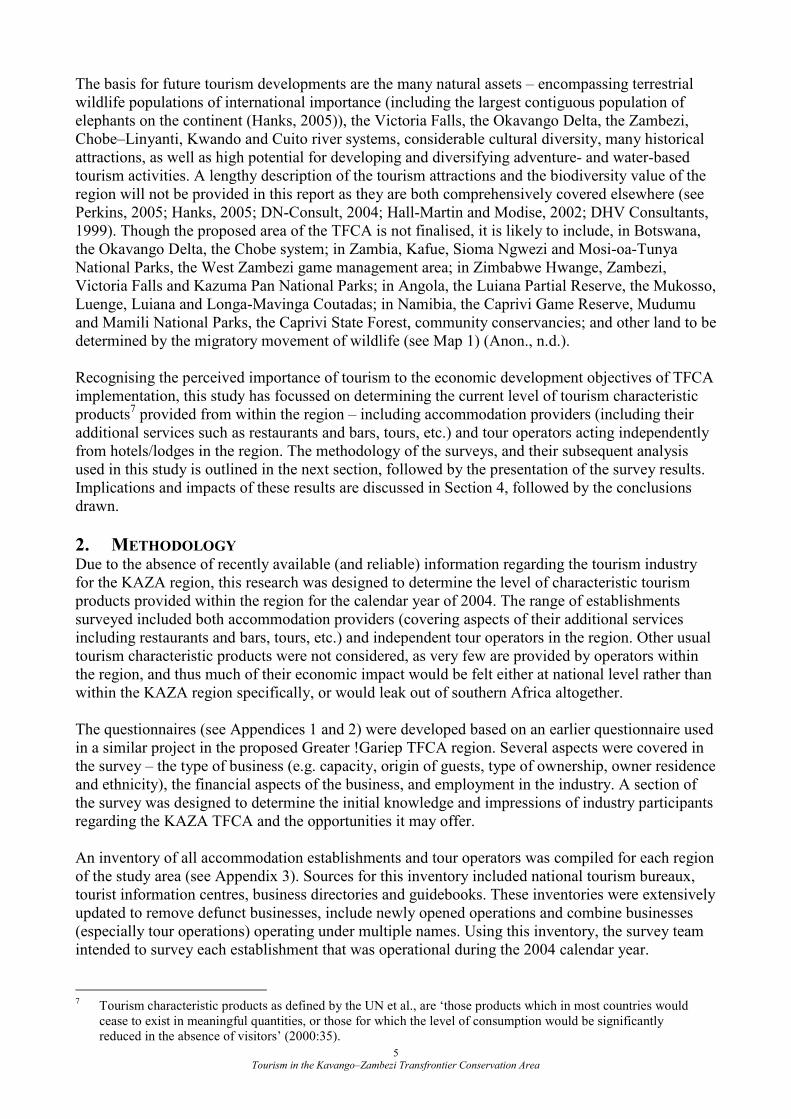
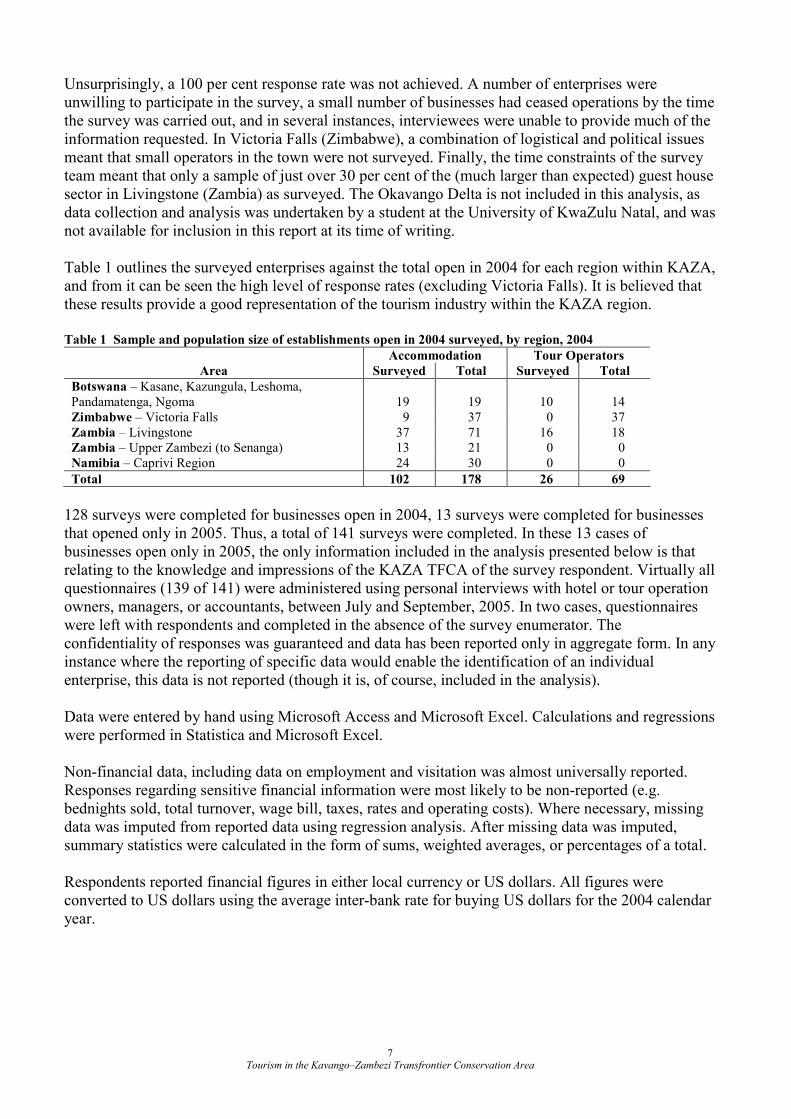
Unsurprisingly, a 100 per cent response rate was not achieved. A number of enterprises were unwilling to participate in the survey, a small number of businesses had ceased operations by the time the survey was carried out, and in several instances, interviewees were unable to provide much of the information requested. In Victoria Falls (Zimbabwe), a combination of logistical and political issues meant that small operators in the town were not surveyed. Finally, the time constraints of the survey team meant that only a sample of just over 30 per cent of the (much larger than expected) guest house sector in Livingstone (Zambia) as surveyed. The Okavango Delta is not included in this analysis, as data collection and analysis was undertaken by a student at the University of KwaZulu Natal, and was not available for inclusion in this report at its time of writing. Table 1 outlines the surveyed enterprises against the total open in 2004 for each region within KAZA, and from it can be seen the high level of response rates (excluding Victoria Falls). It is believed that these results provide a good representation of the tourism industry within the KAZA region. Table 1 Sample and population size of establishments open in 2004 surveyed, by region, 2004
Accommodation Tour Operators
Area Surveyed Total Surveyed Total
Botswana – Kasane, Kazungula, Leshoma, Pandamatenga, Ngoma
19
19
10
14
Zimbabwe – Victoria Falls 9 37 0 37 Zambia – Livingstone 37 71 16 18 Zambia – Upper Zambezi (to Senanga) 13 21 0 0 Namibia – Caprivi Region 24 30 0 0
Total 102 178 26 69
128 surveys were completed for businesses open in 2004, 13 surveys were completed for businesses that opened only in 2005. Thus, a total of 141 surveys were completed. In these 13 cases of businesses open only in 2005, the only information included in the analysis presented below is that relating to the knowledge and impressions of the KAZA TFCA of the survey respondent. Virtually all questionnaires (139 of 141) were administered using personal interviews with hotel or tour operation owners, managers, or accountants, between July and September, 2005. In two cases, questionnaires were left with respondents and completed in the absence of the survey enumerator. The confidentiality of responses was guaranteed and data has been reported only in aggregate form. In any instance where the reporting of specific data would enable the identification of an individual enterprise, this data is not reported (though it is, of course, included in the analysis). Data were entered by hand using Microsoft Access and Microsoft Excel. Calculations and regressions were performed in Statistica and Microsoft Excel. Non-financial data, including data on employment and visitation was almost universally reported. Responses regarding sensitive financial information were most likely to be non-reported (e.g. bednights sold, total turnover, wage bill, taxes, rates and operating costs). Where necessary, missing data was imputed from reported data using regression analysis. After missing data was imputed, summary statistics were calculated in the form of sums, weighted averages, or percentages of a total. Respondents reported financial figures in either local currency or US dollars. All figures were converted to US dollars using the average inter-bank rate for buying US dollars for the 2004 calendar year.
Tourism in the Kavango–Zambezi Transfrontier Conservation Area 8
Table 2 Exchange rates for the period 1 January to 31 December, 2004
Currency converted $US conversion
rate
1 Botswana Pula (BWP) 0.21404 1 Namibia Dollar (NAD) 0.15837 1 South African Rand (ZAR) 0.15621 1 Zambian Kwacha (ZMK) 0.00021 1 Zimbabwe Dollar (ZWD) 0.00036
Source: www.oanda.com/convert/fxhistory
Conversions of Zimbabwean dollars to and from US dollars was especially problematic given the unstable nature of that currency over the study period, combined with the vast differences between the official and unofficial exchange rates which introduced an unavoidable source of imprecision to Zimbabwean financial results. The only instance where results were not analysed uniformly was in the guest house sector in Livingstone, Zambia. Of the 60 establishments classified by the Zambia National Tourism Board (ZNTB) as guesthouses, 19 were surveyed (32 per cent). Results from those surveyed were extrapolated across the whole sector, based on the assumption that the non-surveyed guesthouses had the same mean and distribution of rooms, employees, turnover, and other statistics, as the surveyed guesthouses. There is a possibility that variance in the total pool of 60 guesthouses was not accurately captured by the sample of 19 guesthouses, but it is believed that the sector is sufficiently homogenous to make this variance minimal. This study focuses only on direct impacts, that is the economic activity generated directly by the activities of tourists. Indirect and induced effects are expected to be relatively small in the region, which is characterised by a relatively non-diverse economy. Indirect impacts include production, employment and income changes occurring in other businesses/industries locally that supply inputs to the accommodation and tour operators, in this case. Induced impacts are the effects of household spending in the local economy as a result of the direct and indirect effects of the tourism industry. The rationale for focussing initially on direct impacts is that a large range of required goods and services are not available locally, and many of those goods and services that can be purchased locally are only available because they have been imported into the region, rather than supplied or produced within it. Several measures are used to quantify economic impact, focussing on employment, business output, aggregate wages and salaries, as well as the relative contribution of each of these locally. In the future, it would be desirable to determine value added, though it requires the collection of reliable and detailed data, which is often difficult in practice. While value added is often said to be an appropriate measure of impact on economic activity in a particular area, wages and salaries paid are often preferred as a more conservative measure of the income benefit to residents of an area. Gross business output (revenue) is a broad measure of economic activity, though unfortunately it does not distinguish between high and low value added activities. In order to overcome some of the problems associated with this measure of economic activity, an attempt was made in this study to determine how much of business output remained locally (i.e. within the KAZA region), in terms of local wages and salaries paid as well as non-wage operating expenditures made within the region. Estimates of profits retained within the KAZA region are also made in order to determine potential levels of re-investment in the region, as well as further rounds of expenditure resulting from tourism activity. However, this measure does not consider the potential lack of alternative opportunities for some operators. Nor does it consider the possibility that some enterprise owners are likely to make lifestyle choices rather than profit maximising ones. These estimates are also based on the assumption that local owners retain profit within the region, while non-local/foreign owners remit any profits
Tourism in the Kavango–Zambezi Transfrontier Conservation Area 9
earned to their country of origin. This assumption should be more closely examined in future to determine whether local profits are in fact retained and/or re-invested locally; and the extent to which non-local foreign enterprises contribute to local re-investment and/or leakages from the KAZA region. Estimated tax revenues to central governments are also presented, in recognition that many benefits from the tourism industry impact at a national level, rather than solely at a local level. A cautionary note regarding these estimates must be made – the survey did not disaggregate by type of tax, and therefore some taxes (for instance payroll tax and import duties) are likely to be underestimated. It is anticipated that this survey will be the first of several implemented over the medium to long term, and is designed with subsequent studies in mind. The survey tool has anticipated the development of ‘new’ types of tourism business ownership – notably community owned and joint venture/partnership agreements – that would be expected to increase in number in the coming years if the principles of sustainable tourism are implemented and increased local participation occurs within the KAZA region. By implementing the same (or a similar) survey tool in the same region in several years, it will be possible to observe changes in the industry over time. In order to determine the direct impacts of the KAZA TFCA, several questions will need to be added to the existing questionnaires, relating to whether any new tourism investments have been made, and whether they were made partly or wholly on the basis of the existence of the TFCA initiative. In addition, the subsequent analysis should also include comparisons of rates of growth in the tourism industry outside of the KAZA region, as the relative rates of growth (stagnation or decline) will also give an indication of the success (or otherwise) of the KAZA initiative in stimulating regional growth in the tourism industry. It is difficult to say when the next survey should be implemented, as the KAZA TFCA is at such an early stage of planning and implementation – perhaps two or three years after the signing of the Memorandum of Agreement or Treaty, or when a critical mass of activities are being implemented, and allowing enough time for investment in the industry to have taken place.
3. RESULTS8
3.1 Accommodation, northern Botswana 20 establishments in the area were surveyed. The statistics presented in Sections 3.1.1 to 3.1.6 cover only the 19 establishments which were operating in 2004 or earlier. The results from the business that opened in 2005 are included only in Section 3.1.7. 3.1.1 Profile of establishments
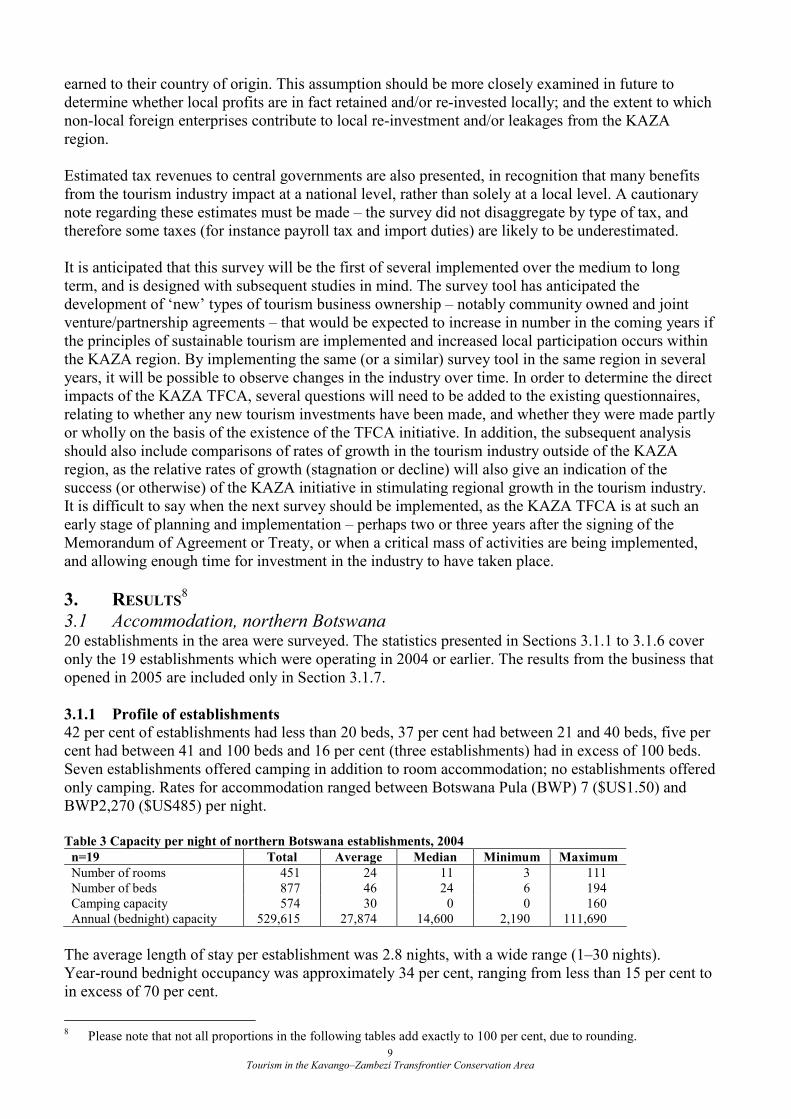
42 per cent of establishments had less than 20 beds, 37 per cent had between 21 and 40 beds, five per cent had between 41 and 100 beds and 16 per cent (three establishments) had in excess of 100 beds. Seven establishments offered camping in addition to room accommodation; no establishments offered only camping. Rates for accommodation ranged between Botswana Pula (BWP) 7 ($US1.50) and BWP2,270 ($US485) per night. Table 3 Capacity per night of northern Botswana establishments, 2004
n=19 Total Average Median Minimum Maximum
Number of rooms 451 24 11 3 111 Number of beds 877 46 24 6 194 Camping capacity 574 30 0 0 160 Annual (bednight) capacity 529,615 27,874 14,600 2,190 111,690
The average length of stay per establishment was 2.8 nights, with a wide range (1–30 nights). Year-round bednight occupancy was approximately 34 per cent, ranging from less than 15 per cent to in excess of 70 per cent.
8 Please note that not all proportions in the following tables add exactly to 100 per cent, due to rounding.
Tourism in the Kavango–Zambezi Transfrontier Conservation Area 10
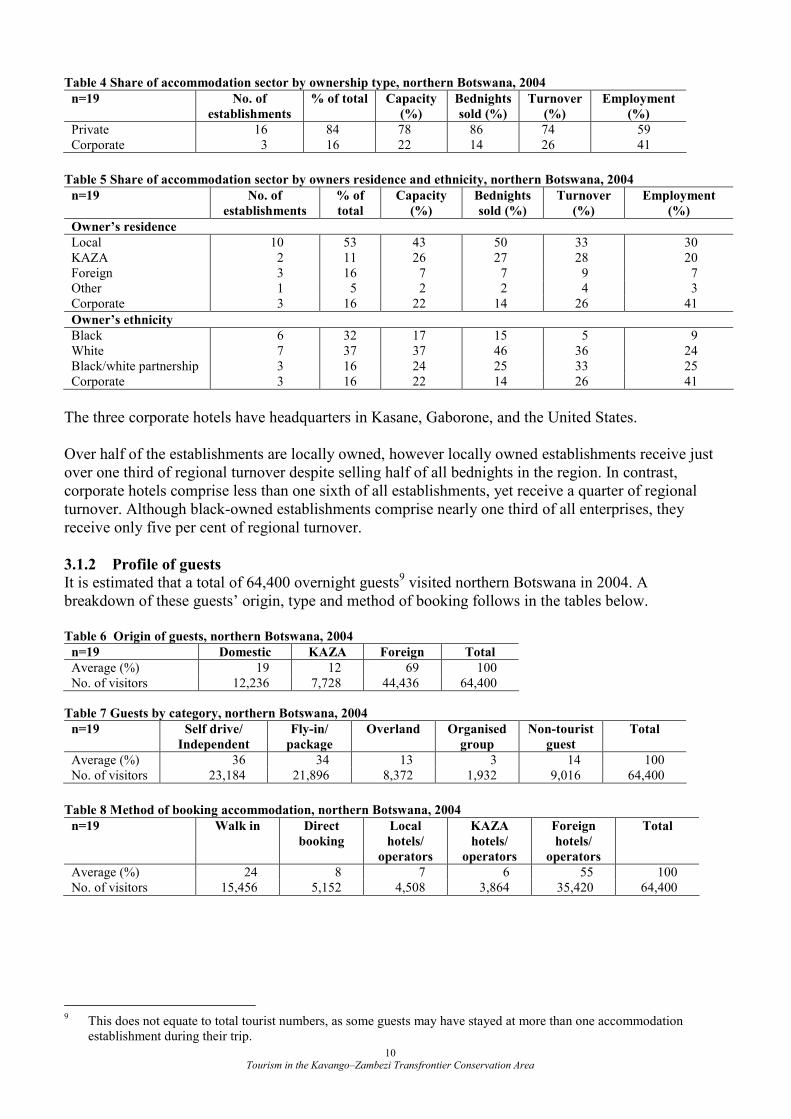
Table 4 Share of accommodation sector by ownership type, northern Botswana, 2004
n=19 No. of
establishments
% of total Capacity
(%)
Bednights
sold (%)
Turnover
(%)
Employment
(%)
Private 16 84 78 86 74 59 Corporate 3 16 22 14 26 41
Table 5 Share of accommodation sector by owners residence and ethnicity, northern Botswana, 2004
n=19 No. of
establishments
% of
total
Capacity
(%)
Bednights
sold (%)
Turnover
(%)
Employment
(%)
Owner’s residence
Local 10 53 43 50 33 30 KAZA 2 11 26 27 28 20 Foreign 3 16 7 7 9 7 Other 1 5 2 2 4 3 Corporate 3 16 22 14 26 41
Owner’s ethnicity
Black 6 32 17 15 5 9 White 7 37 37 46 36 24 Black/white partnership 3 16 24 25 33 25 Corporate 3 16 22 14 26 41
The three corporate hotels have headquarters in Kasane, Gaborone, and the United States. Over half of the establishments are locally owned, however locally owned establishments receive just over one third of regional turnover despite selling half of all bednights in the region. In contrast, corporate hotels comprise less than one sixth of all establishments, yet receive a quarter of regional turnover. Although black-owned establishments comprise nearly one third of all enterprises, they receive only five per cent of regional turnover.
3.1.2 Profile of guests
It is estimated that a total of 64,400 overnight guests9 visited northern Botswana in 2004. A breakdown of these guests’ origin, type and method of booking follows in the tables below. Table 6 Origin of guests, northern Botswana, 2004
n=19 Domestic KAZA Foreign Total
Average (%) 19 12 69 100 No. of visitors 12,236 7,728 44,436 64,400
Table 7 Guests by category, northern Botswana, 2004
n=19 Self drive/
Independent
Fly-in/
package
Overland Organised
group
Non-tourist
guest
Total
Average (%) 36 34 13 3 14 100 No. of visitors 23,184 21,896 8,372 1,932 9,016 64,400
Table 8 Method of booking accommodation, northern Botswana, 2004
n=19 Walk in Direct
booking
Local
hotels/
operators
KAZA
hotels/
operators
Foreign
hotels/
operators
Total
Average (%) 24 8 7 6 55 100 No. of visitors 15,456 5,152 4,508 3,864 35,420 64,400
9 This does not equate to total tourist numbers, as some guests may have stayed at more than one accommodation
establishment during their trip.
Tourism in the Kavango–Zambezi Transfrontier Conservation Area 11
3.1.3 Time trends
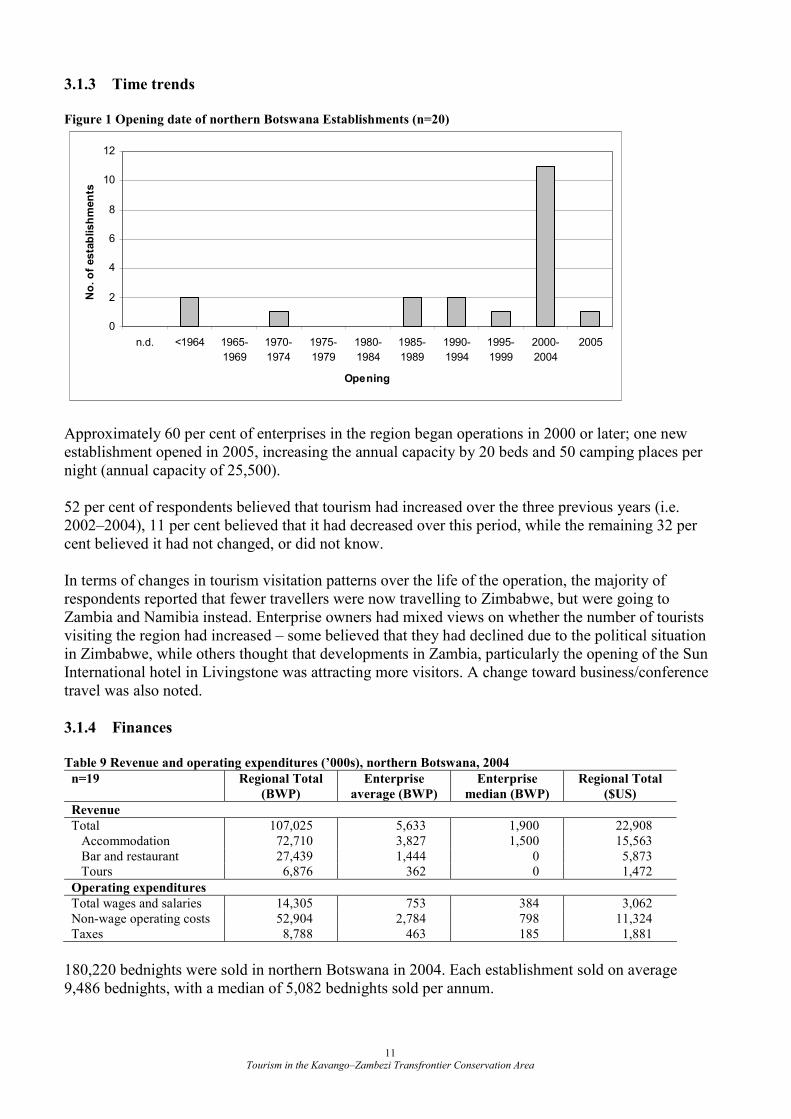
Figure 1 Opening date of northern Botswana Establishments (n=20)
0
2
4
6
8
10
12
n.d. <1964 1965-
1969
1970-
1974
1975-
1979
1980-
1984
1985-
1989
1990-
1994
1995-
1999
2000-
2004
2005
Opening
No. of establishments
Approximately 60 per cent of enterprises in the region began operations in 2000 or later; one new establishment opened in 2005, increasing the annual capacity by 20 beds and 50 camping places per night (annual capacity of 25,500). 52 per cent of respondents believed that tourism had increased over the three previous years (i.e. 2002–2004), 11 per cent believed that it had decreased over this period, while the remaining 32 per cent believed it had not changed, or did not know. In terms of changes in tourism visitation patterns over the life of the operation, the majority of respondents reported that fewer travellers were now travelling to Zimbabwe, but were going to Zambia and Namibia instead. Enterprise owners had mixed views on whether the number of tourists visiting the region had increased – some believed that they had declined due to the political situation in Zimbabwe, while others thought that developments in Zambia, particularly the opening of the Sun International hotel in Livingstone was attracting more visitors. A change toward business/conference travel was also noted.
3.1.4 Finances
Table 9 Revenue and operating expenditures (’000s), northern Botswana, 2004
n=19 Regional Total
(BWP)
Enterprise
average (BWP)
Enterprise
median (BWP)
Regional Total
($US)
Revenue
Total 107,025 5,633 1,900 22,908 Accommodation 72,710 3,827 1,500 15,563 Bar and restaurant 27,439 1,444 0 5,873 Tours 6,876 362 0 1,472
Operating expenditures
Total wages and salaries 14,305 753 384 3,062 Non-wage operating costs 52,904 2,784 798 11,324 Taxes 8,788 463 185 1,881
180,220 bednights were sold in northern Botswana in 2004. Each establishment sold on average 9,486 bednights, with a median of 5,082 bednights sold per annum.
Tourism in the Kavango–Zambezi Transfrontier Conservation Area 12
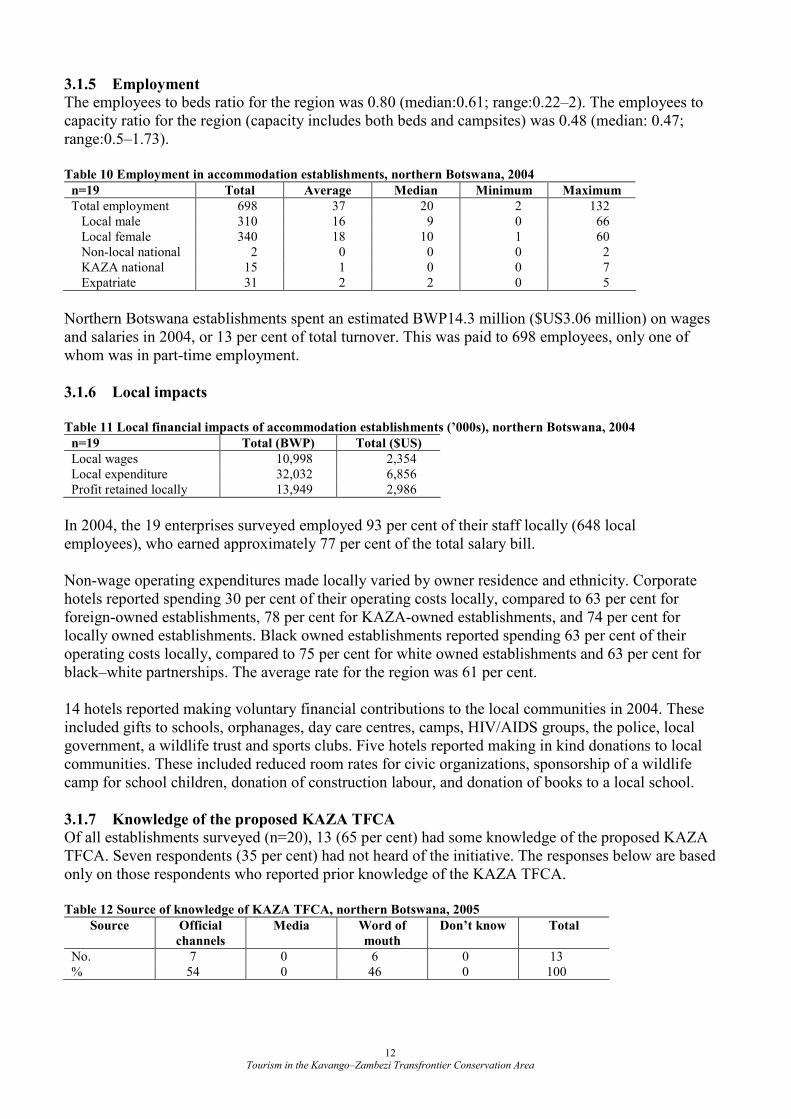
3.1.5 Employment
The employees to beds ratio for the region was 0.80 (median:0.61; range:0.22–2). The employees to capacity ratio for the region (capacity includes both beds and campsites) was 0.48 (median: 0.47; range:0.5–1.73). Table 10 Employment in accommodation establishments, northern Botswana, 2004
n=19 Total Average Median Minimum Maximum
Total employment 698 37 20 2 132 Local male 310 16 9 0 66 Local female 340 18 10 1 60 Non-local national 2 0 0 0 2 KAZA national 15 1 0 0 7 Expatriate 31 2 2 0 5
Northern Botswana establishments spent an estimated BWP14.3 million ($US3.06 million) on wages and salaries in 2004, or 13 per cent of total turnover. This was paid to 698 employees, only one of whom was in part-time employment.
3.1.6 Local impacts
Table 11 Local financial impacts of accommodation establishments (’000s), northern Botswana, 2004
n=19 Total (BWP) Total ($US)
Local wages 10,998 2,354 Local expenditure 32,032 6,856 Profit retained locally 13,949 2,986
In 2004, the 19 enterprises surveyed employed 93 per cent of their staff locally (648 local employees), who earned approximately 77 per cent of the total salary bill. Non-wage operating expenditures made locally varied by owner residence and ethnicity. Corporate hotels reported spending 30 per cent of their operating costs locally, compared to 63 per cent for foreign-owned establishments, 78 per cent for KAZA-owned establishments, and 74 per cent for locally owned establishments. Black owned establishments reported spending 63 per cent of their operating costs locally, compared to 75 per cent for white owned establishments and 63 per cent for black–white partnerships. The average rate for the region was 61 per cent. 14 hotels reported making voluntary financial contributions to the local communities in 2004. These included gifts to schools, orphanages, day care centres, camps, HIV/AIDS groups, the police, local government, a wildlife trust and sports clubs. Five hotels reported making in kind donations to local communities. These included reduced room rates for civic organizations, sponsorship of a wildlife camp for school children, donation of construction labour, and donation of books to a local school.
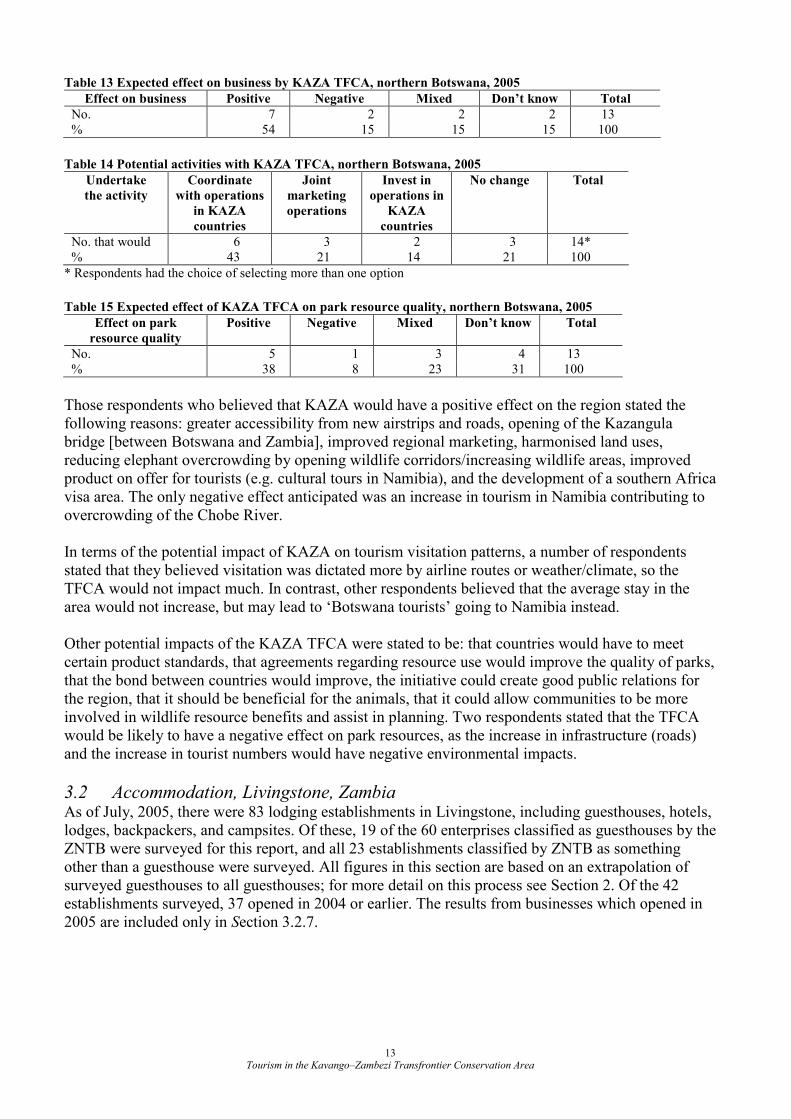
3.1.7 Knowledge of the proposed KAZA TFCA
Of all establishments surveyed (n=20), 13 (65 per cent) had some knowledge of the proposed KAZA TFCA. Seven respondents (35 per cent) had not heard of the initiative. The responses below are based only on those respondents who reported prior knowledge of the KAZA TFCA. Table 12 Source of knowledge of KAZA TFCA, northern Botswana, 2005
Source Official
channels
Media Word of
mouth
Don’t know Total
No. 7 0 6 0 13 % 54 0 46 0 100
Tourism in the Kavango–Zambezi Transfrontier Conservation Area 13
Table 13 Expected effect on business by KAZA TFCA, northern Botswana, 2005
Effect on business Positive Negative Mixed Don’t know Total
No. 7 2 2 2 13 % 54 15 15 15 100
Table 14 Potential activities with KAZA TFCA, northern Botswana, 2005
Undertake
the activity
Coordinate
with operations
in KAZA
countries
Joint
marketing
operations
Invest in
operations in
KAZA
countries
No change Total
No. that would 6 3 2 3 14* % 43 21 14 21 100
* Respondents had the choice of selecting more than one option
Table 15 Expected effect of KAZA TFCA on park resource quality, northern Botswana, 2005
Effect on park
resource quality
Positive Negative Mixed Don’t know Total
No. 5 1 3 4 13 % 38 8 23 31 100
Those respondents who believed that KAZA would have a positive effect on the region stated the following reasons: greater accessibility from new airstrips and roads, opening of the Kazangula bridge [between Botswana and Zambia], improved regional marketing, harmonised land uses, reducing elephant overcrowding by opening wildlife corridors/increasing wildlife areas, improved product on offer for tourists (e.g. cultural tours in Namibia), and the development of a southern Africa visa area. The only negative effect anticipated was an increase in tourism in Namibia contributing to overcrowding of the Chobe River. In terms of the potential impact of KAZA on tourism visitation patterns, a number of respondents stated that they believed visitation was dictated more by airline routes or weather/climate, so the TFCA would not impact much. In contrast, other respondents believed that the average stay in the area would not increase, but may lead to ‘Botswana tourists’ going to Namibia instead. Other potential impacts of the KAZA TFCA were stated to be: that countries would have to meet certain product standards, that agreements regarding resource use would improve the quality of parks, that the bond between countries would improve, the initiative could create good public relations for the region, that it should be beneficial for the animals, that it could allow communities to be more involved in wildlife resource benefits and assist in planning. Two respondents stated that the TFCA would be likely to have a negative effect on park resources, as the increase in infrastructure (roads) and the increase in tourist numbers would have negative environmental impacts.
3.2 Accommodation, Livingstone, Zambia As of July, 2005, there were 83 lodging establishments in Livingstone, including guesthouses, hotels, lodges, backpackers, and campsites. Of these, 19 of the 60 enterprises classified as guesthouses by the ZNTB were surveyed for this report, and all 23 establishments classified by ZNTB as something other than a guesthouse were surveyed. All figures in this section are based on an extrapolation of surveyed guesthouses to all guesthouses; for more detail on this process see Section 2. Of the 42 establishments surveyed, 37 opened in 2004 or earlier. The results from businesses which opened in 2005 are included only in Section 3.2.7.
Tourism in the Kavango–Zambezi Transfrontier Conservation Area 14
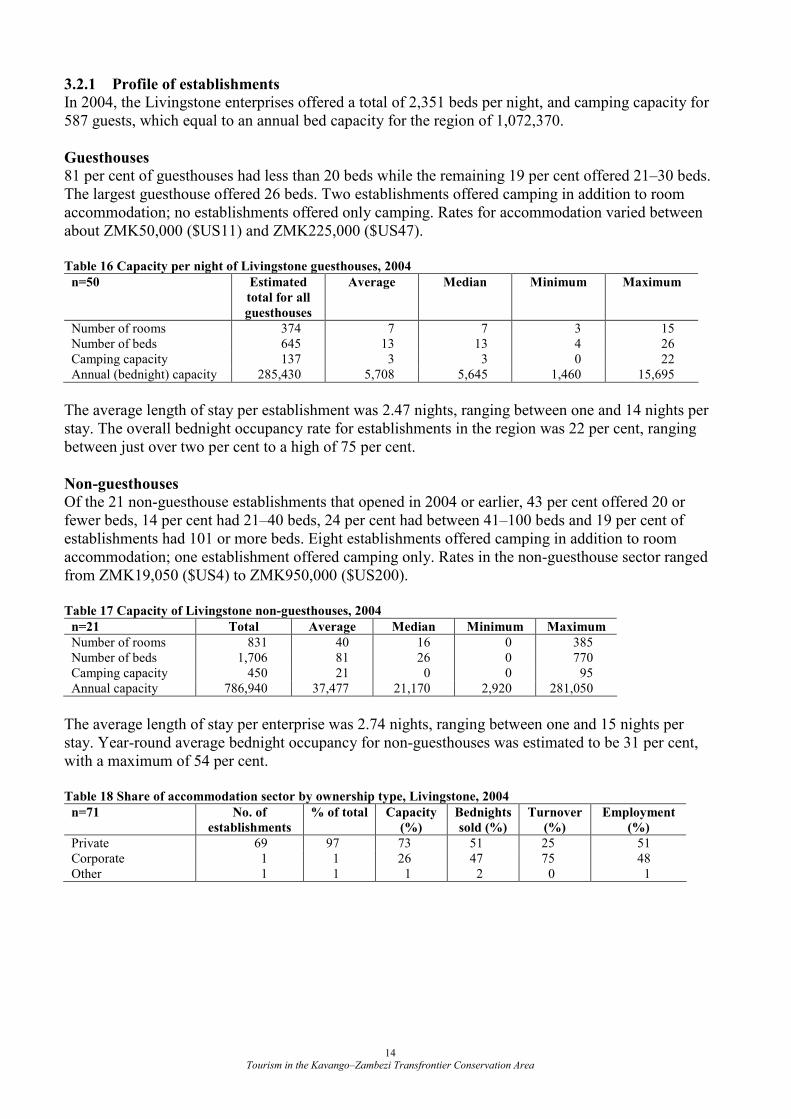
3.2.1 Profile of establishments
In 2004, the Livingstone enterprises offered a total of 2,351 beds per night, and camping capacity for 587 guests, which equal to an annual bed capacity for the region of 1,072,370.
Guesthouses
81 per cent of guesthouses had less than 20 beds while the remaining 19 per cent offered 21–30 beds. The largest guesthouse offered 26 beds. Two establishments offered camping in addition to room accommodation; no establishments offered only camping. Rates for accommodation varied between about ZMK50,000 ($US11) and ZMK225,000 ($US47). Table 16 Capacity per night of Livingstone guesthouses, 2004
n=50 Estimated
total for all
guesthouses
Average Median Minimum Maximum
Number of rooms 374 7 7 3 15 Number of beds 645 13 13 4 26 Camping capacity 137 3 3 0 22 Annual (bednight) capacity 285,430 5,708 5,645 1,460 15,695
The average length of stay per establishment was 2.47 nights, ranging between one and 14 nights per stay. The overall bednight occupancy rate for establishments in the region was 22 per cent, ranging between just over two per cent to a high of 75 per cent.
Non-guesthouses
Of the 21 non-guesthouse establishments that opened in 2004 or earlier, 43 per cent offered 20 or fewer beds, 14 per cent had 21–40 beds, 24 per cent had between 41–100 beds and 19 per cent of establishments had 101 or more beds. Eight establishments offered camping in addition to room accommodation; one establishment offered camping only. Rates in the non-guesthouse sector ranged from ZMK19,050 ($US4) to ZMK950,000 ($US200). Table 17 Capacity of Livingstone non-guesthouses, 2004
n=21 Total Average Median Minimum Maximum
Number of rooms 831 40 16 0 385 Number of beds 1,706 81 26 0 770 Camping capacity 450 21 0 0 95 Annual capacity 786,940 37,477 21,170 2,920 281,050
The average length of stay per enterprise was 2.74 nights, ranging between one and 15 nights per stay. Year-round average bednight occupancy for non-guesthouses was estimated to be 31 per cent, with a maximum of 54 per cent. Table 18 Share of accommodation sector by ownership type, Livingstone, 2004
n=71 No. of
establishments
% of total Capacity
(%)
Bednights
sold (%)
Turnover
(%)
Employment
(%)
Private 69 97 73 51 25 51 Corporate 1 1 26 47 75 48 Other 1 1 1 2 0 1
Tourism in the Kavango–Zambezi Transfrontier Conservation Area 15
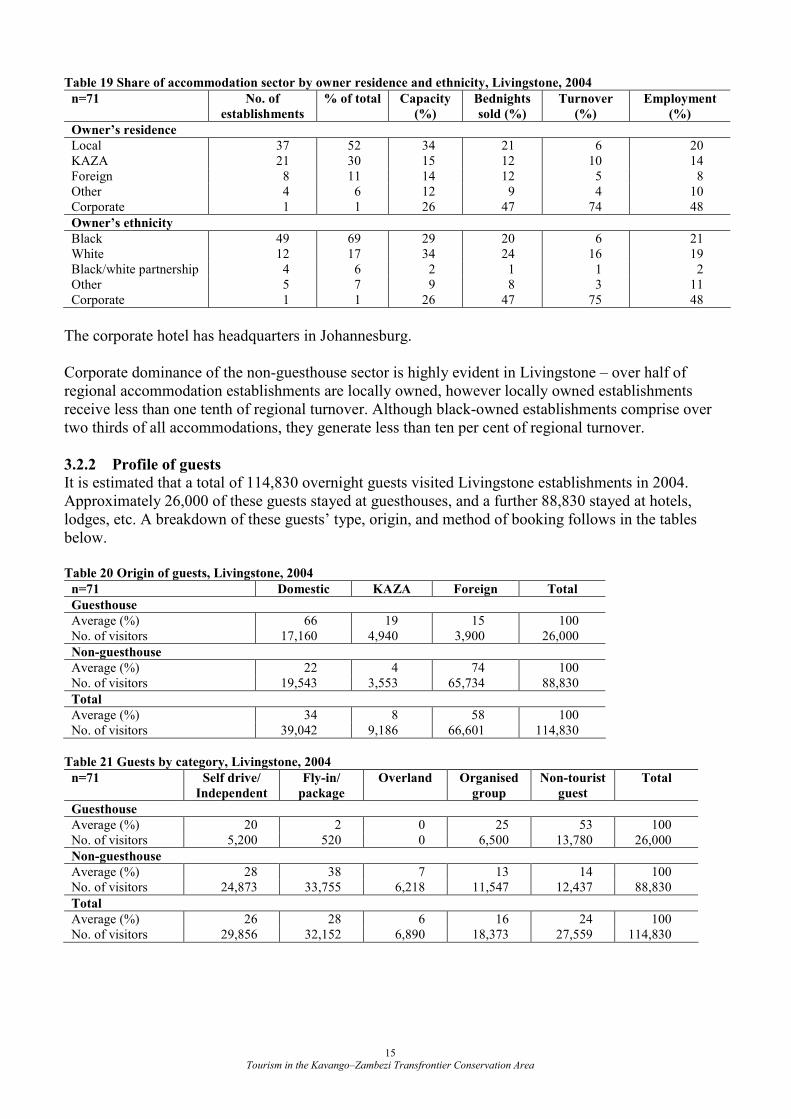
Table 19 Share of accommodation sector by owner residence and ethnicity, Livingstone, 2004
n=71 No. of
establishments
% of total Capacity
(%)
Bednights
sold (%)
Turnover
(%)
Employment
(%)
Owner’s residence
Local 37 52 34 21 6 20 KAZA 21 30 15 12 10 14 Foreign 8 11 14 12 5 8 Other 4 6 12 9 4 10 Corporate 1 1 26 47 74 48
Owner’s ethnicity
Black 49 69 29 20 6 21 White 12 17 34 24 16 19 Black/white partnership 4 6 2 1 1 2 Other 5 7 9 8 3 11 Corporate 1 1 26 47 75 48
The corporate hotel has headquarters in Johannesburg. Corporate dominance of the non-guesthouse sector is highly evident in Livingstone – over half of regional accommodation establishments are locally owned, however locally owned establishments receive less than one tenth of regional turnover. Although black-owned establishments comprise over two thirds of all accommodations, they generate less than ten per cent of regional turnover.
3.2.2 Profile of guests
It is estimated that a total of 114,830 overnight guests visited Livingstone establishments in 2004. Approximately 26,000 of these guests stayed at guesthouses, and a further 88,830 stayed at hotels, lodges, etc. A breakdown of these guests’ type, origin, and method of booking follows in the tables below. Table 20 Origin of guests, Livingstone, 2004
n=71 Domestic KAZA Foreign Total
Guesthouse
Average (%) 66 19 15 100 No. of visitors 17,160 4,940 3,900 26,000
Non-guesthouse
Average (%) 22 4 74 100 No. of visitors 19,543 3,553 65,734 88,830
Total
Average (%) 34 8 58 100 No. of visitors 39,042 9,186 66,601 114,830
Table 21 Guests by category, Livingstone, 2004
n=71 Self drive/
Independent
Fly-in/
package
Overland Organised
group
Non-tourist
guest
Total
Guesthouse
Average (%) 20 2 0 25 53 100 No. of visitors 5,200 520 0 6,500 13,780 26,000
Non-guesthouse
Average (%) 28 38 7 13 14 100 No. of visitors 24,873 33,755 6,218 11,547 12,437 88,830
Total
Average (%) 26 28 6 16 24 100 No. of visitors 29,856 32,152 6,890 18,373 27,559 114,830
Tourism in the Kavango–Zambezi Transfrontier Conservation Area 16
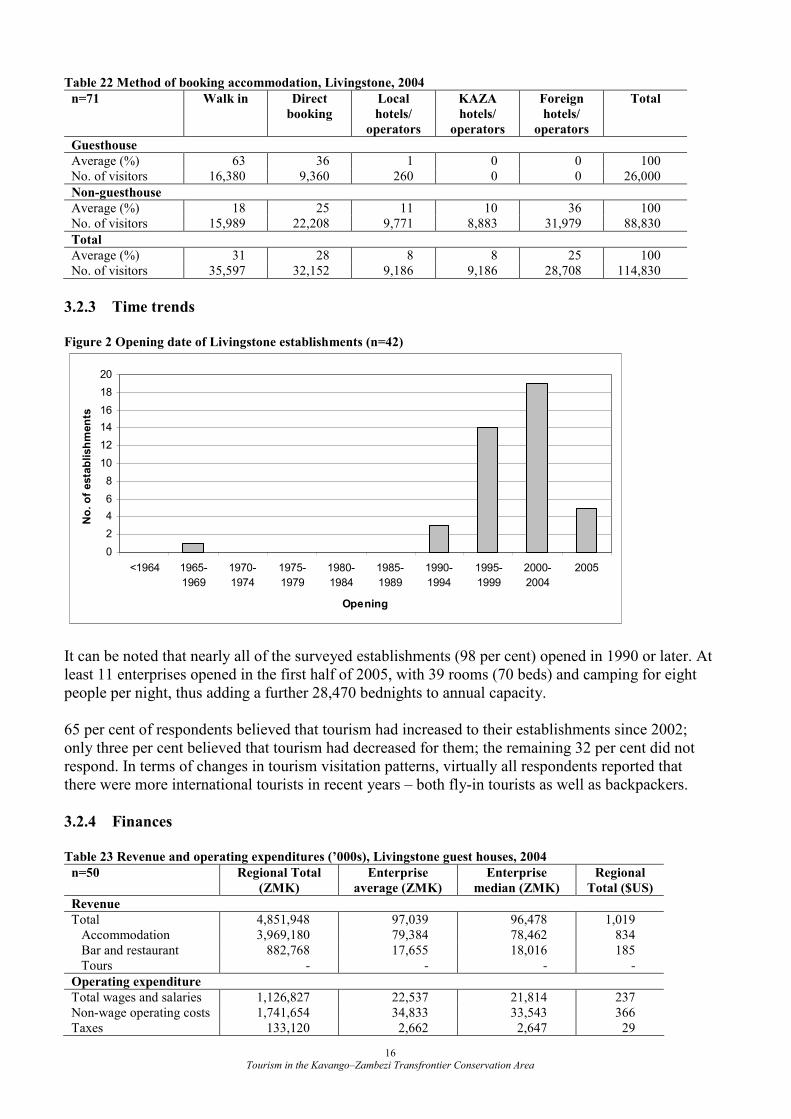
Table 22 Method of booking accommodation, Livingstone, 2004
n=71 Walk in Direct
booking
Local
hotels/
operators
KAZA
hotels/
operators
Foreign
hotels/
operators
Total
Guesthouse
Average (%) 63 36 1 0 0 100 No. of visitors 16,380 9,360 260 0 0 26,000
Non-guesthouse
Average (%) 18 25 11 10 36 100 No. of visitors 15,989 22,208 9,771 8,883 31,979 88,830
Total
Average (%) 31 28 8 8 25 100 No. of visitors 35,597 32,152 9,186 9,186 28,708 114,830
3.2.3 Time trends
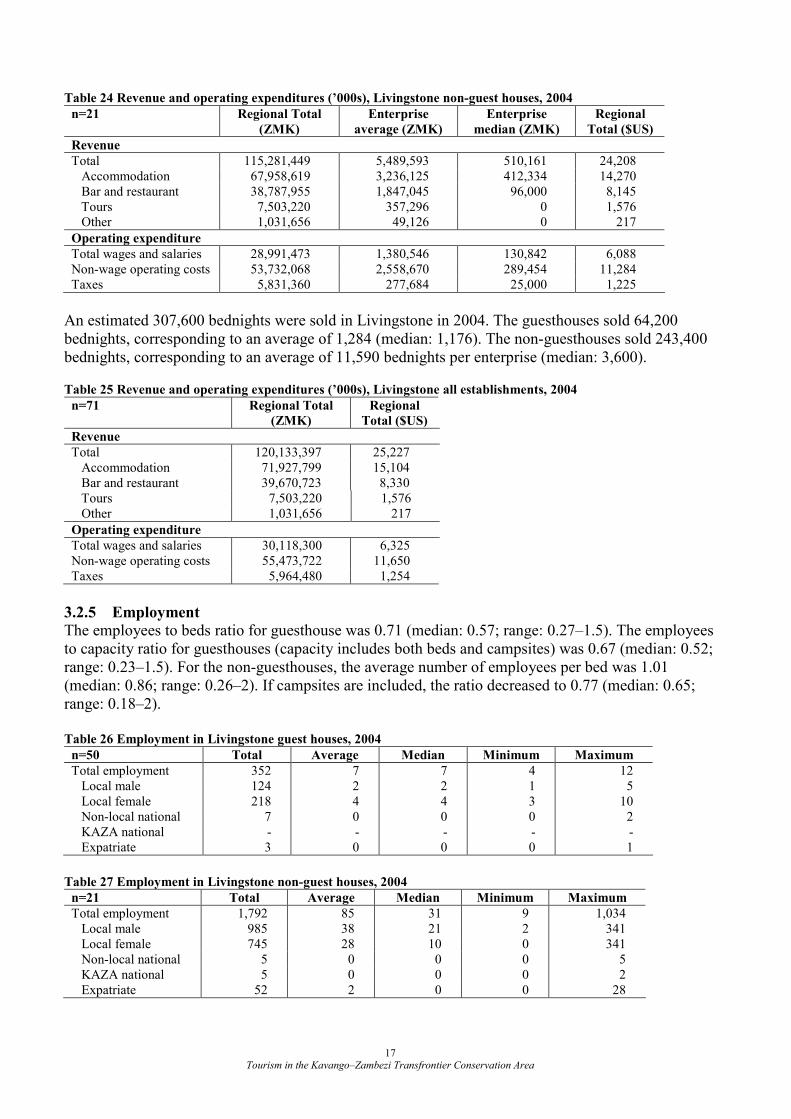
Figure 2 Opening date of Livingstone establishments (n=42)
0
2
4
6
8
10
12
14
16
18
20
<1964 1965-
1969
1970-
1974
1975-
1979
1980-
1984
1985-
1989
1990-
1994
1995-
1999
2000-
2004
2005
Opening
No. of establishments
It can be noted that nearly all of the surveyed establishments (98 per cent) opened in 1990 or later. At least 11 enterprises opened in the first half of 2005, with 39 rooms (70 beds) and camping for eight people per night, thus adding a further 28,470 bednights to annual capacity. 65 per cent of respondents believed that tourism had increased to their establishments since 2002; only three per cent believed that tourism had decreased for them; the remaining 32 per cent did not respond. In terms of changes in tourism visitation patterns, virtually all respondents reported that there were more international tourists in recent years – both fly-in tourists as well as backpackers.
3.2.4 Finances
Table 23 Revenue and operating expenditures (’000s), Livingstone guest houses, 2004
n=50 Regional Total
(ZMK)
Enterprise
average (ZMK)
Enterprise
median (ZMK)
Regional
Total ($US)
Revenue
Total 4,851,948 97,039 96,478 1,019 Accommodation 3,969,180 79,384 78,462 834 Bar and restaurant 882,768 17,655 18,016 185 Tours - - - -
Operating expenditure
Total wages and salaries 1,126,827 22,537 21,814 237 Non-wage operating costs 1,741,654 34,833 33,543 366 Taxes 133,120 2,662 2,647 29
Tourism in the Kavango–Zambezi Transfrontier Conservation Area 17
Table 24 Revenue and operating expenditures (’000s), Livingstone non-guest houses, 2004
n=21 Regional Total
(ZMK)
Enterprise
average (ZMK)
Enterprise
median (ZMK)
Regional
Total ($US)
Revenue
Total 115,281,449 5,489,593 510,161 24,208 Accommodation 67,958,619 3,236,125 412,334 14,270 Bar and restaurant 38,787,955 1,847,045 96,000 8,145 Tours 7,503,220 357,296 0 1,576 Other 1,031,656 49,126 0 217
Operating expenditure
Total wages and salaries 28,991,473 1,380,546 130,842 6,088 Non-wage operating costs 53,732,068 2,558,670 289,454 11,284 Taxes 5,831,360 277,684 25,000 1,225
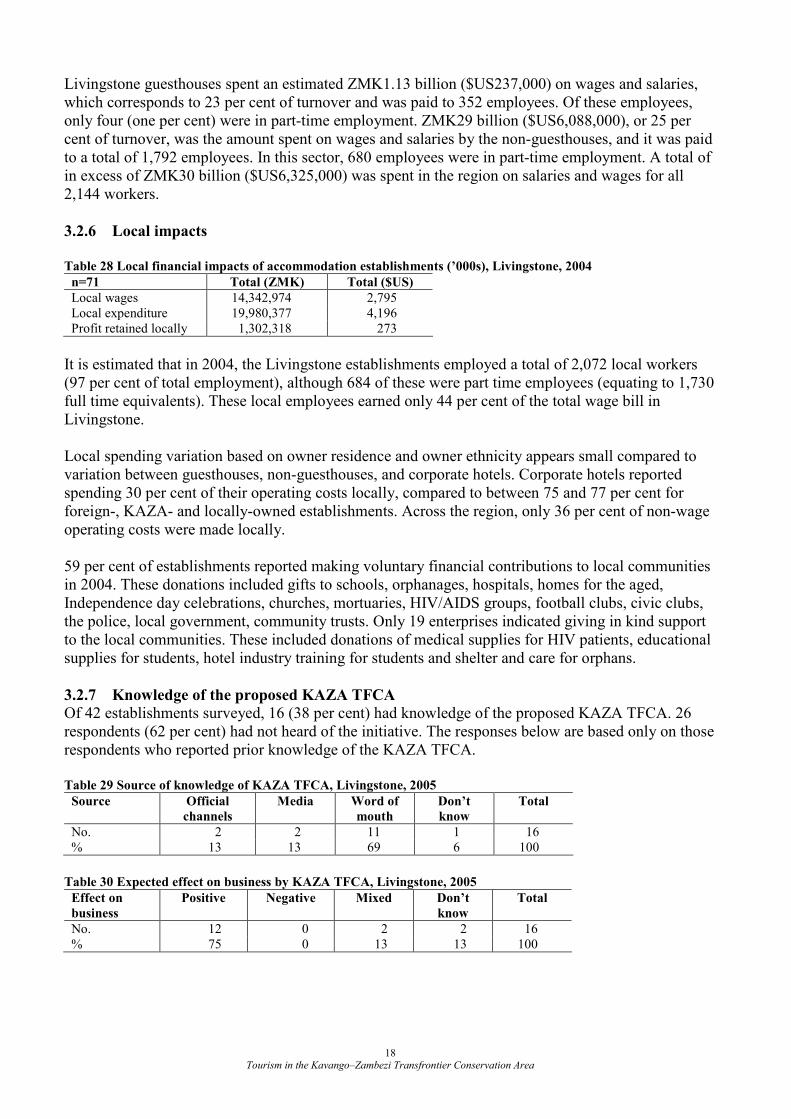
An estimated 307,600 bednights were sold in Livingstone in 2004. The guesthouses sold 64,200 bednights, corresponding to an average of 1,284 (median: 1,176). The non-guesthouses sold 243,400 bednights, corresponding to an average of 11,590 bednights per enterprise (median: 3,600).
Table 25 Revenue and operating expenditures (’000s), Livingstone all establishments, 2004
n=71 Regional Total
(ZMK)
Regional
Total ($US)
Revenue
Total 120,133,397 25,227 Accommodation 71,927,799 15,104 Bar and restaurant 39,670,723 8,330 Tours 7,503,220 1,576 Other 1,031,656 217
Operating expenditure
Total wages and salaries 30,118,300 6,325 Non-wage operating costs 55,473,722 11,650 Taxes 5,964,480 1,254
3.2.5 Employment
The employees to beds ratio for guesthouse was 0.71 (median: 0.57; range: 0.27–1.5). The employees to capacity ratio for guesthouses (capacity includes both beds and campsites) was 0.67 (median: 0.52; range: 0.23–1.5). For the non-guesthouses, the average number of employees per bed was 1.01 (median: 0.86; range: 0.26–2). If campsites are included, the ratio decreased to 0.77 (median: 0.65; range: 0.18–2). Table 26 Employment in Livingstone guest houses, 2004
n=50 Total Average Median Minimum Maximum
Total employment 352 7 7 4 12 Local male 124 2 2 1 5 Local female 218 4 4 3 10 Non-local national 7 0 0 0 2 KAZA national - - - - - Expatriate 3 0 0 0 1
Table 27 Employment in Livingstone non-guest houses, 2004
n=21 Total Average Median Minimum Maximum
Total employment 1,792 85 31 9 1,034 Local male 985 38 21 2 341 Local female 745 28 10 0 341 Non-local national 5 0 0 0 5 KAZA national 5 0 0 0 2 Expatriate 52 2 0 0 28
Tourism in the Kavango–Zambezi Transfrontier Conservation Area 18
Livingstone guesthouses spent an estimated ZMK1.13 billion ($US237,000) on wages and salaries, which corresponds to 23 per cent of turnover and was paid to 352 employees. Of these employees, only four (one per cent) were in part-time employment. ZMK29 billion ($US6,088,000), or 25 per cent of turnover, was the amount spent on wages and salaries by the non-guesthouses, and it was paid to a total of 1,792 employees. In this sector, 680 employees were in part-time employment. A total of in excess of ZMK30 billion ($US6,325,000) was spent in the region on salaries and wages for all 2,144 workers.
3.2.6 Local impacts
Table 28 Local financial impacts of accommodation establishments (’000s), Livingstone, 2004
n=71 Total (ZMK) Total ($US)
Local wages 14,342,974 2,795 Local expenditure 19,980,377 4,196 Profit retained locally 1,302,318 273
It is estimated that in 2004, the Livingstone establishments employed a total of 2,072 local workers (97 per cent of total employment), although 684 of these were part time employees (equating to 1,730 full time equivalents). These local employees earned only 44 per cent of the total wage bill in Livingstone. Local spending variation based on owner residence and owner ethnicity appears small compared to variation between guesthouses, non-guesthouses, and corporate hotels. Corporate hotels reported spending 30 per cent of their operating costs locally, compared to between 75 and 77 per cent for foreign-, KAZA- and locally-owned establishments. Across the region, only 36 per cent of non-wage operating costs were made locally. 59 per cent of establishments reported making voluntary financial contributions to local communities in 2004. These donations included gifts to schools, orphanages, hospitals, homes for the aged, Independence day celebrations, churches, mortuaries, HIV/AIDS groups, football clubs, civic clubs, the police, local government, community trusts. Only 19 enterprises indicated giving in kind support to the local communities. These included donations of medical supplies for HIV patients, educational supplies for students, hotel industry training for students and shelter and care for orphans.
3.2.7 Knowledge of the proposed KAZA TFCA
Of 42 establishments surveyed, 16 (38 per cent) had knowledge of the proposed KAZA TFCA. 26 respondents (62 per cent) had not heard of the initiative. The responses below are based only on those respondents who reported prior knowledge of the KAZA TFCA. Table 29 Source of knowledge of KAZA TFCA, Livingstone, 2005
Source Official
channels
Media Word of
mouth
Don’t
know
Total
No. 2 2 11 1 16 % 13 13 69 6 100
Table 30 Expected effect on business by KAZA TFCA, Livingstone, 2005
Effect on
business Positive Negative Mixed Don’t
know
Total
No. 12 0 2 2 16 % 75 0 13 13 100
Tourism in the Kavango–Zambezi Transfrontier Conservation Area 19
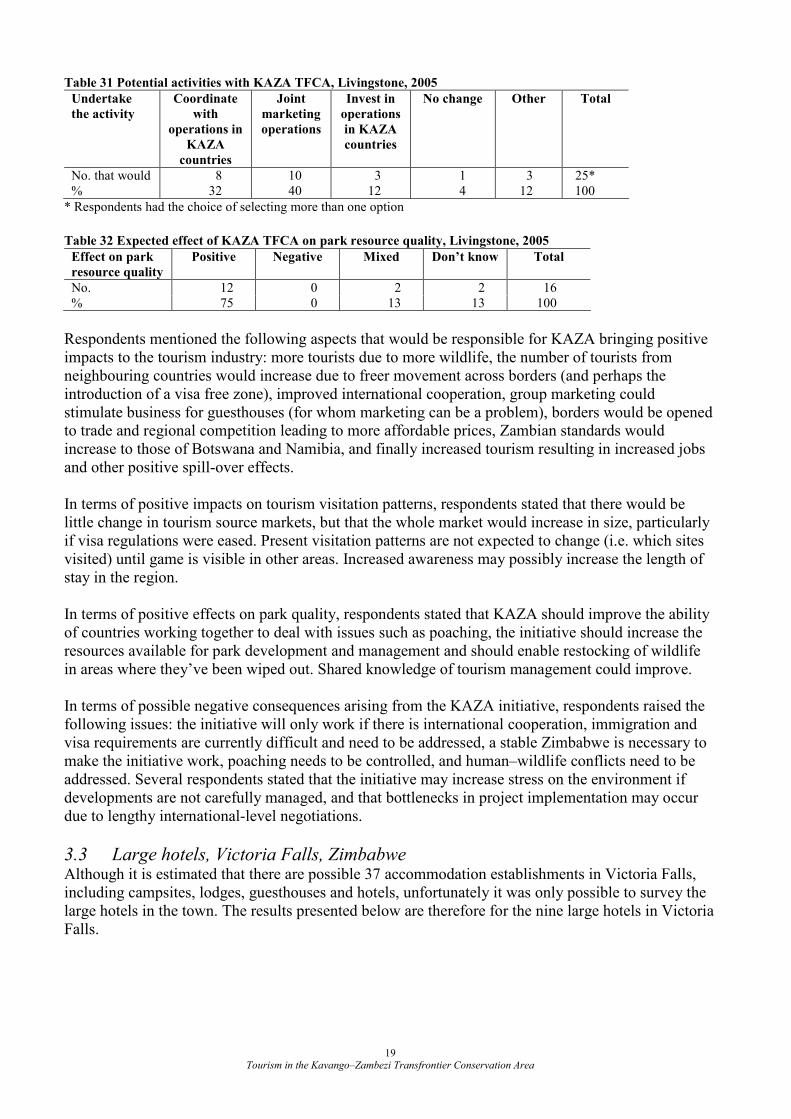
Table 31 Potential activities with KAZA TFCA, Livingstone, 2005
Undertake
the activity Coordinate
with
operations in
KAZA
countries
Joint
marketing
operations
Invest in
operations
in KAZA
countries
No change Other Total
No. that would 8 10 3 1 3 25* % 32 40 12 4 12 100
* Respondents had the choice of selecting more than one option
Table 32 Expected effect of KAZA TFCA on park resource quality, Livingstone, 2005
Respondents mentioned the following aspects that would be responsible for KAZA bringing positive impacts to the tourism industry: more tourists due to more wildlife, the number of tourists from neighbouring countries would increase due to freer movement across borders (and perhaps the introduction of a visa free zone), improved international cooperation, group marketing could stimulate business for guesthouses (for whom marketing can be a problem), borders would be opened to trade and regional competition leading to more affordable prices, Zambian standards would increase to those of Botswana and Namibia, and finally increased tourism resulting in increased jobs and other positive spill-over effects. In terms of positive impacts on tourism visitation patterns, respondents stated that there would be little change in tourism source markets, but that the whole market would increase in size, particularly if visa regulations were eased. Present visitation patterns are not expected to change (i.e. which sites visited) until game is visible in other areas. Increased awareness may possibly increase the length of stay in the region. In terms of positive effects on park quality, respondents stated that KAZA should improve the ability of countries working together to deal with issues such as poaching, the initiative should increase the resources available for park development and management and should enable restocking of wildlife in areas where they’ve been wiped out. Shared knowledge of tourism management could improve. In terms of possible negative consequences arising from the KAZA initiative, respondents raised the following issues: the initiative will only work if there is international cooperation, immigration and visa requirements are currently difficult and need to be addressed, a stable Zimbabwe is necessary to make the initiative work, poaching needs to be controlled, and human–wildlife conflicts need to be addressed. Several respondents stated that the initiative may increase stress on the environment if developments are not carefully managed, and that bottlenecks in project implementation may occur due to lengthy international-level negotiations.
3.3 Large hotels, Victoria Falls, Zimbabwe Although it is estimated that there are possible 37 accommodation establishments in Victoria Falls, including campsites, lodges, guesthouses and hotels, unfortunately it was only possible to survey the large hotels in the town. The results presented below are therefore for the nine large hotels in Victoria Falls.
Effect on park
resource quality Positive Negative Mixed Don’t know Total
No. 12 0 2 2 16 % 75 0 13 13 100
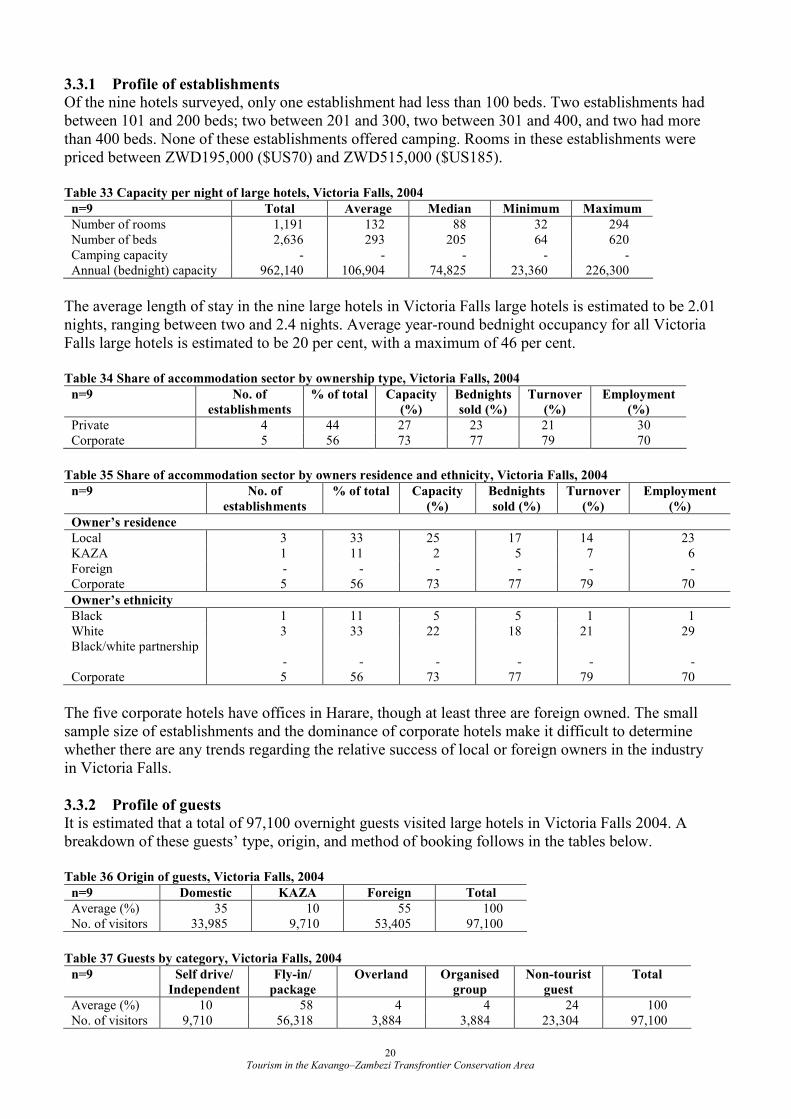
Tourism in the Kavango–Zambezi Transfrontier Conservation Area 20
3.3.1 Profile of establishments
Of the nine hotels surveyed, only one establishment had less than 100 beds. Two establishments had between 101 and 200 beds; two between 201 and 300, two between 301 and 400, and two had more than 400 beds. None of these establishments offered camping. Rooms in these establishments were priced between ZWD195,000 ($US70) and ZWD515,000 ($US185). Table 33 Capacity per night of large hotels, Victoria Falls, 2004
n=9 Total Average Median Minimum Maximum
Number of rooms 1,191 132 88 32 294 Number of beds 2,636 293 205 64 620 Camping capacity - - - - - Annual (bednight) capacity 962,140 106,904 74,825 23,360 226,300
The average length of stay in the nine large hotels in Victoria Falls large hotels is estimated to be 2.01 nights, ranging between two and 2.4 nights. Average year-round bednight occupancy for all Victoria Falls large hotels is estimated to be 20 per cent, with a maximum of 46 per cent. Table 34 Share of accommodation sector by ownership type, Victoria Falls, 2004
n=9 No. of
establishments
% of total Capacity
(%)
Bednights
sold (%)
Turnover
(%)
Employment
(%)
Private 4 44 27 23 21 30 Corporate 5 56 73 77 79 70
Table 35 Share of accommodation sector by owners residence and ethnicity, Victoria Falls, 2004
n=9 No. of
establishments
% of total Capacity
(%)
Bednights
sold (%)
Turnover
(%)
Employment
(%)
Owner’s residence
Local 3 33 25 17 14 23 KAZA 1 11 2 5 7 6 Foreign - - - - - - Corporate 5 56 73 77 79 70
Owner’s ethnicity
Black 1 11 5 5 1 1 White 3 33 22 18 21 29 Black/white partnership
- -
-
-
-
-
Corporate 5 56 73 77 79 70
The five corporate hotels have offices in Harare, though at least three are foreign owned. The small sample size of establishments and the dominance of corporate hotels make it difficult to determine whether there are any trends regarding the relative success of local or foreign owners in the industry in Victoria Falls.
3.3.2 Profile of guests
It is estimated that a total of 97,100 overnight guests visited large hotels in Victoria Falls 2004. A breakdown of these guests’ type, origin, and method of booking follows in the tables below. Table 36 Origin of guests, Victoria Falls, 2004
n=9 Domestic KAZA Foreign Total
Average (%) 35 10 55 100 No. of visitors 33,985 9,710 53,405 97,100
Table 37 Guests by category, Victoria Falls, 2004
n=9 Self drive/
Independent
Fly-in/
package
Overland Organised
group
Non-tourist
guest
Total
Average (%) 10 58 4 4 24 100 No. of visitors 9,710 56,318 3,884 3,884 23,304 97,100
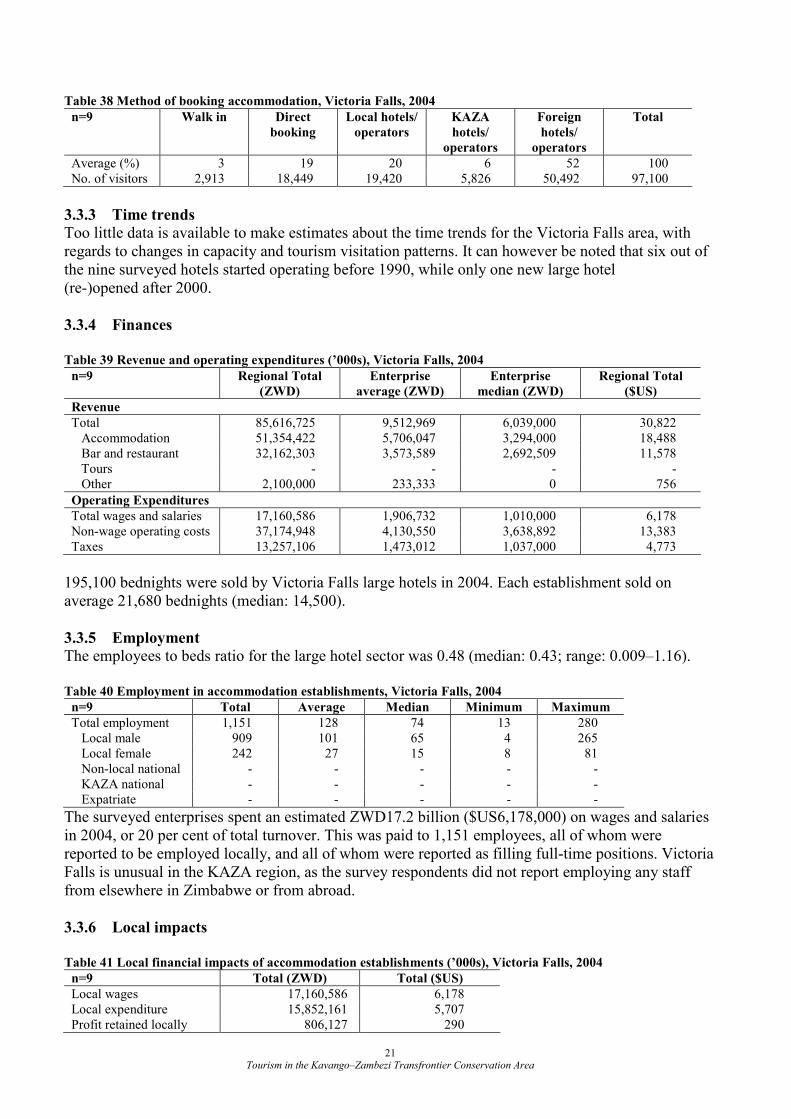
Tourism in the Kavango–Zambezi Transfrontier Conservation Area 21
Table 38 Method of booking accommodation, Victoria Falls, 2004
n=9 Walk in Direct
booking
Local hotels/
operators
KAZA
hotels/
operators
Foreign
hotels/
operators
Total
Average (%) 3 19 20 6 52 100 No. of visitors 2,913 18,449 19,420 5,826 50,492 97,100
3.3.3 Time trends
Too little data is available to make estimates about the time trends for the Victoria Falls area, with regards to changes in capacity and tourism visitation patterns. It can however be noted that six out of the nine surveyed hotels started operating before 1990, while only one new large hotel (re-)opened after 2000.
3.3.4 Finances
Table 39 Revenue and operating expenditures (’000s), Victoria Falls, 2004
n=9 Regional Total
(ZWD)
Enterprise
average (ZWD)
Enterprise
median (ZWD)
Regional Total
($US)
Revenue
Total 85,616,725 9,512,969 6,039,000 30,822 Accommodation 51,354,422 5,706,047 3,294,000 18,488 Bar and restaurant 32,162,303 3,573,589 2,692,509 11,578 Tours - - - - Other 2,100,000 233,333 0 756
Operating Expenditures
Total wages and salaries 17,160,586 1,906,732 1,010,000 6,178 Non-wage operating costs 37,174,948 4,130,550 3,638,892 13,383 Taxes 13,257,106 1,473,012 1,037,000 4,773
195,100 bednights were sold by Victoria Falls large hotels in 2004. Each establishment sold on average 21,680 bednights (median: 14,500).
3.3.5 Employment
The employees to beds ratio for the large hotel sector was 0.48 (median: 0.43; range: 0.009–1.16). Table 40 Employment in accommodation establishments, Victoria Falls, 2004
n=9 Total Average Median Minimum Maximum
Total employment 1,151 128 74 13 280 Local male 909 101 65 4 265 Local female 242 27 15 8 81 Non-local national - - - - - KAZA national - - - - - Expatriate - - - - -
The surveyed enterprises spent an estimated ZWD17.2 billion ($US6,178,000) on wages and salaries in 2004, or 20 per cent of total turnover. This was paid to 1,151 employees, all of whom were reported to be employed locally, and all of whom were reported as filling full-time positions. Victoria Falls is unusual in the KAZA region, as the survey respondents did not report employing any staff from elsewhere in Zimbabwe or from abroad.
3.3.6 Local impacts
Table 41 Local financial impacts of accommodation establishments (’000s), Victoria Falls, 2004
n=9 Total (ZWD) Total ($US)
Local wages 17,160,586 6,178 Local expenditure 15,852,161 5,707 Profit retained locally 806,127 290
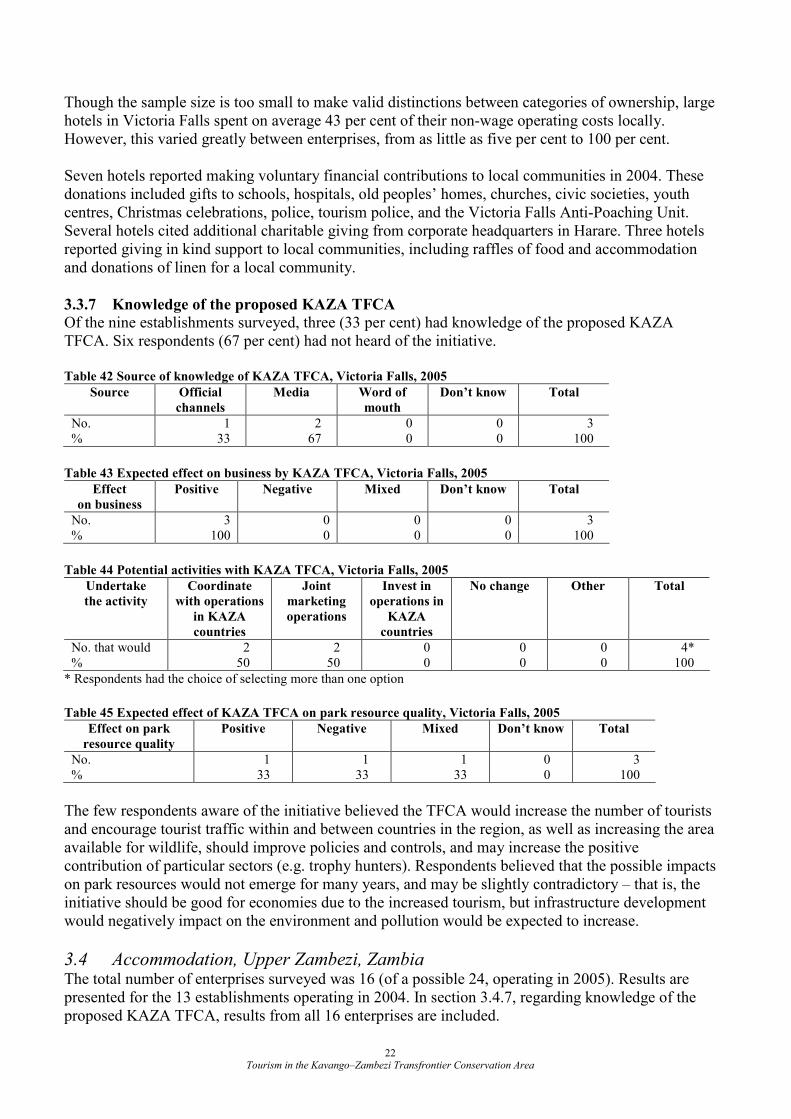
Tourism in the Kavango–Zambezi Transfrontier Conservation Area 22
Though the sample size is too small to make valid distinctions between categories of ownership, large hotels in Victoria Falls spent on average 43 per cent of their non-wage operating costs locally. However, this varied greatly between enterprises, from as little as five per cent to 100 per cent. Seven hotels reported making voluntary financial contributions to local communities in 2004. These donations included gifts to schools, hospitals, old peoples’ homes, churches, civic societies, youth centres, Christmas celebrations, police, tourism police, and the Victoria Falls Anti-Poaching Unit. Several hotels cited additional charitable giving from corporate headquarters in Harare. Three hotels reported giving in kind support to local communities, including raffles of food and accommodation and donations of linen for a local community.
3.3.7 Knowledge of the proposed KAZA TFCA
Of the nine establishments surveyed, three (33 per cent) had knowledge of the proposed KAZA TFCA. Six respondents (67 per cent) had not heard of the initiative. Table 42 Source of knowledge of KAZA TFCA, Victoria Falls, 2005
Source Official
channels
Media Word of
mouth
Don’t know Total
No. 1 2 0 0 3 % 33 67 0 0 100
Table 43 Expected effect on business by KAZA TFCA, Victoria Falls, 2005
Effect
on business
Positive Negative Mixed Don’t know Total
No. 3 0 0 0 3 % 100 0 0 0 100
Table 44 Potential activities with KAZA TFCA, Victoria Falls, 2005
Undertake
the activity
Coordinate
with operations
in KAZA
countries
Joint
marketing
operations
Invest in
operations in
KAZA
countries
No change Other Total
No. that would 2 2 0 0 0 4* % 50 50 0 0 0 100
* Respondents had the choice of selecting more than one option
Table 45 Expected effect of KAZA TFCA on park resource quality, Victoria Falls, 2005
Effect on park
resource quality
Positive Negative Mixed Don’t know Total
No. 1 1 1 0 3 % 33 33 33 0 100
The few respondents aware of the initiative believed the TFCA would increase the number of tourists and encourage tourist traffic within and between countries in the region, as well as increasing the area available for wildlife, should improve policies and controls, and may increase the positive contribution of particular sectors (e.g. trophy hunters). Respondents believed that the possible impacts on park resources would not emerge for many years, and may be slightly contradictory – that is, the initiative should be good for economies due to the increased tourism, but infrastructure development would negatively impact on the environment and pollution would be expected to increase.
3.4 Accommodation, Upper Zambezi, Zambia The total number of enterprises surveyed was 16 (of a possible 24, operating in 2005). Results are presented for the 13 establishments operating in 2004. In section 3.4.7, regarding knowledge of the proposed KAZA TFCA, results from all 16 enterprises are included.
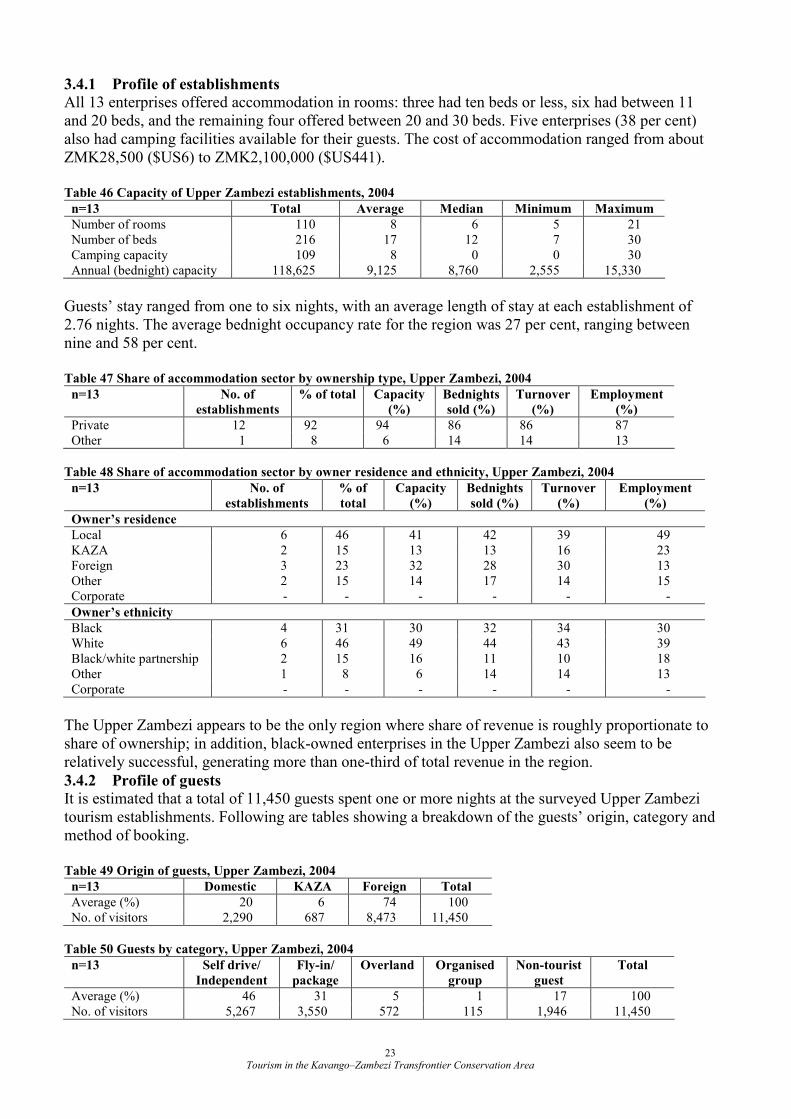
Tourism in the Kavango–Zambezi Transfrontier Conservation Area 23
3.4.1 Profile of establishments
All 13 enterprises offered accommodation in rooms: three had ten beds or less, six had between 11 and 20 beds, and the remaining four offered between 20 and 30 beds. Five enterprises (38 per cent) also had camping facilities available for their guests. The cost of accommodation ranged from about ZMK28,500 ($US6) to ZMK2,100,000 ($US441). Table 46 Capacity of Upper Zambezi establishments, 2004
n=13 Total Average Median Minimum Maximum
Number of rooms 110 8 6 5 21 Number of beds 216 17 12 7 30 Camping capacity 109 8 0 0 30 Annual (bednight) capacity 118,625 9,125 8,760 2,555 15,330
Guests’ stay ranged from one to six nights, with an average length of stay at each establishment of 2.76 nights. The average bednight occupancy rate for the region was 27 per cent, ranging between nine and 58 per cent. Table 47 Share of accommodation sector by ownership type, Upper Zambezi, 2004
n=13 No. of
establishments
% of total Capacity
(%)
Bednights
sold (%)
Turnover
(%)
Employment
(%)
Private 12 92 94 86 86 87 Other 1 8 6 14 14 13
Table 48 Share of accommodation sector by owner residence and ethnicity, Upper Zambezi, 2004
n=13 No. of
establishments
% of
total
Capacity
(%)
Bednights
sold (%)
Turnover
(%)
Employment
(%)
Owner’s residence
Local 6 46 41 42 39 49 KAZA 2 15 13 13 16 23 Foreign 3 23 32 28 30 13 Other 2 15 14 17 14 15 Corporate - - - - - -
Owner’s ethnicity
Black 4 31 30 32 34 30 White 6 46 49 44 43 39 Black/white partnership 2 15 16 11 10 18 Other 1 8 6 14 14 13 Corporate - - - - - -
The Upper Zambezi appears to be the only region where share of revenue is roughly proportionate to share of ownership; in addition, black-owned enterprises in the Upper Zambezi also seem to be relatively successful, generating more than one-third of total revenue in the region.
3.4.2 Profile of guests
It is estimated that a total of 11,450 guests spent one or more nights at the surveyed Upper Zambezi tourism establishments. Following are tables showing a breakdown of the guests’ origin, category and method of booking. Table 49 Origin of guests, Upper Zambezi, 2004
n=13 Domestic KAZA Foreign Total
Average (%) 20 6 74 100 No. of visitors 2,290 687 8,473 11,450
Table 50 Guests by category, Upper Zambezi, 2004
n=13 Self drive/
Independent
Fly-in/
package
Overland Organised
group
Non-tourist
guest
Total
Average (%) 46 31 5 1 17 100 No. of visitors 5,267 3,550 572 115 1,946 11,450
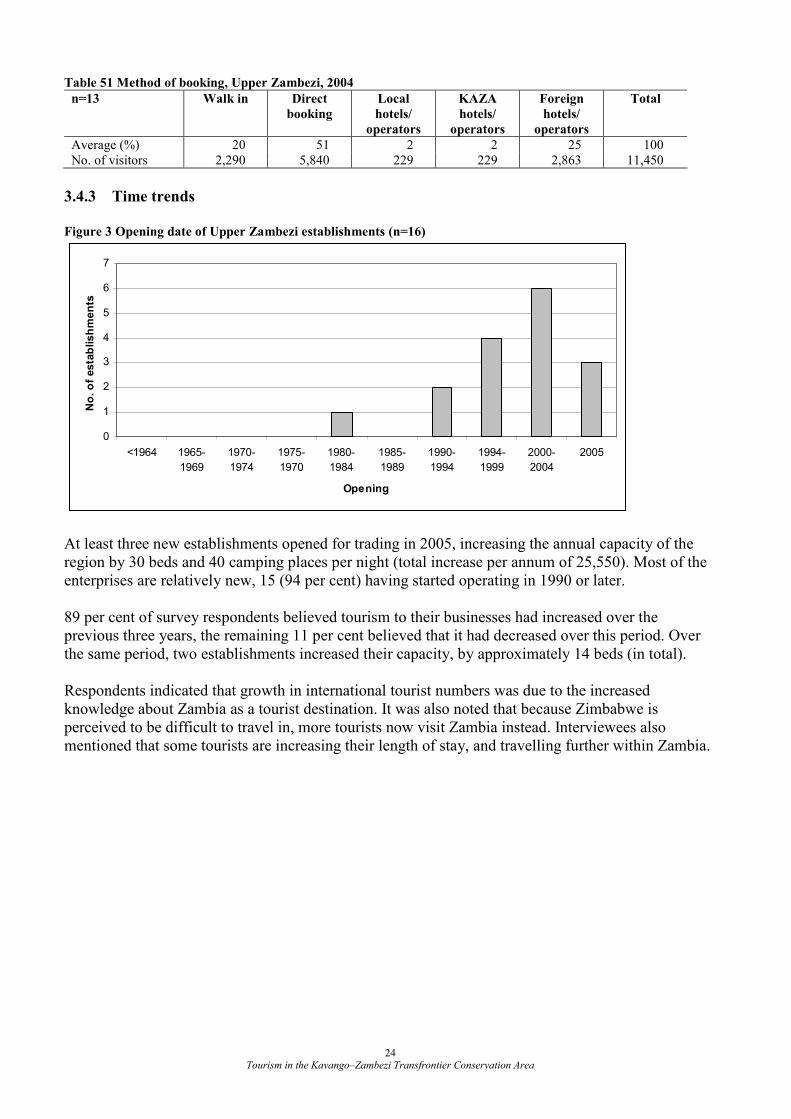
Tourism in the Kavango–Zambezi Transfrontier Conservation Area 24
Table 51 Method of booking, Upper Zambezi, 2004
n=13 Walk in Direct
booking
Local
hotels/
operators
KAZA
hotels/
operators
Foreign
hotels/
operators
Total
Average (%) 20 51 2 2 25 100 No. of visitors 2,290 5,840 229 229 2,863 11,450
3.4.3 Time trends
Figure 3 Opening date of Upper Zambezi establishments (n=16)
0
1
2
3
4
5
6
7
<1964 1965-
1969
1970-
1974
1975-
1970
1980-
1984
1985-
1989
1990-
1994
1994-
1999
2000-
2004
2005
Opening
No. of establishments
At least three new establishments opened for trading in 2005, increasing the annual capacity of the region by 30 beds and 40 camping places per night (total increase per annum of 25,550). Most of the enterprises are relatively new, 15 (94 per cent) having started operating in 1990 or later. 89 per cent of survey respondents believed tourism to their businesses had increased over the previous three years, the remaining 11 per cent believed that it had decreased over this period. Over the same period, two establishments increased their capacity, by approximately 14 beds (in total). Respondents indicated that growth in international tourist numbers was due to the increased knowledge about Zambia as a tourist destination. It was also noted that because Zimbabwe is perceived to be difficult to travel in, more tourists now visit Zambia instead. Interviewees also mentioned that some tourists are increasing their length of stay, and travelling further within Zambia.
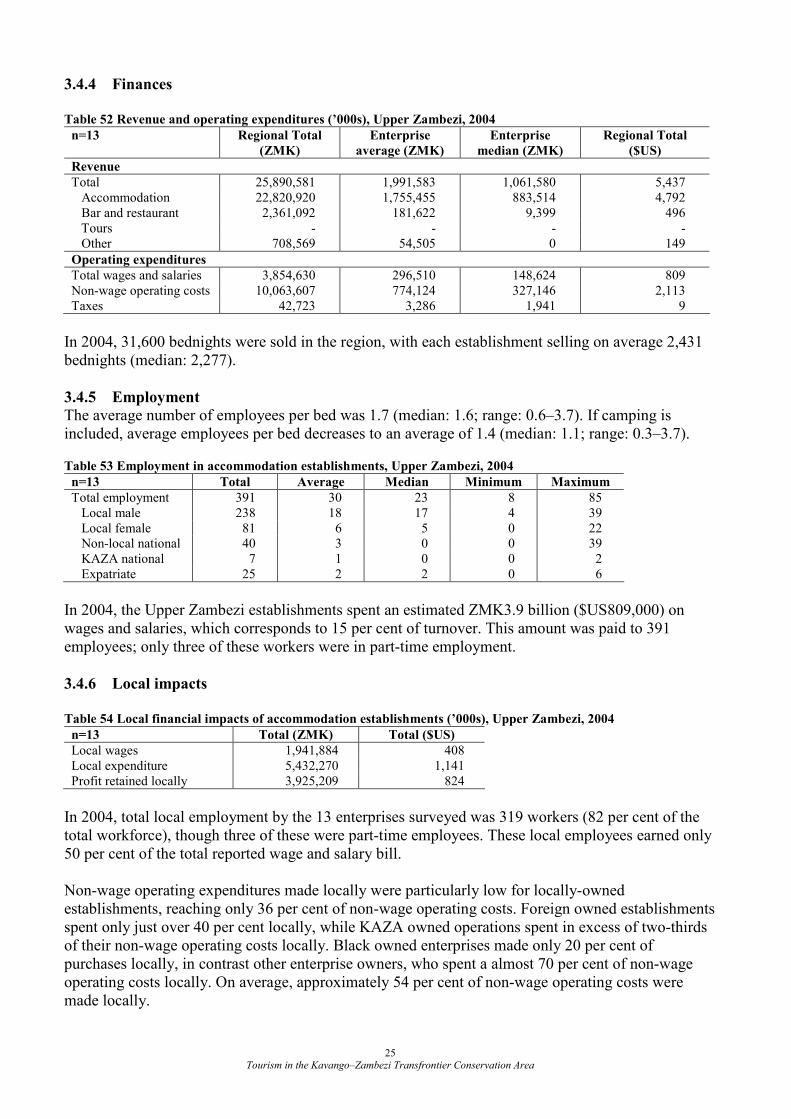
Tourism in the Kavango–Zambezi Transfrontier Conservation Area 25
3.4.4 Finances
Table 52 Revenue and operating expenditures (’000s), Upper Zambezi, 2004
n=13 Regional Total
(ZMK)
Enterprise
average (ZMK)
Enterprise
median (ZMK)
Regional Total
($US)
Revenue
Total 25,890,581 1,991,583 1,061,580 5,437 Accommodation 22,820,920 1,755,455 883,514 4,792 Bar and restaurant 2,361,092 181,622 9,399 496 Tours - - - - Other 708,569 54,505 0 149
Operating expenditures
Total wages and salaries 3,854,630 296,510 148,624 809 Non-wage operating costs 10,063,607 774,124 327,146 2,113 Taxes 42,723 3,286 1,941 9
In 2004, 31,600 bednights were sold in the region, with each establishment selling on average 2,431 bednights (median: 2,277).
3.4.5 Employment
The average number of employees per bed was 1.7 (median: 1.6; range: 0.6–3.7). If camping is included, average employees per bed decreases to an average of 1.4 (median: 1.1; range: 0.3–3.7).
Table 53 Employment in accommodation establishments, Upper Zambezi, 2004
n=13 Total Average Median Minimum Maximum
Total employment 391 30 23 8 85 Local male 238 18 17 4 39 Local female 81 6 5 0 22 Non-local national 40 3 0 0 39 KAZA national 7 1 0 0 2 Expatriate 25 2 2 0 6
In 2004, the Upper Zambezi establishments spent an estimated ZMK3.9 billion ($US809,000) on wages and salaries, which corresponds to 15 per cent of turnover. This amount was paid to 391 employees; only three of these workers were in part-time employment.
3.4.6 Local impacts
Table 54 Local financial impacts of accommodation establishments (’000s), Upper Zambezi, 2004
n=13 Total (ZMK) Total ($US)
Local wages 1,941,884 408 Local expenditure 5,432,270 1,141 Profit retained locally 3,925,209 824
In 2004, total local employment by the 13 enterprises surveyed was 319 workers (82 per cent of the total workforce), though three of these were part-time employees. These local employees earned only 50 per cent of the total reported wage and salary bill. Non-wage operating expenditures made locally were particularly low for locally-owned establishments, reaching only 36 per cent of non-wage operating costs. Foreign owned establishments spent only just over 40 per cent locally, while KAZA owned operations spent in excess of two-thirds of their non-wage operating costs locally. Black owned enterprises made only 20 per cent of purchases locally, in contrast other enterprise owners, who spent a almost 70 per cent of non-wage operating costs locally. On average, approximately 54 per cent of non-wage operating costs were made locally.
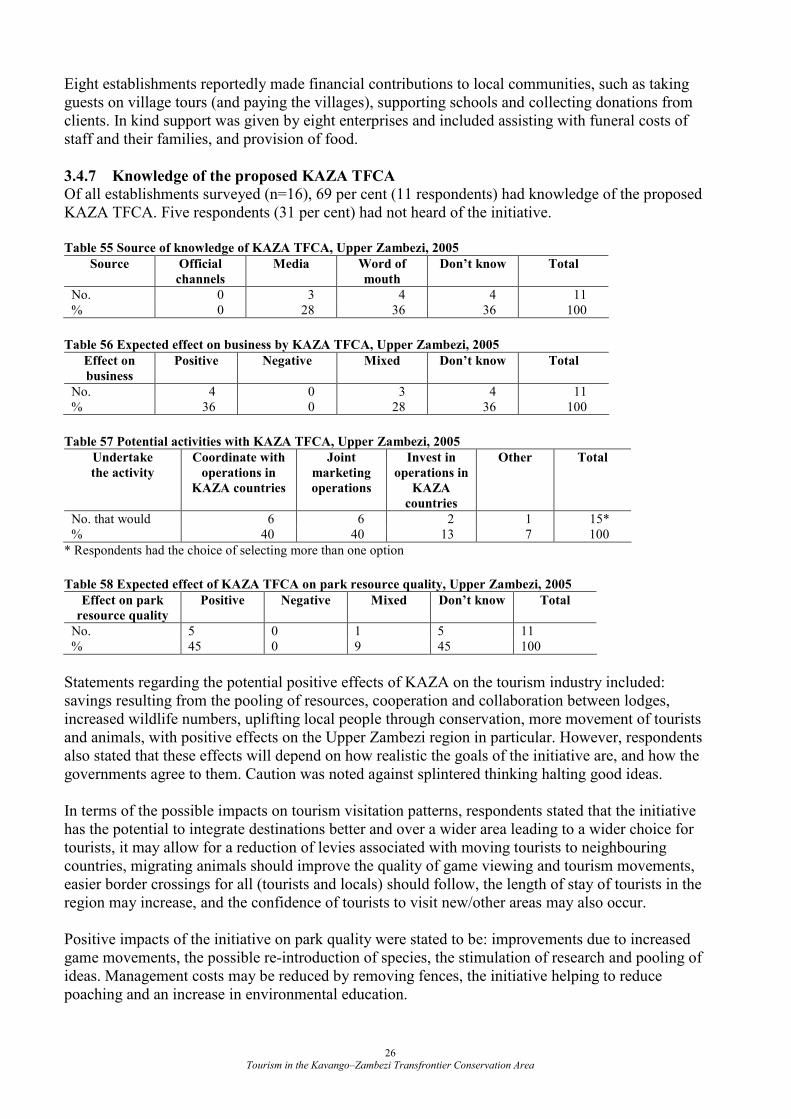
Tourism in the Kavango–Zambezi Transfrontier Conservation Area 26
Eight establishments reportedly made financial contributions to local communities, such as taking guests on village tours (and paying the villages), supporting schools and collecting donations from clients. In kind support was given by eight enterprises and included assisting with funeral costs of staff and their families, and provision of food.
3.4.7 Knowledge of the proposed KAZA TFCA
Of all establishments surveyed (n=16), 69 per cent (11 respondents) had knowledge of the proposed KAZA TFCA. Five respondents (31 per cent) had not heard of the initiative. Table 55 Source of knowledge of KAZA TFCA, Upper Zambezi, 2005
Source Official
channels
Media Word of
mouth
Don’t know Total
No. 0 3 4 4 11 % 0 28 36 36 100
Table 56 Expected effect on business by KAZA TFCA, Upper Zambezi, 2005
Effect on
business
Positive Negative Mixed Don’t know Total
No. 4 0 3 4 11 % 36 0 28 36 100
Table 57 Potential activities with KAZA TFCA, Upper Zambezi, 2005
Undertake
the activity
Coordinate with
operations in
KAZA countries
Joint
marketing
operations
Invest in
operations in
KAZA
countries
Other Total
No. that would 6 6 2 1 15* % 40 40 13 7 100
* Respondents had the choice of selecting more than one option
Table 58 Expected effect of KAZA TFCA on park resource quality, Upper Zambezi, 2005
Effect on park
resource quality
Positive Negative Mixed Don’t know Total
No. 5 0 1 5 11 % 45 0 9 45 100
Statements regarding the potential positive effects of KAZA on the tourism industry included: savings resulting from the pooling of resources, cooperation and collaboration between lodges, increased wildlife numbers, uplifting local people through conservation, more movement of tourists and animals, with positive effects on the Upper Zambezi region in particular. However, respondents also stated that these effects will depend on how realistic the goals of the initiative are, and how the governments agree to them. Caution was noted against splintered thinking halting good ideas. In terms of the possible impacts on tourism visitation patterns, respondents stated that the initiative has the potential to integrate destinations better and over a wider area leading to a wider choice for tourists, it may allow for a reduction of levies associated with moving tourists to neighbouring countries, migrating animals should improve the quality of game viewing and tourism movements, easier border crossings for all (tourists and locals) should follow, the length of stay of tourists in the region may increase, and the confidence of tourists to visit new/other areas may also occur. Positive impacts of the initiative on park quality were stated to be: improvements due to increased game movements, the possible re-introduction of species, the stimulation of research and pooling of ideas. Management costs may be reduced by removing fences, the initiative helping to reduce poaching and an increase in environmental education.
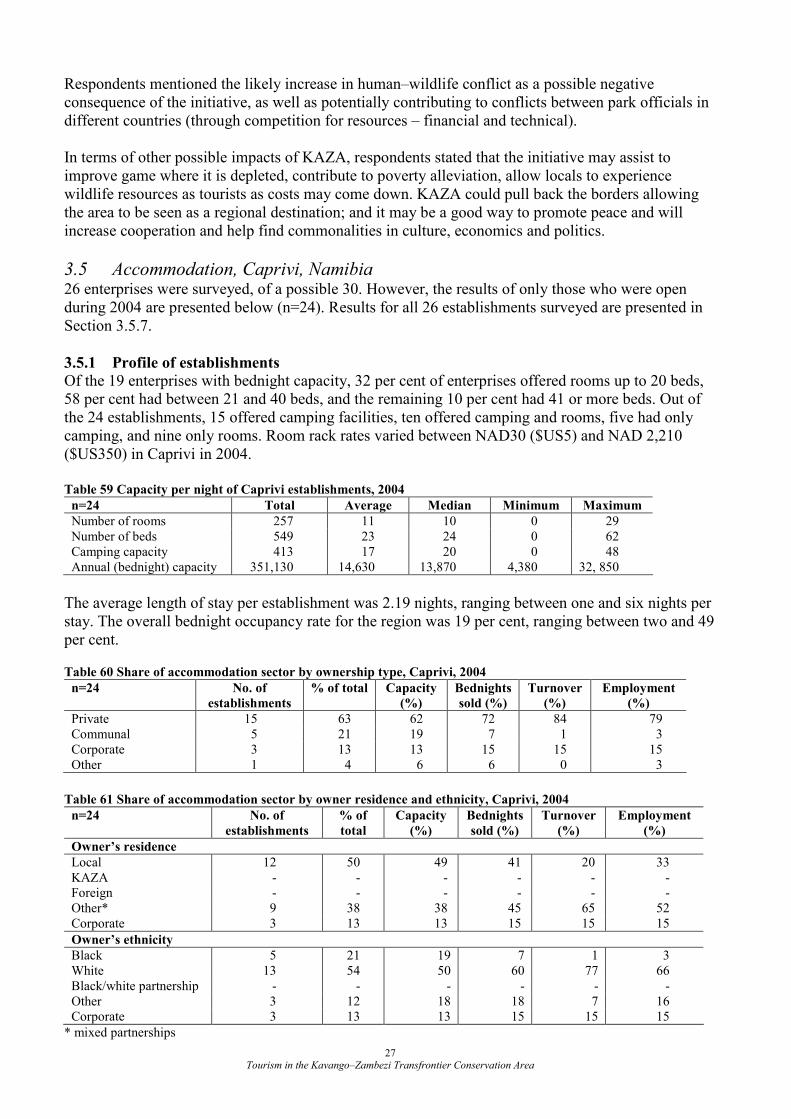
Tourism in the Kavango–Zambezi Transfrontier Conservation Area 27
Respondents mentioned the likely increase in human–wildlife conflict as a possible negative consequence of the initiative, as well as potentially contributing to conflicts between park officials in different countries (through competition for resources – financial and technical). In terms of other possible impacts of KAZA, respondents stated that the initiative may assist to improve game where it is depleted, contribute to poverty alleviation, allow locals to experience wildlife resources as tourists as costs may come down. KAZA could pull back the borders allowing the area to be seen as a regional destination; and it may be a good way to promote peace and will increase cooperation and help find commonalities in culture, economics and politics.
3.5 Accommodation, Caprivi, Namibia 26 enterprises were surveyed, of a possible 30. However, the results of only those who were open during 2004 are presented below (n=24). Results for all 26 establishments surveyed are presented in Section 3.5.7.
3.5.1 Profile of establishments
Of the 19 enterprises with bednight capacity, 32 per cent of enterprises offered rooms up to 20 beds, 58 per cent had between 21 and 40 beds, and the remaining 10 per cent had 41 or more beds. Out of the 24 establishments, 15 offered camping facilities, ten offered camping and rooms, five had only camping, and nine only rooms. Room rack rates varied between NAD30 ($US5) and NAD 2,210 ($US350) in Caprivi in 2004. Table 59 Capacity per night of Caprivi establishments, 2004
n=24 Total Average Median Minimum Maximum
Number of rooms 257 11 10 0 29 Number of beds 549 23 24 0 62 Camping capacity 413 17 20 0 48 Annual (bednight) capacity 351,130 14,630 13,870 4,380 32, 850
The average length of stay per establishment was 2.19 nights, ranging between one and six nights per stay. The overall bednight occupancy rate for the region was 19 per cent, ranging between two and 49 per cent.
Table 60 Share of accommodation sector by ownership type, Caprivi, 2004
n=24 No. of
establishments
% of total Capacity
(%)
Bednights
sold (%)
Turnover
(%)
Employment
(%)
Private 15 63 62 72 84 79 Communal 5 21 19 7 1 3 Corporate 3 13 13 15 15 15 Other 1 4 6 6 0 3
Table 61 Share of accommodation sector by owner residence and ethnicity, Caprivi, 2004
n=24 No. of
establishments
% of
total
Capacity
(%)
Bednights
sold (%)
Turnover
(%)
Employment
(%)
Owner’s residence
Local 12 50 49 41 20 33 KAZA - - - - - - Foreign - - - - - - Other* 9 38 38 45 65 52 Corporate 3 13 13 15 15 15
Owner’s ethnicity
Black 5 21 19 7 1 3 White 13 54 50 60 77 66 Black/white partnership - - - - - - Other 3 12 18 18 7 16 Corporate 3 13 13 15 15 15
* mixed partnerships
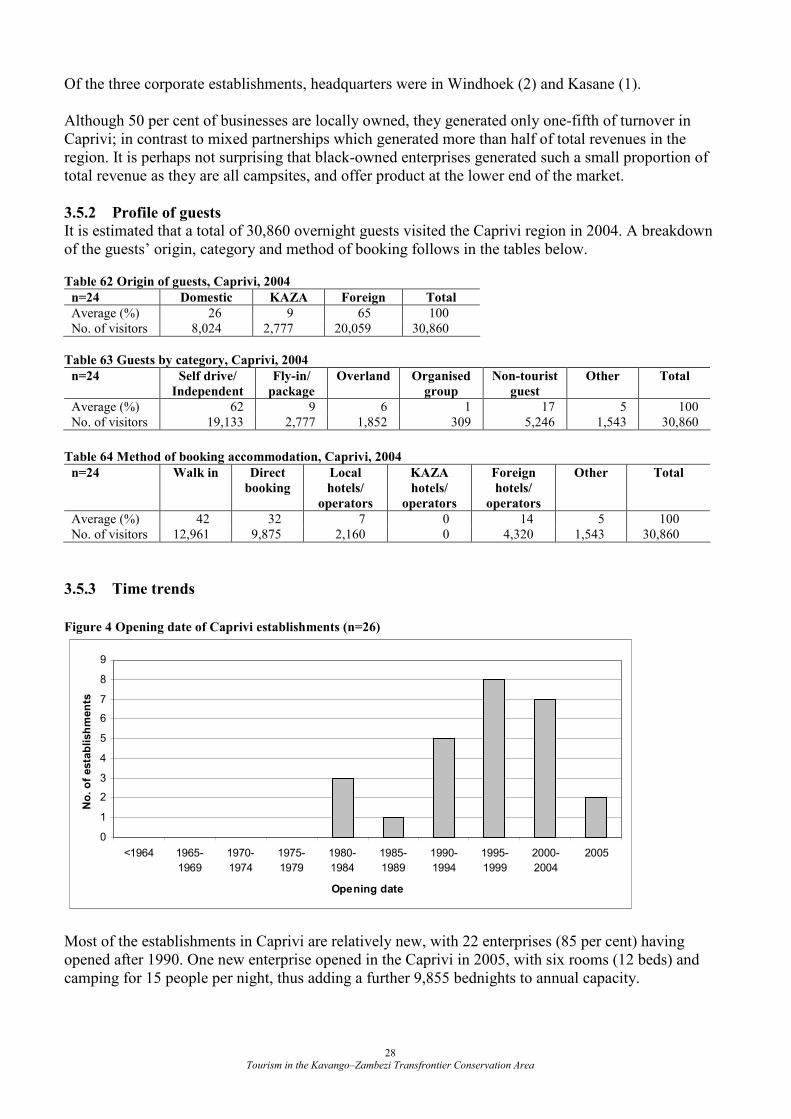
Tourism in the Kavango–Zambezi Transfrontier Conservation Area 28
Of the three corporate establishments, headquarters were in Windhoek (2) and Kasane (1). Although 50 per cent of businesses are locally owned, they generated only one-fifth of turnover in Caprivi; in contrast to mixed partnerships which generated more than half of total revenues in the region. It is perhaps not surprising that black-owned enterprises generated such a small proportion of total revenue as they are all campsites, and offer product at the lower end of the market.
3.5.2 Profile of guests
It is estimated that a total of 30,860 overnight guests visited the Caprivi region in 2004. A breakdown of the guests’ origin, category and method of booking follows in the tables below.
Table 62 Origin of guests, Caprivi, 2004
n=24 Domestic KAZA Foreign Total
Average (%) 26 9 65 100 No. of visitors 8,024 2,777 20,059 30,860
Table 63 Guests by category, Caprivi, 2004
n=24 Self drive/
Independent
Fly-in/
package
Overland Organised
group
Non-tourist
guest
Other Total
Average (%) 62 9 6 1 17 5 100 No. of visitors 19,133 2,777 1,852 309 5,246 1,543 30,860
Table 64 Method of booking accommodation, Caprivi, 2004
n=24 Walk in Direct
booking
Local
hotels/
operators
KAZA
hotels/
operators
Foreign
hotels/
operators
Other Total
Average (%) 42 32 7 0 14 5 100 No. of visitors 12,961 9,875 2,160 0 4,320 1,543 30,860
3.5.3 Time trends
Figure 4 Opening date of Caprivi establishments (n=26)
0
1
2
3
4
5
6
7
8
9
<1964 1965-
1969
1970-
1974
1975-
1979
1980-
1984
1985-
1989
1990-
1994
1995-
1999
2000-
2004
2005
Opening date
No. of establishments
Most of the establishments in Caprivi are relatively new, with 22 enterprises (85 per cent) having opened after 1990. One new enterprise opened in the Caprivi in 2005, with six rooms (12 beds) and camping for 15 people per night, thus adding a further 9,855 bednights to annual capacity.
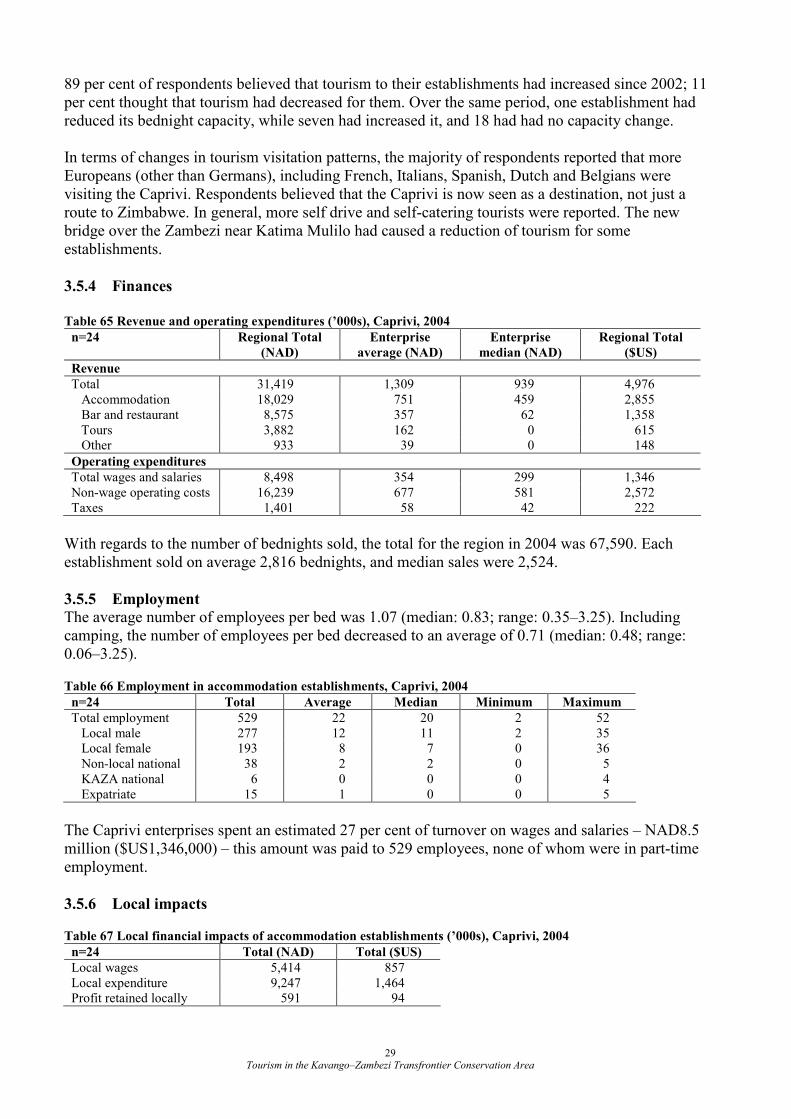
Tourism in the Kavango–Zambezi Transfrontier Conservation Area 29
89 per cent of respondents believed that tourism to their establishments had increased since 2002; 11 per cent thought that tourism had decreased for them. Over the same period, one establishment had reduced its bednight capacity, while seven had increased it, and 18 had had no capacity change. In terms of changes in tourism visitation patterns, the majority of respondents reported that more Europeans (other than Germans), including French, Italians, Spanish, Dutch and Belgians were visiting the Caprivi. Respondents believed that the Caprivi is now seen as a destination, not just a route to Zimbabwe. In general, more self drive and self-catering tourists were reported. The new bridge over the Zambezi near Katima Mulilo had caused a reduction of tourism for some establishments.
3.5.4 Finances
Table 65 Revenue and operating expenditures (’000s), Caprivi, 2004
n=24 Regional Total
(NAD)
Enterprise
average (NAD)
Enterprise
median (NAD)
Regional Total
($US)
Revenue
Total 31,419 1,309 939 4,976 Accommodation 18,029 751 459 2,855 Bar and restaurant 8,575 357 62 1,358 Tours 3,882 162 0 615 Other 933 39 0 148
Operating expenditures
Total wages and salaries 8,498 354 299 1,346 Non-wage operating costs 16,239 677 581 2,572 Taxes 1,401 58 42 222
With regards to the number of bednights sold, the total for the region in 2004 was 67,590. Each establishment sold on average 2,816 bednights, and median sales were 2,524.
3.5.5 Employment
The average number of employees per bed was 1.07 (median: 0.83; range: 0.35–3.25). Including camping, the number of employees per bed decreased to an average of 0.71 (median: 0.48; range: 0.06–3.25).
Table 66 Employment in accommodation establishments, Caprivi, 2004
n=24 Total Average Median Minimum Maximum
Total employment 529 22 20 2 52 Local male 277 12 11 2 35 Local female 193 8 7 0 36 Non-local national 38 2 2 0 5 KAZA national 6 0 0 0 4 Expatriate 15 1 0 0 5
The Caprivi enterprises spent an estimated 27 per cent of turnover on wages and salaries – NAD8.5 million ($US1,346,000) – this amount was paid to 529 employees, none of whom were in part-time employment.
3.5.6 Local impacts
Table 67 Local financial impacts of accommodation establishments (’000s), Caprivi, 2004
n=24 Total (NAD) Total ($US)
Local wages 5,414 857 Local expenditure 9,247 1,464 Profit retained locally 591 94
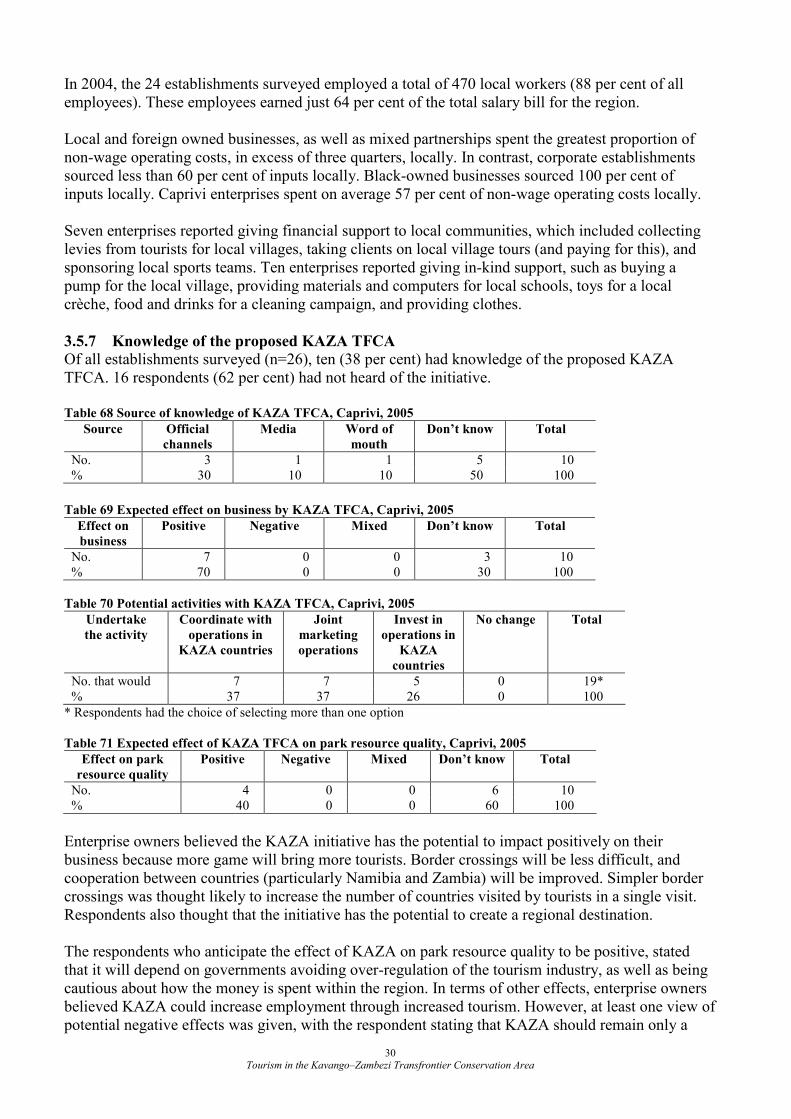
Tourism in the Kavango–Zambezi Transfrontier Conservation Area 30
In 2004, the 24 establishments surveyed employed a total of 470 local workers (88 per cent of all employees). These employees earned just 64 per cent of the total salary bill for the region. Local and foreign owned businesses, as well as mixed partnerships spent the greatest proportion of non-wage operating costs, in excess of three quarters, locally. In contrast, corporate establishments sourced less than 60 per cent of inputs locally. Black-owned businesses sourced 100 per cent of inputs locally. Caprivi enterprises spent on average 57 per cent of non-wage operating costs locally. Seven enterprises reported giving financial support to local communities, which included collecting levies from tourists for local villages, taking clients on local village tours (and paying for this), and sponsoring local sports teams. Ten enterprises reported giving in-kind support, such as buying a pump for the local village, providing materials and computers for local schools, toys for a local crèche, food and drinks for a cleaning campaign, and providing clothes.
3.5.7 Knowledge of the proposed KAZA TFCA
Of all establishments surveyed (n=26), ten (38 per cent) had knowledge of the proposed KAZA TFCA. 16 respondents (62 per cent) had not heard of the initiative. Table 68 Source of knowledge of KAZA TFCA, Caprivi, 2005
Source Official
channels
Media Word of
mouth
Don’t know Total
No. 3 1 1 5 10 % 30 10 10 50 100
Table 69 Expected effect on business by KAZA TFCA, Caprivi, 2005
Effect on
business
Positive Negative Mixed Don’t know Total
No. 7 0 0 3 10 % 70 0 0 30 100
Table 70 Potential activities with KAZA TFCA, Caprivi, 2005
Undertake
the activity
Coordinate with
operations in
KAZA countries
Joint
marketing
operations
Invest in
operations in
KAZA
countries
No change Total
No. that would 7 7 5 0 19* % 37 37 26 0 100
* Respondents had the choice of selecting more than one option
Table 71 Expected effect of KAZA TFCA on park resource quality, Caprivi, 2005
Effect on park
resource quality
Positive Negative Mixed Don’t know Total
No. 4 0 0 6 10 % 40 0 0 60 100
Enterprise owners believed the KAZA initiative has the potential to impact positively on their business because more game will bring more tourists. Border crossings will be less difficult, and cooperation between countries (particularly Namibia and Zambia) will be improved. Simpler border crossings was thought likely to increase the number of countries visited by tourists in a single visit. Respondents also thought that the initiative has the potential to create a regional destination. The respondents who anticipate the effect of KAZA on park resource quality to be positive, stated that it will depend on governments avoiding over-regulation of the tourism industry, as well as being cautious about how the money is spent within the region. In terms of other effects, enterprise owners believed KAZA could increase employment through increased tourism. However, at least one view of potential negative effects was given, with the respondent stating that KAZA should remain only a
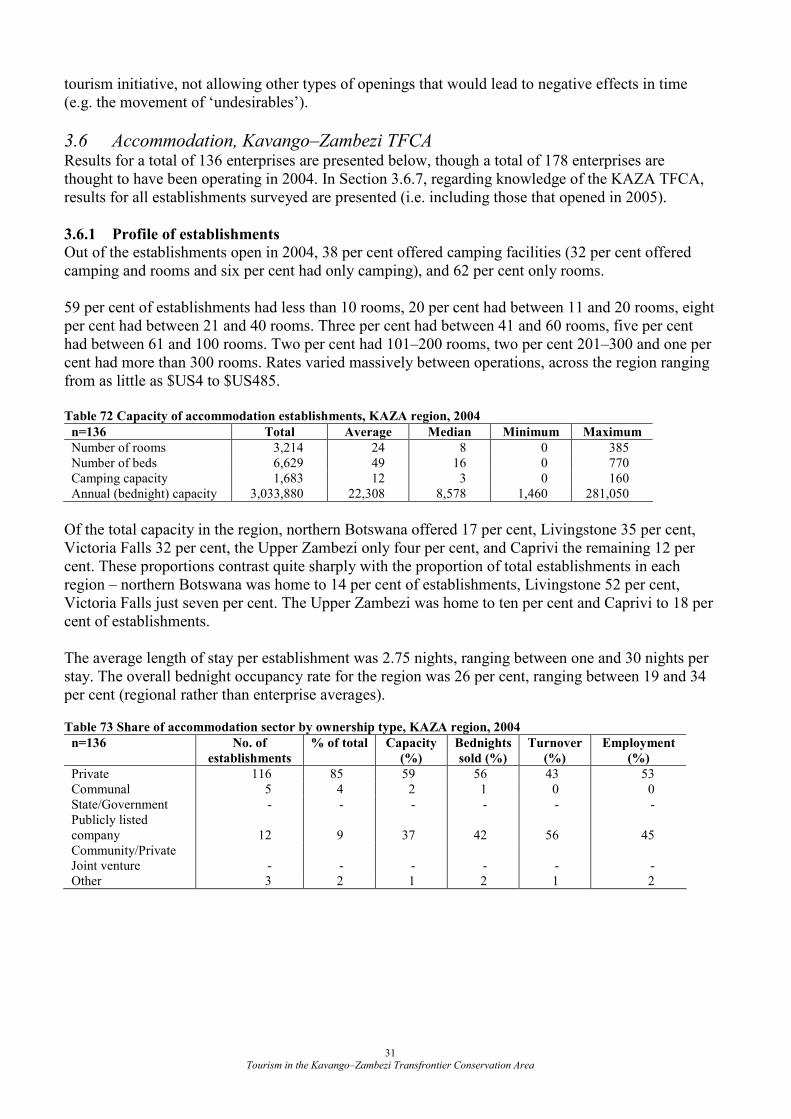
Tourism in the Kavango–Zambezi Transfrontier Conservation Area 31
tourism initiative, not allowing other types of openings that would lead to negative effects in time (e.g. the movement of ‘undesirables’).
3.6 Accommodation, Kavango–Zambezi TFCA Results for a total of 136 enterprises are presented below, though a total of 178 enterprises are thought to have been operating in 2004. In Section 3.6.7, regarding knowledge of the KAZA TFCA, results for all establishments surveyed are presented (i.e. including those that opened in 2005).
3.6.1 Profile of establishments
Out of the establishments open in 2004, 38 per cent offered camping facilities (32 per cent offered camping and rooms and six per cent had only camping), and 62 per cent only rooms. 59 per cent of establishments had less than 10 rooms, 20 per cent had between 11 and 20 rooms, eight per cent had between 21 and 40 rooms. Three per cent had between 41 and 60 rooms, five per cent had between 61 and 100 rooms. Two per cent had 101–200 rooms, two per cent 201–300 and one per cent had more than 300 rooms. Rates varied massively between operations, across the region ranging from as little as $US4 to $US485. Table 72 Capacity of accommodation establishments, KAZA region, 2004
n=136 Total Average Median Minimum Maximum
Number of rooms 3,214 24 8 0 385 Number of beds 6,629 49 16 0 770 Camping capacity 1,683 12 3 0 160 Annual (bednight) capacity 3,033,880 22,308 8,578 1,460 281,050
Of the total capacity in the region, northern Botswana offered 17 per cent, Livingstone 35 per cent, Victoria Falls 32 per cent, the Upper Zambezi only four per cent, and Caprivi the remaining 12 per cent. These proportions contrast quite sharply with the proportion of total establishments in each region – northern Botswana was home to 14 per cent of establishments, Livingstone 52 per cent, Victoria Falls just seven per cent. The Upper Zambezi was home to ten per cent and Caprivi to 18 per cent of establishments. The average length of stay per establishment was 2.75 nights, ranging between one and 30 nights per stay. The overall bednight occupancy rate for the region was 26 per cent, ranging between 19 and 34 per cent (regional rather than enterprise averages).
Table 73 Share of accommodation sector by ownership type, KAZA region, 2004
n=136 No. of
establishments
% of total Capacity
(%)
Bednights
sold (%)
Turnover
(%)
Employment
(%)
Private 116 85 59 56 43 53 Communal 5 4 2 1 0 0 State/Government - - - - - - Publicly listed company
12
9
37
42
56
45
Community/Private Joint venture
-
-
-
-
-
-
Other 3 2 1 2 1 2
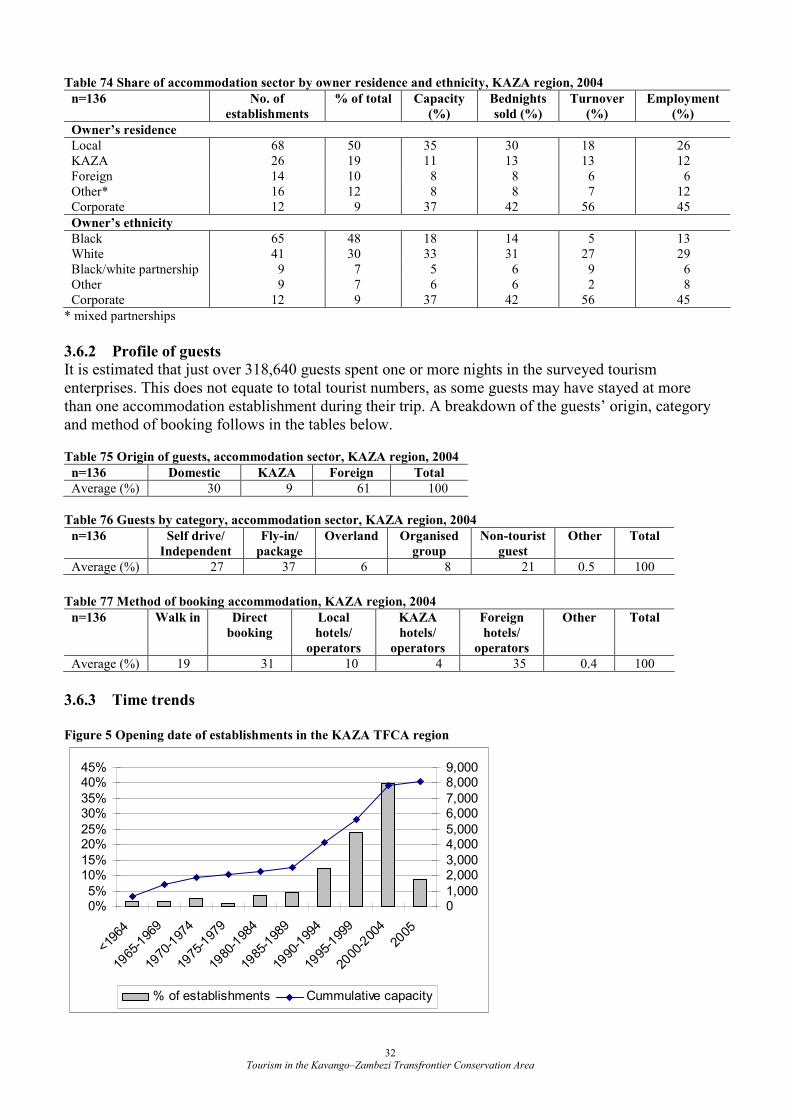
Tourism in the Kavango–Zambezi Transfrontier Conservation Area 32
Table 74 Share of accommodation sector by owner residence and ethnicity, KAZA region, 2004
n=136 No. of
establishments
% of total Capacity
(%)
Bednights
sold (%)
Turnover
(%)
Employment
(%)
Owner’s residence
Local 68 50 35 30 18 26 KAZA 26 19 11 13 13 12 Foreign 14 10 8 8 6 6 Other* 16 12 8 8 7 12 Corporate 12 9 37 42 56 45
Owner’s ethnicity
Black 65 48 18 14 5 13 White 41 30 33 31 27 29 Black/white partnership 9 7 5 6 9 6 Other 9 7 6 6 2 8 Corporate 12 9 37 42 56 45
* mixed partnerships
3.6.2 Profile of guests
It is estimated that just over 318,640 guests spent one or more nights in the surveyed tourism enterprises. This does not equate to total tourist numbers, as some guests may have stayed at more than one accommodation establishment during their trip. A breakdown of the guests’ origin, category and method of booking follows in the tables below.
Table 75 Origin of guests, accommodation sector, KAZA region, 2004
n=136 Domestic KAZA Foreign Total
Average (%) 30 9 61 100
Table 76 Guests by category, accommodation sector, KAZA region, 2004
n=136 Self drive/
Independent
Fly-in/
package
Overland Organised
group
Non-tourist
guest
Other Total
Average (%) 27 37 6 8 21 0.5 100
Table 77 Method of booking accommodation, KAZA region, 2004
n=136 Walk in Direct
booking
Local
hotels/
operators
KAZA
hotels/
operators
Foreign
hotels/
operators
Other Total
Average (%) 19 31 10 4 35 0.4 100
3.6.3 Time trends
Figure 5 Opening date of establishments in the KAZA TFCA region
0%5%
10%15%
20%25%
30%35%
40%45%
<1964
1965-1969
1970-1974
1975-1979
1980-1984
1985-1989
1990-1994
1995-1999
2000-2004
2005
01,000
2,0003,000
4,0005,000
6,0007,000
8,0009,000
% of establishments Cummulative capacity
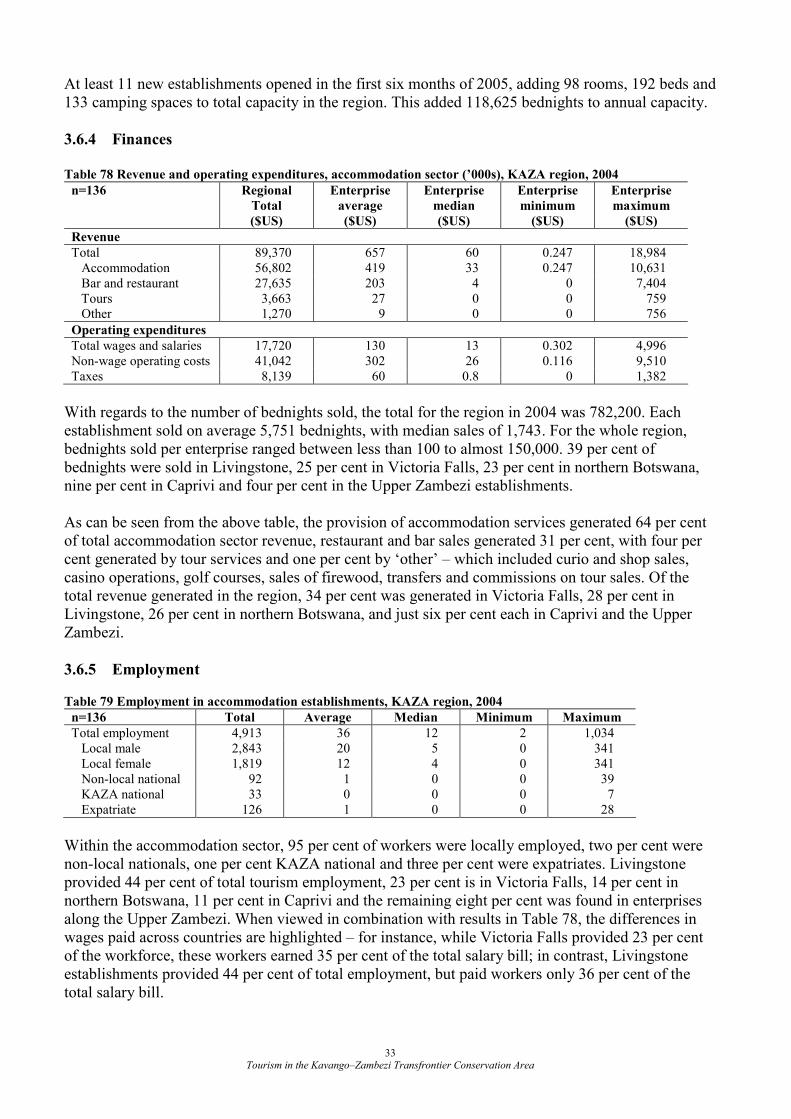
Tourism in the Kavango–Zambezi Transfrontier Conservation Area 33
At least 11 new establishments opened in the first six months of 2005, adding 98 rooms, 192 beds and 133 camping spaces to total capacity in the region. This added 118,625 bednights to annual capacity.
3.6.4 Finances
Table 78 Revenue and operating expenditures, accommodation sector (’000s), KAZA region, 2004
n=136 Regional
Total
($US)
Enterprise
average
($US)
Enterprise
median
($US)
Enterprise
minimum
($US)
Enterprise
maximum
($US)
Revenue
Total 89,370 657 60 0.247 18,984 Accommodation 56,802 419 33 0.247 10,631 Bar and restaurant 27,635 203 4 0 7,404 Tours 3,663 27 0 0 759 Other 1,270 9 0 0 756
Operating expenditures
Total wages and salaries 17,720 130 13 0.302 4,996 Non-wage operating costs 41,042 302 26 0.116 9,510 Taxes 8,139 60 0.8 0 1,382
With regards to the number of bednights sold, the total for the region in 2004 was 782,200. Each establishment sold on average 5,751 bednights, with median sales of 1,743. For the whole region, bednights sold per enterprise ranged between less than 100 to almost 150,000. 39 per cent of bednights were sold in Livingstone, 25 per cent in Victoria Falls, 23 per cent in northern Botswana, nine per cent in Caprivi and four per cent in the Upper Zambezi establishments. As can be seen from the above table, the provision of accommodation services generated 64 per cent of total accommodation sector revenue, restaurant and bar sales generated 31 per cent, with four per cent generated by tour services and one per cent by ‘other’ – which included curio and shop sales, casino operations, golf courses, sales of firewood, transfers and commissions on tour sales. Of the total revenue generated in the region, 34 per cent was generated in Victoria Falls, 28 per cent in Livingstone, 26 per cent in northern Botswana, and just six per cent each in Caprivi and the Upper Zambezi.
3.6.5 Employment
Table 79 Employment in accommodation establishments, KAZA region, 2004
n=136 Total Average Median Minimum Maximum
Total employment 4,913 36 12 2 1,034 Local male 2,843 20 5 0 341 Local female 1,819 12 4 0 341 Non-local national 92 1 0 0 39 KAZA national 33 0 0 0 7 Expatriate 126 1 0 0 28
Within the accommodation sector, 95 per cent of workers were locally employed, two per cent were non-local nationals, one per cent KAZA national and three per cent were expatriates. Livingstone provided 44 per cent of total tourism employment, 23 per cent is in Victoria Falls, 14 per cent in northern Botswana, 11 per cent in Caprivi and the remaining eight per cent was found in enterprises along the Upper Zambezi. When viewed in combination with results in Table 78, the differences in wages paid across countries are highlighted – for instance, while Victoria Falls provided 23 per cent of the workforce, these workers earned 35 per cent of the total salary bill; in contrast, Livingstone establishments provided 44 per cent of total employment, but paid workers only 36 per cent of the total salary bill.
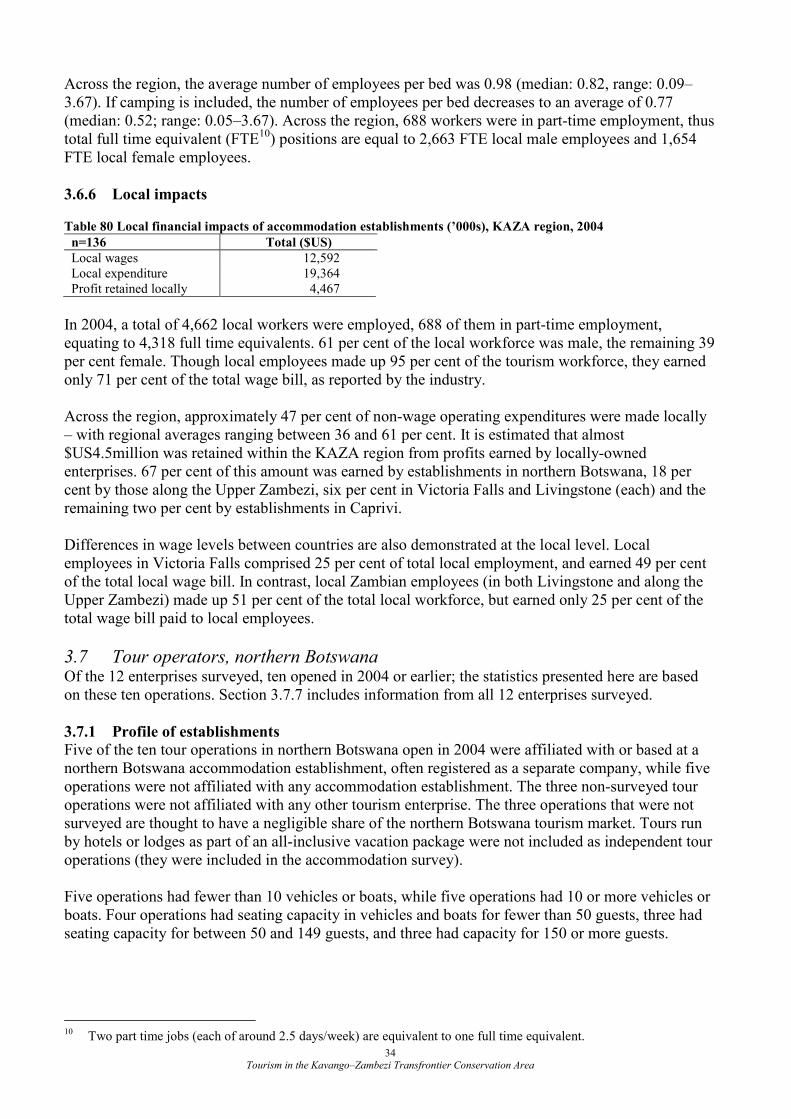
Tourism in the Kavango–Zambezi Transfrontier Conservation Area 34
Across the region, the average number of employees per bed was 0.98 (median: 0.82, range: 0.09–3.67). If camping is included, the number of employees per bed decreases to an average of 0.77 (median: 0.52; range: 0.05–3.67). Across the region, 688 workers were in part-time employment, thus total full time equivalent (FTE10) positions are equal to 2,663 FTE local male employees and 1,654 FTE local female employees.
3.6.6 Local impacts
Table 80 Local financial impacts of accommodation establishments (’000s), KAZA region, 2004
n=136 Total ($US)
Local wages 12,592 Local expenditure 19,364 Profit retained locally 4,467
In 2004, a total of 4,662 local workers were employed, 688 of them in part-time employment, equating to 4,318 full time equivalents. 61 per cent of the local workforce was male, the remaining 39 per cent female. Though local employees made up 95 per cent of the tourism workforce, they earned only 71 per cent of the total wage bill, as reported by the industry. Across the region, approximately 47 per cent of non-wage operating expenditures were made locally – with regional averages ranging between 36 and 61 per cent. It is estimated that almost $US4.5million was retained within the KAZA region from profits earned by locally-owned enterprises. 67 per cent of this amount was earned by establishments in northern Botswana, 18 per cent by those along the Upper Zambezi, six per cent in Victoria Falls and Livingstone (each) and the remaining two per cent by establishments in Caprivi. Differences in wage levels between countries are also demonstrated at the local level. Local employees in Victoria Falls comprised 25 per cent of total local employment, and earned 49 per cent of the total local wage bill. In contrast, local Zambian employees (in both Livingstone and along the Upper Zambezi) made up 51 per cent of the total local workforce, but earned only 25 per cent of the total wage bill paid to local employees.
3.7 Tour operators, northern Botswana Of the 12 enterprises surveyed, ten opened in 2004 or earlier; the statistics presented here are based on these ten operations. Section 3.7.7 includes information from all 12 enterprises surveyed.
3.7.1 Profile of establishments
Five of the ten tour operations in northern Botswana open in 2004 were affiliated with or based at a northern Botswana accommodation establishment, often registered as a separate company, while five operations were not affiliated with any accommodation establishment. The three non-surveyed tour operations were not affiliated with any other tourism enterprise. The three operations that were not surveyed are thought to have a negligible share of the northern Botswana tourism market. Tours run by hotels or lodges as part of an all-inclusive vacation package were not included as independent tour operations (they were included in the accommodation survey). Five operations had fewer than 10 vehicles or boats, while five operations had 10 or more vehicles or boats. Four operations had seating capacity in vehicles and boats for fewer than 50 guests, three had seating capacity for between 50 and 149 guests, and three had capacity for 150 or more guests.
10 Two part time jobs (each of around 2.5 days/week) are equivalent to one full time equivalent.
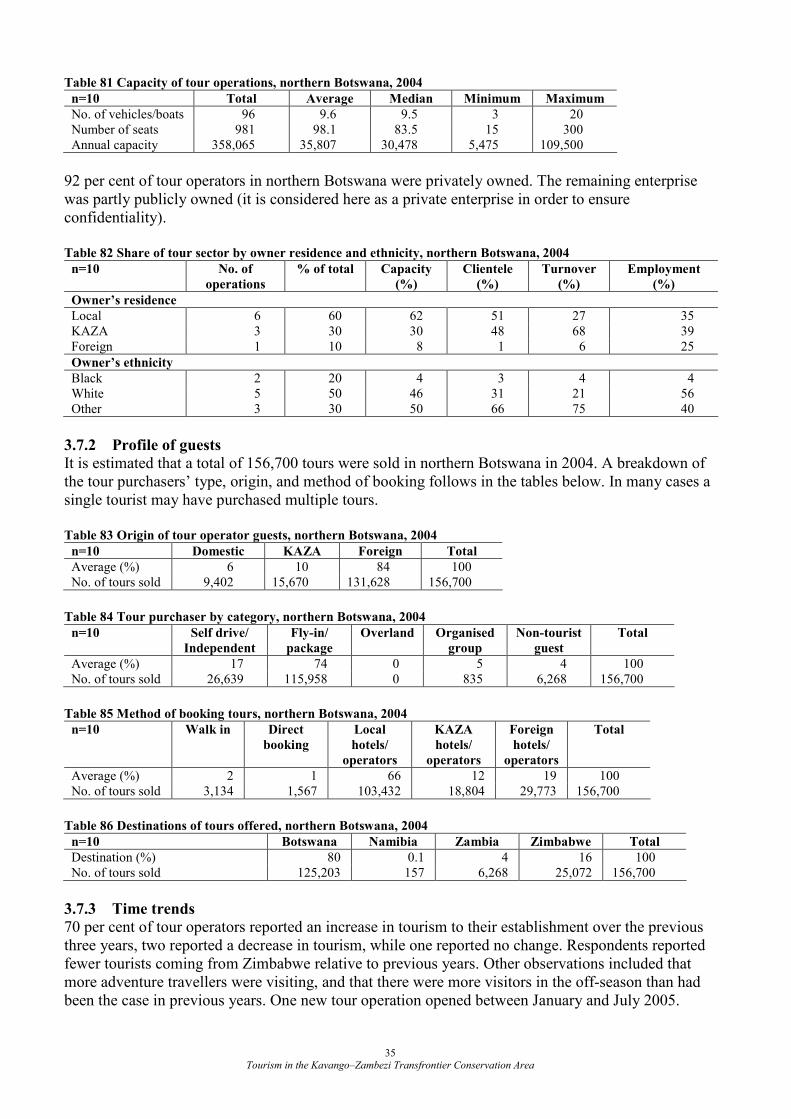
Tourism in the Kavango–Zambezi Transfrontier Conservation Area 35
Table 81 Capacity of tour operations, northern Botswana, 2004
n=10 Total Average Median Minimum Maximum
No. of vehicles/boats 96 9.6 9.5 3 20 Number of seats 981 98.1 83.5 15 300 Annual capacity 358,065 35,807 30,478 5,475 109,500
92 per cent of tour operators in northern Botswana were privately owned. The remaining enterprise was partly publicly owned (it is considered here as a private enterprise in order to ensure confidentiality). Table 82 Share of tour sector by owner residence and ethnicity, northern Botswana, 2004
n=10 No. of
operations
% of total Capacity
(%)
Clientele
(%)
Turnover
(%)
Employment
(%)
Owner’s residence
Local 6 60 62 51 27 35 KAZA 3 30 30 48 68 39 Foreign 1 10 8 1 6 25
Owner’s ethnicity
Black 2 20 4 3 4 4 White 5 50 46 31 21 56 Other 3 30 50 66 75 40
3.7.2 Profile of guests
It is estimated that a total of 156,700 tours were sold in northern Botswana in 2004. A breakdown of the tour purchasers’ type, origin, and method of booking follows in the tables below. In many cases a single tourist may have purchased multiple tours. Table 83 Origin of tour operator guests, northern Botswana, 2004
n=10 Domestic KAZA Foreign Total
Average (%) 6 10 84 100 No. of tours sold 9,402 15,670 131,628 156,700
Table 84 Tour purchaser by category, northern Botswana, 2004
n=10 Self drive/
Independent
Fly-in/
package
Overland Organised
group
Non-tourist
guest
Total
Average (%) 17 74 0 5 4 100 No. of tours sold 26,639 115,958 0 835 6,268 156,700
Table 85 Method of booking tours, northern Botswana, 2004
n=10 Walk in Direct
booking
Local
hotels/
operators
KAZA
hotels/
operators
Foreign
hotels/
operators
Total
Average (%) 2 1 66 12 19 100 No. of tours sold 3,134 1,567 103,432 18,804 29,773 156,700
Table 86 Destinations of tours offered, northern Botswana, 2004
n=10 Botswana Namibia Zambia Zimbabwe Total
Destination (%) 80 0.1 4 16 100 No. of tours sold 125,203 157 6,268 25,072 156,700
3.7.3 Time trends
70 per cent of tour operators reported an increase in tourism to their establishment over the previous three years, two reported a decrease in tourism, while one reported no change. Respondents reported fewer tourists coming from Zimbabwe relative to previous years. Other observations included that more adventure travellers were visiting, and that there were more visitors in the off-season than had been the case in previous years. One new tour operation opened between January and July 2005.
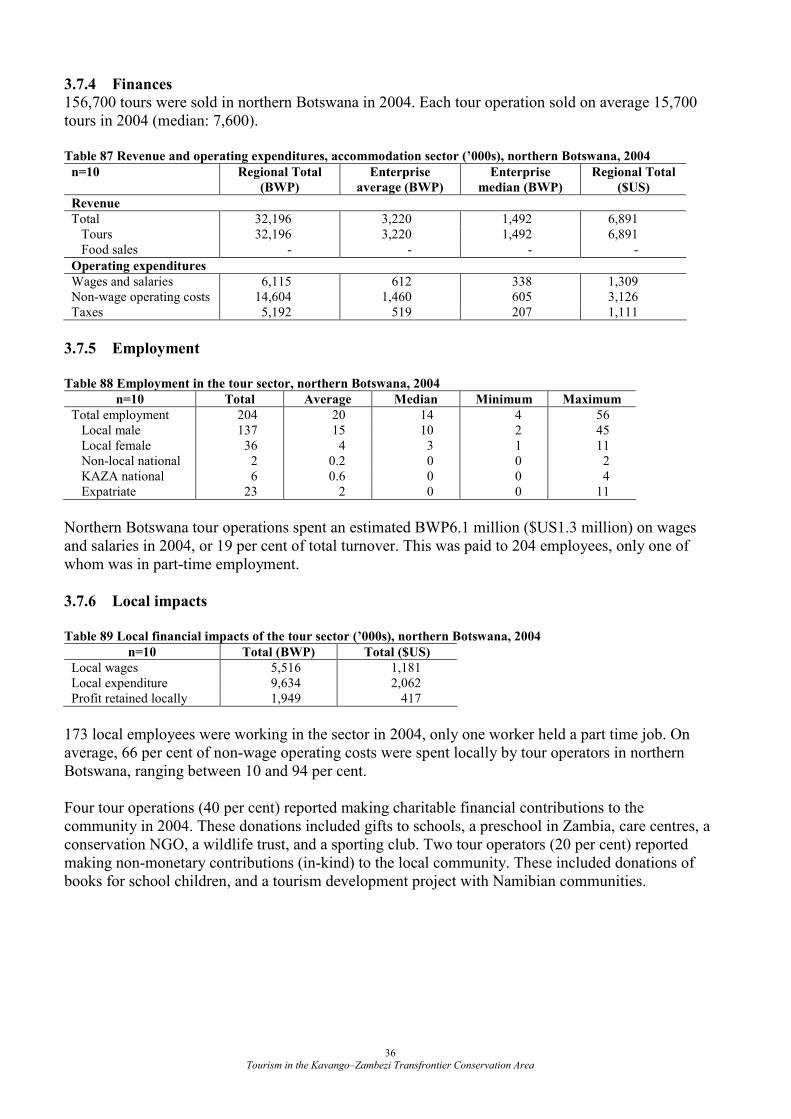
Tourism in the Kavango–Zambezi Transfrontier Conservation Area 36
3.7.4 Finances
156,700 tours were sold in northern Botswana in 2004. Each tour operation sold on average 15,700 tours in 2004 (median: 7,600). Table 87 Revenue and operating expenditures, accommodation sector (’000s), northern Botswana, 2004
n=10 Regional Total
(BWP)
Enterprise
average (BWP)
Enterprise
median (BWP)
Regional Total
($US)
Revenue
Total 32,196 3,220 1,492 6,891 Tours 32,196 3,220 1,492 6,891 Food sales - - - -
Operating expenditures
Wages and salaries 6,115 612 338 1,309 Non-wage operating costs 14,604 1,460 605 3,126 Taxes 5,192 519 207 1,111
3.7.5 Employment
Table 88 Employment in the tour sector, northern Botswana, 2004
n=10 Total Average Median Minimum Maximum
Total employment 204 20 14 4 56 Local male 137 15 10 2 45 Local female 36 4 3 1 11 Non-local national 2 0.2 0 0 2 KAZA national 6 0.6 0 0 4 Expatriate 23 2 0 0 11
Northern Botswana tour operations spent an estimated BWP6.1 million ($US1.3 million) on wages and salaries in 2004, or 19 per cent of total turnover. This was paid to 204 employees, only one of whom was in part-time employment.
3.7.6 Local impacts
Table 89 Local financial impacts of the tour sector (’000s), northern Botswana, 2004
n=10 Total (BWP) Total ($US)
Local wages 5,516 1,181 Local expenditure 9,634 2,062 Profit retained locally 1,949 417
173 local employees were working in the sector in 2004, only one worker held a part time job. On average, 66 per cent of non-wage operating costs were spent locally by tour operators in northern Botswana, ranging between 10 and 94 per cent. Four tour operations (40 per cent) reported making charitable financial contributions to the community in 2004. These donations included gifts to schools, a preschool in Zambia, care centres, a conservation NGO, a wildlife trust, and a sporting club. Two tour operators (20 per cent) reported making non-monetary contributions (in-kind) to the local community. These included donations of books for school children, and a tourism development project with Namibian communities.
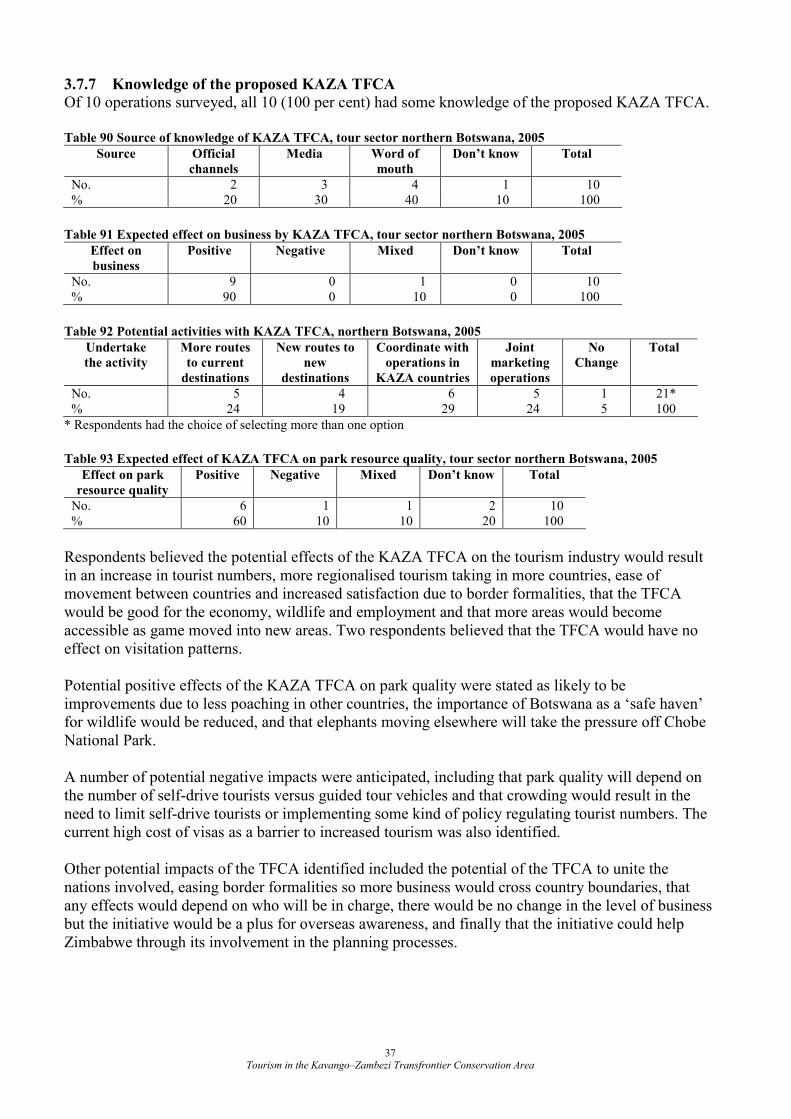
Tourism in the Kavango–Zambezi Transfrontier Conservation Area 37
3.7.7 Knowledge of the proposed KAZA TFCA
Of 10 operations surveyed, all 10 (100 per cent) had some knowledge of the proposed KAZA TFCA. Table 90 Source of knowledge of KAZA TFCA, tour sector northern Botswana, 2005
Source Official
channels
Media Word of
mouth
Don’t know Total
No. 2 3 4 1 10 % 20 30 40 10 100
Table 91 Expected effect on business by KAZA TFCA, tour sector northern Botswana, 2005
Effect on
business
Positive Negative Mixed Don’t know Total
No. 9 0 1 0 10 % 90 0 10 0 100
Table 92 Potential activities with KAZA TFCA, northern Botswana, 2005
Undertake
the activity
More routes
to current
destinations
New routes to
new
destinations
Coordinate with
operations in
KAZA countries
Joint
marketing
operations
No
Change
Total
No. 5 4 6 5 1 21* % 24 19 29 24 5 100
* Respondents had the choice of selecting more than one option
Table 93 Expected effect of KAZA TFCA on park resource quality, tour sector northern Botswana, 2005
Effect on park
resource quality
Positive Negative Mixed Don’t know Total
No. 6 1 1 2 10 % 60 10 10 20 100
Respondents believed the potential effects of the KAZA TFCA on the tourism industry would result in an increase in tourist numbers, more regionalised tourism taking in more countries, ease of movement between countries and increased satisfaction due to border formalities, that the TFCA would be good for the economy, wildlife and employment and that more areas would become accessible as game moved into new areas. Two respondents believed that the TFCA would have no effect on visitation patterns. Potential positive effects of the KAZA TFCA on park quality were stated as likely to be improvements due to less poaching in other countries, the importance of Botswana as a ‘safe haven’ for wildlife would be reduced, and that elephants moving elsewhere will take the pressure off Chobe National Park. A number of potential negative impacts were anticipated, including that park quality will depend on the number of self-drive tourists versus guided tour vehicles and that crowding would result in the need to limit self-drive tourists or implementing some kind of policy regulating tourist numbers. The current high cost of visas as a barrier to increased tourism was also identified. Other potential impacts of the TFCA identified included the potential of the TFCA to unite the nations involved, easing border formalities so more business would cross country boundaries, that any effects would depend on who will be in charge, there would be no change in the level of business but the initiative would be a plus for overseas awareness, and finally that the initiative could help Zimbabwe through its involvement in the planning processes.
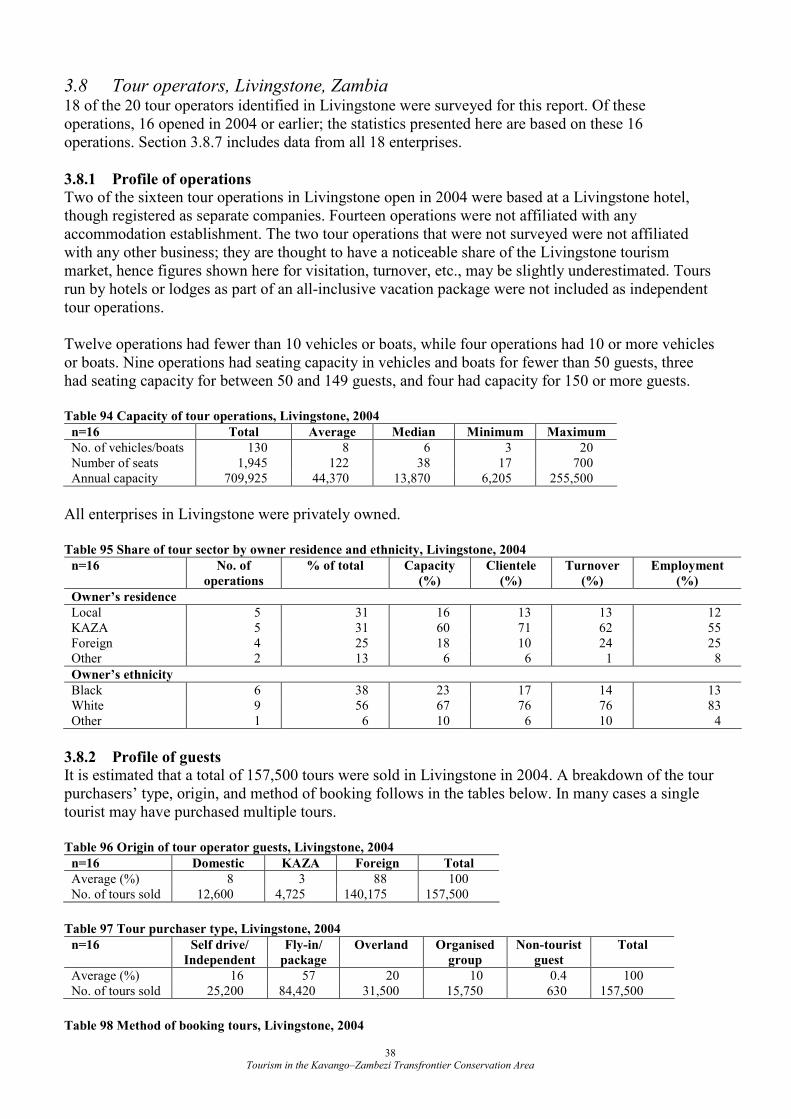
Tourism in the Kavango–Zambezi Transfrontier Conservation Area 38
3.8 Tour operators, Livingstone, Zambia 18 of the 20 tour operators identified in Livingstone were surveyed for this report. Of these operations, 16 opened in 2004 or earlier; the statistics presented here are based on these 16 operations. Section 3.8.7 includes data from all 18 enterprises.
3.8.1 Profile of operations
Two of the sixteen tour operations in Livingstone open in 2004 were based at a Livingstone hotel, though registered as separate companies. Fourteen operations were not affiliated with any accommodation establishment. The two tour operations that were not surveyed were not affiliated with any other business; they are thought to have a noticeable share of the Livingstone tourism market, hence figures shown here for visitation, turnover, etc., may be slightly underestimated. Tours run by hotels or lodges as part of an all-inclusive vacation package were not included as independent tour operations. Twelve operations had fewer than 10 vehicles or boats, while four operations had 10 or more vehicles or boats. Nine operations had seating capacity in vehicles and boats for fewer than 50 guests, three had seating capacity for between 50 and 149 guests, and four had capacity for 150 or more guests. Table 94 Capacity of tour operations, Livingstone, 2004
n=16 Total Average Median Minimum Maximum
No. of vehicles/boats 130 8 6 3 20 Number of seats 1,945 122 38 17 700 Annual capacity 709,925 44,370 13,870 6,205 255,500
All enterprises in Livingstone were privately owned. Table 95 Share of tour sector by owner residence and ethnicity, Livingstone, 2004
n=16 No. of
operations
% of total Capacity
(%)
Clientele
(%)
Turnover
(%)
Employment
(%)
Owner’s residence
Local 5 31 16 13 13 12 KAZA 5 31 60 71 62 55 Foreign 4 25 18 10 24 25 Other 2 13 6 6 1 8
Owner’s ethnicity
Black 6 38 23 17 14 13 White 9 56 67 76 76 83 Other 1 6 10 6 10 4
3.8.2 Profile of guests
It is estimated that a total of 157,500 tours were sold in Livingstone in 2004. A breakdown of the tour purchasers’ type, origin, and method of booking follows in the tables below. In many cases a single tourist may have purchased multiple tours. Table 96 Origin of tour operator guests, Livingstone, 2004
n=16 Domestic KAZA Foreign Total
Average (%) 8 3 88 100 No. of tours sold 12,600 4,725 140,175 157,500
Table 97 Tour purchaser type, Livingstone, 2004
n=16 Self drive/
Independent
Fly-in/
package
Overland Organised
group
Non-tourist
guest
Total
Average (%) 16 57 20 10 0.4 100 No. of tours sold 25,200 84,420 31,500 15,750 630 157,500
Table 98 Method of booking tours, Livingstone, 2004
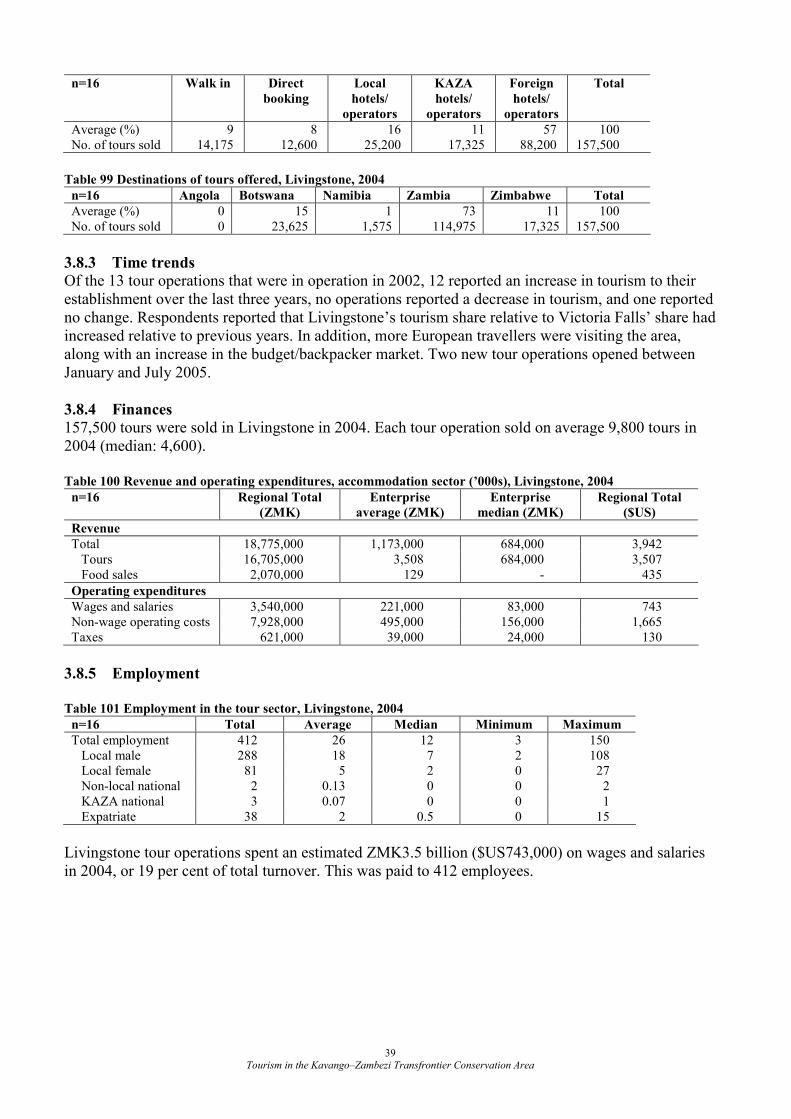
Tourism in the Kavango–Zambezi Transfrontier Conservation Area 39
n=16 Walk in Direct
booking
Local
hotels/
operators
KAZA
hotels/
operators
Foreign
hotels/
operators
Total
Average (%) 9 8 16 11 57 100 No. of tours sold 14,175 12,600 25,200 17,325 88,200 157,500
Table 99 Destinations of tours offered, Livingstone, 2004
n=16 Angola Botswana Namibia Zambia Zimbabwe Total
Average (%) 0 15 1 73 11 100 No. of tours sold 0 23,625 1,575 114,975 17,325 157,500
3.8.3 Time trends
Of the 13 tour operations that were in operation in 2002, 12 reported an increase in tourism to their establishment over the last three years, no operations reported a decrease in tourism, and one reported no change. Respondents reported that Livingstone’s tourism share relative to Victoria Falls’ share had increased relative to previous years. In addition, more European travellers were visiting the area, along with an increase in the budget/backpacker market. Two new tour operations opened between January and July 2005.
3.8.4 Finances
157,500 tours were sold in Livingstone in 2004. Each tour operation sold on average 9,800 tours in 2004 (median: 4,600). Table 100 Revenue and operating expenditures, accommodation sector (’000s), Livingstone, 2004
n=16 Regional Total
(ZMK)
Enterprise
average (ZMK)
Enterprise
median (ZMK)
Regional Total
($US)
Revenue
Total 18,775,000 1,173,000 684,000 3,942 Tours 16,705,000 3,508 684,000 3,507 Food sales 2,070,000 129 - 435
Operating expenditures
Wages and salaries 3,540,000 221,000 83,000 743 Non-wage operating costs 7,928,000 495,000 156,000 1,665 Taxes 621,000 39,000 24,000 130
3.8.5 Employment
Table 101 Employment in the tour sector, Livingstone, 2004
n=16 Total Average Median Minimum Maximum
Total employment 412 26 12 3 150 Local male 288 18 7 2 108 Local female 81 5 2 0 27 Non-local national 2 0.13 0 0 2 KAZA national 3 0.07 0 0 1 Expatriate 38 2 0.5 0 15
Livingstone tour operations spent an estimated ZMK3.5 billion ($US743,000) on wages and salaries in 2004, or 19 per cent of total turnover. This was paid to 412 employees.
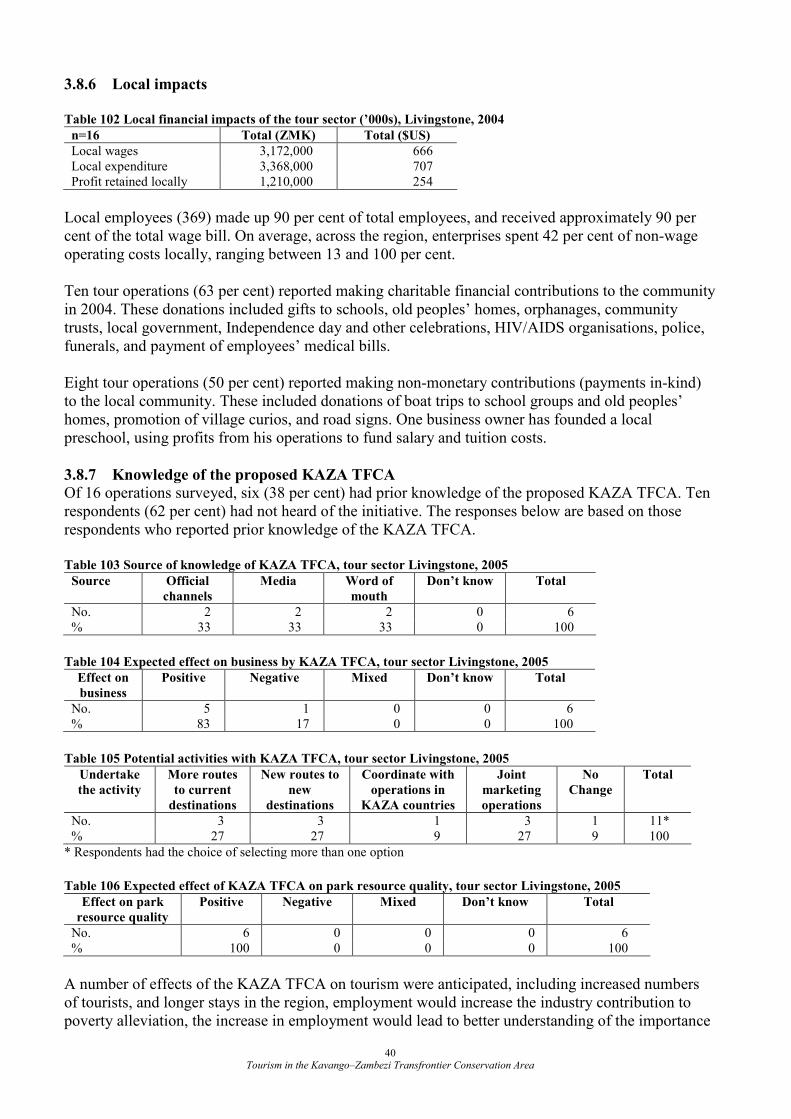
Tourism in the Kavango–Zambezi Transfrontier Conservation Area 40
3.8.6 Local impacts
Table 102 Local financial impacts of the tour sector (’000s), Livingstone, 2004
n=16 Total (ZMK) Total ($US)
Local wages 3,172,000 666 Local expenditure 3,368,000 707 Profit retained locally 1,210,000 254
Local employees (369) made up 90 per cent of total employees, and received approximately 90 per cent of the total wage bill. On average, across the region, enterprises spent 42 per cent of non-wage operating costs locally, ranging between 13 and 100 per cent. Ten tour operations (63 per cent) reported making charitable financial contributions to the community in 2004. These donations included gifts to schools, old peoples’ homes, orphanages, community trusts, local government, Independence day and other celebrations, HIV/AIDS organisations, police, funerals, and payment of employees’ medical bills. Eight tour operations (50 per cent) reported making non-monetary contributions (payments in-kind) to the local community. These included donations of boat trips to school groups and old peoples’ homes, promotion of village curios, and road signs. One business owner has founded a local preschool, using profits from his operations to fund salary and tuition costs.
3.8.7 Knowledge of the proposed KAZA TFCA
Of 16 operations surveyed, six (38 per cent) had prior knowledge of the proposed KAZA TFCA. Ten respondents (62 per cent) had not heard of the initiative. The responses below are based on those respondents who reported prior knowledge of the KAZA TFCA. Table 103 Source of knowledge of KAZA TFCA, tour sector Livingstone, 2005
Source Official
channels
Media Word of
mouth
Don’t know Total
No. 2 2 2 0 6 % 33 33 33 0 100
Table 104 Expected effect on business by KAZA TFCA, tour sector Livingstone, 2005
Effect on
business
Positive Negative Mixed Don’t know Total
No. 5 1 0 0 6 % 83 17 0 0 100
Table 105 Potential activities with KAZA TFCA, tour sector Livingstone, 2005
Undertake
the activity
More routes
to current
destinations
New routes to
new
destinations
Coordinate with
operations in
KAZA countries
Joint
marketing
operations
No
Change
Total
No. 3 3 1 3 1 11* % 27 27 9 27 9 100
* Respondents had the choice of selecting more than one option
Table 106 Expected effect of KAZA TFCA on park resource quality, tour sector Livingstone, 2005
Effect on park
resource quality
Positive Negative Mixed Don’t know Total
No. 6 0 0 0 6 % 100 0 0 0 100
A number of effects of the KAZA TFCA on tourism were anticipated, including increased numbers of tourists, and longer stays in the region, employment would increase the industry contribution to poverty alleviation, the increase in employment would lead to better understanding of the importance
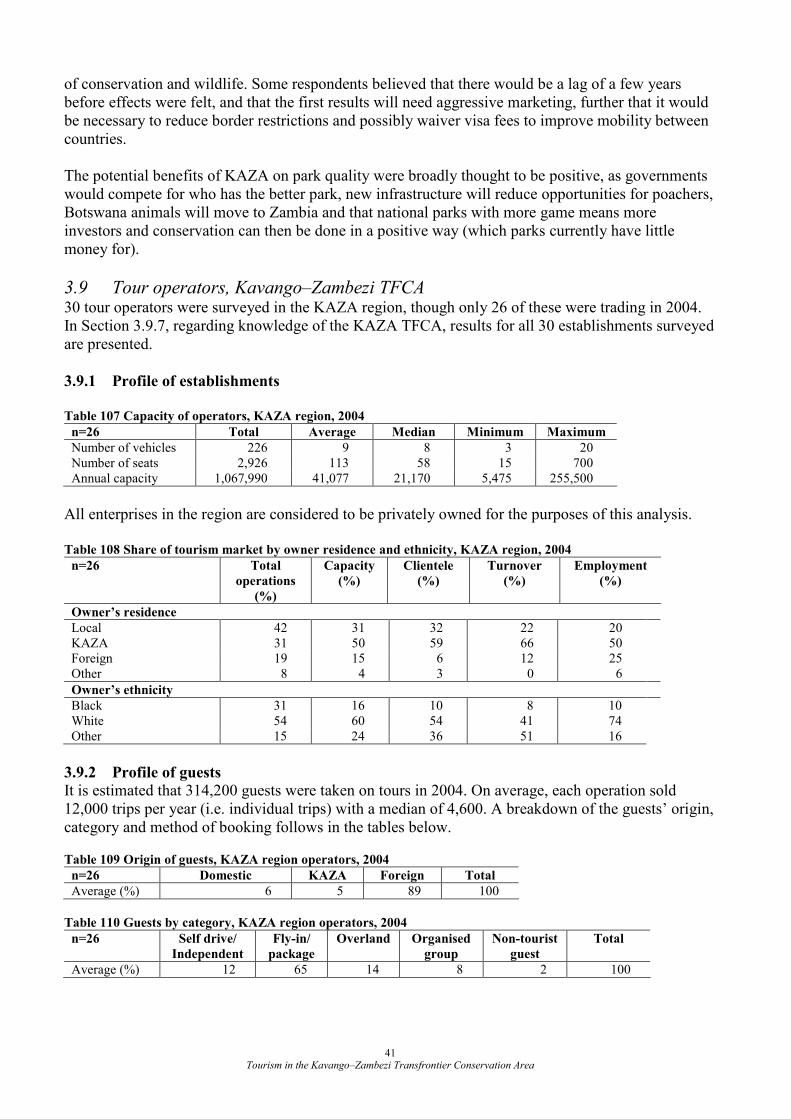
Tourism in the Kavango–Zambezi Transfrontier Conservation Area 41
of conservation and wildlife. Some respondents believed that there would be a lag of a few years before effects were felt, and that the first results will need aggressive marketing, further that it would be necessary to reduce border restrictions and possibly waiver visa fees to improve mobility between countries. The potential benefits of KAZA on park quality were broadly thought to be positive, as governments would compete for who has the better park, new infrastructure will reduce opportunities for poachers, Botswana animals will move to Zambia and that national parks with more game means more investors and conservation can then be done in a positive way (which parks currently have little money for).
3.9 Tour operators, Kavango–Zambezi TFCA 30 tour operators were surveyed in the KAZA region, though only 26 of these were trading in 2004. In Section 3.9.7, regarding knowledge of the KAZA TFCA, results for all 30 establishments surveyed are presented.
3.9.1 Profile of establishments
Table 107 Capacity of operators, KAZA region, 2004
n=26 Total Average Median Minimum Maximum
Number of vehicles 226 9 8 3 20 Number of seats 2,926 113 58 15 700 Annual capacity 1,067,990 41,077 21,170 5,475 255,500
All enterprises in the region are considered to be privately owned for the purposes of this analysis. Table 108 Share of tourism market by owner residence and ethnicity, KAZA region, 2004
n=26 Total
operations
(%)
Capacity
(%)
Clientele
(%)
Turnover
(%)
Employment
(%)
Owner’s residence
Local 42 31 32 22 20 KAZA 31 50 59 66 50 Foreign 19 15 6 12 25 Other 8 4 3 0 6
Owner’s ethnicity
Black 31 16 10 8 10 White 54 60 54 41 74 Other 15 24 36 51 16
3.9.2 Profile of guests
It is estimated that 314,200 guests were taken on tours in 2004. On average, each operation sold 12,000 trips per year (i.e. individual trips) with a median of 4,600. A breakdown of the guests’ origin, category and method of booking follows in the tables below.
Table 109 Origin of guests, KAZA region operators, 2004
n=26 Domestic KAZA Foreign Total
Average (%) 6 5 89 100
Table 110 Guests by category, KAZA region operators, 2004
n=26 Self drive/
Independent
Fly-in/
package
Overland Organised
group
Non-tourist
guest
Total
Average (%) 12 65 14 8 2 100
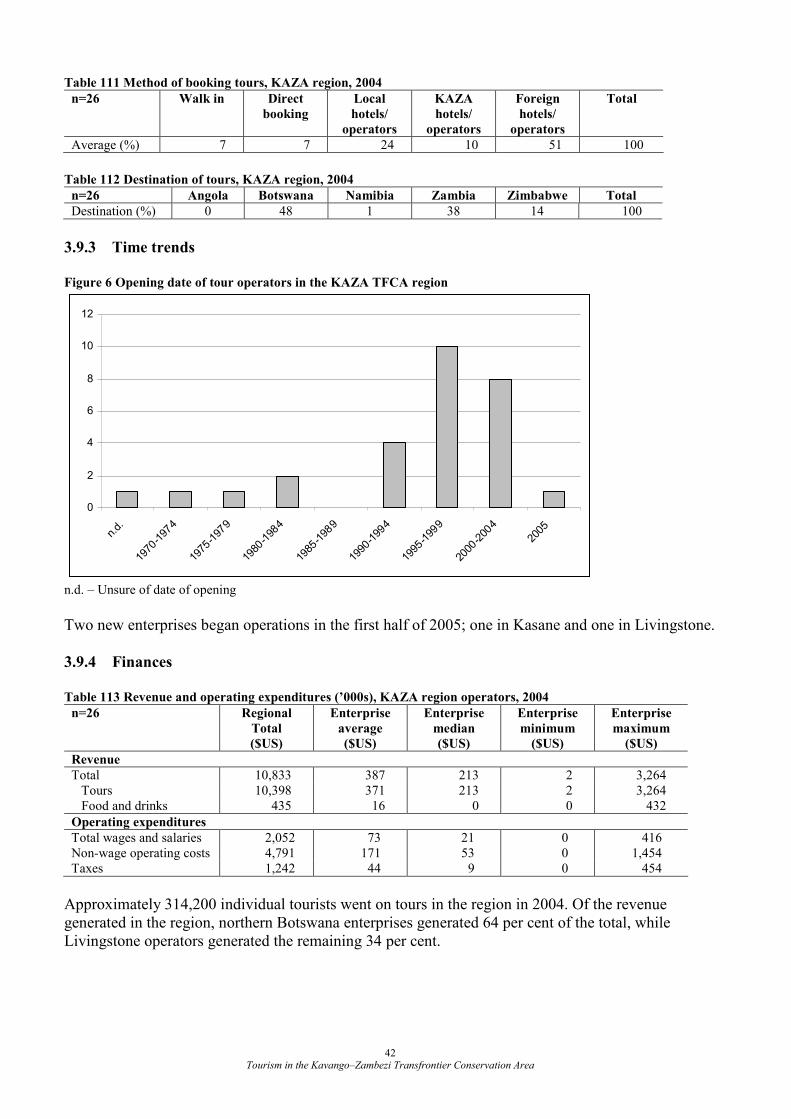
Tourism in the Kavango–Zambezi Transfrontier Conservation Area 42
Table 111 Method of booking tours, KAZA region, 2004
n=26 Walk in Direct
booking
Local
hotels/
operators
KAZA
hotels/
operators
Foreign
hotels/
operators
Total
Average (%) 7 7 24 10 51 100
Table 112 Destination of tours, KAZA region, 2004
n=26 Angola Botswana Namibia Zambia Zimbabwe Total
Destination (%) 0 48 1 38 14 100
3.9.3 Time trends
Figure 6 Opening date of tour operators in the KAZA TFCA region
0
2
4
6
8
10
12
n.d.
1970-1974
1975-1979
1980-1984
1985-1989
1990-1994
1995-1999
2000-2004
2005
n.d. – Unsure of date of opening
Two new enterprises began operations in the first half of 2005; one in Kasane and one in Livingstone.
3.9.4 Finances
Table 113 Revenue and operating expenditures (’000s), KAZA region operators, 2004
n=26 Regional
Total
($US)
Enterprise
average
($US)
Enterprise
median
($US)
Enterprise
minimum
($US)
Enterprise
maximum
($US)
Revenue
Total 10,833 387 213 2 3,264 Tours 10,398 371 213 2 3,264 Food and drinks 435 16 0 0 432
Operating expenditures
Total wages and salaries 2,052 73 21 0 416 Non-wage operating costs 4,791 171 53 0 1,454 Taxes 1,242 44 9 0 454
Approximately 314,200 individual tourists went on tours in the region in 2004. Of the revenue generated in the region, northern Botswana enterprises generated 64 per cent of the total, while Livingstone operators generated the remaining 34 per cent.
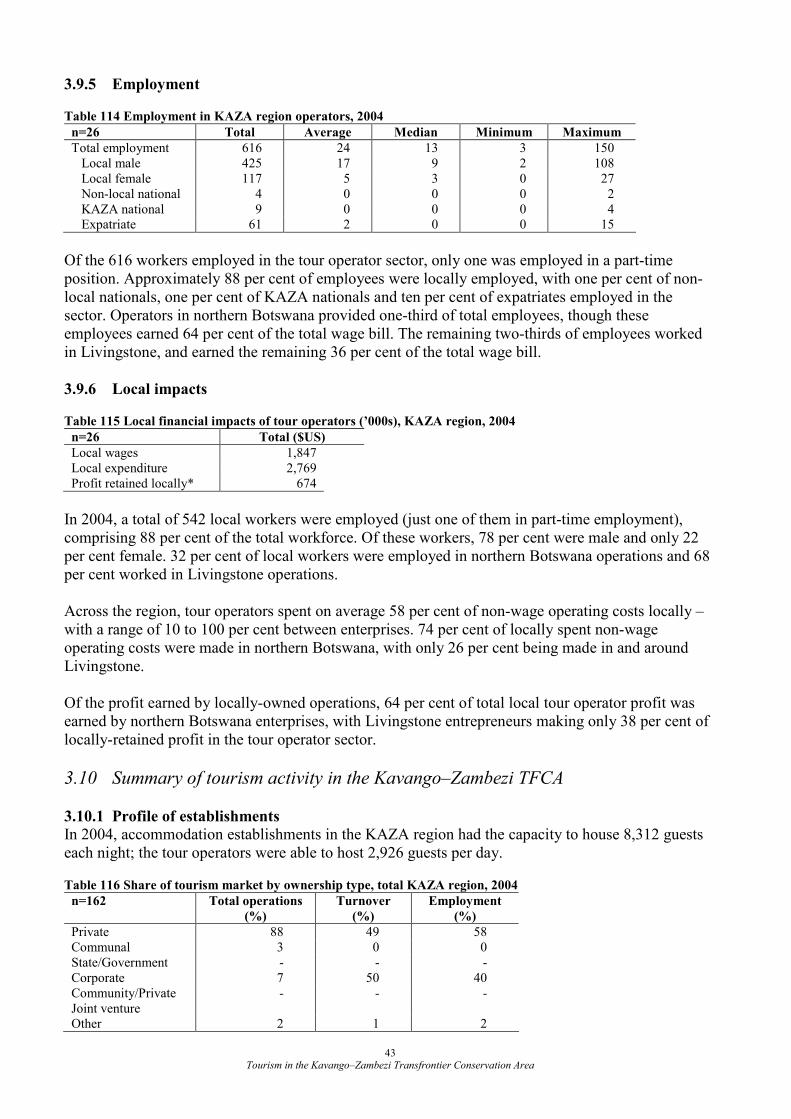
Tourism in the Kavango–Zambezi Transfrontier Conservation Area 43
3.9.5 Employment
Table 114 Employment in KAZA region operators, 2004
n=26 Total Average Median Minimum Maximum
Total employment 616 24 13 3 150 Local male 425 17 9 2 108 Local female 117 5 3 0 27 Non-local national 4 0 0 0 2 KAZA national 9 0 0 0 4 Expatriate 61 2 0 0 15
Of the 616 workers employed in the tour operator sector, only one was employed in a part-time position. Approximately 88 per cent of employees were locally employed, with one per cent of non-local nationals, one per cent of KAZA nationals and ten per cent of expatriates employed in the sector. Operators in northern Botswana provided one-third of total employees, though these employees earned 64 per cent of the total wage bill. The remaining two-thirds of employees worked in Livingstone, and earned the remaining 36 per cent of the total wage bill.
3.9.6 Local impacts
Table 115 Local financial impacts of tour operators (’000s), KAZA region, 2004
n=26 Total ($US)
Local wages 1,847 Local expenditure 2,769 Profit retained locally* 674
In 2004, a total of 542 local workers were employed (just one of them in part-time employment), comprising 88 per cent of the total workforce. Of these workers, 78 per cent were male and only 22 per cent female. 32 per cent of local workers were employed in northern Botswana operations and 68 per cent worked in Livingstone operations. Across the region, tour operators spent on average 58 per cent of non-wage operating costs locally – with a range of 10 to 100 per cent between enterprises. 74 per cent of locally spent non-wage operating costs were made in northern Botswana, with only 26 per cent being made in and around Livingstone. Of the profit earned by locally-owned operations, 64 per cent of total local tour operator profit was earned by northern Botswana enterprises, with Livingstone entrepreneurs making only 38 per cent of locally-retained profit in the tour operator sector.
3.10 Summary of tourism activity in the Kavango–Zambezi TFCA
3.10.1 Profile of establishments
In 2004, accommodation establishments in the KAZA region had the capacity to house 8,312 guests each night; the tour operators were able to host 2,926 guests per day.
Table 116 Share of tourism market by ownership type, total KAZA region, 2004
n=162 Total operations
(%)
Turnover
(%)
Employment
(%)
Private 88 49 58 Communal 3 0 0 State/Government - - - Corporate 7 50 40 Community/Private Joint venture
- - -
Other 2 1 2
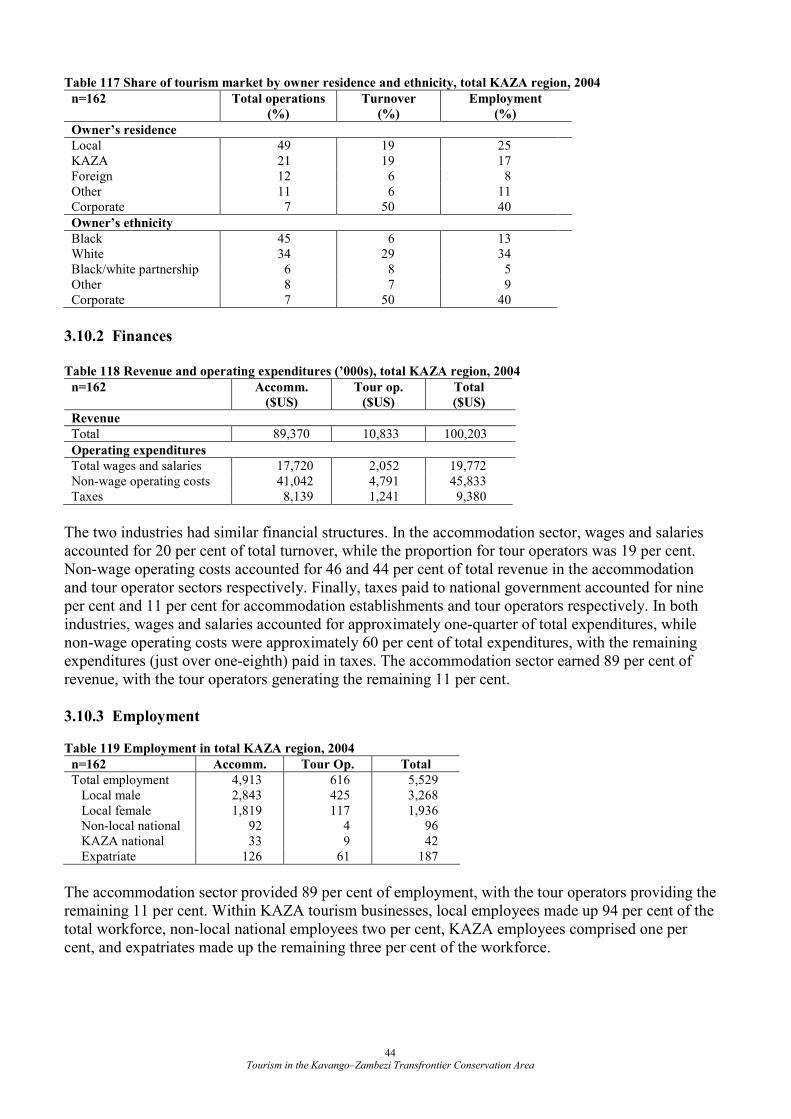
Tourism in the Kavango–Zambezi Transfrontier Conservation Area 44
Table 117 Share of tourism market by owner residence and ethnicity, total KAZA region, 2004
n=162 Total operations
(%)
Turnover
(%)
Employment
(%)
Owner’s residence
Local 49 19 25 KAZA 21 19 17 Foreign 12 6 8 Other 11 6 11 Corporate 7 50 40
Owner’s ethnicity
Black 45 6 13 White 34 29 34 Black/white partnership 6 8 5 Other 8 7 9 Corporate 7 50 40
3.10.2 Finances
Table 118 Revenue and operating expenditures (’000s), total KAZA region, 2004
n=162 Accomm.
($US)
Tour op.
($US)
Total
($US)
Revenue
Total 89,370 10,833 100,203
Operating expenditures
Total wages and salaries 17,720 2,052 19,772 Non-wage operating costs 41,042 4,791 45,833 Taxes 8,139 1,241 9,380
The two industries had similar financial structures. In the accommodation sector, wages and salaries accounted for 20 per cent of total turnover, while the proportion for tour operators was 19 per cent. Non-wage operating costs accounted for 46 and 44 per cent of total revenue in the accommodation and tour operator sectors respectively. Finally, taxes paid to national government accounted for nine per cent and 11 per cent for accommodation establishments and tour operators respectively. In both industries, wages and salaries accounted for approximately one-quarter of total expenditures, while non-wage operating costs were approximately 60 per cent of total expenditures, with the remaining expenditures (just over one-eighth) paid in taxes. The accommodation sector earned 89 per cent of revenue, with the tour operators generating the remaining 11 per cent.
3.10.3 Employment
Table 119 Employment in total KAZA region, 2004
n=162 Accomm. Tour Op. Total
Total employment 4,913 616 5,529 Local male 2,843 425 3,268 Local female 1,819 117 1,936 Non-local national 92 4 96 KAZA national 33 9 42 Expatriate 126 61 187
The accommodation sector provided 89 per cent of employment, with the tour operators providing the remaining 11 per cent. Within KAZA tourism businesses, local employees made up 94 per cent of the total workforce, non-local national employees two per cent, KAZA employees comprised one per cent, and expatriates made up the remaining three per cent of the workforce.
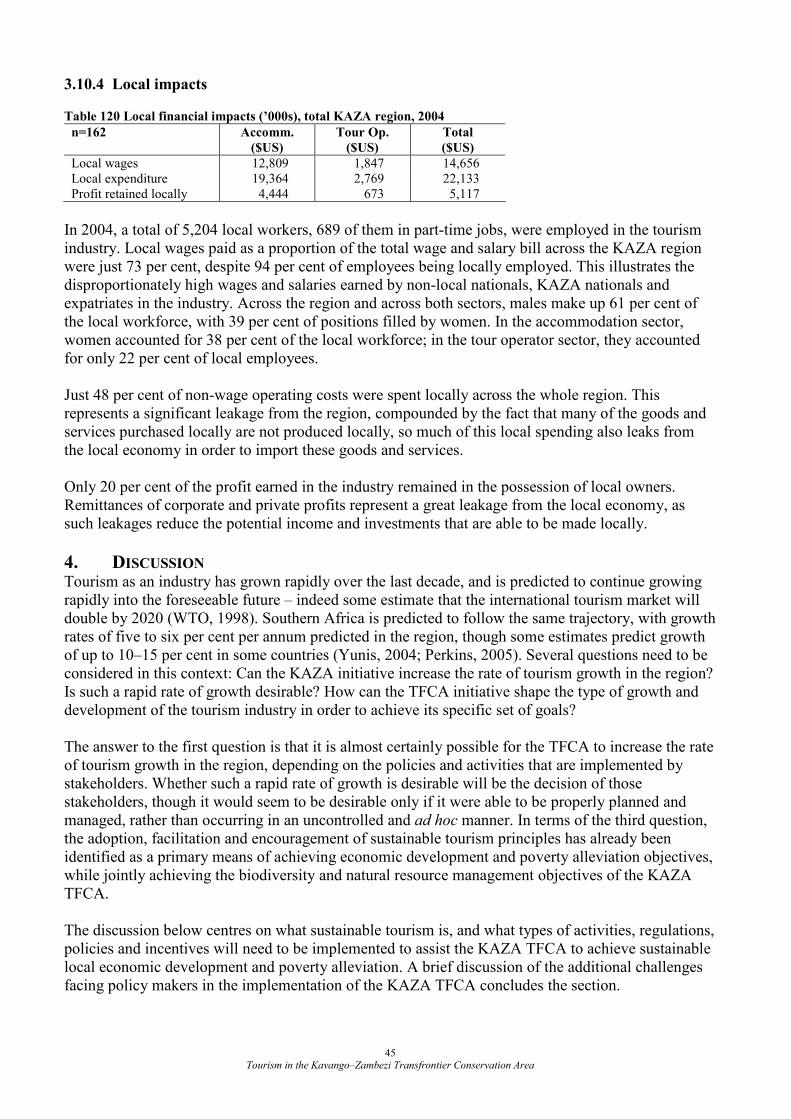
Tourism in the Kavango–Zambezi Transfrontier Conservation Area 45
3.10.4 Local impacts
Table 120 Local financial impacts (’000s), total KAZA region, 2004
n=162 Accomm.
($US)
Tour Op.
($US)
Total
($US)
Local wages 12,809 1,847 14,656 Local expenditure 19,364 2,769 22,133 Profit retained locally 4,444 673 5,117
In 2004, a total of 5,204 local workers, 689 of them in part-time jobs, were employed in the tourism industry. Local wages paid as a proportion of the total wage and salary bill across the KAZA region were just 73 per cent, despite 94 per cent of employees being locally employed. This illustrates the disproportionately high wages and salaries earned by non-local nationals, KAZA nationals and expatriates in the industry. Across the region and across both sectors, males make up 61 per cent of the local workforce, with 39 per cent of positions filled by women. In the accommodation sector, women accounted for 38 per cent of the local workforce; in the tour operator sector, they accounted for only 22 per cent of local employees. Just 48 per cent of non-wage operating costs were spent locally across the whole region. This represents a significant leakage from the region, compounded by the fact that many of the goods and services purchased locally are not produced locally, so much of this local spending also leaks from the local economy in order to import these goods and services. Only 20 per cent of the profit earned in the industry remained in the possession of local owners. Remittances of corporate and private profits represent a great leakage from the local economy, as such leakages reduce the potential income and investments that are able to be made locally.
4. DISCUSSION Tourism as an industry has grown rapidly over the last decade, and is predicted to continue growing rapidly into the foreseeable future – indeed some estimate that the international tourism market will double by 2020 (WTO, 1998). Southern Africa is predicted to follow the same trajectory, with growth rates of five to six per cent per annum predicted in the region, though some estimates predict growth of up to 10–15 per cent in some countries (Yunis, 2004; Perkins, 2005). Several questions need to be considered in this context: Can the KAZA initiative increase the rate of tourism growth in the region? Is such a rapid rate of growth desirable? How can the TFCA initiative shape the type of growth and development of the tourism industry in order to achieve its specific set of goals? The answer to the first question is that it is almost certainly possible for the TFCA to increase the rate of tourism growth in the region, depending on the policies and activities that are implemented by stakeholders. Whether such a rapid rate of growth is desirable will be the decision of those stakeholders, though it would seem to be desirable only if it were able to be properly planned and managed, rather than occurring in an uncontrolled and ad hoc manner. In terms of the third question, the adoption, facilitation and encouragement of sustainable tourism principles has already been identified as a primary means of achieving economic development and poverty alleviation objectives, while jointly achieving the biodiversity and natural resource management objectives of the KAZA TFCA. The discussion below centres on what sustainable tourism is, and what types of activities, regulations, policies and incentives will need to be implemented to assist the KAZA TFCA to achieve sustainable local economic development and poverty alleviation. A brief discussion of the additional challenges facing policy makers in the implementation of the KAZA TFCA concludes the section.
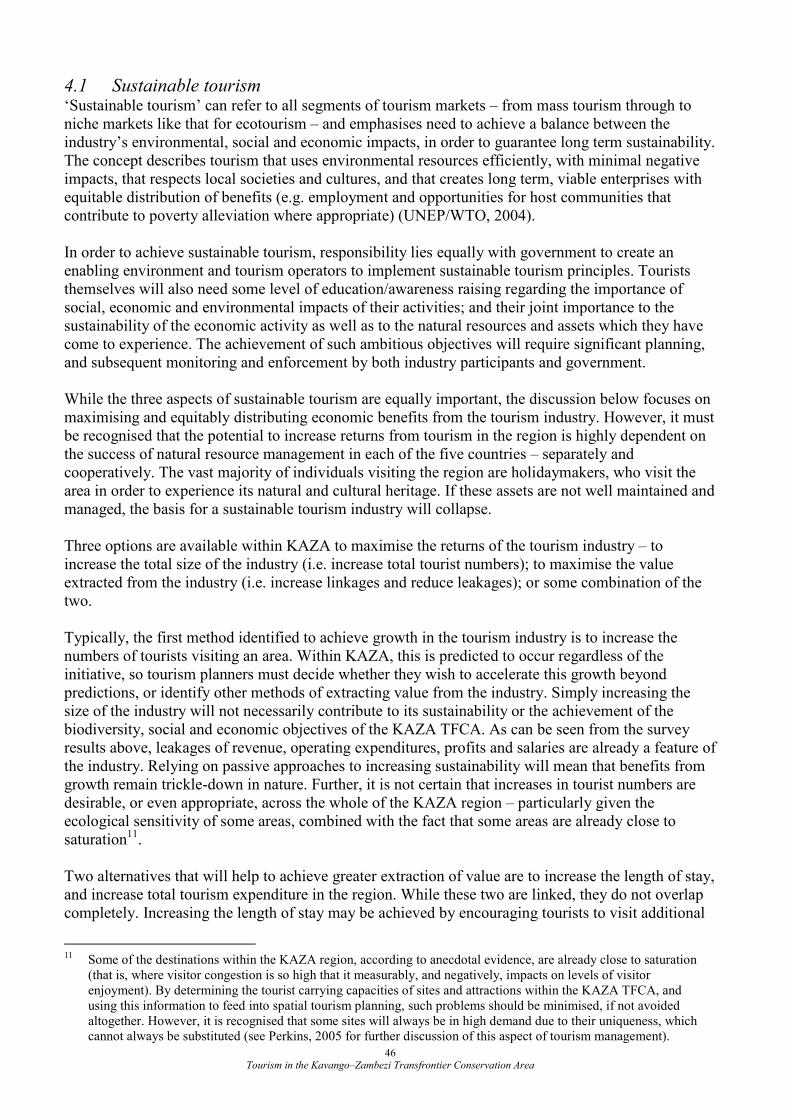
Tourism in the Kavango–Zambezi Transfrontier Conservation Area 46
4.1 Sustainable tourism ‘Sustainable tourism’ can refer to all segments of tourism markets – from mass tourism through to niche markets like that for ecotourism – and emphasises need to achieve a balance between the industry’s environmental, social and economic impacts, in order to guarantee long term sustainability. The concept describes tourism that uses environmental resources efficiently, with minimal negative impacts, that respects local societies and cultures, and that creates long term, viable enterprises with equitable distribution of benefits (e.g. employment and opportunities for host communities that contribute to poverty alleviation where appropriate) (UNEP/WTO, 2004). In order to achieve sustainable tourism, responsibility lies equally with government to create an enabling environment and tourism operators to implement sustainable tourism principles. Tourists themselves will also need some level of education/awareness raising regarding the importance of social, economic and environmental impacts of their activities; and their joint importance to the sustainability of the economic activity as well as to the natural resources and assets which they have come to experience. The achievement of such ambitious objectives will require significant planning, and subsequent monitoring and enforcement by both industry participants and government. While the three aspects of sustainable tourism are equally important, the discussion below focuses on maximising and equitably distributing economic benefits from the tourism industry. However, it must be recognised that the potential to increase returns from tourism in the region is highly dependent on the success of natural resource management in each of the five countries – separately and cooperatively. The vast majority of individuals visiting the region are holidaymakers, who visit the area in order to experience its natural and cultural heritage. If these assets are not well maintained and managed, the basis for a sustainable tourism industry will collapse. Three options are available within KAZA to maximise the returns of the tourism industry – to increase the total size of the industry (i.e. increase total tourist numbers); to maximise the value extracted from the industry (i.e. increase linkages and reduce leakages); or some combination of the two. Typically, the first method identified to achieve growth in the tourism industry is to increase the numbers of tourists visiting an area. Within KAZA, this is predicted to occur regardless of the initiative, so tourism planners must decide whether they wish to accelerate this growth beyond predictions, or identify other methods of extracting value from the industry. Simply increasing the size of the industry will not necessarily contribute to its sustainability or the achievement of the biodiversity, social and economic objectives of the KAZA TFCA. As can be seen from the survey results above, leakages of revenue, operating expenditures, profits and salaries are already a feature of the industry. Relying on passive approaches to increasing sustainability will mean that benefits from growth remain trickle-down in nature. Further, it is not certain that increases in tourist numbers are desirable, or even appropriate, across the whole of the KAZA region – particularly given the ecological sensitivity of some areas, combined with the fact that some areas are already close to saturation11. Two alternatives that will help to achieve greater extraction of value are to increase the length of stay, and increase total tourism expenditure in the region. While these two are linked, they do not overlap completely. Increasing the length of stay may be achieved by encouraging tourists to visit additional
11 Some of the destinations within the KAZA region, according to anecdotal evidence, are already close to saturation
(that is, where visitor congestion is so high that it measurably, and negatively, impacts on levels of visitor enjoyment). By determining the tourist carrying capacities of sites and attractions within the KAZA TFCA, and using this information to feed into spatial tourism planning, such problems should be minimised, if not avoided altogether. However, it is recognised that some sites will always be in high demand due to their uniqueness, which cannot always be substituted (see Perkins, 2005 for further discussion of this aspect of tourism management).
Tourism in the Kavango–Zambezi Transfrontier Conservation Area 47
sites and attractions (hopefully in a transboundary manner) by developing and marketing a greater variety of experiences. This should have the effect of increasing total expenditure in the region, which may also be achieved by offering a greater variety of goods and services to tourists, as well as increasing the quality of some products (and therefore the price charged). These methods may be most appropriate in areas where tourist numbers are approaching carrying capacity. These three strategies alone will increase the size and value of the industry, but without proactive action will not achieve the ‘triple bottom line’ sustainability of the industry as desired by the initiative. Further, they will be extremely unlikely to direct maximum positive impacts at the local level. Maximising local economic impacts will require additional strategies, including increasing local participation in the industry (in all forms, including as employees, as enterprise owners and in partnerships); increasing intra- and inter-industry linkages; as well as ensuring that opportunities for involvement in the industry are equitably distributed.
4.1.1 Local employment
Local employment strategies impact positively on local livelihoods and economies. In the KAZA region, local employment is already high (approximately 94 per cent across the whole region), though few locals seem to be in management and supervisory positions (with the notable exception of Victoria Falls). Perhaps a first step in this regard would be to increase the access to high-level training of existing industry employees with potential to move in to such positions. A challenge in this regard will be to ensure that highly trained and skilled local employees have enough opportunities and challenges to ensure that they remain in the region. Examining the difference in average wages across the region (and the difference between local and non-local salaries), the added benefits that flow to employees in more senior positions can easily be seen. It is also important that living wages are paid to staff – particularly in light of the finding that tourism has been noted as paying 20 per cent less, on average, than other economic sectors (ILO, 2001 cited in Mastny, 2001).
4.1.2 Local participation
One of the key strategies of the KAZA initiative should be to increase the participation – and success – of local residents in the tourism industry. As can be seen from the survey results, around half of those already involved in the industry as owners are local residents; though they – and in particular black-owned businesses – do not yet seem to be able to generate revenues as high as those of other industry participants. Locally-owned business account for 49 per cent of all enterprises, yet generate only 19 per cent of total turnover; 45 per cent of enterprises are black-owned, but manage to generate only six per cent of total revenue. While levels of local participation are impressive, the financial returns to entrepreneurs of this participation are low in absolute terms (i.e. profits generated by these businesses) as well as relatively (i.e. compared to corporate-owned enterprises). Increasing local participation and increasing the returns to local operators will require significant commitments of resources to capacity building, skills development, in particular tourism and business training. It will also be vital to ensure the availability of financial resources targeted specifically at providing credit to local entrepreneurs to improve existing enterprises and enable new businesses to open, and to ensure that they are they are sufficiently well resourced that they can operate successfully in the long run. In further planning and developing the KAZA initiative, and refining activities to be implemented, consideration could be given to the feasibility of establishing a fund to provide credit to small locally-owned tourism businesses. Such a fund could promote and improve the returns to local participation by providing credit to local entrepreneurs who are unable to access funds through traditional avenues (banks, financial institutions, etc.) due to the small size of the (planned) business, a lack of collateral, or for other valid reasons. It is not anticipated that such a fund would provide capital for private businesses that can access funds in the private sector, but would provide subsidised and/or small amounts of credit for those who could not otherwise get started in the tourism industry.
Tourism in the Kavango–Zambezi Transfrontier Conservation Area 48
It is likely that, as the KAZA TFCA develops further, and the range of opportunities expands, pressure may be placed on governments in the region by large international tourism businesses to provide financial incentives to enter the market (incentives such as tax holidays, subsidised credit, etc.). It would seem that, given the recent and expected future high rates of growth in the industry, such pressures should be resisted. The economic benefits derived from the activities of large international players in the industry are reduced due to the high levels of leakage from the industry as profits are repatriated outside of the KAZA region, and outside of the national economies of KAZA countries. The presence of such large enterprises may also serve to crowd-out local entrepreneurs, reducing the equitable distribution of opportunities – particularly in the light of the relatively long time scales that will be required to stimulate successful local participation in the industry. By resisting such pressures, governments may be able to slow (and control) the pace of development to that which is sustainable and manageable, allowing sufficient time to design and implement regulations and policies, and ensure that monitoring and enforcement can proceed efficiently and effectively. However, while it may be possible to resist pressures to offer incentives for foreign-owned enterprises to start businesses within the KAZA region, international trade and investment agreements may result in difficulties in fostering locally-owned businesses, as a number of these agreements require equal market opportunities to businesses of other signatory nations. Mastny (2001) describes how the General Agreement on Trade in Services (a 1994 agreement) requires the removal of subsidies and protection for local enterprises, while the Agreement on Trade Related Investment Measures makes it difficult for signatory governments to require foreign companies to use local materials and inputs. Both of these agreements would serve to increase the leakage from the industry locally if abused by foreign companies operating in the KAZA TFCA.
4.1.3 Partnerships
Many of the sites of high tourism development potential within the KAZA TFCA fall on communal land. In such areas, where local entrepreneurs do not have the necessary expertise in the tourism industry and/or access to credit to start a new business, it may be possible to form partnerships between the private sector and the communities who hold traditional rights over the area. National community based natural resource management programmes within southern Africa – particularly in Namibia and Botswana – have been actively encouraging such joint ventures for some time. If well designed and monitored, they can provide benefits to all parties – enabling private sector operations in high tourism potential areas, as well as earning revenues (e.g. through lease fees, revenue sharing and other arrangements), and creating jobs for rural communities (many joint venture agreements stipulate that vacant positions should be filled locally wherever possible). Such partnership agreements can include a range of aspects, and many to date have also contributed to the capacity building and increased skill levels of local employees in tourism. While such partnerships have been supported and promoted at the national level of several KAZA countries for some years, no survey respondent stated that their enterprise was part of a joint venture agreement. Though there are certainly joint ventures operating within KAZA countries, they did not seem not to occur within the KAZA region in 2004. A number of such agreements are currently in the process of negotiation, so such enterprise ownership arrangements would be expected to appear in the follow-up survey of this research.
Tourism in the Kavango–Zambezi Transfrontier Conservation Area 49
4.1.4 Local procurement
Local procurement policies can provide an important means of increasing local economic impact. By increasing local inter-industry linkages through local sourcing of inputs, the indirect and induced impacts of tourism can be improved. Increasing levels of local procurement also creates opportunities for local entrepreneurs to become involved in providing goods and services to tourists and tourism businesses – which can benefit local art and craft producers, farmers, fishers, etc. Local procurement strategies are also a form of partnership, though contracts regarding local procurement would be expected to be of much shorter duration than those relating to joint venture agreements. Though levels of local procurement are already almost 50 per cent in the KAZA region they could no doubt be improved in some regions. Further, while enterprises may already be supporting local businesses, if the goods and services purchased are ultimately imported into the region, these expenditures also eventually leak from local economies. While recognising that the full range of required goods and services cannot be locally produced, it may be possible to increase the amount, range and quality of those goods and services that can be.
4.1.5 Equitable distribution
Ensuring the equitability of the distribution of opportunities and benefits within KAZA will require careful planning and balance. The inequitable distribution of opportunities and benefits may stimulate conflicts over land and other resources that generate benefits for a minority. There would seem to be most potential for this in communal areas, where tenure over land and other resources is not always secure. Incoherent land allocation policies (e.g. land leases for tourism sites) may also stimulate conflict between operators and residents. There is anecdotal evidence to suggest that corrupt practices and/or illegitimate land allocation deals have already been made which exclude local communities from prime tourism sites without adequate – or indeed any – compensation. Though obviously some sites will always have a higher tourism demand than others due to their unique and/or spectacular characteristics, by spatially planning future tourism development, opportunities to enter the industry should be spread more equitably across the KAZA region. This will also require institutional structures that allow residents to actively and meaningfully participate in decision-making and planning processes – at the local, national and international levels.
4.1.6 Cost mitigation
In addition to the consideration of benefits to local communities, the mitigation of costs associated with living with wildlife will also need to be made. Human–wildlife conflict relates to both damage to crops by wild herbivores and stock losses to predators, and can have significant negative effects on agricultural livelihoods and household food security. The limited data available suggest that 67–80 per cent of agricultural households suffer some level of crop damage caused by wildlife, while almost 20 per cent of stock-owning households suffer losses to predators (Suich, 2003; Cullis and Watson, 2004). Innovative measures will need to be developed and trialled (as is already happening in some areas) to determine the best possible method(s) of damage limitation. It will also be necessary to introduce successful programmes in a timely manner in areas where, as resource management improves, wildlife spreads into areas where it is not currently found in large numbers (particularly in parts of Zambia and Angola). By implementing such programmes, it will be possible to provide direct and positive impacts at a household level to a significant proportion of the rural population. Such programmes would also fit easily with the basic hypothesis of community based natural resource management programmes that if the benefits (of living with wildlife) outweigh the costs, then sustainable resource use is likely to follow.
Tourism in the Kavango–Zambezi Transfrontier Conservation Area 50
4.1.7 Infrastructure development and provision of ancillary services
The necessity of improving and extending infrastructure has been identified as one means to increase tourist access to KAZA as a whole, and will obviously impact on access to individual sites within the TFCA. National plans for infrastructure development and the provision of ancillary services (e.g. communications, electricity, health, finance, etc.) will guide the spatial development of the tourism industry. Further, in regions with limited or no access to infrastructure or services, its provision is likely to have more widespread positive impacts on poverty, and contribute more to local economic development than the presence of the tourism industry and the opportunities offered by it. Thus, infrastructure development and service delivery must be carefully planned and implemented to ensure that proposed developments meet not only the needs of the tourism industry, but also those of residents.
4.2 Additional challenges A number of challenges will face KAZA TFCA institutions in their attempts to support and facilitate sustainable tourism, support local economic development and poverty alleviation. Significant challenges will face policy makers in attempting to harmonise tourism and associated policy and legislation, particularly as the five countries are at different stages of economic development, and have very different stages of tourism development. The need for tourism and related policies to be coherent within the KAZA region will need to be balanced with the needs of the tourism industry elsewhere in each of the five countries. A balance will also need to be achieved between regulations and policies that encourage sustainable tourism, and those that are so complex or bureaucratic that they stifle the growth of the industry. An important decision for policy makers will be the choice and trade-offs between providing incentives to encourage the desired behaviour change and implementing ‘command and control’ regulations to enforce change. Due to the high costs of implementing comprehensive monitoring and enforcement programmes, it can be cheaper and more effective to create incentives to change business behaviour. Thus when designing and implementing policies relating to sustainable tourism, it would be sensible to investigate the possibilities of offering inducements for businesses who willingly adopt measures to improve sustainability. Government is ideally placed to set up an enabling environment that stimulates desired outcomes. However, the creation of an enabling environment should not become confused with being an active participant in the tourism industry. It has been demonstrated within the region, and elsewhere in the world, that the private sector is frequently more efficient than government at managing industries such as tourism. (See for example the commercialisation processes of South African National Parks and some of the South African provincial conservation agencies, where the core business of conservation and biodiversity management remains with the state, while tourism facilities and their management are outsourced (Child et al., 2004; Davies and Leitner, 2003; Daitz, in prep.).) One of the major issues that will require an innovative solution will be how to incorporate the needs and wishes of local residents in all aspects of the planning, decision-making and implementation of the KAZA TFCA. The institutional structures set up to manage transfrontier parks and TFCAs elsewhere in southern Africa do not provide explicitly for such active community participation. Lessons should be learned from the lack of participation of local communities in the Great Limpopo TFCA and such issues can be avoided in the KAZA region if structures allow for direct community participation in these processes (see Wolmer 2003 & 2004; Ashley and Wolmer, 2003; Refugee Research Programme, 2002; Katerere et al., 2001; and Jones and Chonguiça, 2001). Further, support and strengthening of existing transboundary tourism and natural resource management institutions should be provided as one means of encouraging local input into planning processes. A balance will need to be achieved between the benefits accruing to the tourism industry based on the extensive natural and wildlife attractions of the region, and the cost of managing these resources. While profits from the nature-based tourism industry in KAZA accrue predominantly to private and
Tourism in the Kavango–Zambezi Transfrontier Conservation Area 51
corporate enterprises, the costs of managing national parks and other protected areas fall largely on the national governments of the five countries. (The obvious exception to this are community and private conservation areas, which are expected to generate sufficient revenues to manage the natural resources within their boundaries with little assistance from the state.) Methods of ensuring that the industry, which relies almost entirely on well managed wildlife populations (inside and out of protected areas) contributes to the cost of their management must be determined. There are many examples of innovative methods of achieving such a goal, and the feasibility of implementing one or more of these arrangements should be determined. One example is the implementation of an environmental levy on tourists and/or tourism businesses in the region, whose revenues are returned to natural resource and protected area management within KAZA. Though such levies are often resisted by the tourism industry, which argues that the additional cost is a deterrent to tourists, there is an enormous amount of literature indicating that foreign tourists’ willingness to pay for nature-based and wildlife experiences is considerably higher than the actual costs they currently face (see Krug et al., 2002, Wells, 1997; Vieta, 1999; Emerton, n.d.). It would seem possible – without the benefit of a comprehensive feasibility study – that a small levy on tourists could generate significant funds to contribute to the costs of wildlife management without negatively impacting on tourist numbers to the region. Tracing such revenues if they were to be routed through central government coffers could be problematic, and would be further complicated if all five governments were to be responsible for collecting such a levy. It has also been shown that tourists are often willing to pay higher levies if the funds are routed to an independent organisation with a specific mandate, ensuring that funds raised are used for their stated purpose (Krug et al., 2002). The introduction of any such levy would also have to dovetail with existing levies collected in the region, and avoid duplication of activities.
5. CONCLUSION In summary, this paper presents a baseline of tourism activity in much of the KAZA region – covering northern Botswana, Livingstone, the Upper Zambezi, Caprivi and part of the tourism sector in Victoria Falls. The survey results show that approximately $US100 million was generated by the accommodation and tour operator sectors in 2004 – approximately $US89 million by the accommodation sector, and $US11 million by tour operators. The industry impacted positively on the economy of the KAZA region through the provision of more than 5,500 jobs, 94 per cent of which were filled by local employees, who earned more than $US14 million in wages and salaries between them. In addition to this, tourism enterprises spent approximately 48 per cent, or $US22 million, of non-wage operating costs locally. While this provides a boost to the KAZA economy, it also represents a significant leakage, with more than 50 per cent of operating expenditures being made outside of the KAZA TFCA. Almost 90 per cent of tourism businesses within KAZA were privately owned, and approximately half were locally owned. However, local owners earned a relatively small proportion of total turnover generated in the industry (around 19 per cent), in stark contrast to the corporate enterprises, which represented only seven per cent of establishments, but generated 50 per cent of revenue in the region. The high levels of leakage from the industry are also highlighted by the estimation that only approximately 20 per cent of profit earned in the industry remained within the KAZA TFCA. Though some KAZA stakeholders have already identified sustainable tourism as one means of achieving sustainable economic development and poverty alleviation within the KAZA region, a number of policies, regulations and incentives will need to be introduced to encourage the adoption of sustainable tourism principles in the region. Policies and incentives will need to be developed to encourage local participation in the tourism industry and to encourage industry players to adopt more sustainable business practices. However, it is heartening to note that the survey results presented
Tourism in the Kavango–Zambezi Transfrontier Conservation Area 52
above provide evidence of willingness on the part of existing operators to contribute to the development of local areas, with approximately 50 per cent of businesses surveyed already making voluntary financial and in-kind contributions to local communities. Raising the awareness of industry participants regarding the ease and methods of maximising the social and economic benefits of their business practices, coupled with some combination of incentives and regulations regarding local employment, local procurement policies and partnership arrangements would likely stimulate significant positive changes within the industry. Though it is almost certain that there will always be a proportion of operators who are disinterested in contributing to, or participating in, TFCA activities, if even a significant minority of operators do change their business practices, it is likely that significant additional positive local economic impact will follow. It can be seen from the survey results presented above that the tourism industry as it currently operates is already contributing to economic growth, revenue generation, government tax revenues and job creation within the KAZA region. However, the KAZA countries are characterised by high levels of inequality and poverty – where between one quarter and two thirds of the population live on less than $US1 per day, and between 55 and 90 per cent live on less than $US2 per day12 (World Bank/UNDP, 2005; GeoHive, 2005). Within the KAZA region, much of the population is rural, reliant on rainfed agriculture, often food insecure, and without adequate access to infrastructure and other government services. In the region covered by this survey, the total population is in excess of one million people. In 2004, at least 5,500 people were employed in the tourism industry – just one half of one per cent of the population. Assuming that each employee provides support to one household, the indirect impact rises to around five per cent of the population. It would be expected that with the anticipated continued growth in the industry, combined with a widespread adoption of sustainable tourism principles as outlined above, the industry could make an important contribution to achieving the economic development and poverty alleviation objectives of the KAZA TFCA – particularly as very few alternative development programmes currently exist in the region. However, this contribution should be neither over- or under-emphasised; sustainable tourism development should rather be recognised as one element of a suite of development strategies that are required to overcome poverty and stagnant economic development in the region. Given that the majority of residents within the KAZA region are reliant on subsistence agriculture, consideration should also be taken of implementing programmes to improve the efficiency and sustainability of resource use of agriculture and pastoralism, while increasing production and productivity levels in the sector.
12 Data is for Botswana, Namibia, Zambia and Zimbabwe only. There is no data available for Angola.
Tourism in the Kavango–Zambezi Transfrontier Conservation Area 53
REFERENCES Anon, (n.d.) ‘Annotated agenda of the meeting of Ministers responsible for tourism in Angola,
Botswana, Namibia, Zambia and Zimbabwe on the Okavango Upper Zambezi International Tourism Initiative.’ 24 July, 2003, Katima Mulilo, Namibia.
Ashley, C. and Wolmer, W. (2003) ‘Transforming or tinkering: New forms of engagement between communities and the private sector in tourism and forestry in southern Africa.’ Sustainable Livelihoods Southern Africa Research Paper No. 18. Brighton: Institute of Development Studies.
Child, B., with Castley, G., Knight, M., Gordon, J., Daitz, D., Johnson, S., Boonzaaier, W., Collinson, R., Davies, R., Grossman, D., Holden, P., Kiss, A., Fearnhead, P. (2004) ‘Innovations in park management.’ In Child, B. (ed.) Parks in transition. Biodiversity, rural development and the bottom line. London: Earthscan.
Cullis, A. and Watson, C. (2004) ‘Winners and losers: Privatising the Commons.’ Briefing Paper. London: International Institute for Environment and Development/Resource Conflict Institute.
Daitz, D. (in prep.) ‘Creating the Cape Peninsular National Park. An account of some of the hurdles and the strategies used to overcome them.’
Davies, R. and Leitner, P. (2003) ‘Financial and economic implications.’ In Brett, M. (ed.) Madikwe
Game Reserve a decade of progress. Mafikeng: North West Parks and Tourism Board. DHV Consultants (1999) ‘Preliminary project scan for the scoping assessment for the Okavango
Upper Zambezi International Tourism study (OUZIT)’. Unpublished paper for the Development Bank of Southern Africa.
DN-Consult (2004) ‘Report on actual planning state of the Okavango–Upper Zambezi International Tourism Initiative.’ Unpublished report/SADC/KfW.
Emerton, L. (n.d.) ‘Mount Kenya: The economics of community conservation.’ Community conservation research in Africa: Principles and comparative practice. Paper No.6. Manchester: IDPM/University of Manchester.
GeoHive (2005) ‘GeoHive population data – Angola administrative units; Botswana administrative units; Namibia administrative units; Zambia administrative units; Zimbabwe administrative units.’ www.212.204.253.230/cd/link.php?xml=ao&xsl=neo1
Government of the Kingdom of Lesotho/Government of the Republic of South Africa (2001) ‘Memorandum of understanding between the Government of the Kingdom of Lesotho and the Government of the Republic of South Africa in respect of the Maloti–Drakensberg Transfrontier Conservation and Development Area.’
Government of the Republic of Botswana/Government of the Republic of South Africa (1999) ‘Bilateral agreement between the Government of the Republic of Botswana/Government of the Republic of South Africa on the recognition of the Kgalagadi Transfrontier Park.’
Government of the Republic of Mozambique/Government of the Republic of South Africa/Government of the Republic of Zimbabwe (2002) ‘Treaty between the Government of the Republic of Mozambique, the Government of the Republic of South Africa and the Government of the Republic of Zimbabwe on the establishment of the Great Limpopo Transfrontier Park.’
Government of the Republic of Namibia/Government of the Republic of South Africa (2003) ‘Treaty between the Government of the Republic of Namibia and the Government of the Republic of South Africa on the establishment of the [|Ai-|Ais/Richtersveld] Transfrontier Park.’
Hall-Martin, A. and Modise, S. (2002) ‘Existing and potential transfrontier conservation areas in the SADC region. Status report.’ Stellenbosch: PPF/RETOSA/DBSA.
Hanks, J. (2005) ‘Kavango–Zambezi: The four-corners transfrontier conservation area.’ In Mittermeier, R.A., Kormos, C.F., Mittermeier, C.G., Robles Gil, P., Sandwith, T. and Besançon, C. (eds.) Transboundary conservation. A new vision for protected areas. Washington, D.C.: Conservation International/CEMEX.
Jones, B.T.B. and Chonguiça, E. (2001) ‘Review and analysis of specific transboundary natural resource management initiatives in the southern African region.’ TBNRM in southern Africa
Series Paper No. 2. Harare: IUCN-ROSA.
Tourism in the Kavango–Zambezi Transfrontier Conservation Area 54
Katerere, Y., Hill, R. and Moyo, S. (2001) ‘A critique of transboundary natural resource management in southern Africa.’ TBNRM in southern Africa Series Paper No. 1. Harare: IUCN-ROSA.
Krug, W., Suich, H., Haimbodi, N. (2002) ‘Park pricing and economic efficiency in Namibia.’ DEA Research Discussion Paper No.45. Windhoek: Ministry of Environment and Tourism.
Mastny, L. (2001) ‘Travelling light. New paths for international tourism.’ Worldwatch Paper No.159. Washington, D.C.: Worldwatch Institute.
New Partnership for Africa’s Development (2001) New partnership for Africa’s development (NEPAD). Abuja: NEPAD. http://www.uneca.org/nepad/nepad.pdf
Perkins, J. (2005) ‘Status and perspectives of regional tourism in the context of the Kavango–Zambezi initiative, KAZA TFCA.’ Unpublished support document to local consultation and national stakeholder workshops/InWEnt.
President of Namibia, Hon. S Nujoma (2003) ‘Statement by His Excellency Sam Nujoma, President of the Republic of Namibia, on the occasion of the meeting of the Okavango Upper Zambezi International Tourism Initiative (OUZIT).’ 23 July, 2003, Katima Mulilo, Namibia.
Refugee Research Programme (2002) ‘A park for the people? Great Limpopo Transfrontier Park – Community consultation in Coutada 16, Mozambique.’ Report by the Refugee Research Programme, University of Witwatersrand. http://www.wits.ac.za/rrp/transfrontier_park.pdf
Singh, J. (1999) Study on the development of transboundary natural resource management areas in southern Africa. Global review. Washington, D.C.: Biodiversity Support Programme.
Southern African Development Community (1999) Protocol on wildlife conservation and law enforcement. Gaborone: SADC.
Suich, H. (2003) ‘Summary of partial results from the socio-economic household survey regarding community based natural resource management and livelihoods in Caprivi and Kunene.’ WILD
Project Working Paper No. 12. Windhoek: Ministry of Environment and Tourism/WILD. UN-EUROSTAT-OECD-WTO. (2000) Tourism satellite account (TSA): Methodological references.
Madrid: World Tourism Organisation. United Nations Environment Programme/World Tourism Organisation (2004) Making tourism more
sustainable: A guide for policymakers. Madrid: UNEP/WTO. Vieta, F.E. (1999) ‘Ecotourism propels development.’ Africa Recovery. Vol.13, No.1. Wells, M. (1997) ‘Economic perspectives on nature tourism, conservation and development’
Environment Department Paper No.55. Washington, D.C.: World Bank. Wolmer, W. (2003) ‘Transboundary conservation: The politics of ecological integrity in the Great
Limpopo Transfrontier Park.’ Sustainable Livelihoods Southern Africa Research Paper No. 4. Brighton: Institute of Development Studies.
_______ (2004) ‘Tensions and paradoxes in the management of transboundary protected areas.’ Policy Matters. No. 13:137–47.
World Bank/United Nations Development Programme (2005) ‘Income and poverty 2005.’ www.worldbank.org
World Tourism Organisation (1998) Tourism 2020 vision: A new forecast. Madrid: WTO. Yunis, E. (2004) ‘Sustainable tourism and poverty alleviation.’ Presentation given at the Annual
World Bank Conference on Development Economics, Brussels, Belgium, 10 May, 2004.
Tourism in the Kavango–Zambezi Transfrontier Conservation Area 55
APPENDIX 1 ACCOMMODATION ESTABLISHMENT SURVEY Purpose of study and statement of confidentiality: This survey is part of a study being conducted by Conservation International’s Southern Africa Transfrontier Conservation Areas Unit. The purpose of this study is to measure the impact on regional ecotourism economic flow of the implementation of the Kavango-Zambezi Transfrontier Conservation Area (KAZA TFCA). The sample region for this study includes parts of Botswana, Namibia, Zambia, and Zimbabwe. All
responses are strictly confidential. Data will be made public only in aggregate form. No information, financial or otherwise, will be released carrying the name or other identifying characteristic of any individual or business. This survey
will take approximately 30 minutes to complete. Thank you for your help and cooperation!
ID# #
A. BACKGROUND INFORMATION
1 In what year did the establishment open?
2 How many rooms did the establishment have in 2004?
3 How many beds did the establishment have in 2004?
4 How many people could be accommodated per night camping in 2004?
5 What is the average/typical length of stay at your establishment?
6 What is the proportion of guests of each of the following types:
a Self-drive/independent tourists (%)
b Package tourists (fly-in) (%)
c Overland truck tourists (%)
d Organised group (school, church, etc.) (%)
e Non-tourist guests (e.g. business, conferences, etc.) (%)
f Other (%) (please describe) …
7 What is the proportion of guests by country of origin?
a Domestic (%)
b Neighbouring KAZA nations (%)
c Other Foreign (%)
8
Which best describes the ownership of the enterprise? [1=Private; 2=Communal; 3=State/government; 4=Publicly listed company; 5=Community/Private Joint Venture; 6=Other ]
9a If owned privately, which best describes the residence of the owner(s)? [1=Local 2=Rest of KAZA 3=Foreign]
9b In order to track the transformation of the industry over the long, term, can you tell me, if the enterprise is owned privately, whether the owner black, white or other? [1=Black 2=White 3=Other]
Please describe:
10 If it is owned publicly, where is the company headquartered and/or listed?
Tourism in the Kavango–Zambezi Transfrontier Conservation Area 56
B. EMPLOYMENT
11 What is the total employment, including management?
12 How many local people are employed?
a Full time male (local)
b Full time female (local)
c Part time male (local)
d Part time female (local)
13 How many non-local nationals are employed? (full time equivalent)?
14 How many other KAZA nationals are employed (full time equivalent)?
15 How many other expatriates are employed (full time equivalent)?
C. FINANCIAL INFORMATION 2004 REVENUE:
16 How many bednights were sold in 2004?
17 What are the rates per person per night to stay at the enterprise?
18a What was the high season occupancy rate (%) in 2004
18b What was the low season occupancy rate (%) in 2004
19 What was the total annual turnover (revenue) of the enterprise in 2004?
20a What was the total annual income from accommodation operations?
20b What was the total annual income from restaurant and beverage sales?
20c What was the total annual income, if any, from tours?
20d What was the total annual income, if any, from (other)? Please describe …
20e What was the total annual income, if any, from financial support received from NGOs, government, or other donors?
D. 2004 EXPENDITURES:
21 What was the total annual wage bill in 2004?
22a What was the total annual wage bill for local staff, including management?
22b What was the total annual wage bill for non-local national staff?
22c What was the total annual wage bill for other KAZA national staff?
22d What was the total annual wage bill for expatriate staff?
23 How much was paid to local/regional government for rates (e.g. property rates or taxes)?
24 How much was paid to national government in the form of company taxes, VAT, etc.?
25a How much was spent on other operating costs (excluding capital items)? Do these expenses include the following:
Food/drinks /cleaning materials, etc. Maintenance – buildings and vehicles/workshops (cars and boats) Rent/bond repayments Marketing Professional fees (e.g. legal/ accounting) + insurance Office costs + communications (e.g. post, phones, internet) Petrol/oil (vehicles + generator)
25b Concession fees to Park Authority
26a How much (if any) non-wage financial support was given to the local community?
Tourism in the Kavango–Zambezi Transfrontier Conservation Area 57
26b How much (if any) non-wage non-financial support (i.e. in-kind) was given to the local community? What was the approximate value of this support?
E. LINKS WITH OTHER BUSINESSES:
27 What proportion of your clients come to you from each of the following sources?
a Walk in (%)
b Internet or other direct booking (e.g. phone) (%)
c Local hotels and/or operators (including tourist information centres (%)
d Neighbouring KAZA hotels and/or operators (including TICs) (%)
e Foreign travel agencies/tour operators (%)
f Other (%) Please describe …
28a Does the establishment regularly use the services of any other local businesses (excluding tour operators)? [1=Yes 2=No]
28b If yes, how much was spent in these local businesses in 2004?
F. KNOWLEDGE OF KAZA TFCA
29 How, if at all, has tourism to your establishment changed over the last three years? [1=Increased since 2002 2=Decreased since 2002 3=No change]
30 Have there been any changes in capacity in the last three years? If yes, how much has it changed (beds/night)?
31 What changes, if any, have you seen in tourist visitation patterns (i.e. countries and attractions visited, length of stay, etc) over the time the enterprise has been in operation? Please describe:
32 For each of the parks your guests frequently visit, have you seen any changes in the quality of the park resource over the time the enterprise has been in operation? [1=Positive 2=Negative 3=No change]
a Chobe National Park
b Mosi-oa-Tunya
c Hwange
d Moremi/Okavango Delta
e Zambezi National Park
f Other (please name)
33 Do you know about the proposed Kavango-Zambezi Transfrontier Conservation Area in this region? [1=Yes 2=No]
34 How do you know about the KAZA TFCA. Please describe:
Tourism in the Kavango–Zambezi Transfrontier Conservation Area 58
35 From what you know about it, what effect, if any, do you think the KAZA TFCA will have on your business? [1=Positive 2=Negative 3=No effect]
36 Which particular aspect of the KAZA TFCA do you think would be most responsible for the change? Please describe:
37 Which, if any, of the following changes would your business be likely to make with the TFCA? (Tick any that apply)
a Contracting or coordination with operators/businesses in other KAZA countries
b Joint advertising/marketing with tour operators and/or hotels in other KAZA countries
c Investments in operations in other KAZA countries
d No change
e Other (Please describe …)
38 What effect, if any, do you think the KAZA TFCA will have on tourist visitation patterns (i.e. countries and attractions visited, length of stay, etc.)? Please describe:
39 What effect, if any, do you think the KAZA TFCA will have on park resource quality? [1=Positive 2=Negative 3=No effect]
If any, please describe:
40 What other effects, if any, do you think the KAZATFCA will have on the region? Please describe:
41 Other comments?
Tourism in the Kavango–Zambezi Transfrontier Conservation Area 59
APPENDIX 2 TOUR OPERATOR SURVEY
Purpose of study and statement of confidentiality: This survey is part of a study being conducted Conservation International’s Southern Africa Transfrontier Conservation Areas Unit. The purpose of this study is to measure the impact on regional ecotourism economic flow of the implementation of the Kavango-Zambezi Transfrontier Conservation Area (KAZA TFCA). The sample region for this study includes parts of Botswana, Namibia, Zambia, and Zimbabwe. All
responses are strictly confidential. Data will be made public only in aggregate form. No information, financial or otherwise, will be released carrying the name or other identifying characteristic of any individual or business. This survey
will take approximately 30 minutes to complete. Thank you for your help and cooperation!
ID# #
A. BACKGROUND INFORMATION
1 In what year did the business open?
2 How many tour vehicles does the business operate (including boats but not support vehicles)?
3 How many people can the business accommodate per day (i.e. maximum capacity)?
4 What is the proportion of clientele of each of the following types:
a Self-drive/Independent tourists (%)
b Package tourists (fly-in) (%)
c Overland truck tourists (%)
d Organised group (school, church, etc.) (%)
e Other (%) (please describe) …
5 What is the proportion of clientele by country of origin
a Domestic (%)
b Neighbouring KAZA country (%)
c Other foreign (%)
6 What was the total number of tours run in 2004?
7 How many tours included:
a Angola (%)
b Botswana (%)
c Namibia (%)
d Zambia (%)
e Zimbabwe (%)
f f. Other (%) (please describe) …
8 How many total tourists were taken in 2004?
9 How many total tourists-days were taken in 2004?
10 Which best describes the ownership of the enterprise? [1=Private; 2=Communal; 3=State/government; 4=Publicly listed company; 5=Community/Private Joint Venture; 6=Other ]
Tourism in the Kavango–Zambezi Transfrontier Conservation Area 60
11a If owned privately, which best describes the residence of the owner(s)? [1=Local 2=Rest of KAZA 3=Foreign]
11b In order to track the transformation of the industry over the long, term, can you tell me, if the enterprise is owned privately, whether the owner black, white or other? [1=Black 2=White 3=Other]
Please describe:
12 If it is owned publicly, where is the company headquartered and/or listed?
B. EMPLOYMENT
14 What is the total employment, including management?
15 How many local people are employed?
a Full time male (local)
b Full time female (local)
c Part time male (local)
d Part time female (local)
16 How many non-local nationals are employed (full time equivalent)?
17 How many other KAZA nationals are employed (full time equivalent)?
18 How many other expatriate people are employed (full time equivalent)?
C. FINANCIAL INFORMATION – 2004 REVENUE
19 How many clients did the operation receive per month in the high season?
20 How many clients did the operation receive per month in the low season?
21 What is the typical daily price of a tour with this business?
22 What was the total annual turnover (revenue) of the enterprise in 2004?
23a What was the total annual income from tour operations?
23b What was the total annual income from food and beverage sales?
23c What was the total annual income, if any, from other sources? Please describe …
23d What was the total annual income, if any, from financial support received from NGOs, government, or other donors?
D. FINANCIAL INFORMATION – 2004 EXPENDITURES
24 What was the total annual wage bill in 2004?
25a What was the total annual wage bill for local staff, including management?
25b What was the total annual wage bill for non-local national staff?
25c What was the total annual wage bill for other KAZA national staff?
25d What was the total annual wage bill for expatriate staff?
26 How much was paid to local/regional government for rates (e.g. property rates)?
27 How much was paid to national government in the form of company taxes, VAT, etc.?
Tourism in the Kavango–Zambezi Transfrontier Conservation Area 61
28a How much was spent on other operating costs (excluding capital purchases)? Do these expenses include the following:
Food/drinks /cleaning materials, etc. Maintenance – buildings and vehicles/workshops (cars and boats) Rent/bond repayments Marketing Professional fees (e.g. legal/ accounting) + insurance Office costs + communications (e.g. post, phones, internet) Petrol/oil (vehicles + generator)
28b Concession fees to Park Authority
29a How much (if any) non-wage monetary payment was made to the local community?
29b How much (if any) non-monetary payment (payment in-kind) was made to the local community? What was the approximate value of this support?
E. LINKS WITH OTHER BUSINESSES
30 What proportion of your clients come to you from each of the following sources?
a Walk in (%)
b Internet or other direct booking (e.g. phone) (%)
c Local hotels and/or operators (including tourist information centres) (%)
d Neighbouring KAZA hotels and/or operators (including TICs) (%)
e Foreign travel agencies/tour operators (%)
f Other (%) Please describe …
31a Does the establishment regularly use the services of any other local businesses (excluding hotels)? [1=Yes 2=No]
31b If yes, how much was spent on these local businesses in 2004?
F. QUALITATIVE INFORMATION
32 How, if at all, has tourism to your business changed over the last three years? [1=Increased since 2002 2=Decreased since 2002 3=No change]
33 What changes, if any, have you seen in tourist visitation patterns (i.e. countries and attractions visited, length of stay, etc) over the time the enterprise has been in operation? Please describe:
34 For each of the parks your guests frequently visit, have you seen any changes in the quality of the park resource over the time the enterprise has been in operation? [1=Positive 2=Negative 3=No change]
a Chobe National Park
b Mosi-oa-Tunya
c Hwange
d Moremi/Okavango Delta
e Zambezi National Park
f Other (please name)
Tourism in the Kavango–Zambezi Transfrontier Conservation Area 62
35 41. Do you know about the proposed Kavango-Zambezi Transfrontier Conservation Area (KAZA TFCA) in this region? [1=Yes 2=No 9999=No response]
36 42. Where did you hear about the KAZA TFCA? Please describe:
37 From what you know, what effect, if any, do you think the KAZA TFCA will have on your business? [1=Positive 2=Negative 3=No effect]
38 Which particular aspect of the KAZA TFCA do you think would be most responsible for the change? Please describe:
39 Which, if any, of the following changes would your tour operation be likely to make with the TFCA? (Tick any that apply)
a More routes (to destinations currently visited)? If so, where?
b New routes (to destinations not currently visited)? If so, where?
c Contracting or coordination with tour operators in other countries
d Advertising with tour operators or hotels in other countries
e No change
f Other (please describe):
40 What effect, if any, do you think the KAZA TFCA will have on tourist visitation patterns? (i.e. countries and attractions visited, length of stay, etc.) Please describe:
41 What effect, if any, do you think the KAZA TFCA will have on park resource quality? [1=Positive 2=Negative 3=No effect]
If any, please describe?
42 What other effects, if any, do you think the KAZA TFCA will have on the region? Please describe
43 Other comments?
Tourism in the Kavango–Zambezi Transfrontier Conservation Area 63
APPENDIX 3 TOURISM BUSINESS INVENTORY
Accommodation Northern Botswana Livingstone (cont …)
Baobab Safari Lodge Livingstone Hotel Bophirmo Guesthouse Livingstone Overnight Chobe Chilwero Lodge Livingstone Safari Lodge Chobe Game Lodge Lungu Chobe Marina Lodge Main Street Resort Chobe Safari Lodge Malucha Guesthouse Cresta Mowana Lodge Manzo Elephant Valley Lodge Maramba River Lodge Garden Lodge Mbizi Guest House Kubu Lodge Mekudas Liya Campsite MK Guest House Liya Guest House Moloke Lodge and Tours Muchenje Safari Lodge Moore’s Guesthouse Ngina Safari Camp Namels Guesthouse Sedudu Guest House & Lodge New Fairmount Hotel Thebe River Safaris Ngolide Lodge Toro Safari Lodge Nicos Touch of Africa Nkwazi Waterlily Guest House Nokenu Wilmos Nyala Lodge
Peace Gardens (SPF & CM Guesthouse)
Livingstone Rainbow Africa A1/2000 Red Cross Hostel Abchris (Abicris) Rest Transit Asanti Guesthouse Rite Inn Big Tree Royal Kwandu Busiku Royal Mushili Chanters Guest Lodge Roysam Lodge and Tours Chapa Classic Savannah Guest Lodge Chimbira Simac Lodge and Tours Chiwala Simantanga Chrisago Guest House Songwe Point Village Chrisrab Southern Comfort Comfort Corner Guest House Southern Queen Decha Stanley Safari Lodge Divine Stargazer Elaine Brittel Guest House Taita Falcon Lodge/ Falls View Peregrine’s Nest Bush Camp Farai Gardens The Grotto Overland Trucks Fawlty Towers The Stone Guestmate Guesthouse The Zambezi Waterfront Jollyboys Backpackers Thompson Junior Leisure Resort Tulye Tonje Kaazmein Lodge Tunya Lodge Kays Upview Koonje Guest Lodge Villa de Kabubwa Kozo Wane Guesthouse Kuta Way Wasawange Lounge Laughing Dragon Whitewater Libala Inn Woodlands Guesthouse Likute Guest House Zambezi Sun/ Royal Livingstone Limbo Guest Lodge Zambezi Ultima Lodge Livingstone Holiday Home Zigzag
Tourism in the Kavango–Zambezi Transfrontier Conservation Area 64
Victoria Falls Upper Zambezi (cont …)
A’Zambezi Rainbow Maziba Bay Backpackers Africa Mulatiwa Guest House Club Shoestring Mutemwa Elephant Hills Natural Mystic Encore Budget Hotel No Name Camp Fun in the Sun Sakazima Island Camp Game Lodge Connection Sesheke Lodge Hitch Haven Sussi and Chuma Hornbills The River Club Hunters Lodge Thebe River Safaris Ilala Lodge Thorntree Lodge Inyathi Valley Motel & Restcamp Tongabezi Kalai Zambelozi Kilalela Lodge Zambezi Royal Chundu/ Tree Tops
Livingstone Lodge Livingstone Tranquillity Caprivi
Lokuthula Lodge Bum Hill Campsite Lorries Camp Kwando MIPF Flats Caprivi Cabins Mosi-oa-Tunya Lodge Caprivi River Lodge Municipal Caravan Park Chobe Savanna Lodge Pat’s Self Catering Divundu Guest House Pumulo Cottages Hippo Lodge Rainbow Hotel Ichingo Chobe River Lodge Reynard Cottages Impalila Island Lodge Savanna Lodge Backpackers Island View Lodge Senanga Lodge Kalizo Lodge Sprayview Hotel Kings Den Lodge The Kingdom Kubunyana Camp Town Council Rest Camp Lianshulu Lodge Vakatsha Lodge Mahangu Lodge Victoria Falls Backpackers Mamili Campsites Victoria Falls Hotel Mazambala Island Lodge Victoria Falls Safari Lodge Mukuzi Cabins and River Cabins Villa D’Afrique N//Goabaca Campsite Villa Victoria Nakatwa Campsite Zambezi National Park Restcamp Nambwe Campsite
Namushasha Country Lodge
Upper Zambezi Ndhovu Safari Lodge Brendas Best Baobab B&B Ngepi Camp Chundukwa Tree Lodge Open Sky Gweba Safaris/Soka Fishing Camp Popa Falls Ilombe Rainbow River Lodge Islands of Siankaba Salambala Campsite Jungle Junction/ Bovu Island Savannah Lodge Kabula Tiger Lodge Suclabo Okavango Lodge Kavumbu River Camp Susuwe Island Lodge Kazangula Rest Stop Zambezi Lodge
Mawala Lodge
Tourism in the Kavango–Zambezi Transfrontier Conservation Area 65
Tour operators Northern Botswana Livingstone African Odyssey African Extreme Afroventure Safaris/CC Africa Atulu Travel and Tours Chobe Safari Lodge Tours Bundu Adventures Chobe Travel Shop Bushtracks Flying Game Safaris Bwaato Adventures Fun Fun Tours Frosia Tours and Safaris Into Africa Safaris Gwende Janala Tours Livingstone Walking Safaris Kalahari Holiday Tours Livingstone’s Adventure Linyanti Explorations Local Cowboy Tours Nsundano Travel Tours and Safaris Makora Quest S & L Bartlett Plafours Travel Tours and Car Hire Safari Excellence Southern African Touring Services Thanda Manzi/ Ex Africa Safaris Taonga Tours/Taonga Houseboat Thebe River Safaris United Air Charters
UTC Wild Horizons Wild Side Tours Zambezi Whitewater Zamscape