Embed Size (px)
Citation preview
HARDWARE STORE
Smart mobilityReducing congestion and fostering faster, greener, and cheaper transportation options
dupress.com/collection/smart-mobility/
Smart mobilityReducing congestion and fostering faster, greener, and cheaper transportation options
Copyright © 2015 Deloitte Development LLC. All rights reserved.Member of Deloitte Touche Tohmatsu Limited
*i.e. Carpooling **e.g. Car2Go, Enterprise CarShare, Relay Rides, ZipCar ***e.g. Lyft, Uber, SidecarDeloitte University Press | Smart Mobility | @DU_Press @DeloitteGov #SmartMobility Copyright © 2015 Deloitte Development LLC. All rights reserved.
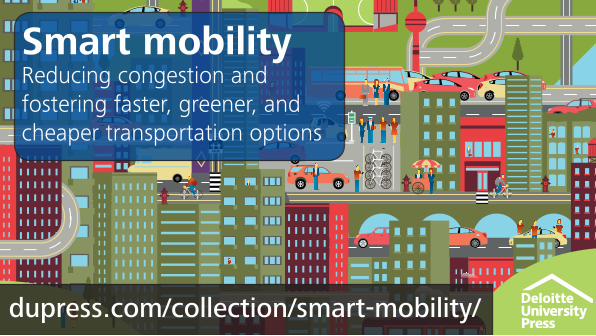
The study maps the economic potential of four alternative commuting modes which could ease gridlock at far lower costs than traditional approaches to congestion reduction: o Ridesharing* o Bike commuting o Carsharing** o On-demand ride services***
Deloitte Public Sector Research recently completed one of the first nationwide studies quantifying the potential congestion relief benefits of alternative modes of transportation in the country’s 99 largest metropolitan areas.
Smart Mobility
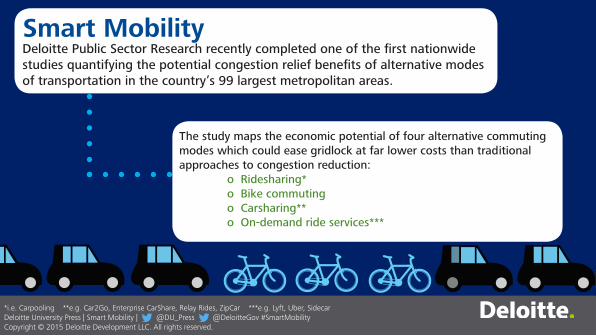
Traffic congestion in AmericaAmerica’s gridlock problem becomes more acute each year.
Every 20-mile commute costs government $1 in infrastructure costs. If you include the cost of congestion, air pollution, or even lost property value near roadways, the total estimated external cost of driving runs between 27-55 cents per mile.The average American spends about 34
hours every year sitting in traffic – that’s 5.5 billion hours for all commuters. The economic opportunity cost of this wasted time is staggering: $124 billion annually.
Deloitte University Press | Smart Mobility | @DU_Press @DeloitteGov #SmartMobility Copyright © 2015 Deloitte Development LLC. All rights reserved.
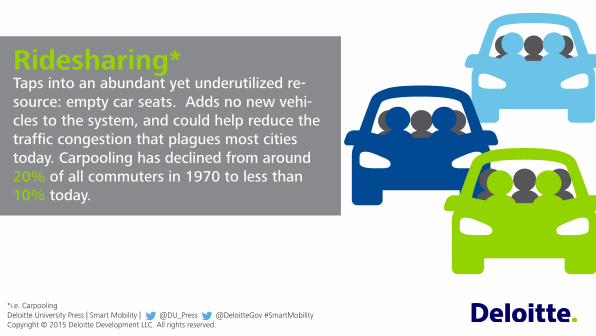
Ridesharing*Taps into an abundant yet underutilized re-source: empty car seats. Adds no new vehi-cles to the system, and could help reduce the traffic congestion that plagues most cities today. Carpooling has declined from around 20% of all commuters in 1970 to less than 10% today.
*i.e. CarpoolingDeloitte University Press | Smart Mobility | @DU_Press @DeloitteGov #SmartMobility Copyright © 2015 Deloitte Development LLC. All rights reserved.
*i.e. CarpoolingCopyright © 2015 Deloitte Development LLC. All rights reserved.Member of Deloitte Touche Tohmatsu Limited
Current ridesharers: 10.1% Potenial new: 11.3% Projected total
30 million total ridesharers, 27% of commuters
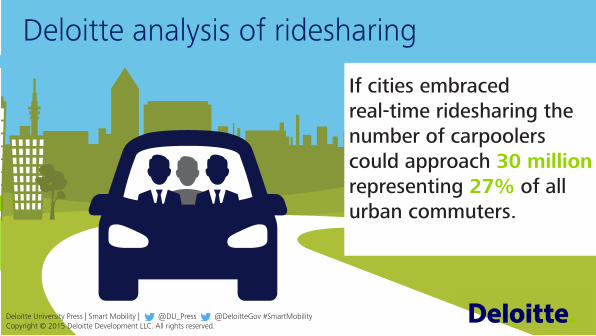
Deloitte analysis of ridesharing
If cities embraced real-time ridesharing the number of carpoolers could approach 30 million representing 27% of all urban commuters.
Deloitte University Press | Smart Mobility | @DU_Press @DeloitteGov #SmartMobility Copyright © 2015 Deloitte Development LLC. All rights reserved.
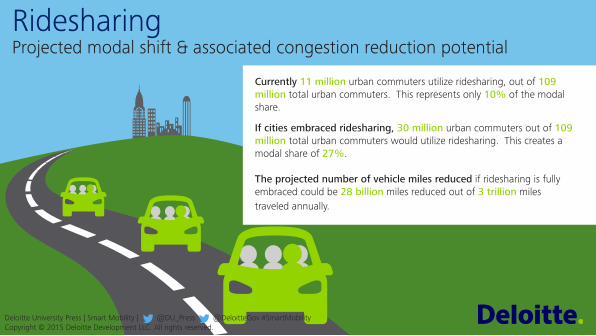
Currently 11 million urban commuters utilize ridesharing, out of 109 million total urban commuters. This represents only 10% of the modal share.
If cities embraced ridesharing, 30 million urban commuters out of 109 million total urban commuters would utilize ridesharing. This creates a modal share of 27%.
The projected number of vehicle miles reduced if ridesharing is fully embraced could be 28 billion miles reduced out of 3 trillion miles traveled annually.
RidesharingProjected modal shift & associated congestion reduction potential
Deloitte University Press | Smart Mobility | @DU_Press @DeloitteGov #SmartMobility Copyright © 2015 Deloitte Development LLC. All rights reserved.
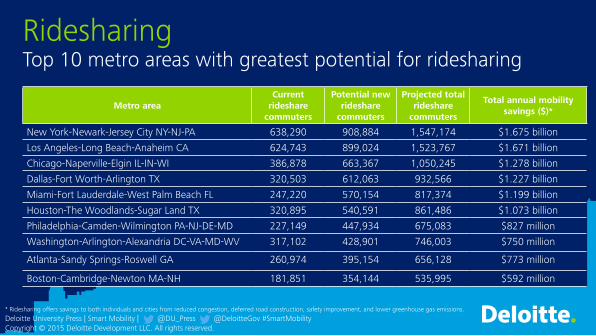
RidesharingTop 10 metro areas with greatest potential for ridesharing
Metro areaCurrent
rideshare commuters
Potential new rideshare
commuters
Projected total rideshare
commuters
Total annual mobility savings ($)*
New York-Newark-Jersey City NY-NJ-PA 638,290 908,884 1,547,174 $1.675 billion
Los Angeles-Long Beach-Anaheim CA 624,743 899,024 1,523,767 $1.671 billion
Chicago-Naperville-Elgin IL-IN-WI 386,878 663,367 1,050,245 $1.278 billion
Dallas-Fort Worth-Arlington TX 320,503 612,063 932,566 $1.227 billion
Miami-Fort Lauderdale-West Palm Beach FL 247,220 570,154 817,374 $1.199 billion
Houston-The Woodlands-Sugar Land TX 320,895 540,591 861,486 $1.073 billion
Philadelphia-Camden-Wilmington PA-NJ-DE-MD 227,149 447,934 675,083 $827 million
Washington-Arlington-Alexandria DC-VA-MD-WV 317,102 428,901 746,003 $750 million
Atlanta-Sandy Springs-Roswell GA 260,974 395,154 656,128 $773 million
Boston-Cambridge-Newton MA-NH 181,851 354,144 535,995 $592 million
* Ridesharing offers savings to both individuals and cities from reduced congestion, deferred road construction, safety improvement, and lower greenhouse gas emissions.
Deloitte University Press | Smart Mobility | @DU_Press @DeloitteGov #SmartMobility Copyright © 2015 Deloitte Development LLC. All rights reserved.
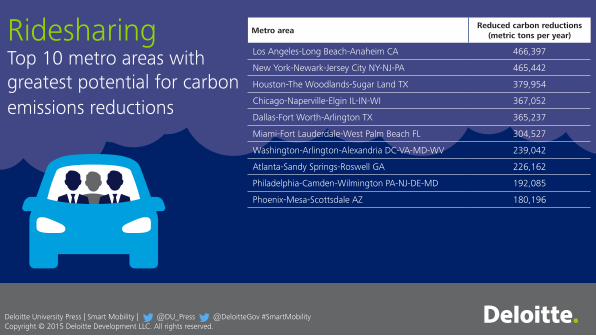
Ridesharing Top 10 metro areas with greatest potential for carbon emissions reductions
Metro areaReduced carbon reductions
(metric tons per year)
Los Angeles-Long Beach-Anaheim CA 466,397
New York-Newark-Jersey City NY-NJ-PA 465,442
Houston-The Woodlands-Sugar Land TX 379,954
Chicago-Naperville-Elgin IL-IN-WI 367,052
Dallas-Fort Worth-Arlington TX 365,237
Miami-Fort Lauderdale-West Palm Beach FL 304,527
Washington-Arlington-Alexandria DC-VA-MD-WV 239,042
Atlanta-Sandy Springs-Roswell GA 226,162
Philadelphia-Camden-Wilmington PA-NJ-DE-MD 192,085
Phoenix-Mesa-Scottsdale AZ 180,196
Deloitte University Press | Smart Mobility | @DU_Press @DeloitteGov #SmartMobility Copyright © 2015 Deloitte Development LLC. All rights reserved.
Copyright © 2015 Deloitte Development LLC. All rights reserved.Member of Deloitte Touche Tohmatsu Limited
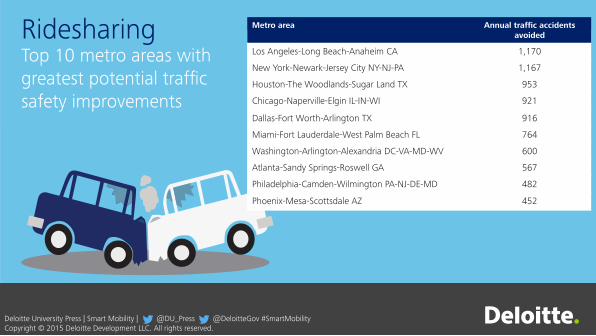
Ridesharing Top 10 metro areas with greatest potential traffic safety improvements
Metro area Annual traffic accidents avoided
Los Angeles-Long Beach-Anaheim CA 1,170
New York-Newark-Jersey City NY-NJ-PA 1,167
Houston-The Woodlands-Sugar Land TX 953
Chicago-Naperville-Elgin IL-IN-WI 921
Dallas-Fort Worth-Arlington TX 916
Miami-Fort Lauderdale-West Palm Beach FL 764
Washington-Arlington-Alexandria DC-VA-MD-WV 600
Atlanta-Sandy Springs-Roswell GA 567
Philadelphia-Camden-Wilmington PA-NJ-DE-MD 482
Phoenix-Mesa-Scottsdale AZ 452
Deloitte University Press | Smart Mobility | @DU_Press @DeloitteGov #SmartMobility Copyright © 2015 Deloitte Development LLC. All rights reserved.
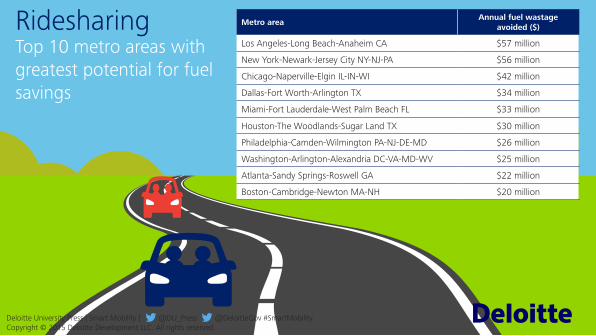
Ridesharing Top 10 metro areas with greatest potential for fuel savings
Metro area Annual fuel wastage
avoided ($)
Los Angeles-Long Beach-Anaheim CA $57 million
New York-Newark-Jersey City NY-NJ-PA $56 million
Chicago-Naperville-Elgin IL-IN-WI $42 million
Dallas-Fort Worth-Arlington TX $34 million
Miami-Fort Lauderdale-West Palm Beach FL $33 million
Houston-The Woodlands-Sugar Land TX $30 million
Philadelphia-Camden-Wilmington PA-NJ-DE-MD $26 million
Washington-Arlington-Alexandria DC-VA-MD-WV $25 million
Atlanta-Sandy Springs-Roswell GA $22 million
Boston-Cambridge-Newton MA-NH $20 million
Deloitte University Press | Smart Mobility | @DU_Press @DeloitteGov #SmartMobility Copyright © 2015 Deloitte Development LLC. All rights reserved.
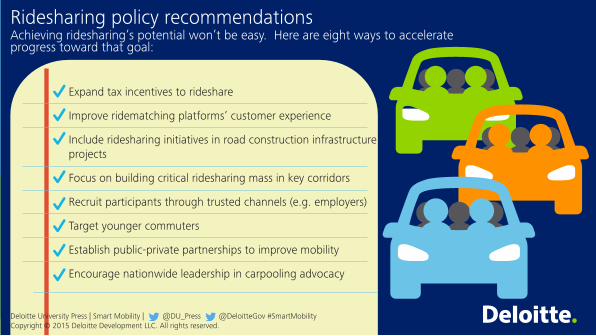
Ridesharing policy recommendationsAchieving ridesharing’s potential won’t be easy. Here are eight ways to accelerate progress toward that goal:
Expand tax incentives to rideshare
Improve ridematching platforms’ customer experience
Include ridesharing initiatives in road construction infrastructure projects
Focus on building critical ridesharing mass in key corridors
Recruit participants through trusted channels (e.g. employers)
Target younger commuters
Establish public-private partnerships to improve mobility
Encourage nationwide leadership in carpooling advocacy
Deloitte University Press | Smart Mobility | @DU_Press @DeloitteGov #SmartMobility Copyright © 2015 Deloitte Development LLC. All rights reserved.
Copyright © 2015 Deloitte Development LLC. All rights reserved.Member of Deloitte Touche Tohmatsu Limited
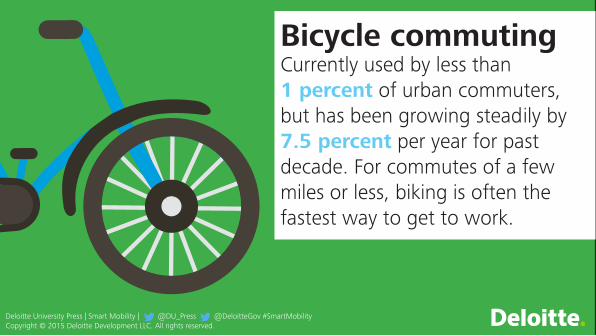
Bicycle commutingCurrently used by less than 1 percent of urban commuters, but has been growing steadily by 7.5 percent per year for past decade. For commutes of a few miles or less, biking is often the fastest way to get to work.
Deloitte University Press | Smart Mobility | @DU_Press @DeloitteGov #SmartMobility Copyright © 2015 Deloitte Development LLC. All rights reserved.
Current bike commuters: 0.6%Potenial new: 11.3%
28.7 million bike commuters could bike to work sometimes, 26% of all commuters
26.1%
28.9
27%
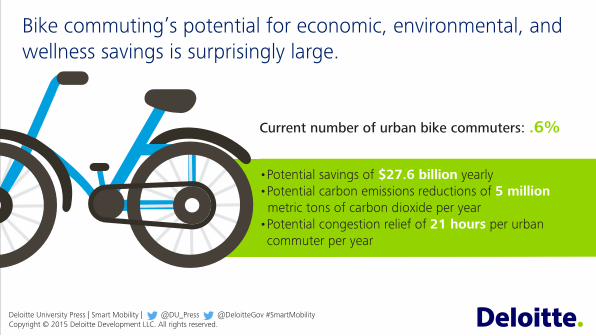
Current number of urban bike commuters: .6%
•Potential savings of $27.6 billion yearly•Potential carbon emissions reductions of 5 million metric tons of carbon dioxide per year•Potential congestion relief of 21 hours per urban commuter per year
Deloitte University Press | Smart Mobility | @DU_Press @DeloitteGov #SmartMobility Copyright © 2015 Deloitte Development LLC. All rights reserved.
Bike commuting’s potential for economic, environmental, and wellness savings is surprisingly large.
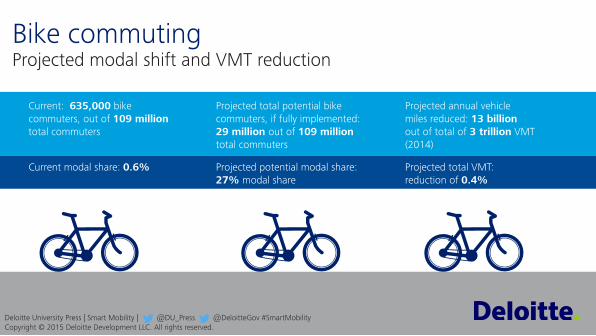
Bike commutingProjected modal shift and VMT reduction
Current: 635,000 bike commuters, out of 109 million total commuters
Current modal share: 0.6%
Projected total potential bike commuters, if fully implemented: 29 million out of 109 million total commuters
Projected potential modal share: 27% modal share
Projected annual vehicle miles reduced: 13 billion out of total of 3 trillion VMT (2014)
Projected total VMT:reduction of 0.4%
Deloitte University Press | Smart Mobility | @DU_Press @DeloitteGov #SmartMobility Copyright © 2015 Deloitte Development LLC. All rights reserved.
Copyright © 2015 Deloitte Development LLC. All rights reserved.Member of Deloitte Touche Tohmatsu Limited
Metro areaCurrent bike commuters
Potential new bike
commuters
Projected new bike
commuters total
Total annual mobility
savings ($)*
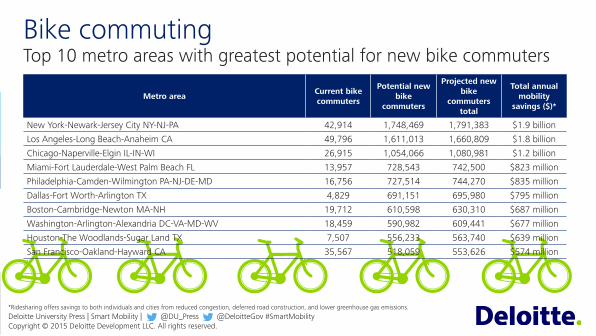
New York-Newark-Jersey City NY-NJ-PA 42,914 1,748,469 1,791,383 $1.9 billion
Los Angeles-Long Beach-Anaheim CA 49,796 1,611,013 1,660,809 $1.8 billion
Chicago-Naperville-Elgin IL-IN-WI 26,915 1,054,066 1,080,981 $1.2 billion
Miami-Fort Lauderdale-West Palm Beach FL 13,957 728,543 742,500 $823 million
Philadelphia-Camden-Wilmington PA-NJ-DE-MD 16,756 727,514 744,270 $835 million
Dallas-Fort Worth-Arlington TX 4,829 691,151 695,980 $795 million
Boston-Cambridge-Newton MA-NH 19,712 610,598 630,310 $687 million
Washington-Arlington-Alexandria DC-VA-MD-WV 18,459 590,982 609,441 $677 million
Houston-The Woodlands-Sugar Land TX 7,507 556,233 563,740 $639 million
San Francisco-Oakland-Hayward CA 35,567 518,059 553,626 $574 million
Bike commutingTop 10 metro areas with greatest potential for new bike commuters
*Ridesharing offers savings to both individuals and cities from reduced congestion, deferred road construction, and lower greenhouse gas emissions.
Deloitte University Press | Smart Mobility | @DU_Press @DeloitteGov #SmartMobility Copyright © 2015 Deloitte Development LLC. All rights reserved.
Copyright © 2015 Deloitte Development LLC. All rights reserved.Member of Deloitte Touche Tohmatsu Limited
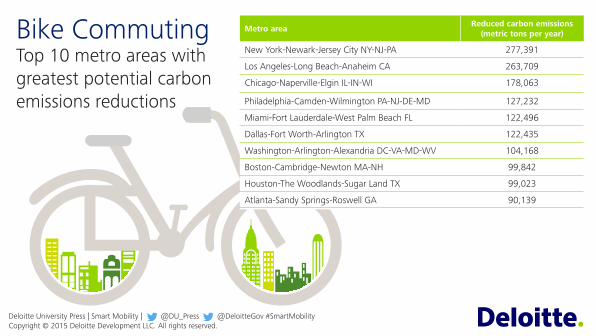
Bike CommutingTop 10 metro areas with greatest potential carbon emissions reductions
Deloitte University Press | Smart Mobility | @DU_Press @DeloitteGov #SmartMobility Copyright © 2015 Deloitte Development LLC. All rights reserved.
Metro areaReduced carbon emissions
(metric tons per year)
New York-Newark-Jersey City NY-NJ-PA 277,391
Los Angeles-Long Beach-Anaheim CA 263,709
Chicago-Naperville-Elgin IL-IN-WI 178,063
Philadelphia-Camden-Wilmington PA-NJ-DE-MD 127,232
Miami-Fort Lauderdale-West Palm Beach FL 122,496
Dallas-Fort Worth-Arlington TX 122,435
Washington-Arlington-Alexandria DC-VA-MD-WV 104,168
Boston-Cambridge-Newton MA-NH 99,842
Houston-The Woodlands-Sugar Land TX 99,023
Atlanta-Sandy Springs-Roswell GA 90,139
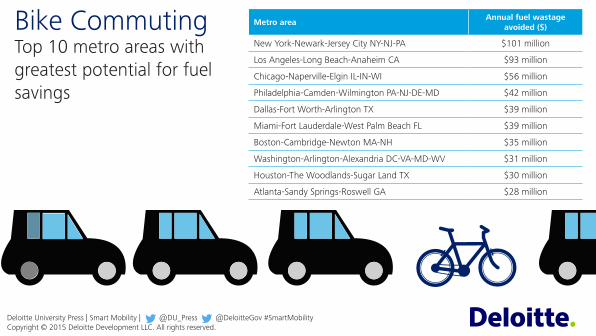
Bike CommutingTop 10 metro areas with greatest potential for fuel savings
Metro areaAnnual fuel wastage
avoided ($)
New York-Newark-Jersey City NY-NJ-PA $101 million
Los Angeles-Long Beach-Anaheim CA $93 million
Chicago-Naperville-Elgin IL-IN-WI $56 million
Philadelphia-Camden-Wilmington PA-NJ-DE-MD $42 million
Dallas-Fort Worth-Arlington TX $39 million
Miami-Fort Lauderdale-West Palm Beach FL $39 million
Boston-Cambridge-Newton MA-NH $35 million
Washington-Arlington-Alexandria DC-VA-MD-WV $31 million
Houston-The Woodlands-Sugar Land TX $30 million
Atlanta-Sandy Springs-Roswell GA $28 million
Deloitte University Press | Smart Mobility | @DU_Press @DeloitteGov #SmartMobility Copyright © 2015 Deloitte Development LLC. All rights reserved.
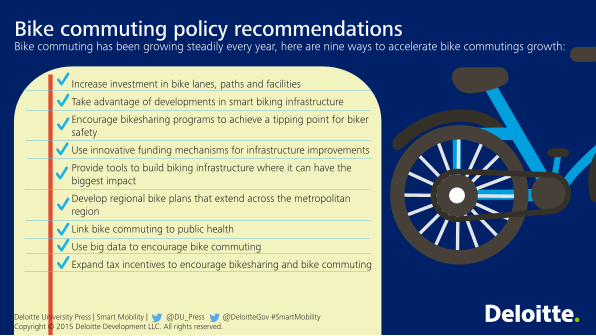
Bike commuting policy recommendationsBike commuting has been growing steadily every year, here are nine ways to accelerate bike commutings growth:
Increase investment in bike lanes, paths and facilities
Take advantage of developments in smart biking infrastructure
Encourage bikesharing programs to achieve a tipping point for biker safety
Use innovative funding mechanisms for infrastructure improvements
Provide tools to build biking infrastructure where it can have the biggest impact
Develop regional bike plans that extend across the metropolitan region
Link bike commuting to public health
Use big data to encourage bike commuting
Expand tax incentives to encourage bikesharing and bike commuting
Deloitte University Press | Smart Mobility | @DU_Press @DeloitteGov #SmartMobility Copyright © 2015 Deloitte Development LLC. All rights reserved.
*e.g. Car2Go, Enterprise CareShare, RelayRides, ZipCarDeloitte University Press | Smart Mobility | @DU_Press @DeloitteGov #SmartMobility Copyright © 2015 Deloitte Development LLC. All rights reserved.
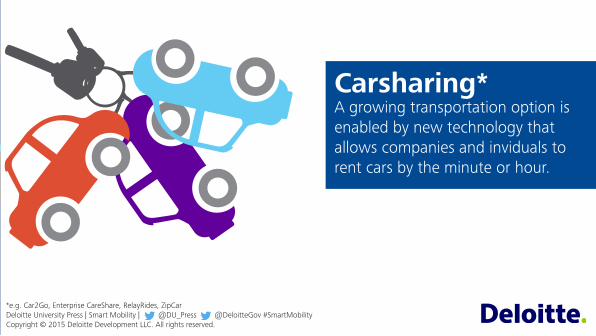
Carsharing*A growing transportation option is enabled by new technology that allows companies and inviduals to rent cars by the minute or hour.
Copyright © 2015 Deloitte Development LLC. All rights reserved.Member of Deloitte Touche Tohmatsu Limited
Carsharing
Deloitte University Press | Smart Mobility | @DU_Press @DeloitteGov #SmartMobility Copyright © 2015 Deloitte Development LLC. All rights reserved.
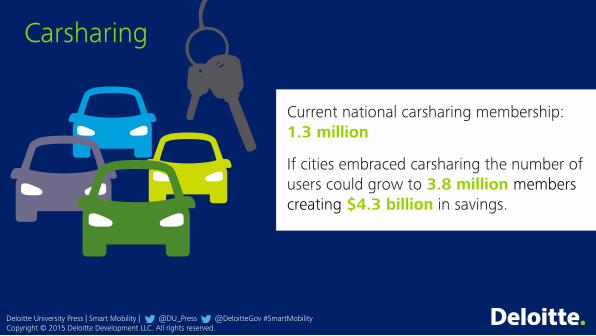
Current national carsharing membership: 1.3 million
If cities embraced carsharing the number of users could grow to 3.8 million members creating $4.3 billion in savings.
Carsharing
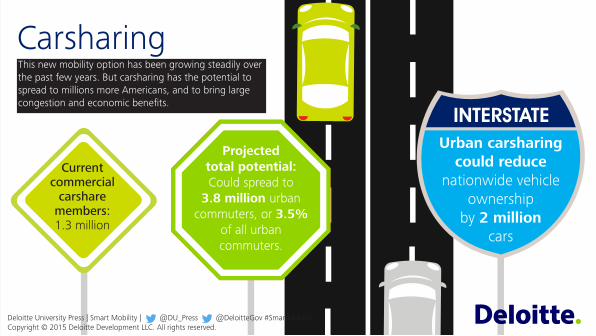
Current commercial
carshare members: 1.3 million
Projected total potential: Could spread to
3.8 million urban commuters, or 3.5%
of all urban commuters.
Urban carsharing could reduce
nationwide vehicle ownership
by 2 million cars
This new mobility option has been growing steadily over the past few years. But carsharing has the potential to spread to millions more Americans, and to bring large congestion and economic benefits.
Deloitte University Press | Smart Mobility | @DU_Press @DeloitteGov #SmartMobility Copyright © 2015 Deloitte Development LLC. All rights reserved.
Copyright © 2015 Deloitte Development LLC. All rights reserved.Member of Deloitte Touche Tohmatsu Limited Copyright © 2015 Deloitte Development LLC. All rights reserved.
Member of Deloitte Touche Tohmatsu Limited
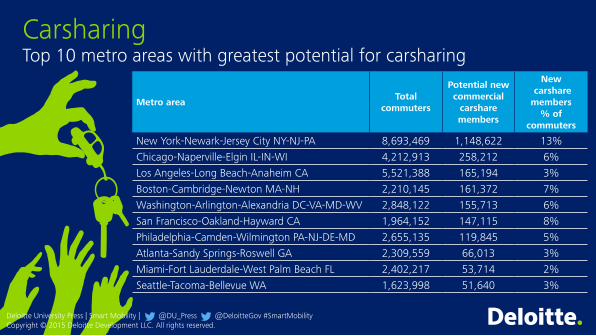
CarsharingTop 10 metro areas with greatest potential for carsharing
Metro areaTotal
commuters
Potential new commercial
carshare members
New carshare members
% of commuters
New York-Newark-Jersey City NY-NJ-PA 8,693,469 1,148,622 13%Chicago-Naperville-Elgin IL-IN-WI 4,212,913 258,212 6%Los Angeles-Long Beach-Anaheim CA 5,521,388 165,194 3%Boston-Cambridge-Newton MA-NH 2,210,145 161,372 7%Washington-Arlington-Alexandria DC-VA-MD-WV 2,848,122 155,713 6%San Francisco-Oakland-Hayward CA 1,964,152 147,115 8%Philadelphia-Camden-Wilmington PA-NJ-DE-MD 2,655,135 119,845 5%Atlanta-Sandy Springs-Roswell GA 2,309,559 66,013 3%Miami-Fort Lauderdale-West Palm Beach FL 2,402,217 53,714 2%Seattle-Tacoma-Bellevue WA 1,623,998 51,640 3%
Deloitte University Press | Smart Mobility | @DU_Press @DeloitteGov #SmartMobility Copyright © 2015 Deloitte Development LLC. All rights reserved.
Copyright © 2015 Deloitte Development LLC. All rights reserved.Member of Deloitte Touche Tohmatsu LimitedCopyright © 2015 Deloitte Development LLC. All rights reserved.
Member of Deloitte Touche Tohmatsu Limited
Metro areaTotal
commuters
Potential new commercial
carshare members
New carshare members
% of commuters
New York-Newark-Jersey City NY-NJ-PA 8,693,469 1,148,622 13%Chicago-Naperville-Elgin IL-IN-WI 4,212,913 258,212 6%Los Angeles-Long Beach-Anaheim CA 5,521,388 165,194 3%Boston-Cambridge-Newton MA-NH 2,210,145 161,372 7%Washington-Arlington-Alexandria DC-VA-MD-WV 2,848,122 155,713 6%San Francisco-Oakland-Hayward CA 1,964,152 147,115 8%Philadelphia-Camden-Wilmington PA-NJ-DE-MD 2,655,135 119,845 5%Atlanta-Sandy Springs-Roswell GA 2,309,559 66,013 3%Miami-Fort Lauderdale-West Palm Beach FL 2,402,217 53,714 2%Seattle-Tacoma-Bellevue WA 1,623,998 51,640 3%
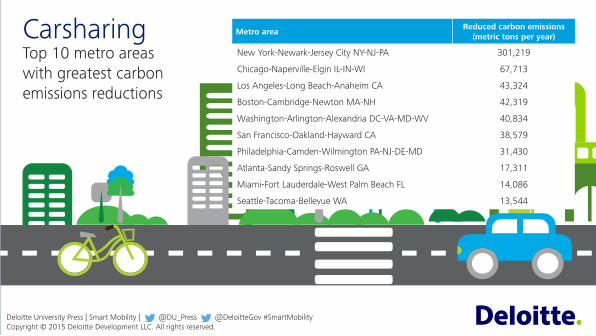
CarsharingTop 10 metro areas with greatest carbon emissions reductions
Metro areaReduced carbon emissions
(metric tons per year)
New York-Newark-Jersey City NY-NJ-PA 301,219
Chicago-Naperville-Elgin IL-IN-WI 67,713
Los Angeles-Long Beach-Anaheim CA 43,324
Boston-Cambridge-Newton MA-NH 42,319
Washington-Arlington-Alexandria DC-VA-MD-WV 40,834
San Francisco-Oakland-Hayward CA 38,579
Philadelphia-Camden-Wilmington PA-NJ-DE-MD 31,430
Atlanta-Sandy Springs-Roswell GA 17,311
Miami-Fort Lauderdale-West Palm Beach FL 14,086
Seattle-Tacoma-Bellevue WA 13,544
Deloitte University Press | Smart Mobility | @DU_Press @DeloitteGov #SmartMobility Copyright © 2015 Deloitte Development LLC. All rights reserved.
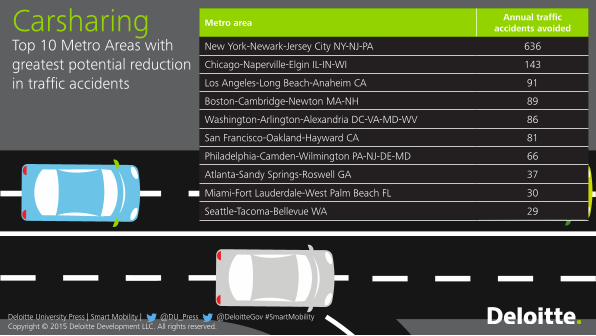
CarsharingTop 10 Metro Areas with greatest potential reduction in traffic accidents
Metro areaAnnual traffic
accidents avoided
New York-Newark-Jersey City NY-NJ-PA 636
Chicago-Naperville-Elgin IL-IN-WI 143
Los Angeles-Long Beach-Anaheim CA 91
Boston-Cambridge-Newton MA-NH 89
Washington-Arlington-Alexandria DC-VA-MD-WV 86
San Francisco-Oakland-Hayward CA 81
Philadelphia-Camden-Wilmington PA-NJ-DE-MD 66
Atlanta-Sandy Springs-Roswell GA 37
Miami-Fort Lauderdale-West Palm Beach FL 30
Seattle-Tacoma-Bellevue WA 29
Deloitte University Press | Smart Mobility | @DU_Press @DeloitteGov #SmartMobility Copyright © 2015 Deloitte Development LLC. All rights reserved.
Copyright © 2015 Deloitte Development LLC. All rights reserved.Member of Deloitte Touche Tohmatsu Limited
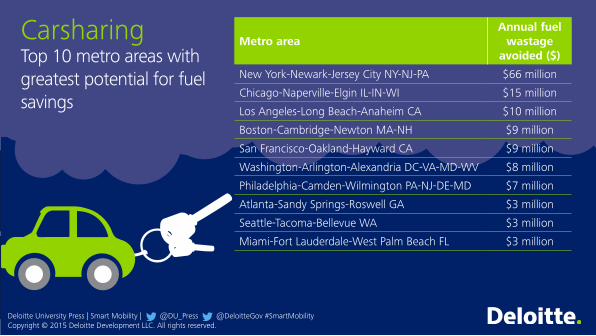
CarsharingTop 10 metro areas with greatest potential for fuel savings
Metro areaAnnual fuel
wastage avoided ($)
New York-Newark-Jersey City NY-NJ-PA $66 million
Chicago-Naperville-Elgin IL-IN-WI $15 million
Los Angeles-Long Beach-Anaheim CA $10 million
Boston-Cambridge-Newton MA-NH $9 million
San Francisco-Oakland-Hayward CA $9 million
Washington-Arlington-Alexandria DC-VA-MD-WV $8 million
Philadelphia-Camden-Wilmington PA-NJ-DE-MD $7 million
Atlanta-Sandy Springs-Roswell GA $3 million
Seattle-Tacoma-Bellevue WA $3 million
Miami-Fort Lauderdale-West Palm Beach FL $3 million
Deloitte University Press | Smart Mobility | @DU_Press @DeloitteGov #SmartMobility Copyright © 2015 Deloitte Development LLC. All rights reserved.
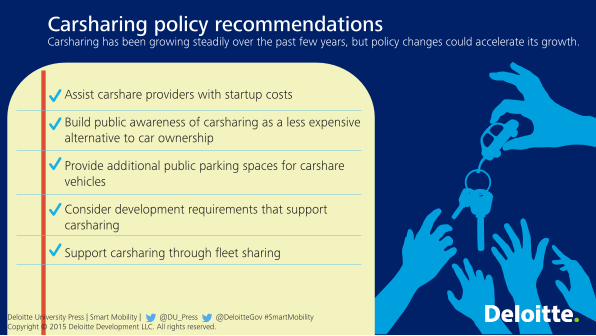
Carsharing policy recommendationsCarsharing has been growing steadily over the past few years, but policy changes could accelerate its growth.
Assist carshare providers with startup costs
Build public awareness of carsharing as a less expensive alternative to car ownership
Provide additional public parking spaces for carshare vehicles
Consider development requirements that support carsharing
Support carsharing through fleet sharing
Deloitte University Press | Smart Mobility | @DU_Press @DeloitteGov #SmartMobility Copyright © 2015 Deloitte Development LLC. All rights reserved.
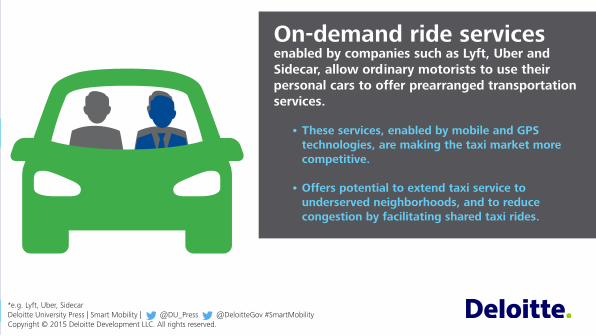
Carsharing policy recommendationsCarsharing has been growing steadily over the past few years, but policy changes could accelerate its growth. On-demand ride services
enabled by companies such as Lyft, Uber and Sidecar, allow ordinary motorists to use their personal cars to offer prearranged transportation services.
• These services, enabled by mobile and GPS technologies, are making the taxi market more competitive.
• Offers potential to extend taxi service to underserved neighborhoods, and to reduce congestion by facilitating shared taxi rides.
*e.g. Lyft, Uber, SidecarDeloitte University Press | Smart Mobility | @DU_Press @DeloitteGov #SmartMobility Copyright © 2015 Deloitte Development LLC. All rights reserved.
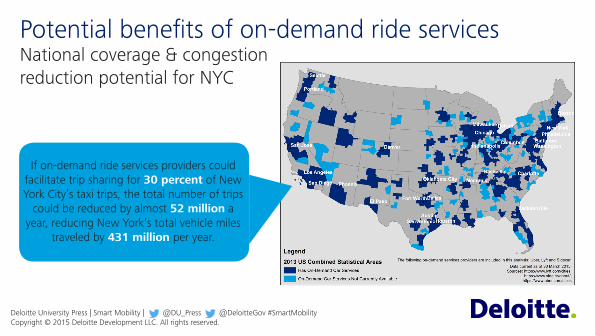
Potential benefits of on-demand ride servicesNational coverage & congestion reduction potential for NYC
If on-demand ride services providers could facilitate trip sharing for 30 percent of New York City’s taxi trips, the total number of trips
could be reduced by almost 52 million a year, reducing New York’s total vehicle miles
traveled by 431 million per year.
Deloitte University Press | Smart Mobility | @DU_Press @DeloitteGov #SmartMobility Copyright © 2015 Deloitte Development LLC. All rights reserved.
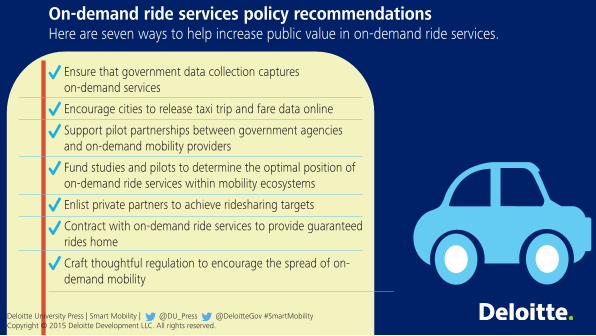
Ensure that government data collection captures on-demand services
Encourage cities to release taxi trip and fare data online
Support pilot partnerships between government agencies and on-demand mobility providers
Fund studies and pilots to determine the optimal position of on-demand ride services within mobility ecosystems
Enlist private partners to achieve ridesharing targets
Contract with on-demand ride services to provide guaranteed rides home
Craft thoughtful regulation to encourage the spread of on-demand mobility
On-demand ride services policy recommendationsHere are seven ways to help increase public value in on-demand ride services.
Deloitte University Press | Smart Mobility | @DU_Press @DeloitteGov #SmartMobility Copyright © 2015 Deloitte Development LLC. All rights reserved.
Meet the authors
Peter ViechnickiStrategic Analysis Manager and Data Scientist Deloitte Service LLP | Public Sector Research
@pveichnicki | [email protected]
Abhijit KhuperkarResearch Manager Deloitte Support Services, India Pvt. Ltd.
Tiffany Dovey FishmanSenior Manager Deloitte Service LLP | Public Sector Research
@tdoveyfishman | [email protected]
William EggersDirectorDeloitte Service LLP | Public Sector Research
@wdeggers | [email protected]
Deloitte University Press | Smart Mobility | @DU_Press @DeloitteGov #SmartMobility Copyright © 2015 Deloitte Development LLC. All rights reserved.
Follow @DU_Press and @DeloitteGov
Sign up for Deloitte University Press updates at www.dupress.com.
About Deloitte University PressDeloitte University Press publishes original articles, reports and periodicals that provide insights for businesses, the public sector and NGOs. Our goal is to draw upon research and experience from throughout our professional services organization, and that of coauthors in academia and business, to advance the conversation on a broad spectrum of topics of interest to executives and government leaders.
Deloitte University Press is an imprint of Deloitte Development LLC.
This publication contains general information only, and none of Deloitte Touche Tohmatsu Limited, its member firms, or its and their affiliates are, by means of this publication, rendering accounting, business, financial, investment, legal, tax, or other professional advice or services. This publication is not a substitute for such professional advice or services, nor should it be used as a basis for any decision or action that may affect your finances or your business. Before making any decision or taking any action that may affect your finances or your business, you should consult a qualified professional adviser.
None of Deloitte Touche Tohmatsu Limited, its member firms, or its and their respective affiliates shall be responsible for any loss whatsoever sustained by any person who relies on this publication.
About DeloitteDeloitte refers to one or more of Deloitte Touche Tohmatsu Limited, a UK private company limited by guarantee, and its network of member firms, each of which is a legally separate and independent entity. Please see www.deloitte.com/about for a detailed description of the legal structure of Deloitte Touche Tohmatsu Limited and its member firms. Please see www.deloitte.com/us/about for a detailed description of the legal structure of Deloitte LLP and its subsidiaries. Certain services may not be available to attest clients under the rules and regulations of public accounting.
Copyright © 2015 Deloitte Development LLC. All rights reserved. Member of Deloitte Touche Tohmatsu Limited