Embed Size (px)
Citation preview

Corporate Presentation
September 2016

Daimler AG
Contents
Page 2
Results for Q2 2016
Outlook for 2016
Daimler Group Strategy
Divisional information
China
Appendix
Daimler Corporate Presentation / September 2016 /

Daimler AG
Highlights of Q2 2016
Strong growth in Group unit sales 761,300 + 7 %
Highest quarterly unit sales so far at Mercedes-Benz Cars 546,500 + 9 %
EBIT adjusted for special items € 4.0bn + 6 %
World premiere of the new Mercedes-Benz E-Class station wagon
Start of production of new Mercedes-Benz C-Class Cabriolet, GLC Coupé and long-wheelbase E-Class in China
World premiere of the Mercedes-Benz Future Bus with CityPilot – a milestone on the way to autonomous driving
Successful start of car2go services in the Chinese metropolis Chongqing
Transfer of shares in Renault/Nissan strengthens pension assets by €1.8 billion
Launch of six regional sales centers for Daimler commercial vehicles completed
Page 3 Daimler Corporate Presentation / September 2016 /

Daimler AG
Key financials
Q2 2015 Q2 2016
Revenue 37.5 38.6
EBIT
as reported 3.7 3.3
adjusted for special items 3.8 4.0
Net profit 2.4 2.5
Earnings per share (in euros) 2.12 2.27
Net liquidity industrial business (2015: year-end) 18.6 17.4
Free cash flow of the industrial business (January-June) 3.4 2.1
in billions of euros
Page 4 Daimler Corporate Presentation / September 2016 /

Daimler AG
Key balance sheet and financial figures
Daimler Group Dec. 31, 2015 June 30, 2016
Equity ratio 23.6% 22.7%
Gross liquidity 18.2 22.9
Industrial business
Equity ratio 44.2% 41.2%
Net liquidity 18.6 17.4
in billions of euros
Page 5 Daimler Corporate Presentation / September 2016 /

Daimler AG
Net industrial liquidity: development in H1 2016
Free cash flow industrial business
H1 2016: €2.1bn
Net industrial
liquidity
12/31/2015
Earnings and
other cash flow
impact
Working capital
impact
Other Net industrial
liquidity
6/30/2016
+0.0
17.4 +0.2 18.6
+2.1
- in billions of euros -
Dividend payment
Daimler AG
-3.5
Page 6 Daimler Corporate Presentation / September 2016 /

Daimler AG
Unit sales
Q2 2015 Q2 2016 % change
Daimler Group 714.8 761.3 +7
of which
Mercedes-Benz Cars 500.7 546.5 +9
Daimler Trucks 125.1 108.3 -13
Mercedes-Benz Vans 81.6 99.6 +22
Daimler Buses 7.3 7.0 -5
in thousands of units
Page 7 Daimler Corporate Presentation / September 2016 /

Daimler AG
Revenue by region
Page 8
Q2 2015 Q2 2016 % change
Daimler Group 37.5 38.6 +3
of which
Western Europe 12.0 14.0 +16
of which Germany 5.5 6.2 +12
NAFTA 12.1 11.5 -5
of which United States 10.6 10.0 -6
Asia 8.5 8.4 -0
of which China* 3.8 3.9 +4
Other markets 4.9 4.7 -3
in billions of euros
* excluding revenue of not fully consolidated companies
Daimler Corporate Presentation / September 2016 /

Daimler AG
Revenue by division
Q2 2015 Q2 2016 % change
Daimler Group 37.5 38.6 +3
of which
Mercedes-Benz Cars 21.1 22.1 +5
Daimler Trucks 9.4 8.7 -8
Mercedes-Benz Vans 2.8 3.4 +22
Daimler Buses 1.0 1.1 +8
Daimler Financial Services 4.8 5.0 +5
Contract volume of Daimler Financial Services* 116.7 120.3 +3
in billions of euros
* figures as of December 31, 2015 and June 30, 2016
Page 9 Daimler Corporate Presentation / September 2016 /

Daimler AG
EBIT by division
Q2 2015 Q2 2016
- EBIT in millions of euros; RoS in % - EBIT RoS* EBIT RoS*
Daimler Group 3,718 10.0 3,258 8.3
of which
Mercedes-Benz Cars 2,227 10.5 1,410 6.4
Daimler Trucks 682 7.2 621 7.2
Mercedes-Benz Vans 234 8.3 401 11.7
Daimler Buses 57 5.5 88 7.8
Daimler Financial Services 445 – 479 –
Reconciliation 73 – 259 –
* Return on sales; Daimler Group excluding Daimler Financial Services
Page 10 Daimler Corporate Presentation / September 2016 /

Daimler AG
EBIT adjusted for special items
Q2 2015 Q2 2016
- EBIT in millions of euros; RoS in % - EBIT RoS* EBIT RoS*
Daimler Group 3,764 10.1 3,973 10.4
of which
Mercedes-Benz Cars 2,234 10.6 2,209 10.0
Daimler Trucks 717 7.6 661 7.6
Mercedes-Benz Vans 238 8.4 462 13.4
Daimler Buses 57 5.5 89 7.9
Daimler Financial Services 445 – 479 –
Reconciliation 73 – 73 –
* Return on sales; Daimler Group excluding Daimler Financial Services
Page 11 Daimler Corporate Presentation / September 2016 /

Daimler AG
Contents
Results for Q2 2016
Outlook for 2016
Daimler Group Strategy
Divisional information
China
Appendix
Page 12 Daimler Corporate Presentation / September 2016 /
Daimler AG
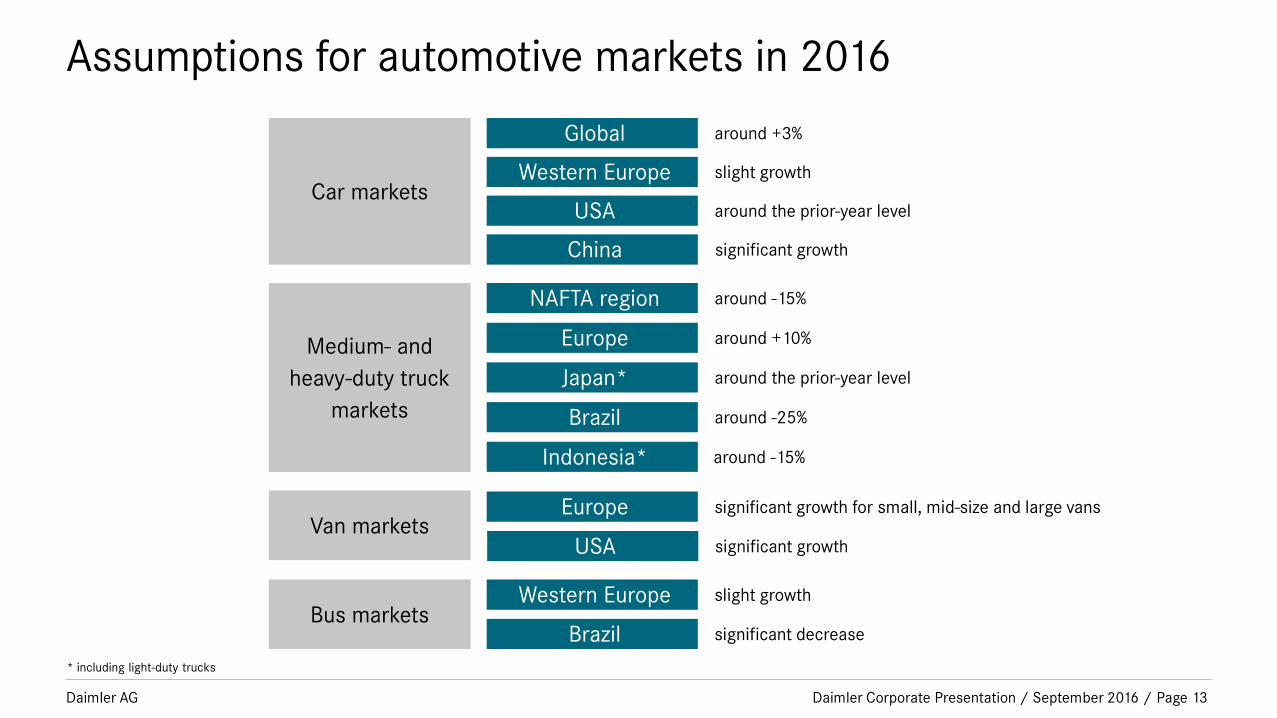
Assumptions for automotive markets in 2016
Car markets
Global
Western Europe
Medium- and
heavy-duty truck
markets
NAFTA region
Europe
Japan*
Brazil
Europe
Bus markets Western Europe
Brazil
around +3%
slight growth
around -15%
around +10%
around the prior-year level
around -25%
significant growth for small, mid-size and large vans
slight growth
significant decrease
USA around the prior-year level
Van markets
Indonesia* around -15%
China significant growth
* including light-duty trucks
USA significant growth
Page 13 Daimler Corporate Presentation / September 2016 /

Daimler AG
2016 sales outlook
Significantly higher unit sales
Strong momentum from renewed SUV portfolio and further plug-in hybrid models
Launch of all-new E-Class, C-Class Coupé, S-Class Cabriolet and smart fortwo cabrio
Unit sales significantly below the prior-year level
Worsened situation of global truck markets; weakening NAFTA market can be only
partially offset by the market development in Europe
Significantly higher unit sales
Significant growth in core market Western Europe
Continued momentum from “Mercedes-Benz Vans goes global” strategy
Unit sales slightly below the prior-year level
Maintain market leadership in core markets
Significant growth in Western Europe, significantly lower demand in Brazil
Mercedes-Benz Cars
Daimler Trucks
Mercedes-Benz Vans
Daimler Buses
Page 14 Daimler Corporate Presentation / September 2016 /

Daimler AG
2016 outlook for EBIT adjusted for special items
Slightly above the prior-year level
Significantly above the prior-year level
Slightly above the prior-year level
Significantly below the prior-year level
Slightly above the prior-year level
We expect Group EBIT for FY 2016 to increase slightly
based on the following expectations for divisional EBIT:
Mercedes-Benz Cars
Daimler Trucks
Mercedes-Benz Vans
Daimler Buses
Daimler Financial Services
Page 15 Daimler Corporate Presentation / September 2016 /

Daimler AG
Contents
Page 16
Results for Q2 2016
Outlook for 2016
Daimler Group Strategy
Divisional information
China
Appendix
Daimler Corporate Presentation / September 2016 /

Daimler AG
Clear aspiration for all our divisions
17
Daimler Buses Daimler Trucks Mercedes-Benz
Vans Daimler Financial
Services
“Most successful
premium
manufacturer”
Mercedes-Benz Cars
“No 1 in
the global truck
business”
“Best financial
and mobility
services provider”
“No 1 in the
global bus
business”
“Most successful
player in
worldwide van
business”
Page 17 Daimler Corporate Presentation / September 2016 /

Daimler AG
The four strategic focus areas of Daimler
Page 18 Daimler Corporate Presentation / September 2016 /

Daimler AG
Digitalization puts the focus on the customer
Digital target picture Daimler
1) Industry 4.0
„Shaping the future of safe and sustainable mobility“
We are among the leaders in our industry regarding digital work
environment and culture. Our customers perceive us as the most innovative
digital automotive manufacturer.
Vision
Mission statement
DigitalLife@Daimler
Success factors
Indirect customer perception
Direct customer perception
Key digital
levers
Products & Services
Processes and Structures Management system Digital skills & Corporate culture
Digitalization of the value chain1)
Page 19 Daimler Corporate Presentation / September 2016 /

Daimler AG
Profit targets
Return on sales-target for the automotive business : 9 percent
9 6 17 10
Mercedes-Benz
Cars
8 Daimler
Trucks
Mercedes-Benz
Vans
Daimler
Buses
Daimler
Financial Services
Profit targets [Return on Sales / Return on Equity1) in %]
Page 20
1) Daimler Financial Services
Daimler Corporate Presentation / September 2016 /

Daimler AG
Contents
Page 21
Results for Q2 2016
Outlook for 2016
Daimler Group Strategy
Divisional information
China
Appendix
Daimler Corporate Presentation / September 2016 /
Daimler AG Page 22
Mercedes-Benz Cars
Daimler Corporate Presentation / September 2016 /

Daimler AG
Mercedes-Benz Cars: product highlights
Mercedes-Benz Concept IAA New Mercedes-Benz S-Class Cabriolet
New smart cabrio New Mercedes-Benz GLC Coupé New Mercedes-Benz E-Class station wagon
New Mercedes-AMG GT R New Mercedes-Benz C-Class Cabriolet
Page 23 Daimler Corporate Presentation / September 2016 /

Daimler AG
Mercedes-Benz Cars and Vans: continued product offensive
S-Class Cabriolet
SLC facelift SL facelift
CLA facelift
E-Class station wagon
smart cabrio
GLS facelift E-Class sedan
C-Class Cabriolet
GLC Coupé
E-Class (long wheelbase)
smart fortwo EV
GT R Coupé
E-Class All Terrain
E-Class Coupé
GLA facelift
GT C Roadster
S-Class facelift
E-Class Cabriolet
GT C Coupé
Pickup
2016 2017
V-Class China
smart cabrio EV
smart forfour EV
Vito China
Page 24 Daimler Corporate Presentation / September 2016 /

Daimler AG
Product offensive to fuel our sales offensive
2015 1992 2025
Current Product
offensive
Mercedes-Benz sales development
First product
offensive
530 k
1.63 m
Schematic
representation
Current Product
offensive
First product
offensive
Page 25 Daimler Corporate Presentation / September 2016 /

Daimler AG
smart: Summer in the city
Page 26 Daimler Corporate Presentation / September 2016 /

Daimler AG
We are on our way to emission-free driving
Example: MBC fleet consumption in Europe
230
220
210
200
190
180
170
160
150
140
2009
173
2008
183
0 2007
158
1995
120
2011 2010
130
160
CO
2-e
mis
sio
ns
(g/
km
)
9.2 l 7.3 l 6.9 l 6.3 l 6.4 l
150
6.0 l
2012
123
Actual
2015
100
110
140
5.6 l
230
-44%
until 2020
95
<4.0 l
EU Legislation
2013
134
5.4 l
-6g
129
5.2 l
2014
125
Target
2016
Page 27
5.0 l
Daimler Corporate Presentation / September 2016 /

Daimler AG
Our roadmap for sustainable mobility
28
Mercedes-AMG GT S: Fuel consumption urban/extra-urban/combined: 12,5-12,2/7,9-7,8/9,6-9,4 l/100 km,
CO2 emissions combined: 224-219 g/km. High-tech
combustion engines
Plug-in
hybrids
Electric vehicles
with battery or fuel-cell
Page 28 Daimler Corporate Presentation / September 2016 /

Daimler AG Page 29
24% friction reduction
11% faster acceleration
13% CO₂ reduction
-80% NOx emissions
17% weight reduction
18 kW more power
The new diesel engine OM654 …
… the first member of a complete new engine family
Daimler Corporate Presentation / September 2016 /

Daimler AG Page 30
2015 2014
2016 2017
C-Class Estate
S-Class
GLE
C-Class
E-Class
GLC
C-Class LWB
Introduction of 10 Plug-in Hybrid vehicles by 2017
Our Plug-In Hybrid Rollout is at full speed
Daimler Corporate Presentation / September 2016 /

Daimler AG Page 31
< 50 g/km CO2-Emissions
> 30 km electric operating range
Market introduction in 09/2016
Plug-In Hybrid Rollout - The upcoming E 350 e
Daimler Corporate Presentation / September 2016 /

Daimler AG
Autonomous driving goes far beyond technology
Page 32 Daimler Corporate Presentation / September 2016 /

Daimler AG
Beltbag
PRE-SAFE®
Impulse Side
Active Blind Spot Assist
Active Lane Keeping Assist
Evasive Steering Assist MULTIBEAM LED Headlights with Adaptive High Beam Assist
Remote
Park-Pilot
Active Braking Assist with Pedestrian Detection, Cross-Traffic
Function and Congestion Emergency Braking
Function
DRIVE PILOT with Distance Pilot DISTRONIC, Steering
Pilot, Active Lane Change Assist,
Active Emergency Stop Assist,
Speed Limit Pilot PRE-SAFE®
Page 33
Car-to-X-Communication PRE-SAFE® PLUS
The new E-Class takes autonomous and accident-free driving
to the next level
Daimler Corporate Presentation / September 2016 /

Daimler AG Daimler Corporate Presentation / September 2016 / Page 34
Development steps towards fully autonomous driving
Singe control functions
such as speed selection,
braking or lane keeping
are automated.
Driver in charge.
Level 1 Driver
Assistance
Vehicle can perform the
dynamic driving task in
certain modes.
Driver expected to
respond to requests to
take control.
Vehicle can perform
the dynamic driving
task in all modes that
can also be managed
by a human driver.
No driver needed.
Vehicle can perform
the dynamic driving
task in certain
modes.
Driver not expected to
respond to requests to
take control.
Autonomous Driving
Level 2 Partial
Automation
Level 3 ConditionalAutomation
Level 4 High
Automation
Level 5 Full
Automation
+ enabler for new & complementary mobility services
More than one control
function is automated.
Driver expected to take
care of all remaining
aspects of the dynamic
driving task.
- Currently offered by MB
& legally permissible -

Daimler AG
Connectivity as ‘enabling technology’ is the core of…
EVs
Charging Station Search
Range on Map
Remote Services
Examples
Safety
Live Traffic Information
Car-2-X Warnings
Emergency Call
Examples
Autonomous
Driving
Car-2-Car Communication
Intelligent Parking Assist
Smart Routing
Examples
Infotainment
Navigation
Radio/ Media
Internet/ Apps
Examples
Page 35 Daimler Corporate Presentation / September 2016 /

Daimler AG
We want to become digital champion of the automotive industry
with the help of Mercedes me and the Mercedes-Benz Store
Digital Car Key Online Service
Appointment
Integration
Mobility Offers
in Mercedes me (App)
Contract- & Document
Management
Remote
Park Pilot
Lifestyle
Configurator
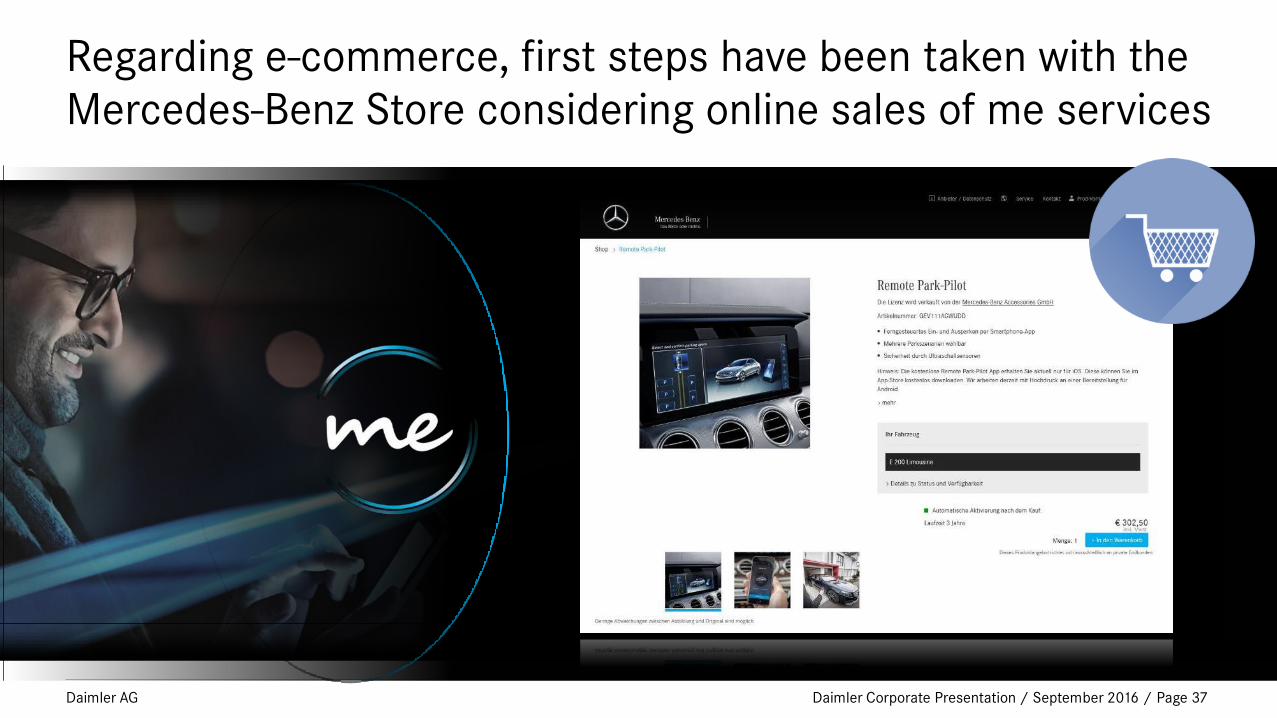
• Launch of the Mercedes-Benz Store for all Mercedes me connect markets
• Customer can purchase services directly online
(Starting with Remote Park Pilot)
Page 36 Daimler Corporate Presentation / September 2016 /
Daimler AG
Regarding e-commerce, first steps have been taken with the
Mercedes-Benz Store considering online sales of me services
Page 37 Daimler Corporate Presentation / September 2016 /

Daimler AG
But Mercedes me is more than just digital...
...it’s an innovative sales approach
Page 38
Opening of the world-wide 6th
Mercedes me store in Beijing.
Daimler Corporate Presentation / September 2016 /

Daimler AG
Fit for Leadership was designed as long-term profit
optimization of „MB 2020“-strategy. „Next Stage“ will focus
on structural improvement
Page 39
2020 2013 2015 2016 2012 2014
Growth Strategy MB 2020 „Fit For Leadership“
Optimized business
structures Measurement
implementation for cost
improvement
2 bn. €
until 2014
Fit for Leadership
Next Stage
„Fire Fighting“ „Fire Prevention“
Daimler Corporate Presentation / September 2016 /

Daimler AG
Our target: No.1 premium car manufacturer
Sales target In thousand units
Profitability target Return on Sales in %
on a sustainable basis
2,001
2015
significantly
higher
than 2015
2016
No. 1
2020
Page 40 Daimler Corporate Presentation / September 2016 /
Daimler AG
Daimler Trucks
Page 41 Daimler Corporate Presentation / September 2016 /

Daimler AG
Broadest and strongest truck portfolio in our history
Page 42 Daimler Corporate Presentation / September 2016 /
Daimler AG
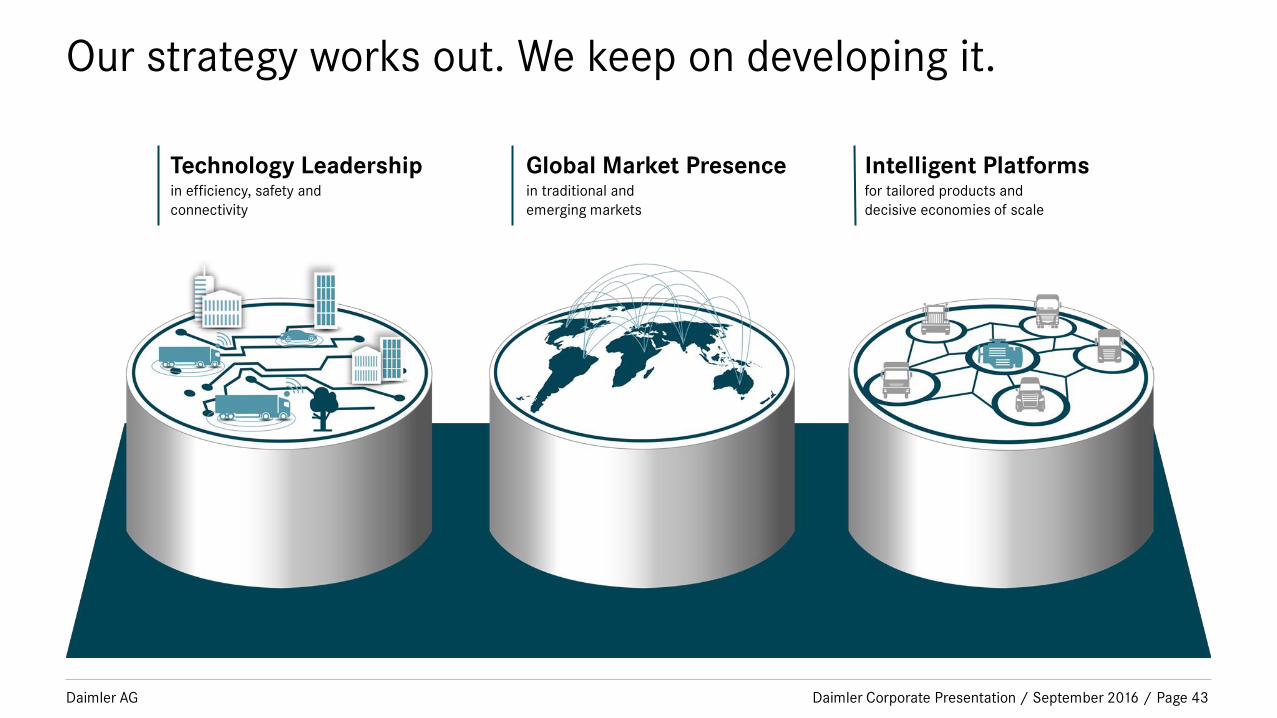
Our strategy works out. We keep on developing it.
Technology Leadership in efficiency, safety and
connectivity
Global Market Presence in traditional and
emerging markets
Intelligent Platforms for tailored products and
decisive economies of scale
Page 43 Daimler Corporate Presentation / September 2016 /

Daimler AG
Efficiency: the most efficient trucks are Daimler Trucks
~13% ~7% ~5%
Mercedes-Benz Actros Freightliner Cascadia Evolution Fuso Super Great V
less fuel than previous model less fuel than previous model
less fuel than previous model
Page 44 Daimler Corporate Presentation / September 2016 /

Daimler AG
Efficiency: we are pioneering alternative drivetrains
Page 45
2000 2002 2006 2010 2014 2015 2016 1970
Unimog
E-Drive
Introduction
Canter Eco
Hybrid Portugal
Hybrid
Technology
Center
FUSO Canter
E-Cell@IAA
Atego with hybrid
drivetrain
2nd Generation
Canter E-Cell Stuttgart
Fleet test
Daimler Corporate Presentation / September 2016 /

Daimler AG
Our EBIT drivers: Push captive component strategy to
strengthen undisputed market leadership in NAFTA
Page 46
Penetration rate integrated powertrain US/CAN in % Built and scheduled
Heavy Duty Engines
HDEP
Automated Manual Transmission
DT12
86.0 94.0
As of June 2016 Year End 2015
39.0
65.0
As of June 2016 Year End 2015
Daimler Corporate Presentation / September 2016 /

Daimler AG
2001
Electronic Stability Program (ESP)
1981 Anti-lock Braking System
(ABS)
2006 Active Break Assist (ABA)
Safety: many firsts on our record
Page 47 Daimler Corporate Presentation / September 2016 /

Daimler AG
Safety: new Blind Spot Monitor improves active safety further
Page 48 Daimler Corporate Presentation / September 2016 /

Daimler AG
We are pioneering autonomous driving
Page 49
2016 2015 2014
Highway Pilot Connect world premiere of platooning
Inspiration Truck premiere on US highway
Highway Pilot test licence for German autobahn
Future Truck world premiere
Daimler Corporate Presentation / September 2016 /

Daimler AG
• Less fuel: ~7% savings/entire platoon
• More safety: shorter reaction time
(< 0,1 sec. vs. 1.4 sec. driver)
• Less space: 3 trucks span 80m vs. 150m
We will lead in connectivity like we do in autonomous driving
Page 50 Daimler Corporate Presentation / September 2016 /
Daimler AG
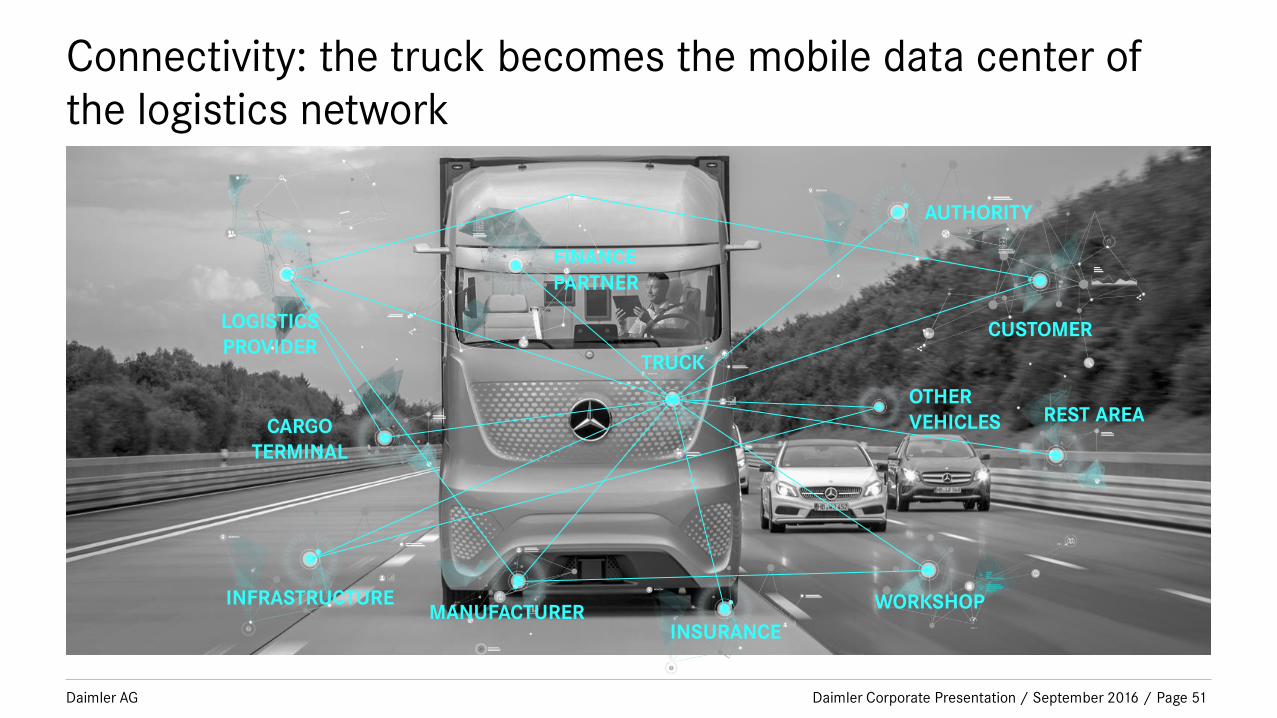
TRUCK
FINANCE
PARTNER
LOGISTICS
PROVIDER
CARGO
TERMINAL
MANUFACTURER WORKSHOP
AUTHORITY
OTHER
VEHICLES REST AREA
INSURANCE
CUSTOMER
INFRASTRUCTURE
Connectivity: the truck becomes the mobile data center of
the logistics network
Page 51 Daimler Corporate Presentation / September 2016 /

Daimler AG
NO MORE
TRAFFIC JAMS
Real-time data from
infrastructure & vehicles
NO MORE
EMPTY RUNS
Ride sharing
platforms for cargo
NO MORE WAITING TIME
All information
transmitted digitally
in advance (e.g. toll)
NO MORE OVERBOOKED
REST AREAS
Connected truck makes
reservation in time
Connectivity: with its real-time information, the connected
truck solves major logistics inefficiencies
Page 52 Daimler Corporate Presentation / September 2016 /

Daimler AG
With our new Regional Centers, we push sales and after
sales in emerging markets
Latin
America
Middle East/
Northern Africa
Central
Africa
Southern
Africa
Southern
Asia
Southeast
Asia
Page 53 Daimler Corporate Presentation / September 2016 /
Daimler AG
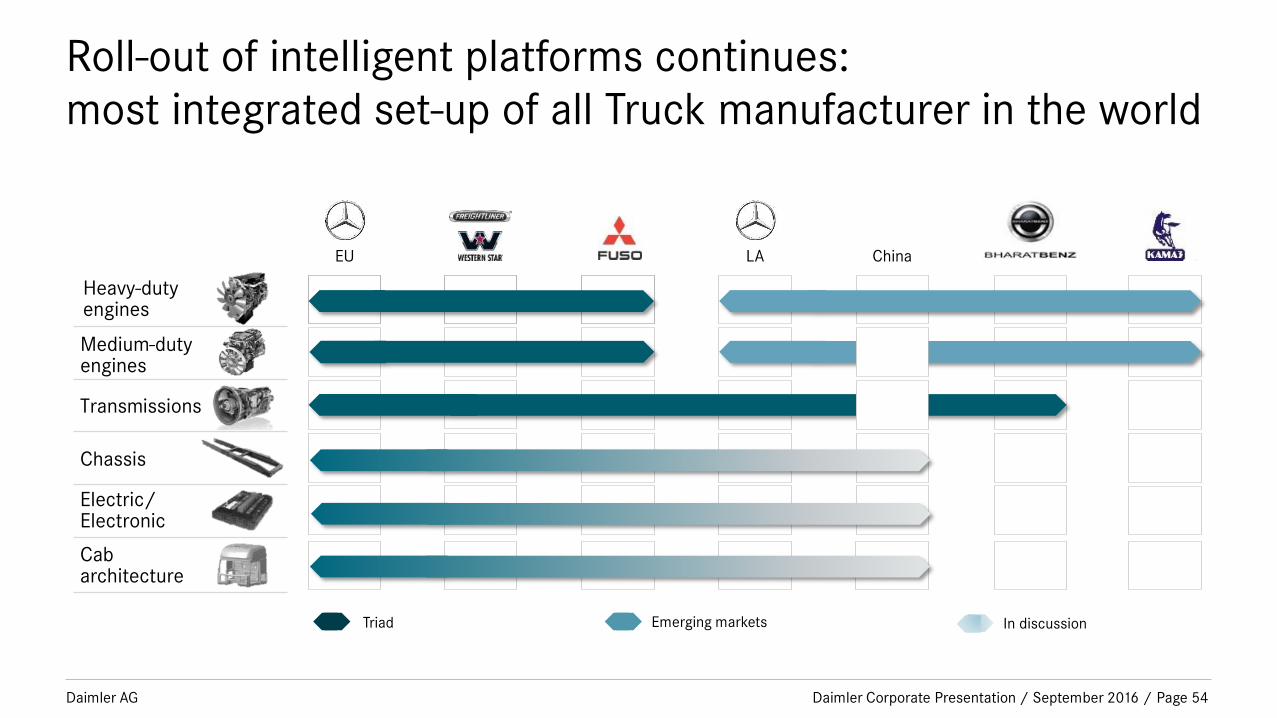
Roll-out of intelligent platforms continues:
most integrated set-up of all Truck manufacturer in the world
Page 54
Transmissions
Electric/ Electronic
Chassis
Medium-duty engines
Heavy-duty engines
EU LA
Cab architecture
Triad Emerging markets
China
In discussion
Daimler Corporate Presentation / September 2016 /

Daimler AG
Global Platform Roll-out will secure pass-car-like volumes in
next decade for Daimler Trucks
Page 55
Today 2025 2020
Chassis Electrics/Electronics
Today 2020 2025 Today 2020 2025
Europe
Brazil
Russia
China Europe
NAFTA
Brazil
China
Europe
Brazil
China Japan NAFTA
Cabin
Daimler Corporate Presentation / September 2016 /

Daimler AG
Sticking to our target: undisputed leader in the truck industry
Sales target In thousand units
496
2014
>500
2015
~700
2020
Profitability target Return on Sales in %
over the cycle
Page 56 Daimler Corporate Presentation / September 2016 /

Daimler AG Page 57
Daimler Financial Services
Daimler Corporate Presentation / September 2016 /
Daimler AG
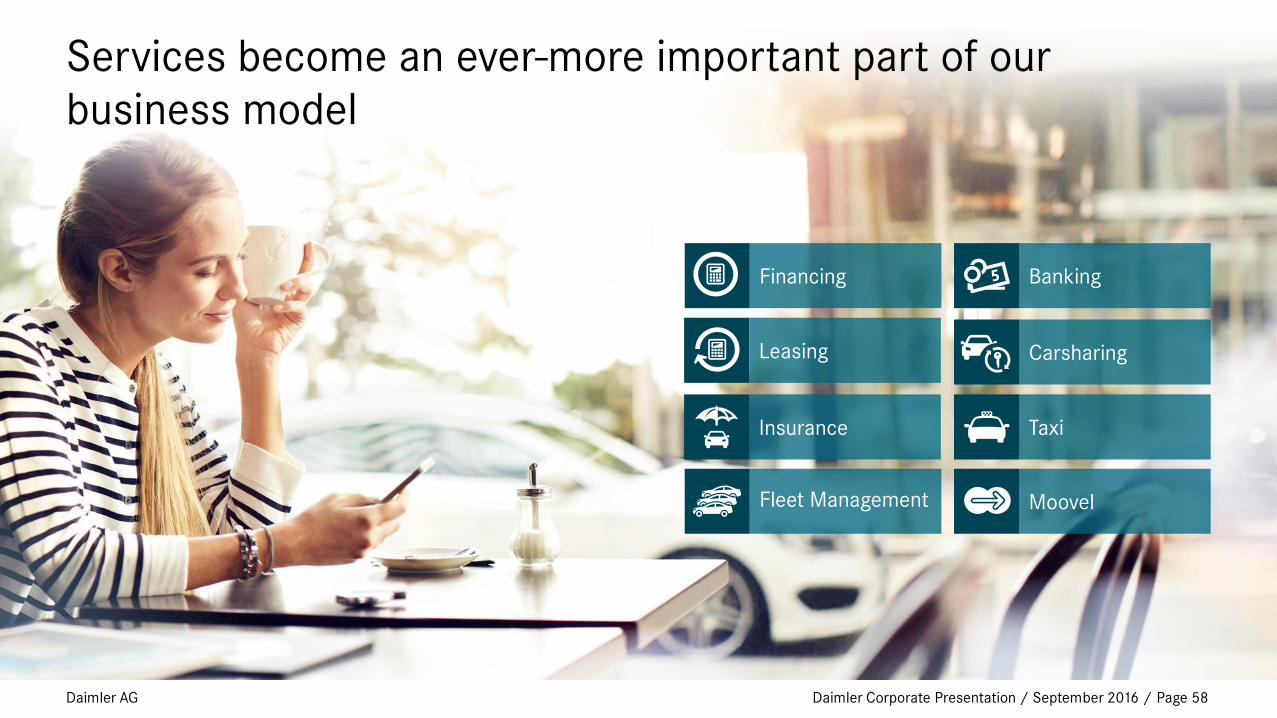
Banking
Fleet Management Moovel
Taxi
Financing
Leasing
Insurance
Carsharing
Services become an ever-more important part of our
business model
Page 58 Daimler Corporate Presentation / September 2016 /

Daimler AG Page 59
Supporting all Daimler brands
Daimler Corporate Presentation / September 2016 /
Daimler AG
We finance every second vehicle sold by Daimler
We finance every second vehicle sold by Daimler
Page 60 Daimler AG Daimler Corporate Presentation / September 2016 /

Daimler AG
Strong business growth
Page 61
Strong business growth
59
2007
63
2008
58
2009 64
2010 72
2011 80
2012
84
2013
99
2014
Contract volume (€ billion)
117
2015
28 2007
30 2008 25
2009
29 2010
34 2011
38 2012
41 2013
48 2014
New acquisitions (€ billion)
58 2015
Daimler Corporate Presentation / September 2016 /
Daimler AG
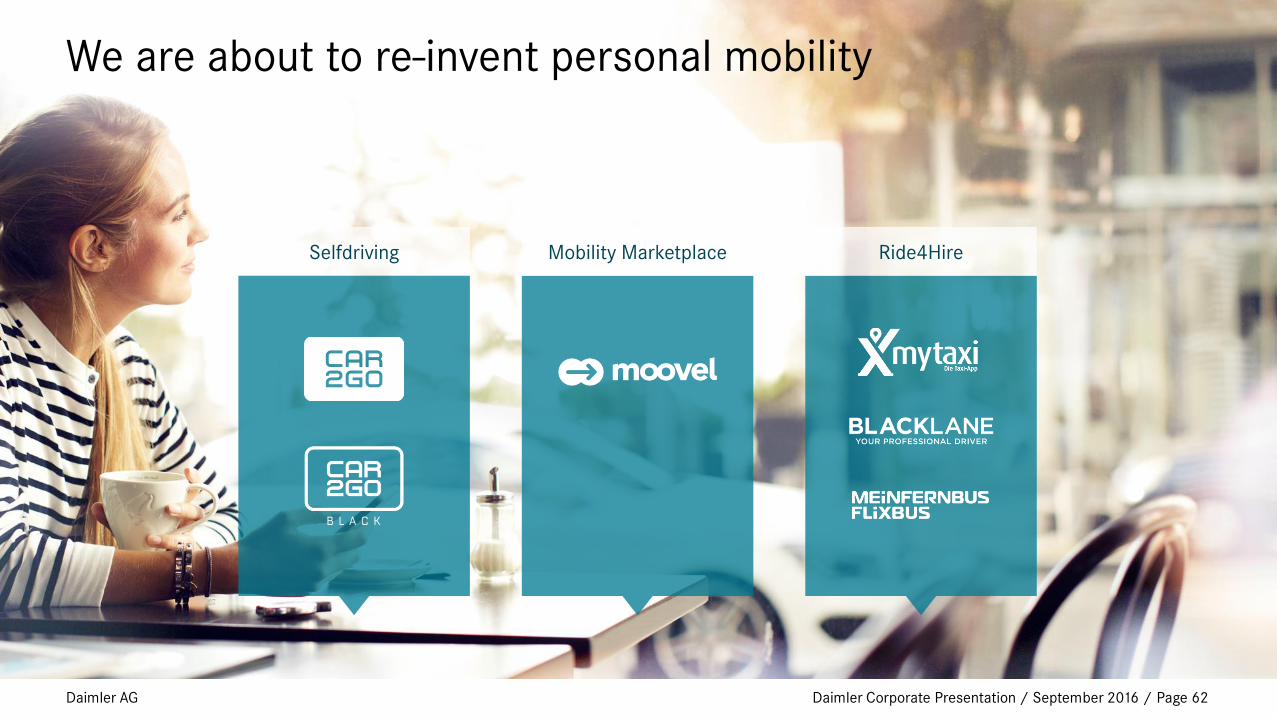
We are about to re-invent personal mobility
Selfdriving Mobility Marketplace Ride4Hire
Page 62 Daimler Corporate Presentation / September 2016 /
Daimler AG
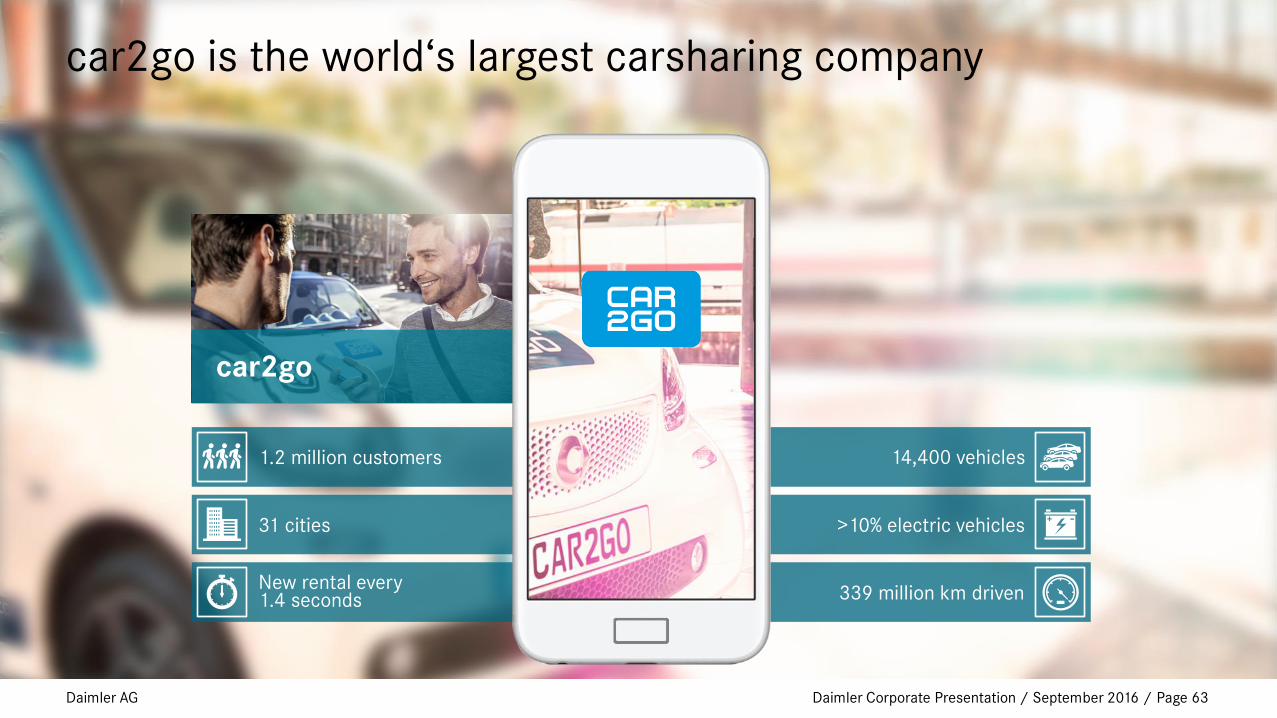
1.2 million customers
31 cities
New rental every 1.4 seconds
14,400 vehicles
>10% electric vehicles
339 million km driven
car2go
car2go is the world‘s largest carsharing company
Page 63 Daimler Corporate Presentation / September 2016 /

Daimler AG
Public transport
Carsharing
Railway
Taxi
Bikesharing
moovel
moovel – find, book and pay
Page 64 Daimler Corporate Presentation / September 2016 /

Daimler AG
3-4 minutes until arrival
40 cities
45,000 registered drivers
Number of tours tripled
> 10 million downloads
mytaxi
mytaxi – the world‘s first taxi app
Page 65 Daimler Corporate Presentation / September 2016 /
Daimler AG
Contents
Page 66
Results for Q1 2016
Outlook for 2016
Daimler Group Strategy
Divisional information
China
Appendix
Daimler Corporate Presentation / September 2016 /

Daimler AG
China
China Market
Development
Daimler in China
China Market
Development Daimler Corporate Presentation / September 2016 / Page 67
Daimler AG
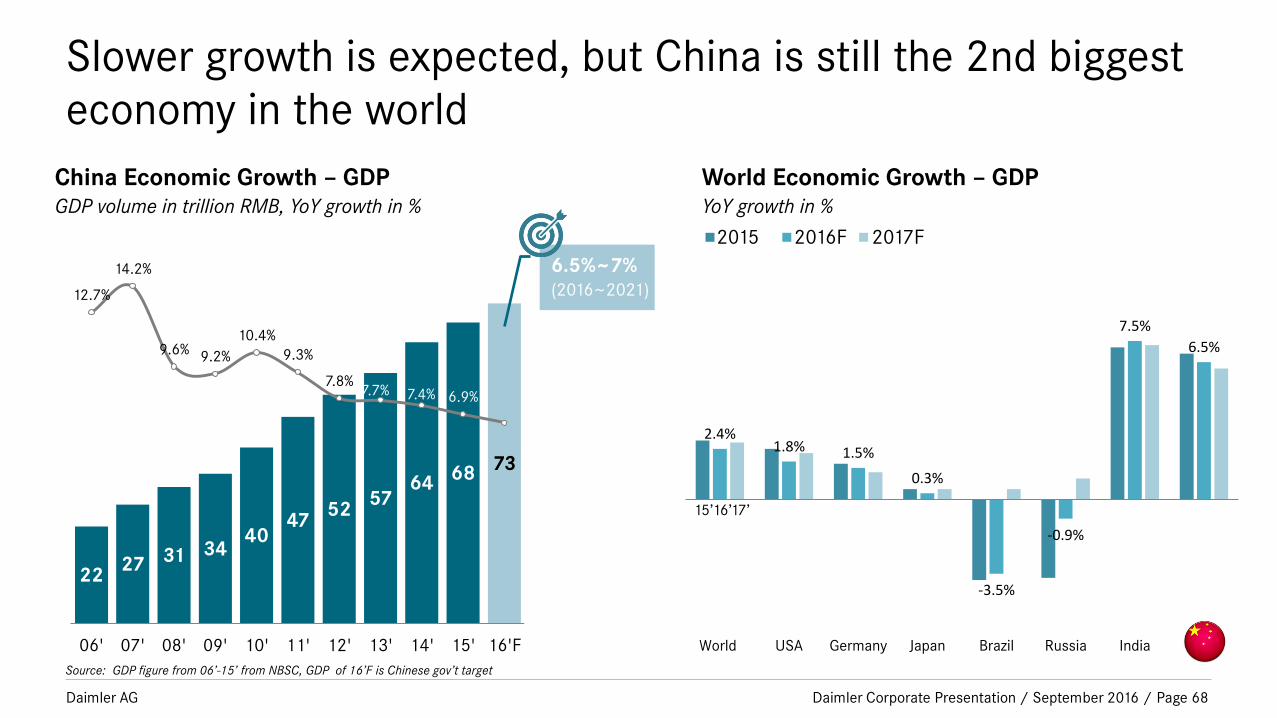
Slower growth is expected, but China is still the 2nd biggest
economy in the world
China Economic Growth – GDP GDP volume in trillion RMB, YoY growth in %
Source: GDP figure from 06’-15’ from NBSC, GDP of 16’F is Chinese gov’t target
22 27 31 34
40 47
52 57
64 68
73
12.7%
14.2%
9.6% 9.2%
10.4%
9.3%
7.8% 7.7% 7.4% 6.9%
06' 07' 08' 09' 10' 11' 12' 13' 14' 15' 16'F
6.5%~7%
(2016~2021)
2.4% 1.8% 1.5%
0.3%
-3.5%
-0.9%
7.5%
6.5%
World USA Germany Japan Brazil Russia India China
16’ 17’ 15’
World Economic Growth – GDP YoY growth in %
2015 2016F 2017F
Daimler Corporate Presentation / September 2016 / Page 68

Daimler AG
Sales of the China auto market reached over 25 million units
in 2015.
Page 69
2014
Sales Volume
2015
Sales Volume
2015
YoY Growth
Volume in thousand units
Total Market
PV
Truck
Van
Bus
thereof HDT
Sales of the China auto market reached over 25 million units
in 2015. Growth continues in 2016
Note: Segment definition according to Daimler internal division. 2014 & 2015 figures are actual domestic wholesales, with import and w/o export. 2016 figure is preliminary, which is domestic wholesale plus export
and w/o import. Source: China Automotive Industry Newsletter (CAAM) , MoC and Customs of PRC
23,819 25,004 5%
18,091 19,702 9%
2,290 2,016 -12%
655 460 -30%
3,168 3,017 -5%
270 269 0%
YTD July 2016
Sales Volume
YTD July 2016
YoY Growth
14,687 10.1%
11,490 14.1%
1,341 2.6%
390 17.2%
1,705 -6.0%
151 0.7%
Daimler Corporate Presentation / September 2016 /

Daimler AG
The fundamentals remain unchanged
814
594
580
320
199
121
24
US
Japan
German
Russia
Brazil
India
Low Car Density
Light Vehicle per1,000 people
(in units in I2015,IHS Report)
Urbanization
43% End of 2005
55.9% End of 2015
60.0% End of 2020
13 cities
Population > 10 million
101cities
Population > 5 million
274cities
Population > 1 million
By the end of 2014
Regional Potentials
Note: New Car Registration YoY Growth rate 2015
10%< YoY Growth Rate <20%
YoY Growth Rate >20%
YoY Growth Rate <10%
Source: NBSC,
Calculation by MI
Daimler Corporate Presentation / September 2016 / Page 70

Daimler AG
China
Daimler in China
China Market
Development Daimler Corporate Presentation / September 2016 / Page 71

Daimler AG
Daimler in China
Beijing
Fuzhou
Shenzhen
Trucks & Buses
Production & Distribution
Mercedes-Benz Vans
Production & Distribution
NEV Development
Production & Distribution
Mercedes-Benz Cars
Distribution
Auto Finance
R&D
Production
Daimler Corporate Presentation / September 2016 / Page 72

Daimler AG
Auman
Daimler Corporate Presentation / September 2016 / Page 73

Daimler AG
The China HDT market saw significant decrease in recent
years
China HDT Domestic Market Development Volume in thousand units
Registration figure, Source: CAAM , MoC and Customs of PRC.
Daimler Corporate Presentation / September 2016 / Page 74

Daimler AG
Auman HDT Domestic Wholesale
2012 ~ YTD 1st half 2016 Volume in thousand units
+21%
YoY
growth
Source: BFDA
Daimler Corporate Presentation / September 2016 / Page 75

Daimler AG
Market Forecast by 2023 MD/HD truck market
Daimler Corporate Presentation / September 2016 / Page 76

Daimler AG
OM457 engines production preparation in 2016
Production of China-made OM457
OM457 Engine Plant at Beijing
Daimler Corporate Presentation / September 2016 / Page 77

Daimler AG
Mercedes-Benz Truck
Daimler Corporate Presentation / September 2016 / Page 78

Daimler AG
China HDT WEU Import Segment Development
2010-2015
Despite the import segment shrank even further, MB Truck
still remains No.1 European importer.
WEU brand
SoM 2015
Firefighting
Oilfield
Logistics
Concrete Pump
Typical application of MB Truck
2010 2015 2011 2012 2013 2014
Note: Registration figure, excl. firefighting
3000
6300
Competitor 1
Competitor 2 Competitor 3
Daimler Corporate Presentation / September 2016 / Page 79

Daimler AG
Mercedes-Benz Vans
Page 80 Daimler Corporate Presentation / September 2016 /

Daimler AG Page 81
Vans sales in China
Source: FBAC
2012 2013 2014 2015 2016F
Mercedes-Benz Vans Retail Development in China
Daimler Corporate Presentation / September 2016 /

Daimler AG
The locally produced V-Class and Vito were introduced to the
China market this year
All new V-Class Launched in March
All new Vito Launched in September
Daimler Corporate Presentation / September 2016 / Page 82

Daimler AG
2012 2013 2014 2015 2016F
Mercedes-Benz Vans Retail Development in China
Page 83
Successful V-Class ramp-up
YTD July
2016:
59% YoY
increase
+46% YTD 2016
1st half
Source: FBAC
Daimler Corporate Presentation / September 2016 /

Daimler AG
DENZA
Page 84 Daimler Corporate Presentation / September 2016 /

Daimler AG
With 331K units sold, China became the world’s No.1 NEV
market in 2015
CV
PV
PHEV
PV
BEV
Source: China Automotive Industry Newsletter (CAAM)
2011-2015 NEV Sales Development
Wholesale Volume in thousand units
Page 85 Daimler Corporate Presentation / September 2016 /

Daimler AG
Most of the top selling models have an e-range < 250km &
MSRP < 250k RMB
E-Range (KM)
MSRP
14.1
3.7
29.7 18.2
10.7
8.1
3.0
16.5
15.5
10.5
17.6 10.5
model a
Source: Volume from China Automotive Industry Newsletter (CAAM); product feature from internet research
2015 NEV Sales by model
Bubble size refers to sales volume in thousand units PHEV BEV Micro BEV
Page 86
RMB 100K RMB 200K RMB 300K RMB 700K RMB 400K
model b model c
model d
model e
model f
model g
model h
model i
model j
model s
DENZA
Daimler Corporate Presentation / September 2016 /

Daimler AG
DENZA: the safest, most reliable, and most convenient
electric vehicle
Up to 300 kilometers
driving range
Over 1.2 million
kilometers testing C-NCAP 5 Stars
Daimler Corporate Presentation / September 2016 / Page 87

Daimler AG
Upgrading e-range to 400km to enhance competitiveness
Daimler Corporate Presentation / September 2016 / Page 88
Daimler AG
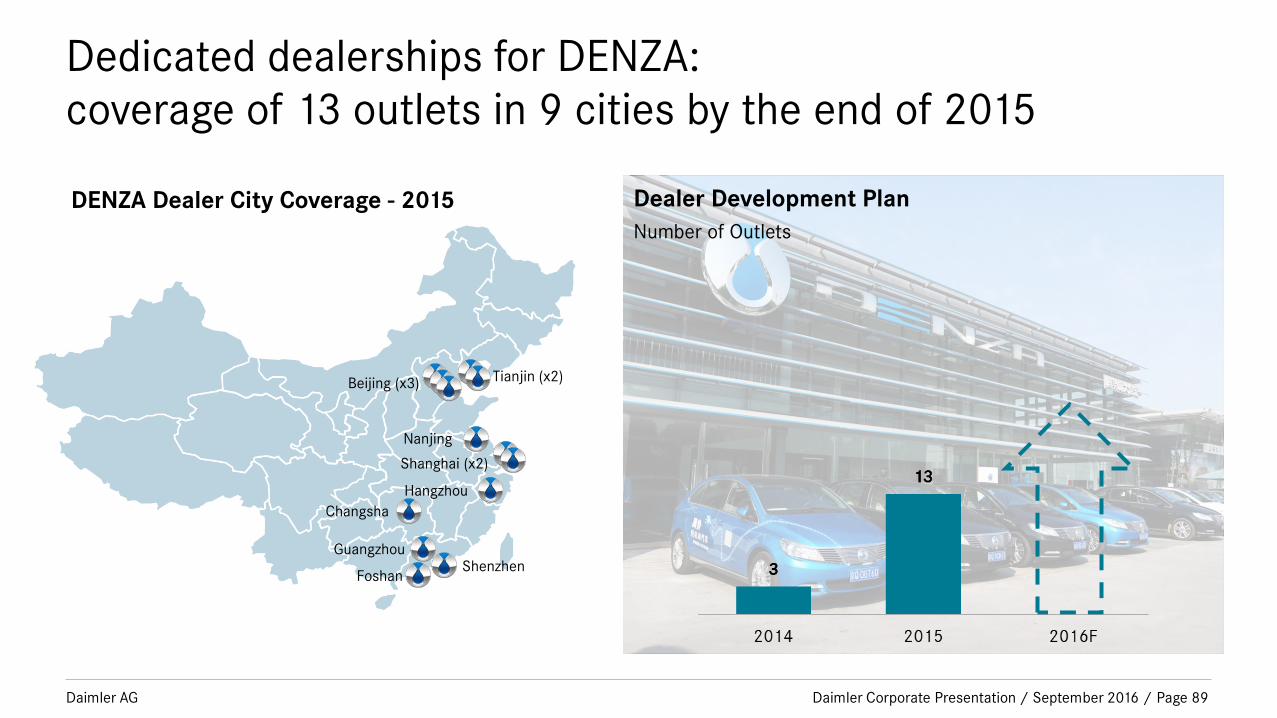
Dedicated dealerships for DENZA:
coverage of 13 outlets in 9 cities by the end of 2015
Beijing (x3)
Shanghai (x2)
Tianjin (x2)
Shenzhen
Nanjing
Hangzhou
Changsha
Foshan
Guangzhou
Dealer Development Plan
Number of Outlets
DENZA Dealer City Coverage - 2015
Daimler Corporate Presentation / September 2016 / Page 89

Daimler AG
Mercedes-Benz Cars
Page 90 Daimler Corporate Presentation / September 2016 /

Daimler AG
2014 Capital Market Day
Daimler Corporate Presentation / September 2016 / Page 91

Daimler AG
2006 2007 2008 2009 2010 2011 2012 2013 2015
~364,000
We are well on track to narrow the gap with competitor
Gap to
Brand
“B”
Mercedes-Benz Sales Development in China MBPC Retail sales in Mainland China
Daimler Corporate Presentation / September 2016 / Page 92

Daimler AG
China became the single biggest market MB Passenger Cars
in 2015, and contributed one fifth of the worldwide sales
~20%
Rest of the world
Share of Market of Mercedes-Benz PC By retail sales, in 2015
Top 3 Market of Mercedes-Benz Retail sales in 2015, in thousand units
364 343
259
Daimler Corporate Presentation / September 2016 / Page 93

Daimler AG
And we grew at a faster speed among competitors in 2015
+35% +1.8% -1.2%
2014 2015
German Premium Brands China Performance - 2015 Retail Sales, in Mainland China
~364,000
Brand “B” Brand “A”
Note: Mercedes-Benz w/o smart & V-Class, Brand “B” w/o MINI
Daimler Corporate Presentation / September 2016 / Page 94

Daimler AG
The 6 key initiatives start to pay off
Extension Product Portfolio Expansion Dealer Network
Extension Local Production Leverage Financial Services Extension Local R&D
Integrated Sales Organization
Daimler Corporate Presentation / September 2016 / Page 95

Daimler AG
The 6 key initiatives start to pay off
Extension Product Portfolio Expansion Dealer Network Integrated Sales Organization
Daimler Corporate Presentation / September 2016 / Page 96
Daimler AG
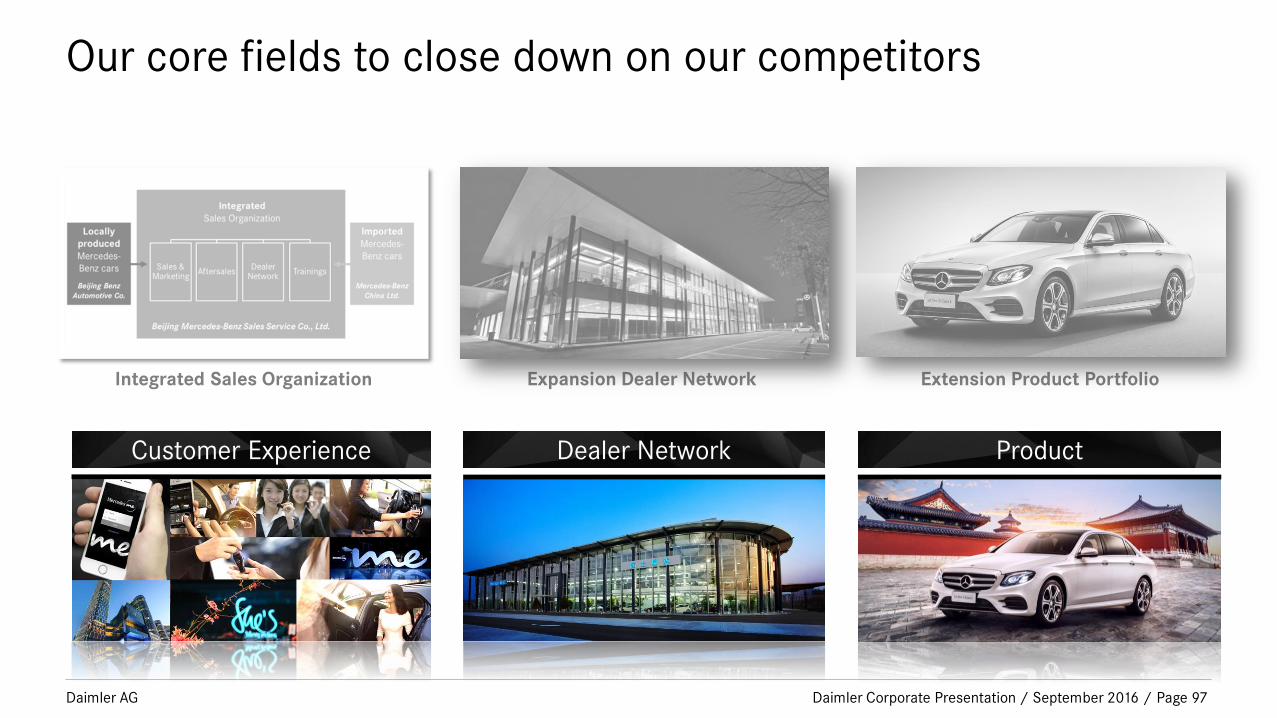
Our core fields to close down on our competitors
Integrated Sales Organization Extension Product Portfolio Expansion Dealer Network
Customer Experience Dealer Network Product
Daimler Corporate Presentation / September 2016 / Page 97

Daimler AG
Our core fields to close down on our competitors
Page 98
Product Customer Experience Dealer Network
Daimler Corporate Presentation / September 2016 /

Daimler AG
China has younger customer group who ‘live’ on-line
Page 99
Average
age
36.2 Addicted to
Social
Media
Online
Shopping
Daimler Corporate Presentation / September 2016 /

Daimler AG
We gear up for our potential customers:
E-Commerce for dealers online sales
Page 100
1
2
3
Select your car
Select your dealer
Buy your car
Daimler Corporate Presentation / September 2016 /

Daimler AG
We gear up for our existing customers:
Mercedes me Portal offers personalized online services
Page 101
Mercedes assist me Mercedes finance me
Mercedes inspire me Mercedes move me Mercedes store linkage
Mercedes connect me
Daimler Corporate Presentation / September 2016 /

Daimler AG
We gear up for the ladies:
She’s Mercedes
Page 102 Daimler Corporate Presentation / September 2016 /

Daimler AG
We gear up for everyone:
Mercedes me Sanlitun
Page 103
320k visitors in 4 months
10k customers have
joined community
in 4 months
22
60K
>500 KG of coffee beans
participants
events
Daimler Corporate Presentation / September 2016 /

Daimler AG
Our brand values are positively recognized…
Page 104
Brand Core
Brand
Values
EMOTIONAL
INTELLIGENT
Innovation
Design
Sportiness
Customer Care
Comfort
Sustainability
Safety
Quality
102
101
103
100
101
98
103
103
101
102
104
(+2)
(+1)
(+2)
(±0)
(+3)
(+1)
(+1)
(+1)
(+1)
(±0)
(+2)
THE BEST
Brand
Experiences
Index = 100 Index > 100
MB is as good as
the best competitor
MB exceeds
the best competitor
Index < 100
MB is weaker than
the best competitor
Source: Brand Monitor Report 2016
Daimler Corporate Presentation / September 2016 /

Daimler AG
…… and in our workshops
Page 105
Q3
2014
Q4
2014
Q1
2015
Q2
2015
Q3
2015
Q4
2015
Jan
2016
Feb
2016
Mar
2016
April
2016
May
2016
Jun
2016
July
2016
Source: MRA report PC China
Star
Maintenance
Menu launch
New Parts
Pricing
launch
After-Sales Retention Development 2014 Q3 – 2016 July in percentage
>75%
Daimler Corporate Presentation / September 2016 /

Daimler AG
Our core fields to close down on our competitors
Page 106
Product Customer Experience Dealer Network
Daimler Corporate Presentation / September 2016 /

Daimler AG
We have caught up on dealer outlet number and coverage
Page 107
250
300
350
400
450
500
Ou
tle
t P
lan
nin
g
2012 2013 2014 2015 2016F
Cit
y C
ov
era
ge
+79
+106 +55
+36
+47
+26
Brand A Brand A Brand B
Brand B
Brand A
Brand B
Brand A
Brand B
Brand A Brand B
Brand B
Brand A
Note: 1. City coverage counting based on MB new city tier definition
2. Data Source: MB Network Planning Project List & Timer Tracking Data (Brand A & Brand B outlet counting excl. Experience Center & Used Car Center)
Daimler Corporate Presentation / September 2016 /

Daimler AG Page 108
We are managing our network for the future: hardware
Optimizing and digitalizing our sales space
Upgrading and relocations to enhance capacities
Daimler Corporate Presentation / September 2016 /

Daimler AG
We are managing the network for the future: software
Page 109
Consistency in sales quality
Profitable growth of franchise business
Daimler Corporate Presentation / September 2016 /

Daimler AG
Our dealers = Our partners = Sustainable growth
Page 110
Product Forum March 2016
All Investor Conference July 2016
National Dealer Conference March 2016 Dealer Council Committee
Strategic Partner Conference March 2016
Daimler Corporate Presentation / September 2016 /

Daimler AG Page 111
DISS No.1 - This collaborative relationship bears fruit!
Overall Dealer Satisfaction – Development over time
2011 2012 2013 2014 2015 2016
DISS – Dealer Identification & Satisfaction Survey conducted in 2016
Brand B
Brand A
Daimler Corporate Presentation / September 2016 /

Daimler AG
Our core fields to close down on our competitors
Page 112
Customer Experience Product Dealer Network
Daimler Corporate Presentation / September 2016 /

Daimler AG
The C-Class – our first Game-Changer in August 2014
Page 113
Average
Monthly
Retail Sales
C-Class Long
Wheelbase
launched in
August 2014
C-Class Short
Wheelbase
launched in
June 2015
2014 2015
YTD Aug
2016
+131%
+39%
Daimler Corporate Presentation / September 2016 /
Daimler AG
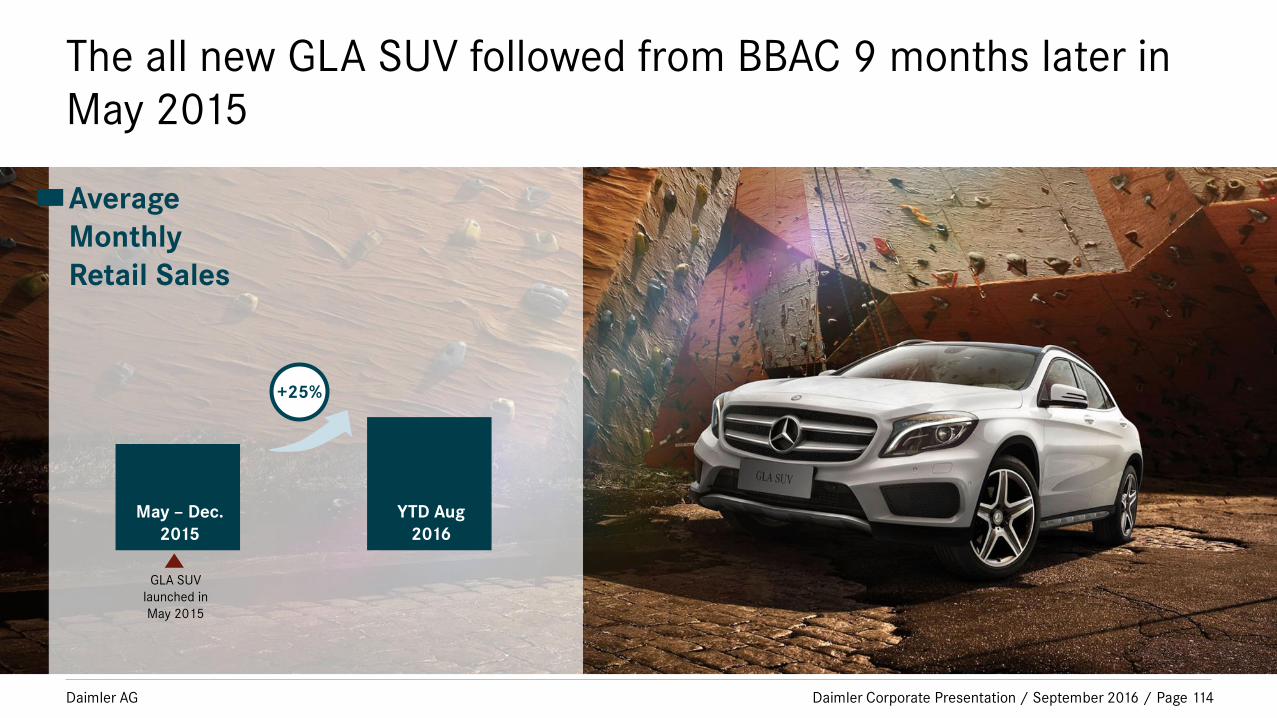
The all new GLA SUV followed from BBAC 9 months later in
May 2015
Page 114
Average
Monthly
Retail Sales
May – Dec.
2015
YTD Aug
2016
GLA SUV
launched in
May 2015
+25%
Daimler Corporate Presentation / September 2016 /

Daimler AG
Followed by the all new GLC SUV in November 2015– setting
new standard in all dimensions
Page 115
Average
Monthly
Retail Sales
2014 2015
YTD Aug
2016
GLC SUV
launched in
Nov. 2015
+10%
+30%
Daimler Corporate Presentation / September 2016 /

Daimler AG
And the superlative new E-Class Long Wheelbase comes to
market right now!
Page 116 Daimler Corporate Presentation / September 2016 /
Daimler AG
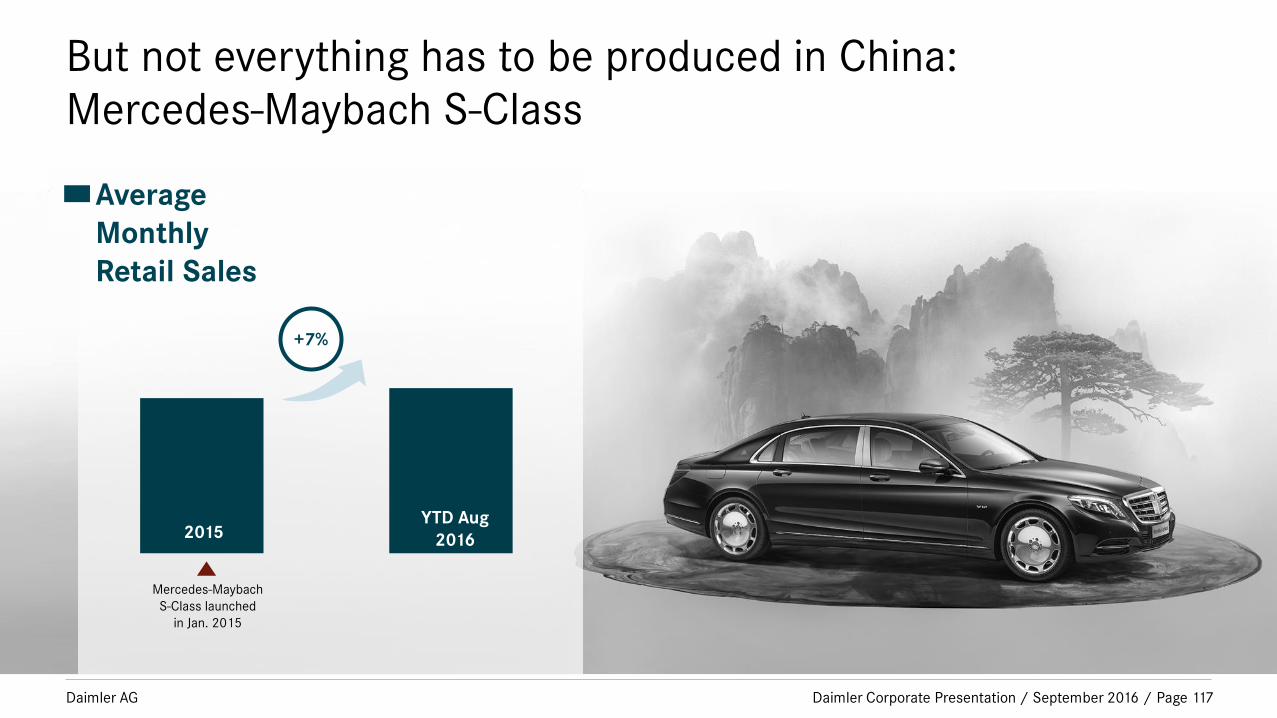
But not everything has to be produced in China:
Mercedes-Maybach S-Class
Page 117
0
100
200
300
400
500
600
700
800
900
1,000
Mercedes-Maybach
S-Class launched
in Jan. 2015
2015 YTD Aug
2016
+7%
Average
Monthly
Retail Sales
Daimler Corporate Presentation / September 2016 /

Daimler AG
Option packages for all model ranges
Page 118 Daimler Corporate Presentation / September 2016 /

Daimler AG
Mercedes me Connect 2.0 offering unique connectivity for
Chinese tastes
Page 119
Mercedes me connect
Concierge Service
Online Map Update
Parked Vehicle
Locator
Geofencing
Vehicle Tracker
Remote Retrieval of
Vehicle Status
Maintenance
Management
Wi-Fi Hotspot
Remote Parking Pilot
Software Updates
Mercedes-Benz Apps
WeChat-Mycar
Weather (AQI)
Daimler Corporate Presentation / September 2016 /

Daimler AG
Positive sales momentum with double digit growth expected
in 2016
Page 120
Source: BMBS Internal as of 2016 Aug YTD
MBC Sales Development (MB + smart)
Unit in thousand
206 229
288
364
291
2012 2013 2014 2015
2016
Aug
YTD
Double digit
growth To be updated to August
140
201
82
90 9
13
2015 Aug YTD 2016 Aug YTD
MB CBU
MB PbP
smart +32%
+11%
+44%
+36%
MBC Sales Development (MB + smart)
Unit in thousand
13
MBPC
smart
MBC 13
2016 Aug YTD
Daimler Corporate Presentation / September 2016 /

Daimler AG
6 Key Initiatives
Extension Product Portfolio Expansion Dealer Network
Extension Local Production Leverage Financial Services Extension Local R&D
Integrated Sales Organization
Daimler Corporate Presentation / September 2016 / Page 121

Daimler AG
Localized models are the key driving force to Mercedes-Benz
success in China
MB PC China Retail Sales Performance
Locally produced Imported Sales proportion of PbP over MB PC
2008 2009 2014 2015 2013 2012 2011 2010
65%
33%
49%
2/3 of
total sales
~364,000
Daimler Corporate Presentation / September 2016 / Page 122

Daimler AG
+ …
Made in China for China: we’re producing four car models
and three engine models
GLC (X253)
E-Class (V/W 213)
C-Class (V/W 205)
GLA (X156)
M270
M274
M276
Rear
wheel
drive
Engine
Front
wheel drive
Daimler Corporate Presentation / September 2016 / Page 123

Daimler AG
Continuously deepening the strategic partnership
Daimler Corporate Presentation / September 2016 / Page 124

Daimler AG
6 Key Initiatives
Extension Product Portfolio Expansion Dealer Network
Extension Local Production Leverage Financial Services Extension Local R&D
Integrated Sales Organization
Daimler Corporate Presentation / September 2016 / Page 125

Daimler AG
6 Key Initiatives
Extension Product Portfolio Expansion Dealer Network
Extension Local Production Leverage Financial Services Extension Local R&D
Integrated Sales Organization
Daimler Corporate Presentation / September 2016 / Page 126

Daimler AG
Increasing Importance of
Financial Services in China
Daimler Corporate Presentation / September 2016 / Page 127

Daimler AG
MBFS penetration rate will mature over time to the level of the global DFS penetration rate.
China
Demand for Auto Financing is increasing and we will make
sure we have our share…
12%
2011
50%
2013 2015 2018F 2020F
Daimler Corporate Presentation / September 2016 / Page 128

Daimler AG
…by covering customers’ finance, leasing & insurance
needs based on a solid shareholding structure
Mercedes-Benz Auto Finance Ltd. Mercedes-Benz Leasing Co., Ltd.
100%
Daimler
35%
65%
BAIC Daimler
As of March 2015
Portfolio as of
2016 July YTD 51 Billion RMB 3 Billion RMB
Daimler Corporate Presentation / September 2016 / Page 129
Daimler AG
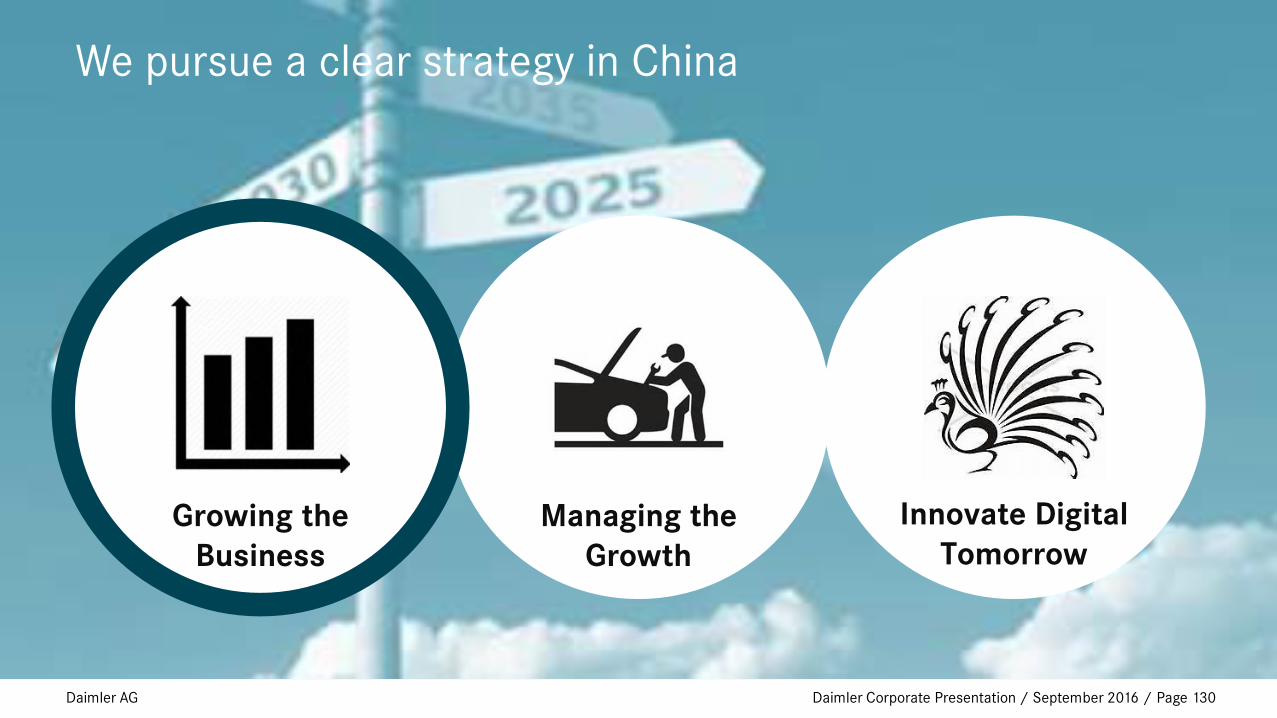
Growing the
Business
Innovate Digital
Tomorrow
Managing the
Growth
We pursue a clear strategy in China
Daimler Corporate Presentation / September 2016 / Page 130

Daimler AG
16% 17%
26%
33%
2012 2013 2014 2015 2016E 2020E
Financing Leasing Wholesale
We are growing fast, and not only with a comprehensive
auto finance portfolio…
PC Penetration % & Portfolio in billion RMB
18 22 33
49
F F
Daimler Corporate Presentation / September 2016 / Page 131
Daimler AG
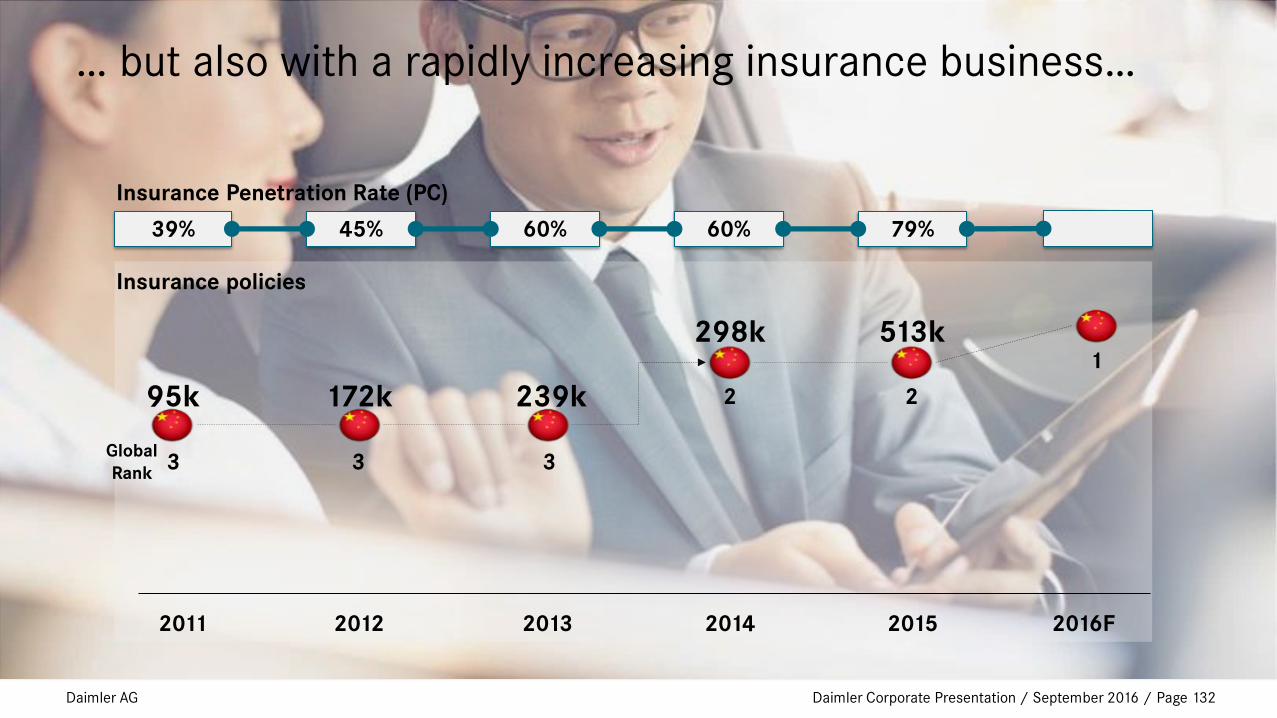
2011 2012 2013 2014 2015 2016F
… but also with a rapidly increasing insurance business…
39% 45% 60% 60% 79%
Insurance policies
298k 513k
95k 172k 239k
Insurance Penetration Rate (PC)
3 Global
Rank 3 3
2 2
1
Daimler Corporate Presentation / September 2016 / Page 132
Daimler AG
…and Newly Launched
Mobility Services in China
Daimler Corporate Presentation / September 2016 / Page 133

Daimler AG
Simple. Always. Everywhere.
Launched in 2016
78,000 members, a new rental every1.7 min
As of July 2016
Daimler Corporate Presentation / September 2016 / Page 134

Daimler AG
Growing the
Business
Innovate Digital
Tomorrow
Managing the
Growth
We pursue a clear strategy in China
Daimler Corporate Presentation / September 2016 / Page 135

Daimler AG
>450 contracts per day
We are facing the challenges of fast growth every day Average number of contracts signed by MBFS China 2014 vs. YTD 2016 [units]
From > 200 contracts per day in 2014 to
Daimler Corporate Presentation / September 2016 / Page 136

Daimler AG
To support the business growth, we actively engage
ourselves to find the right people for the right position
Employees Development MBFS China
422 427 498
594
2012 2013 2014 2015 2016EF
Daimler Corporate Presentation / September 2016 / Page 137

Daimler AG
We hire high performers, develop them into experts and
retain them with attractive career path opportunities
Talent Development and Retention Continuous Efforts in Talent Acquisition
• Dedicated Recruitment Resources
• Expanded Sourcing Channels
• Global Search
Strive for
MORE.
Daimler Corporate Presentation / September 2016 / Page 138

Daimler AG
• Auto Decision
2016 (YTD) 26% of applications are
already automatically decided,
improving our operational costs
further. This ratio is expected to be
>30% by end of this year.
With efficient processes and systems we form a sound
foundation for future sustainable growth
• Outsourcing of non-core processes
• Service Center & Customer Contact
Center
• Major IT infrastructure upgrades &
core system replacements
Daimler Corporate Presentation / September 2016 / Page 139

Daimler AG
Growth is managed with a reasonable risk control…
47% of our Finance
77% of our Leasing
Consumers make a
Down payment > 50%
33 Months
Average Terms
Daimler Corporate Presentation / September 2016 / Page 140

Daimler AG
…which is reflected in our low credit losses Net Credit Loss ratio in %
0.31 0.48
0.34 0.36
2012 2013 2014 2015 2016F
Daimler Corporate Presentation / September 2016 / Page 141

Daimler AG
Asset Backed Securitization is leveraged to support the
increasing capital demand
2015
Equity
15%
Bank loan
and others
85%
2016 F 2017 F
Equity
ABS
Bank Loan
and others
Equity ABS
Bank Loan
and others
49 bn RMB
Daimler Corporate Presentation / September 2016 / Page 142

Daimler AG
Growing the
Business
Innovate Digital
Tomorrow
Managing the
Growth
We pursue a clear strategy in China
Daimler Corporate Presentation / September 2016 / Page 143

Daimler AG
Digitize Business Disrupt Industry
Big Data Ecosystem
We reinvent and challenge our business before anybody
else does
Daimler Corporate Presentation / September 2016 / Page 144

Daimler AG
6 Key Initiatives
Extension Product Portfolio Expansion Dealer Network
Extension Local Production Leverage Financial Services Extension Local R&D
Integrated Sales Organization
Daimler Corporate Presentation / September 2016 / Page 145

Daimler AG
The momentum continues in 2016
German Premium Brands China Performance - YTD July 2016 Retail Sales, in Mainland China
Note: Mercedes-Benz w/o smart & V-Class, competitor 1 w/o MINI
+33%
2014 2015
2016
YTD July
>251,000
+8.7% +6.6%
Brand “B” Brand “A”
Daimler Corporate Presentation / September 2016 / Page 146

Daimler AG
Contents
Results for Q2 2016
Outlook for 2016
Daimler Group Strategy
Divisional information
China
Appendix
Page 147 Daimler Corporate Presentation / September 2016 /

Daimler AG
Group EBIT in Q2 2016 - in millions of euros -
-29 -669
3,258
+34 3,718
+93 +111
• Cars +246 • Trucks -313 • Vans +153 • Buses +25
• Cars -18 • Trucks +87 • Vans -5 • Buses +29
• Cars -252 • Trucks +169 • Vans +76 • Buses -22
of which:
• Contribution to pension plan +605
• Expenses due to Takata airbags -499
• Legal proceedings -400
• Measurement of inventories MBC -284
• Patent dispute -64
• Own dealer network +15
• Currency transactions -19
• Workforce adjustments DT -14
0
Actual
Q2 2015
Volume/
Structure/
Net pricing
Foreign
exchange
rates
Other cost
changes
Reconciliation Actual
Q2 2016
Financial
Services
Special items
affecting
EBIT
Page 148 Daimler Corporate Presentation / September 2016 /

Daimler AG
Special items affecting EBIT (I)
Mercedes-Benz Cars Q2 2015 Q2 2016 H1 2015 H1 2016
Restructuring of own dealer network -16 -11 -36 -21
Relocation of headquarters of MBUSA +9 – -11 –
Sale of real estate in the United States – – +87 –
Expenses in connection with Takata airbags – -440 – -460
Net expenses from measurement of inventories – -284 – -284
Settlement in connection with patent dispute – -64 – -64
Daimler Trucks
Workforce adjustments -20 -34 -25 -34
Restructuring of own dealer network -15 -6 -19 -7
Sale of Atlantis Foundries – – -55 –
in millions of euros
Page 149 Daimler Corporate Presentation / September 2016 /

Daimler AG
Special items affecting EBIT (II)
Mercedes-Benz Vans Q2 2015 Q2 2016 H1 2015 H1 2016
Restructuring of own dealer network -4 -2 -8 -3
Relocation of headquarters of MBUSA – – -2 –
Expenses in connection with Takata airbags – -59 – -63
Workforce adjustments in Germany – – – -30
Daimler Buses
Restructuring of own dealer network – -1 -1 -1
Reconciliation
Expenses related to legal proceedings – -400 – -400
Impairment of investment in BAIC Motor – – – -244
Losses from currency transactions (not allocated to business operations) – -19 – -241
Contribution of shares of Renault and Nissan to pension plan assets – +605 – +605
in millions of euros
Page 150 Daimler Corporate Presentation / September 2016 /

Daimler AG
Mercedes-Benz Cars: continued business growth based on
strong product portfolio
Unit sales – in thousands of units –
Q2 2015 Q2 2016
Revenue – in billions of euros –
EBIT adjusted for special items – in millions of euros –
501 547
Q2 2015 Q2 2016
21.1 22.1
Q2 2015 Q2 2016
2,234 2,209 +9% +5% -1%
Page 151 Daimler Corporate Presentation / September 2016 /
Daimler AG
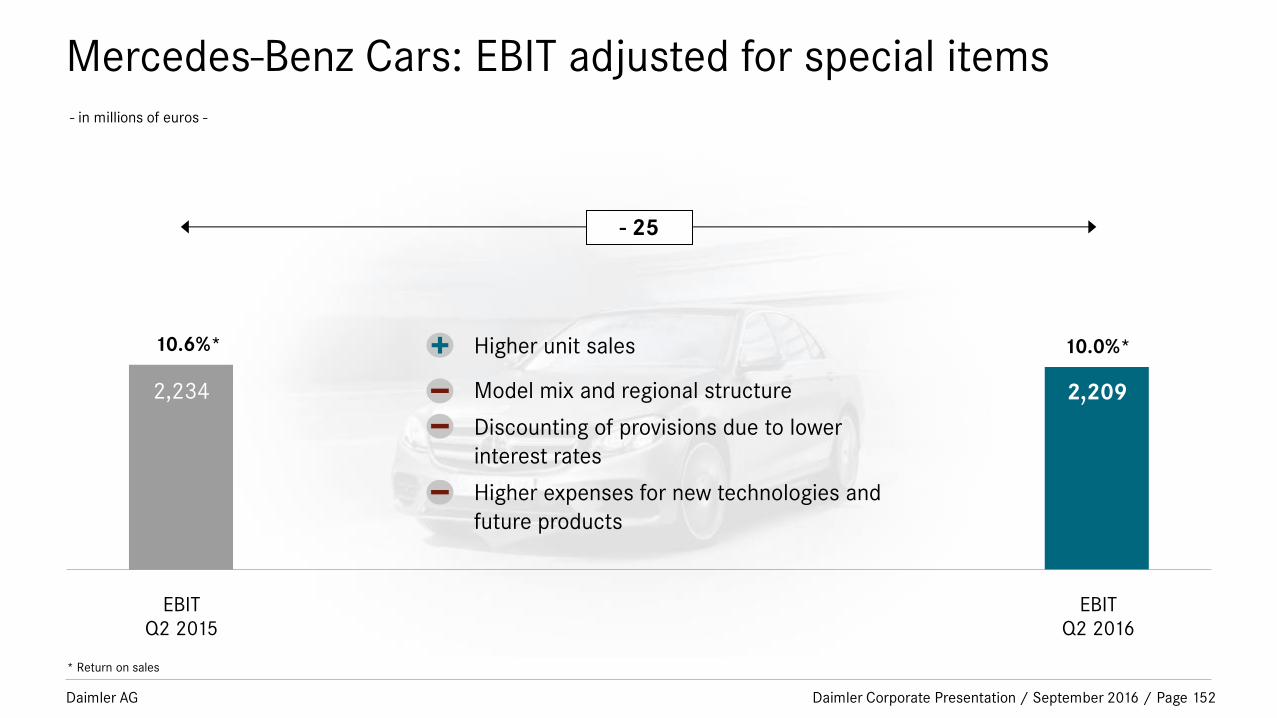
- in millions of euros -
* Return on sales
EBIT
Q2 2015
EBIT
Q2 2016
2,234 2,209
- 25
10.6%* 10.0%* Higher unit sales
Model mix and regional structure
Discounting of provisions due to lower
interest rates
Higher expenses for new technologies and
future products
Mercedes-Benz Cars: EBIT adjusted for special items
Page 152 Daimler Corporate Presentation / September 2016 /

Daimler AG
Mercedes-Benz Cars: sales volume above prior-year level
* incl. GLA
- in thousands of units -
Q2 2015
501
547
Q2 2016
113
128
58
23
6
110
113
80
28
8
smart
E-Class
C-Class
A-/B-Class
S-Class
Sports Cars 40
34
SUVs* 127 180
Page 153 Daimler Corporate Presentation / September 2016 /

Daimler AG
Mercedes-Benz Cars: balanced sales structure
- unit sales in thousands -
Q2 2015
501
547
Q2 2016
117
87
84
142
91
90
79
122
Rest of world
Germany
United States
China
Western Europe excl. Germany
119
117
Page 154 Daimler Corporate Presentation / September 2016 /

Daimler AG
Daimler Trucks: key figures driven by heterogeneous market
development
Unit sales – in thousands of units –
Q2 2015 Q2 2016
Revenue – in billions of euros –
EBIT adjusted for special items – in millions of euros –
125
108
Q2 2015 Q2 2016
9.4 8.7
Q2 2015 Q2 2016
717 661 -13% -8% -8%
Page 155 Daimler Corporate Presentation / September 2016 /

Daimler AG
Daimler Trucks: EBIT adjusted for special items - in millions of euros -
* Return on sales
EBIT
Q2 2015
EBIT
Q2 2016
717 661
- 56
7.6%* 7.6%*
Higher unit sales in Europe (EU30)
Efficiency enhancements
Foreign exchange rates
Lower unit sales in the NAFTA region, Turkey,
Latin America, Indonesia and Middle East
Intense competition in Europe
Page 156 Daimler Corporate Presentation / September 2016 /

Daimler AG
Daimler Trucks: decrease in unit sales driven by NAFTA
region, Turkey, Latin America, Indonesia and Middle East - in thousands of units -
Q2 2015
125
108
Q2 2016
20
41
7
30
18
49
9
35
Rest of world
Latin America
NAFTA region
EU30*
Asia
14
10
* European Union, Switzerland and Norway
Page 157 Daimler Corporate Presentation / September 2016 /
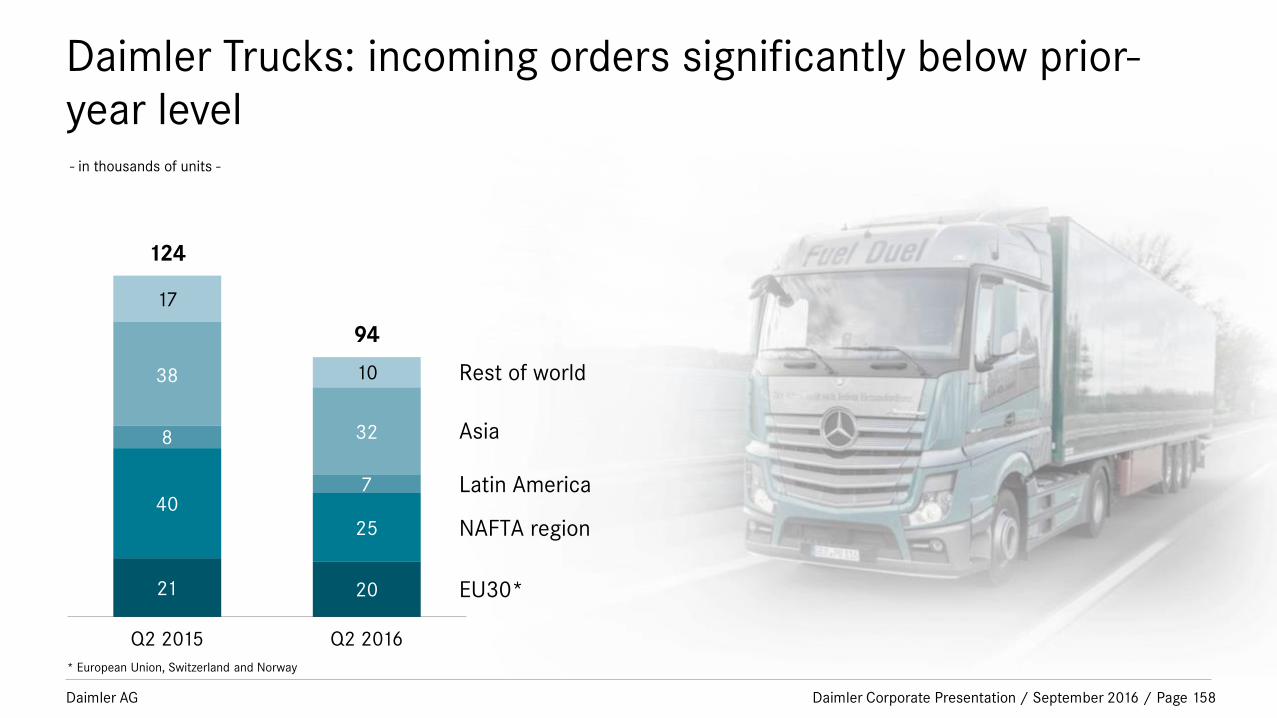
Daimler AG
Daimler Trucks: incoming orders significantly below prior-
year level - in thousands of units -
Q2 2015
124
94
Q2 2016
20
25
7
32
21
40
8
38 Rest of world
Latin America
NAFTA region
EU30*
Asia
17
10
* European Union, Switzerland and Norway
Page 158 Daimler Corporate Presentation / September 2016 /

Daimler AG
Mercedes-Benz Vans: strong development based on very
successful products
Unit sales – in thousands of units –
Q2 2015 Q2 2016
Revenue – in billions of euros –
EBIT adjusted for special items – in millions of euros –
81.6
99.6
Q2 2015 Q2 2016
2.8
3.4
Q2 2015 Q2 2016
238
462 +22% +22% +94%
Page 159 Daimler Corporate Presentation / September 2016 /

Daimler AG
Mercedes-Benz Vans: EBIT adjusted for special items - in millions of euros -
* Return on sales
EBIT
Q2 2015
EBIT
Q2 2016
238
462
+ 224
8.4%*
13.4%*
Higher unit sales
Efficiency enhancements
Page 160 Daimler Corporate Presentation / September 2016 /
Daimler AG
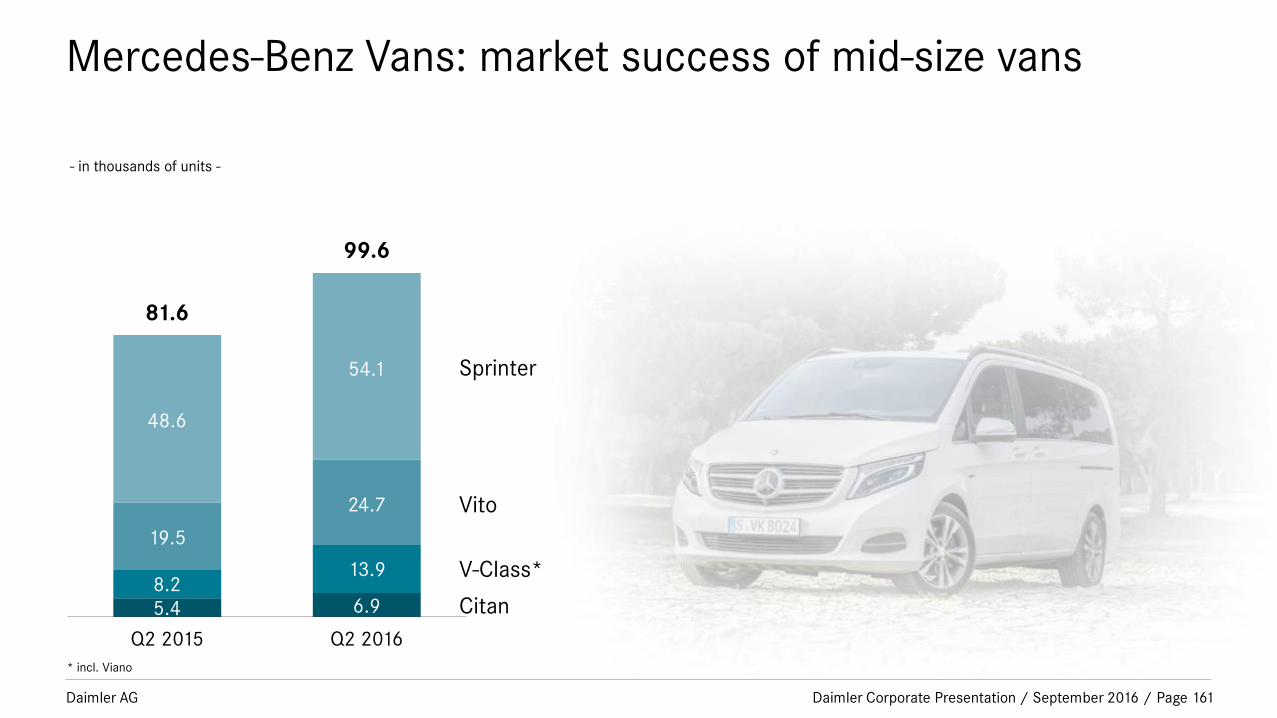
Mercedes-Benz Vans: market success of mid-size vans
- in thousands of units -
Q2 2015
81.6
99.6
Q2 2016
6.9
13.9
24.7
54.1
5.4
8.2
19.5
48.6
Vito
V-Class*
Citan
Sprinter
* incl. Viano
Page 161 Daimler Corporate Presentation / September 2016 /

Daimler AG
Daimler Buses: strong EBIT despite significant market
contraction in Latin America
Unit sales – in thousands of units –
Q2 2015 Q2 2016
Revenue – in billions of euros –
EBIT adjusted for special items – in millions of euros –
7.3 7.0
Q2 2015 Q2 2016
1.0 1.1
Q2 2015 Q2 2016
57
89 -5% +8% +56%
Page 162 Daimler Corporate Presentation / September 2016 /

Daimler AG
Daimler Buses: EBIT adjusted for special items - in millions of euros -
* Return on sales
EBIT
Q2 2015
EBIT
Q2 2016
57
89
+ 32
5.5%*
7.9%* Higher unit sales and better model mix
in Western Europe
Foreign exchange rates
Lower sales and cost inflation in Latin
America
Page 163 Daimler Corporate Presentation / September 2016 /

Daimler AG
Daimler Buses: lower demand for bus chassis in Latin
America - unit sales in thousands -
Q2 2015
7.3 7.0
Q2 2016
2.5
0.6
1.8
1.2
2.4
0.9
1.9
1.4
Rest of world
Brazil
Mexico
Europe
Latin America (excl. Brazil and Mexico)
0.7 0.9
Page 164 Daimler Corporate Presentation / September 2016 /

Daimler AG
Daimler Financial Services: further business growth
New business – in billions of euros –
Q2 2015 Q2 2016
Contract volume – in billions of euros –
EBIT – in millions of euros –
14.8 15.4
12/31/2015 6/30/2016
116.7 120.3
Q2 2015 Q2 2016
445 479 +4% +3% +8%
Page 165 Daimler Corporate Presentation / September 2016 /

Daimler AG
Daimler Financial Services: EBIT - in millions of euros -
* Return on equity
EBIT
Q2 2015
EBIT
Q2 2016
445 479
+ 34
20.7%* 19.3%*
Higher contract volume
Foreign exchange rates
Page 166 Daimler Corporate Presentation / September 2016 /

Daimler AG
Daimler Financial Services: growth in all regions
- contract volume in billions of euros -
12/31/2015
116.7 120.3
6/30/2016
20.9
26.3
50.9
22.2
19.8
25.8
50.8
20.2
Americas
Europe (excl. Germany)
Germany
Africa & Asia-Pacific
Page 167 Daimler Corporate Presentation / September 2016 /

Daimler AG
Daimler Financial Services: net credit losses* at low level
* as a percentage of portfolio, subject to credit risk
0.69% 0.68%
0.50%
0.61%
0.36%
0.51%
0.89% 0.83%
0.43%
0.34% 0.37% 0.31%
0.24% 0.29%
2003 2004 2005 2006 2007 2008 2009 2010 2011 2012 2013 2014 2016
YTD
2015
Page 168 Daimler Corporate Presentation / September 2016 /

Daimler AG
Development of dividend per share
Page 169
2.20
2.45
2.25
1.85
2.20
- in euros -
+76%
3.25
2010 2011 2012 2013 2015 2014
Daimler Corporate Presentation / September 2016 /

Daimler AG
Increased investment as a basis for profitable growth
Page 170
10.5 10.5 10.5
8.5
9.8
Actual
2010
Actual
2011
Actual
2012
Actual
2013
Actual
2014
Research and
development
expenditure
Investment in
property, plant
and equipment
Plan
2016/17
(average p.a.)
14.2
- in billions of euros -
11.6
Actual
2015
5.7
4.8
6.6
5.1
7.2
7.0
Daimler Corporate Presentation / September 2016 /

Daimler AG
Capital expenditure / Research and development
Page 171
Actual
2014
Actual
2015
4.8
Plan
2016/2017
(average p.a.)
5.1
7.0
Actual
2014
Actual
2015
5.7
6.6 7.2
Plan
2016/2017
(average p.a.)
- in billions of euros -
Investment in property, plant and equipment
Research and development expenditure
Daimler Corporate Presentation / September 2016 /

Daimler AG
Capital expenditure / Research and development
Investment in property, plant
and equipment
Research and development
expenditure
Actual
2014
Actual
2015
Plan*
2016-2017
Actual
2014
Actual
2015
Plan*
2016-2017
Daimler Group 4.8 5.1 7.0 5.7 6.6 7.2
of which
Mercedes-Benz Cars 3.6 3.6 5.0 4.0 4.7 5.4
Daimler Trucks 0.8 1.1 1.4 1.2 1.3 1.3
Mercedes-Benz Vans 0.3 0.2 0.6 0.3 0.4 0.4
Daimler Buses 0.1 0.1 0.1 0.2 0.2 0.2
Daimler Financial Services 0.02 0.03 0.02 – – –
in billions of euros * average p.a.
Page 172 Daimler Corporate Presentation / September 2016 /

Daimler AG
MBC retail sales by model Q1-2 2016
* incl. Derivatives
** incl. GLA
Retail sales Q1-2 2016 Q1-2 2015 Change in %
Mercedes-Benz 1,006,619 898,353 +12.1
of which*: A-/B-Class 220,556 202,121 +9.1
C-Class 229,872 226,082 +1.7
E-Class 135,232 149,177 -9.3
S-Class 45,299 56,606 -20.0
SUVs** 339,541 232,406 +46.1
Sports Cars 13,839 16,747 -17.4
V-Class 22,280 15,214 +46.4
smart 73,510 62,164 +18.3
Mercedes-Benz Cars 1,080,129 960,517 +12.5
Page 173
- in units -
Daimler Corporate Presentation / September 2016 /

Daimler AG
MBC retail sales by model FY 2015
* incl. Derivatives
** incl. GLA
Retail sales FY 2015 FY 2014 Change in %
Mercedes-Benz 1,871,599 1,650,007 +13.4
of which*: A-/B-Class 414,365 389,577 +6.4
C-Class 460,497 343,195 +34.2
E-Class 301,566 338,205 -10.9
S-Class 107,335 107,277 +0.1
SUVs** 525,894 415,363 +26.6
Sports Cars 30,441 31,440 -3.2
V-Class 31,501 24,950 +26.2
smart 119,382 89,844 +32.9
Mercedes-Benz Cars 1,990,981 1,739,923 +14.4
Page 174
- in units -
Daimler Corporate Presentation / September 2016 /

Daimler AG
MBC retail sales major markets Q1-2 2016
Page 175
- in units -
*Incl. Hong Kong **BRIKT: Brazil, Russia, India, South Korea and Turkey
Retail sales Q1-2 2016 Q1-2 2015 Change in %
China* 229,137 173,553 +32.0
of which locally produced vehicles 148,495 98,393 +50.9
USA 165,383 168,616 -1.9
Germany 161,271 150,648 +7.1
UK 93,745 77,979 +20.2
BRIKT** 70,931 71,777 -1.2
Italy 49,728 41,484 +19.9
Japan 34,288 32,706 +4.8
France 32,961 28,770 +14.6
South Korea 25,208 22,235 +13.4
Spain 27,019 21,479 +25.8
Russia 19,271 23,325 -17.4
Canada 21,149 19,817 +6.7
Turkey 14,509 11,846 +22.5
Rest of World 206,460 188,059 +9.8
Mercedes-Benz Cars 1,080,129 960,517 +12.5
Daimler Corporate Presentation / September 2016 /

Daimler AG
MBC retail sales major markets FY 2015
*Incl. Hong Kong **BRIKT: Brazil, Russia, India, South Korea and Turkey
Page 176
- in units -
Retail sales FY 2015 FY 2014 Change in %
China* 386,635 299,416 +29.1
of which locally produced vehicles 237,894 147,633 +61.1
USA 350,548 340,623 +2.9
Germany 309,989 282,347 +9.8
UK 152,929 127,823 +19.6
BRIKT** 149,357 131,364 +13.7
Italy 76,064 61,596 +23.5
Japan 65,983 61,768 +6.8
France 62,971 55,436 +13.6
South Korea 45,638 35,985 +26.8
Spain 45,132 34,001 +32.7
Russia 42,179 50,131 -15.9
Canada 39,696 36,474 +8.8
Turkey 30,433 23,263 +30.8
Rest of World 351,677 309,003 +13.8
Mercedes-Benz Cars 1,990,981 1,739,923 +14.4
Daimler Corporate Presentation / September 2016 /

Daimler AG
MBC regional retail sales mix Q1-2 2016
Japan
3,1%
3,2%
Italy 4,6%
BRIKT**
6,6%
UK
Rest of World
Canada
19,1%
2,0%
2,5% Spain
France
14,9%
15,3%
21,2%
8,7%
Germany
USA
China*
**BRIKT: Brazil, Russia, India, South Korea and Turkey
*Incl. Hong Kong
Page 177 Daimler Corporate Presentation / September 2016 /

Daimler AG
MBC regional retail sales mix FY 2015
17,7%
Rest of World
Canada 2,0%
2,3% Spain
3,2% France
3,3% Japan
3,8% Italy
7,5%
BRIKT**
UK Germany
7,7% 15,6%
USA 17,6%
China*
19,4%
**BRIKT: Brazil, Russia, India, South Korea and Turkey
*Incl. Hong Kong
Page 178 Daimler Corporate Presentation / September 2016 /

Daimler AG
Daimler follows a conservative Financial Policy
Page 179
Clear commitment to a single A rating
Dividend policy on a sustainable basis (40% target pay-out ratio)
No share buybacks planned, further pension contributions will be evaluated
Balanced approach between shareholder interest and credit providers
Daimler Corporate Presentation / September 2016 /

Daimler AG
Bonds total outstanding as of Q2 2016: 59.1
Bond Maturities
Page 180
- in billions of euros -
Q3 2016 Q4 2016 Q1 2017 Q2 2017
Next 12
months
Bonds
short term
-4.3 -2.1 -4.7 -2.9 -14.0
0-1 Y 1-2 Y 2-3 Y 3-4 Y 4-5 Y 5-6 Y >6 Y
Bonds
long term
-14.0 -12.5 -8.5 -9.6 -3.7 -2.1 -8.6
Daimler Corporate Presentation / September 2016 /

Daimler AG
Bonds and ABS Development 2013 - 2015
Note: Figures may not be additive due to fx effects and rounding.
Bond development
ABS development
Maturities
New deals
50,842,938,7
16,9
10,8
2015 Actual
-10,2
2014 Actual
-9,4
2013 Actual
7,46,06,1
6,2
3,5
-5,8
2014 Actual
-4,4
2013 Actual 2015 Actual
Page 181
- in billions of euros -
Daimler Corporate Presentation / September 2016 /
Daimler AG
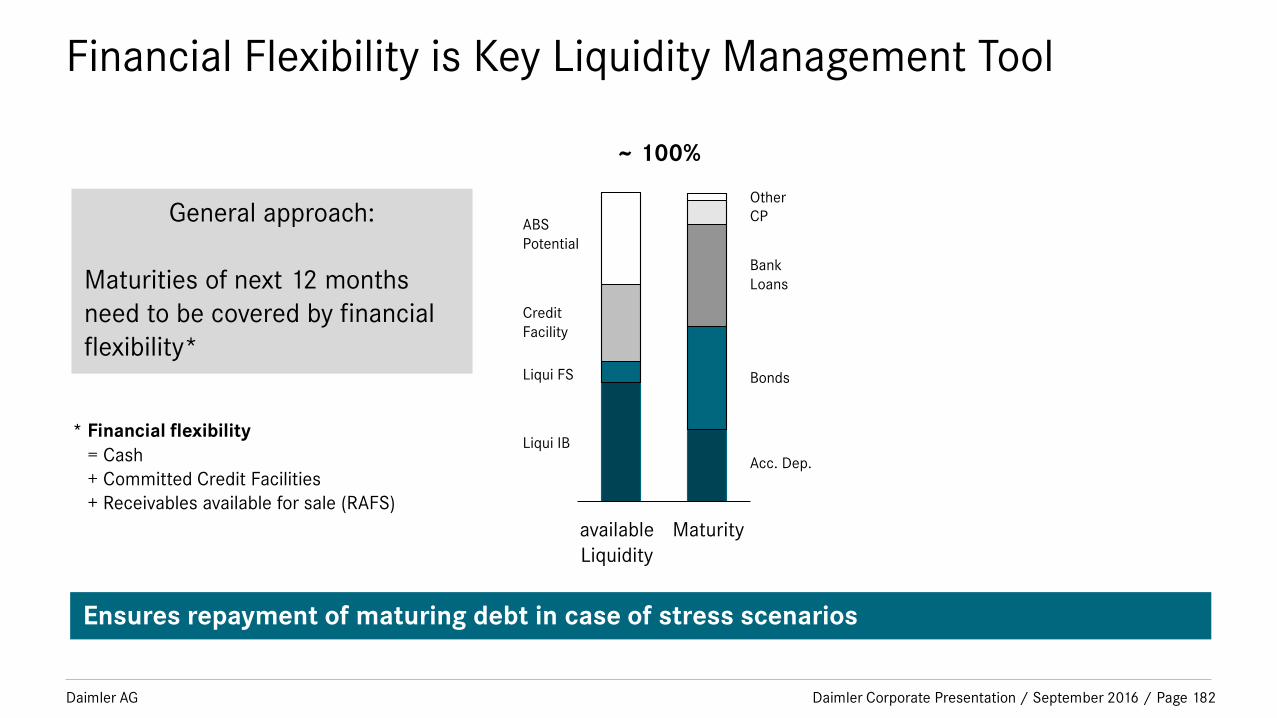
Financial Flexibility is Key Liquidity Management Tool
~ 100%
General approach:
Maturities of next 12 months
need to be covered by financial
flexibility*
* Financial flexibility
= Cash
+ Committed Credit Facilities
+ Receivables available for sale (RAFS)
available
Liquidity
Maturity
Bonds
Acc. Dep.
Bank
Loans
CP
Other
Liqui FS
Liqui IB
Credit
Facility
ABS
Potential
Ensures repayment of maturing debt in case of stress scenarios
Page 182 Daimler Corporate Presentation / September 2016 /

Daimler AG
Our funding strategy is built on prudent principles
Targeting
Financial
Independence
No dependence from single markets, instruments, banks or investors
Diversification of funding sources and instruments:
Bank Loans, Bonds, ABS, CP, Deposits
No Covenants, no MAC, no asset pledges, no CSAs
Maximizing
Financial
Flexibility Early capital market funding to save credit capacity in growth regions
New markets funded via global and local banks first
Stringent Global
Funding Policy
Liquidity matched funding
Interest rate matched funding
Currency matched funding
Country matched funding
Keeping prudent amount of Cash and Committed Credit Facility
Page 183 Daimler Corporate Presentation / September 2016 /

Daimler AG
Disclaimer
This document contains forward-looking statements that reflect our current views about future events. The words “anticipate,” “assume,” “believe,”
“estimate,” “expect,” “intend,” “may,” ”can,” “could,” “plan,” “project,” “should” and similar expressions are used to identify forward-looking statements.
These statements are subject to many risks and uncertainties, including an adverse development of global economic conditions, in particular a decline of
demand in our most important markets, caused for example by the possible exit of the United Kingdom from the European Union; a deterioration of our
refinancing possibilities on the credit and financial markets; events of force majeure including natural disasters, acts of terrorism, political unrest, armed
conflicts, industrial accidents and their effects on our sales, purchasing, production or financial services activities; changes in currency exchange rates; a
shift in consumer preferences towards smaller, lower-margin vehicles; a possible lack of acceptance of our products or services which limits our ability to
achieve prices and adequately utilize our production capacities; price increases for fuel or raw materials; disruption of production due to shortages of
materials, labor strikes or supplier insolvencies; a decline in resale prices of used vehicles; the effective implementation of cost-reduction and efficiency-
optimization measures; the business outlook for companies in which we hold a significant equity interest; the successful implementation of strategic
cooperations and joint ventures; changes in laws, regulations and government policies, particularly those relating to vehicle emissions, fuel economy and
safety; the resolution of pending government investigations or of investigations requested by governments and the conclusion of pending or threatened
future legal proceedings; and other risks and uncertainties, some of which we describe under the heading “Risk and Opportunity Report” in the current
Annual Report. If any of these risks and uncertainties materializes or if the assumptions underlying any of our forward-looking statements prove to be
incorrect, the actual results may be materially different from those we express or imply by such statements. We do not intend or assume any obligation
to update these forward-looking statements since they are based solely on the circumstances at the date of publication.
Page 184 Daimler Corporate Presentation / September 2016 /