Embed Size (px)
Citation preview
0
1H05 Analysts and investors meeting
Localiza Rent a Car S.A.
1
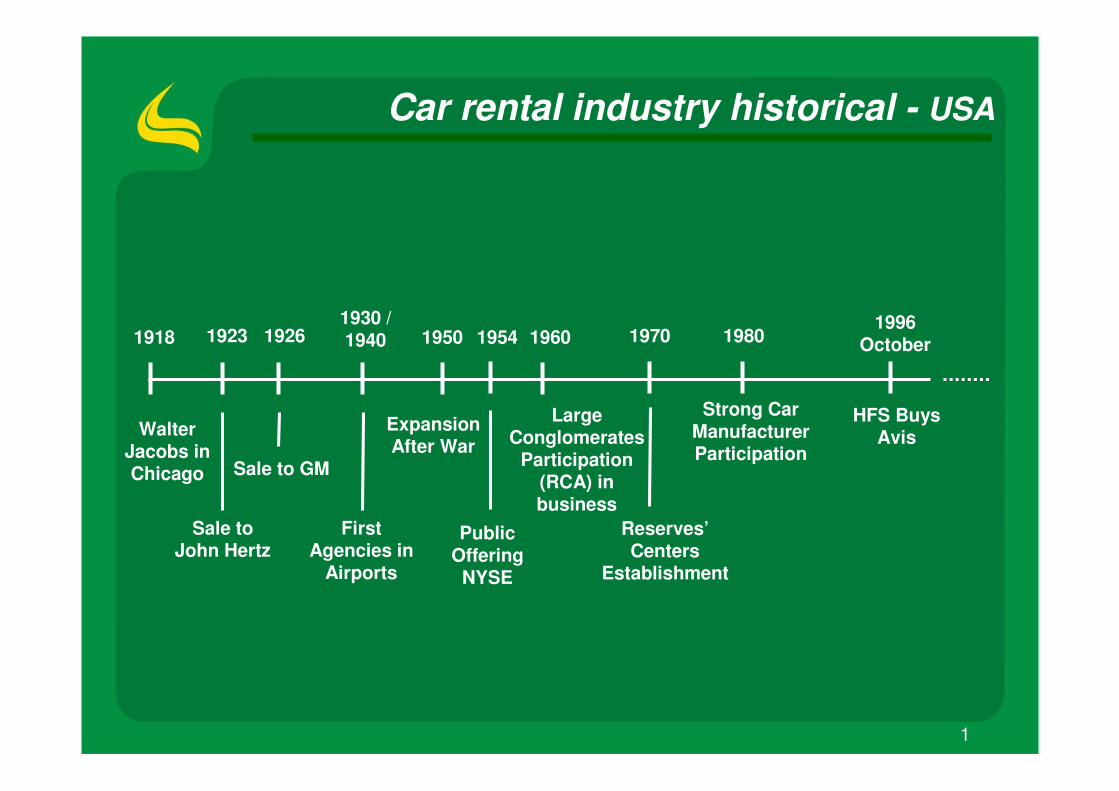
Car rental industry historical - USA
Walter Jacobs in Chicago
1918 1923
Sale to John Hertz
1926
Sale to GM
1930 / 1940
FirstAgencies in
Airports
1950
ExpansionAfter War
1954
PublicOffering
NYSE
1960
LargeConglomerates
Participation(RCA) in business
Reserves’ Centers
Establishment
1970 1980
Strong Car ManufacturerParticipation
1996October
HFS BuysAvis
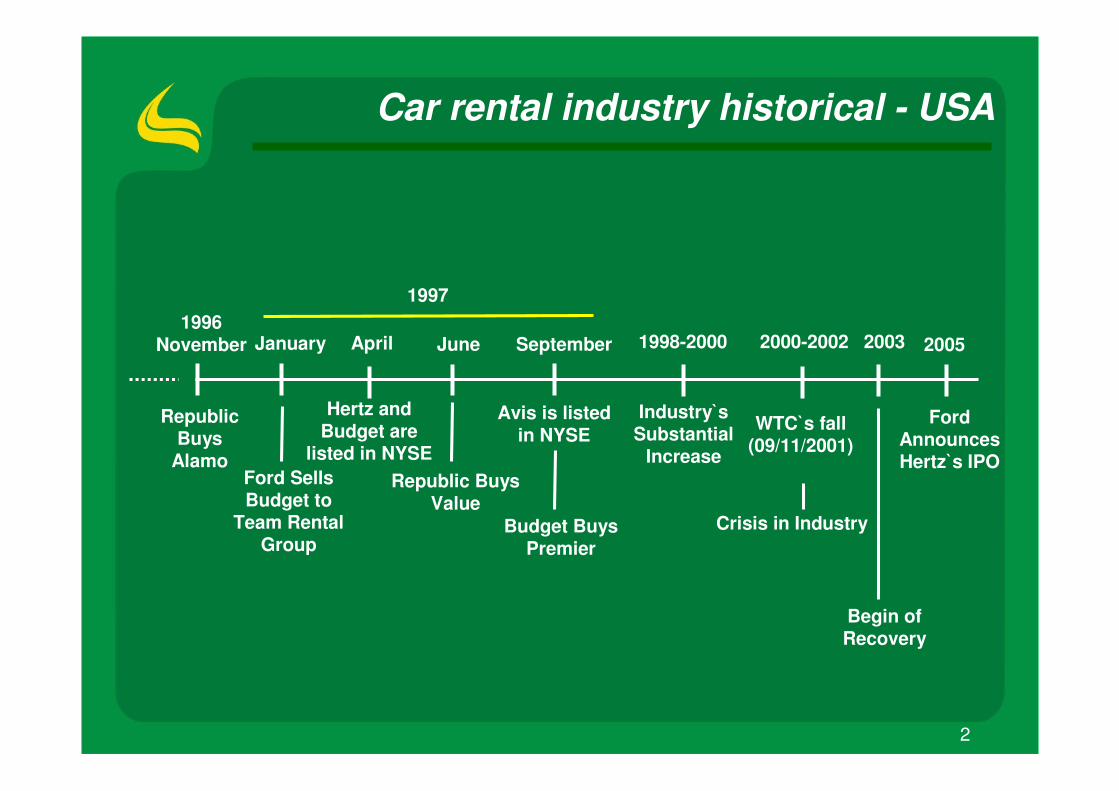
2
1996November
RepublicBuys
Alamo
1998-2000January April
Ford SellsBudget to
Team RentalGroup
Hertz andBudget are
listed in NYSE
June
Republic BuysValue
September
Avis is listedin NYSE
Budget BuysPremier
2005
Ford AnnouncesHertz`s IPO
1997
Industry`s Substantial
Increase
2000-2002
WTC`s fall(09/11/2001)
Crisis in Industry
2003
Begin ofRecovery
Car rental industry historical - USA
3
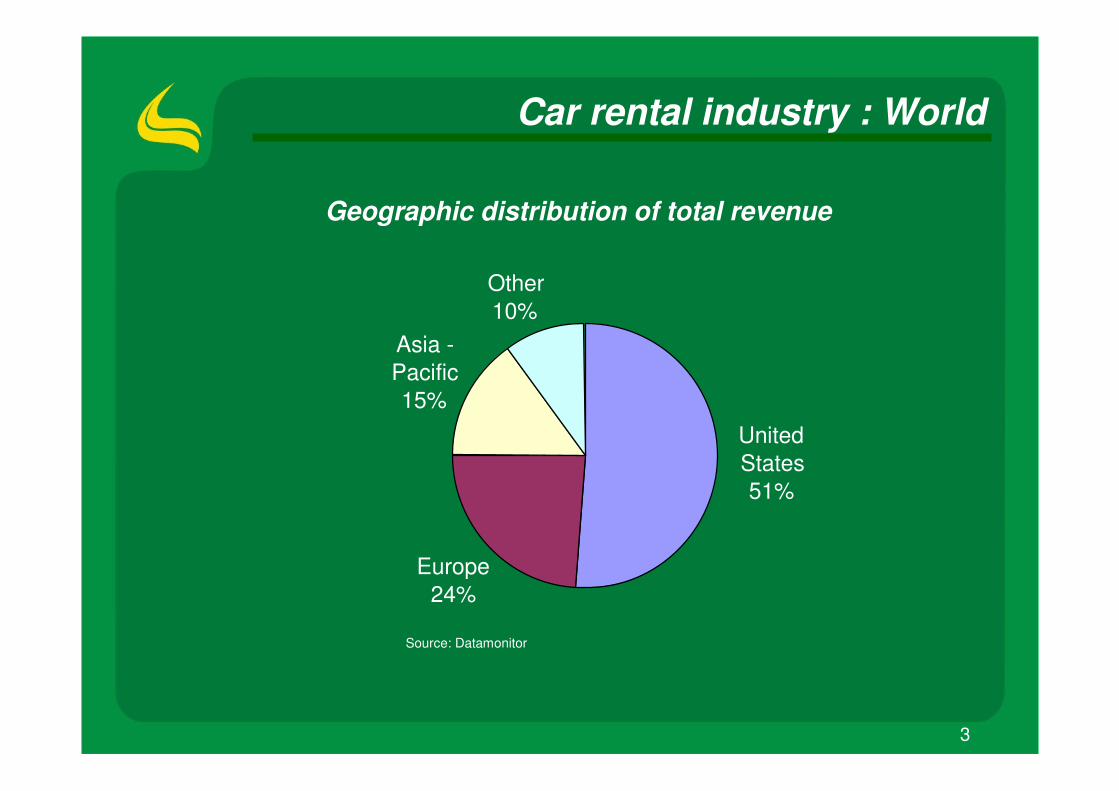
Car rental industry : World
Geographic distribution of total revenue
Source: Datamonitor
UnitedStates51%
Europe24%
Asia -Pacific15%
Other10%
4
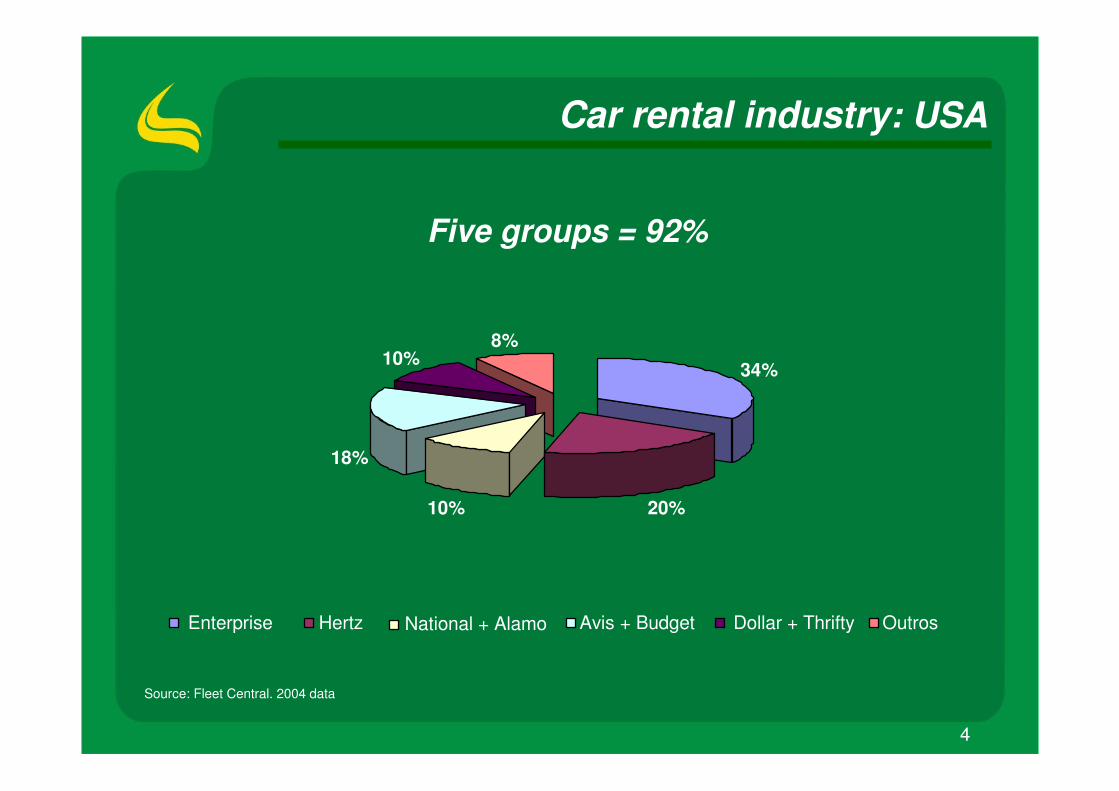
Car rental industry: USA
Source: Fleet Central. 2004 data
Five groups = 92%
34%
20%10%
18%
10%8%
Enterprise Hertz National + Alamo Avis + Budget Dollar + Thrifty Outros
5
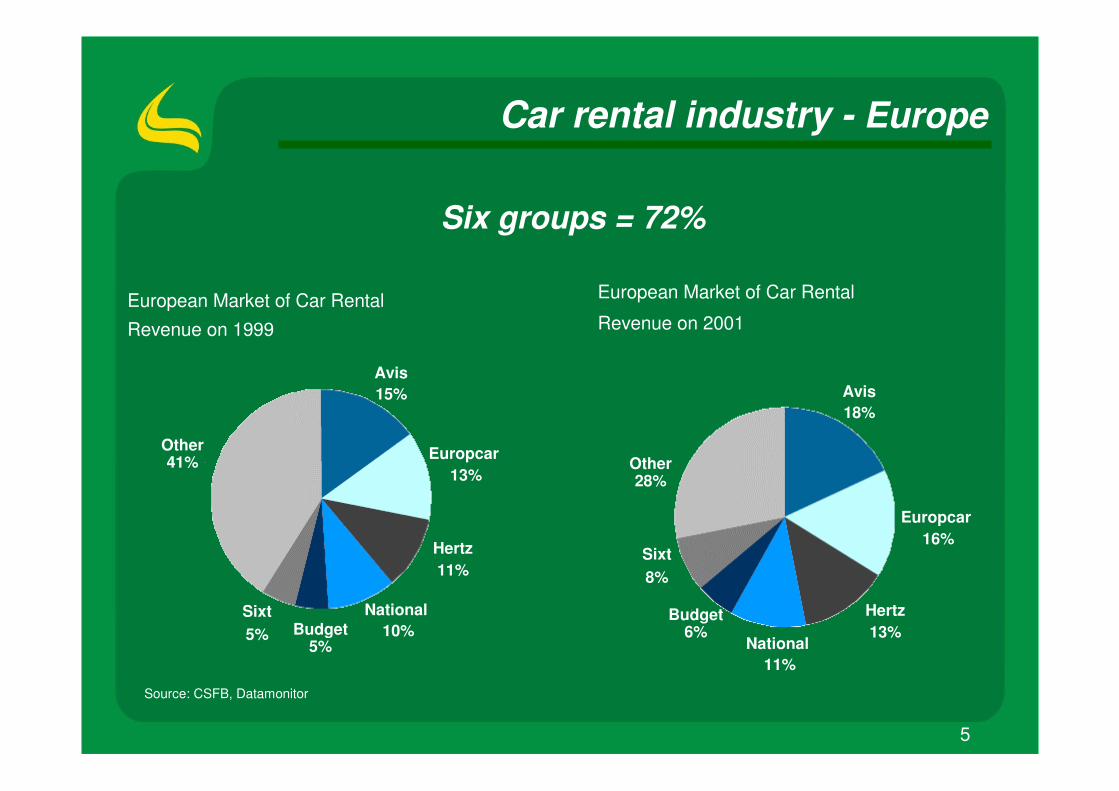
Car rental industry - Europe
Source: CSFB, Datamonitor
European Market of Car RentalRevenue on 1999
Other41%
Sixt5%
Hertz11%
National10%
Avis 15%
Budget 5%
Europcar13%
European Market of Car Rental
Revenue on 2001
Other28%
Sixt8%
Hertz13%
National11%
Avis 18%
Budget 6%
Europcar16%
Six groups = 72%
6
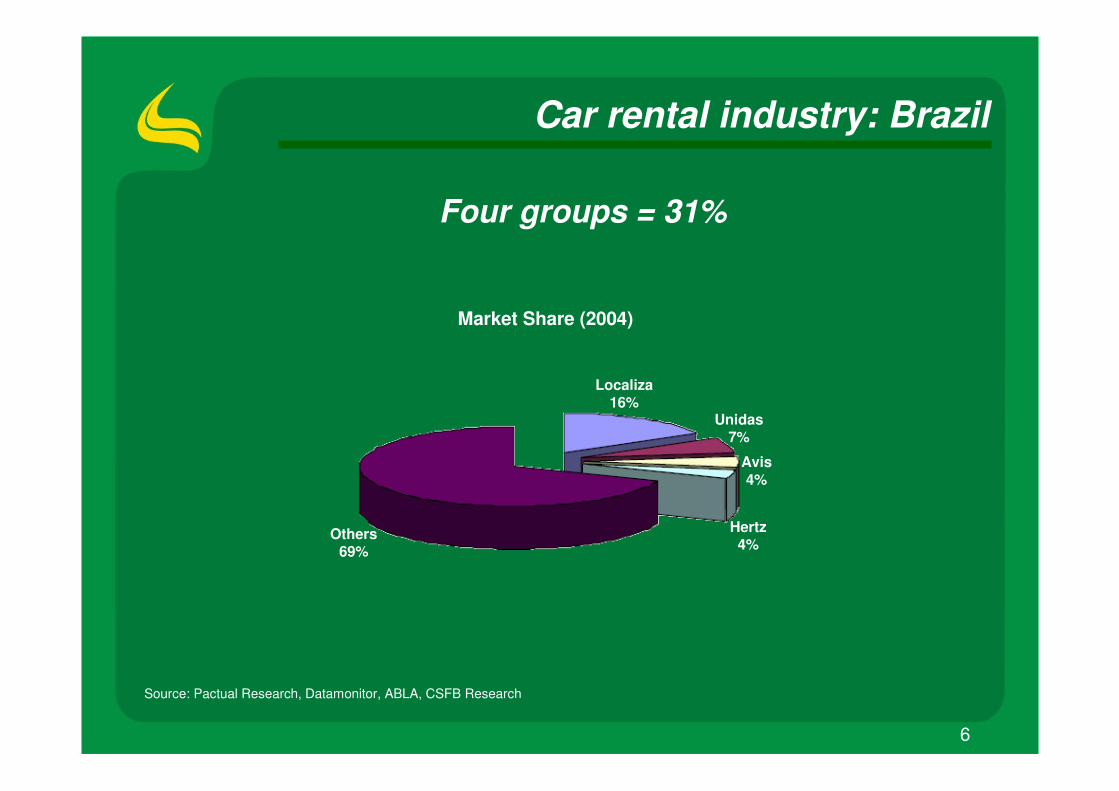
Car rental industry: Brazil
Source: Pactual Research, Datamonitor, ABLA, CSFB Research
Market Share (2004)
Localiza 16%
Unidas7%
Avis4%
Hertz4%
Four groups = 31%
Others69%
7
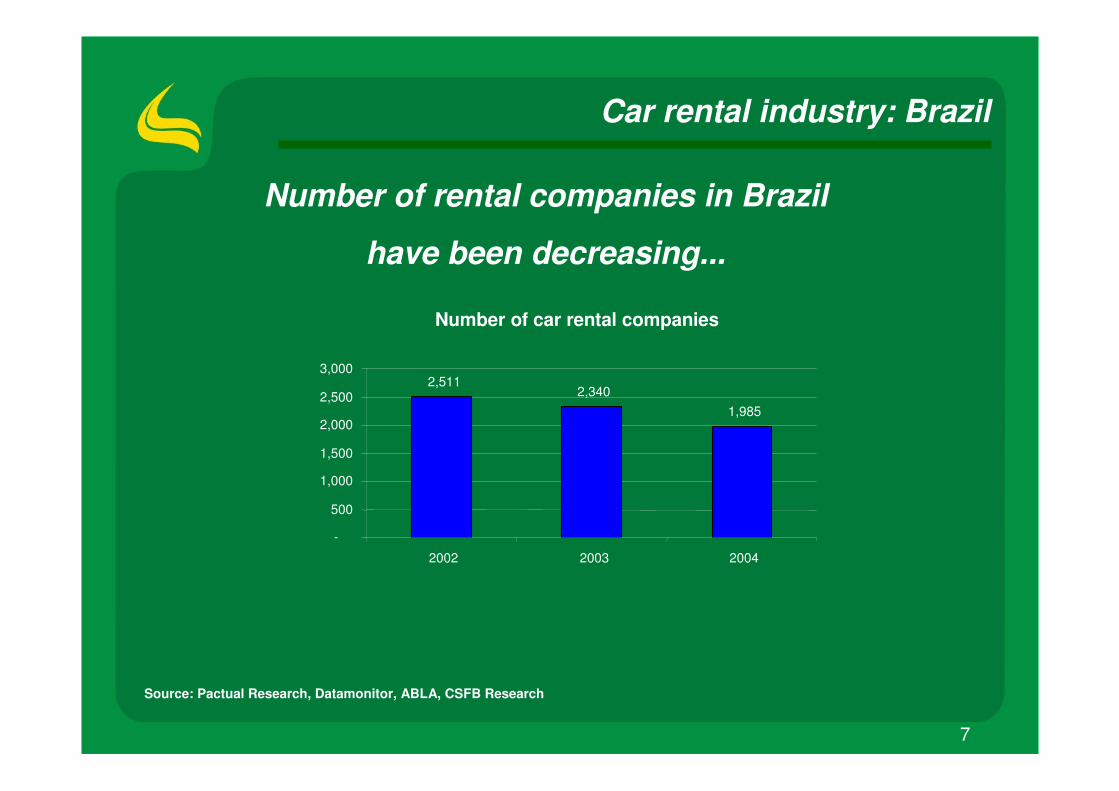
Car rental industry: Brazil
Source: Pactual Research, Datamonitor, ABLA, CSFB Research
Number of car rental companies
Number of rental companies in Brazil
have been decreasing...
2,5112,340
1,985
-
500
1,000
1,500
2,000
2,500
3,000
2002 2003 2004
8
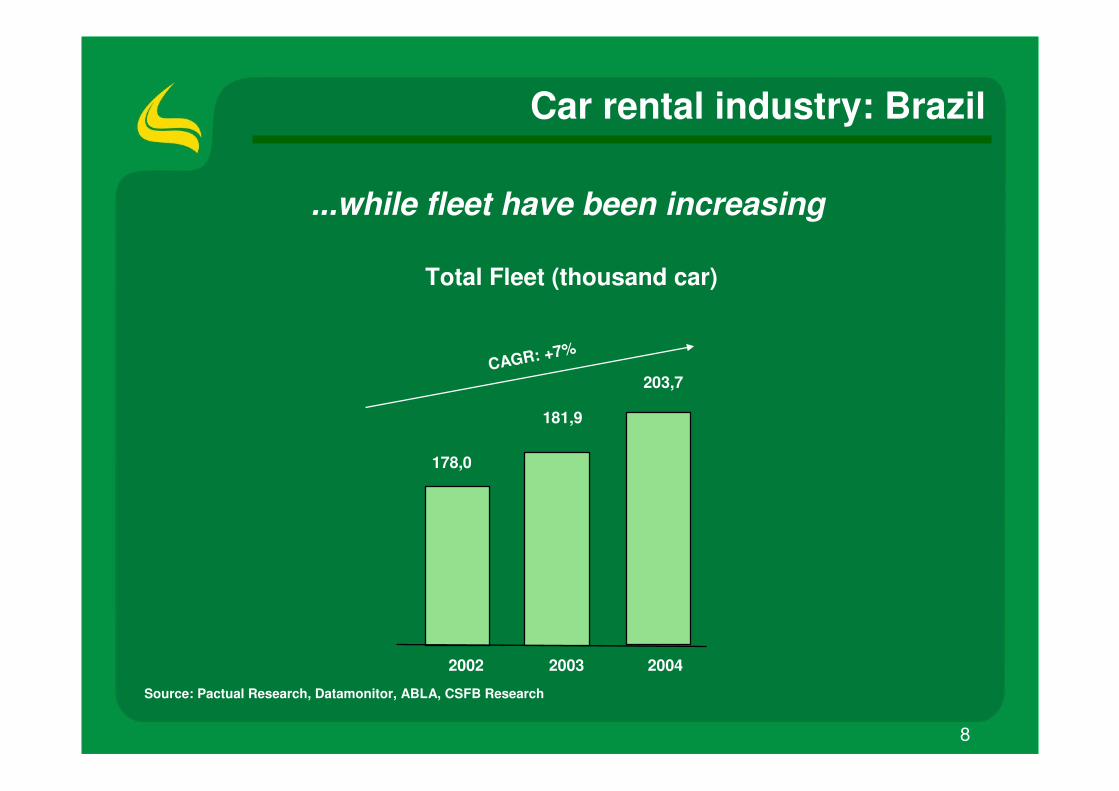
Car rental industry: Brazil
Total Fleet (thousand car)
CAGR: +7%
178,0
181,9
203,7
2002 2003 2004
...while fleet have been increasing
Source: Pactual Research, Datamonitor, ABLA, CSFB Research
9
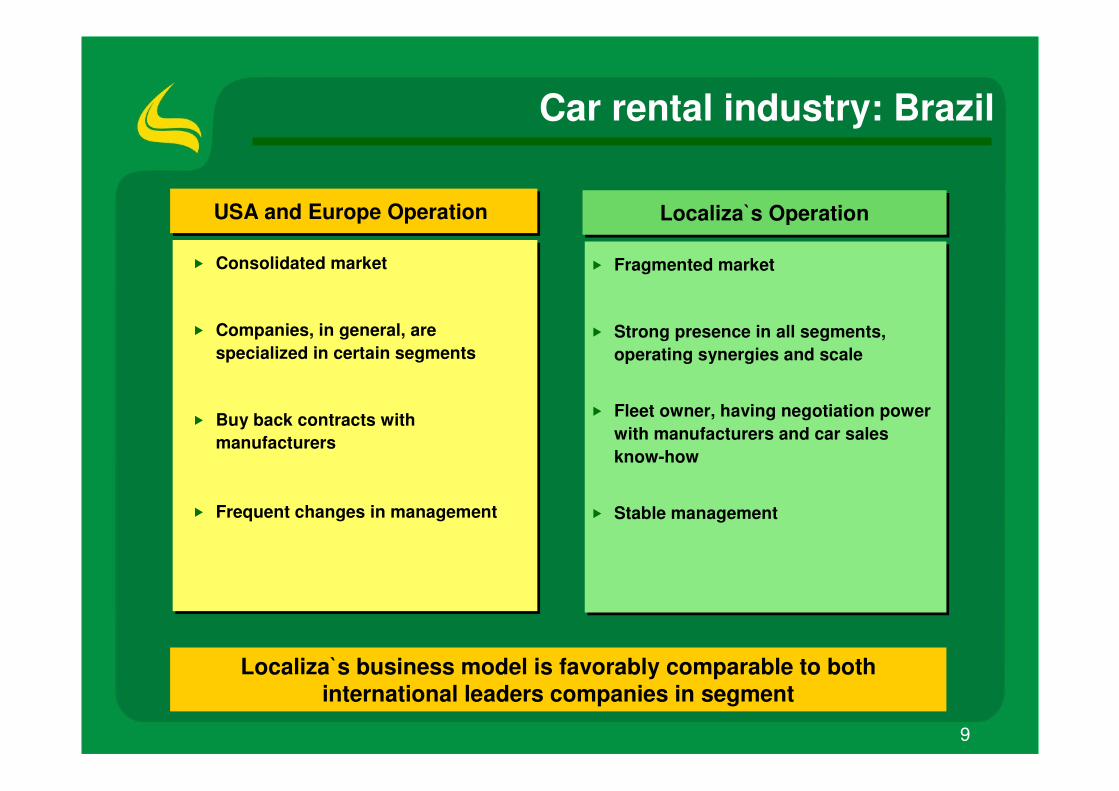
Car rental industry: Brazil
� Fragmented market
� Strong presence in all segments, operating synergies and scale
� Fleet owner, having negotiation power with manufacturers and car sales know-how
� Stable management
� Consolidated market
� Companies, in general, are specialized in certain segments
� Buy back contracts with manufacturers
� Frequent changes in management
Localiza`s OperationLocaliza`s OperationUSA and Europe Operation USA and Europe Operation
Localiza`s business model is favorably comparable to both international leaders companies in segment
10
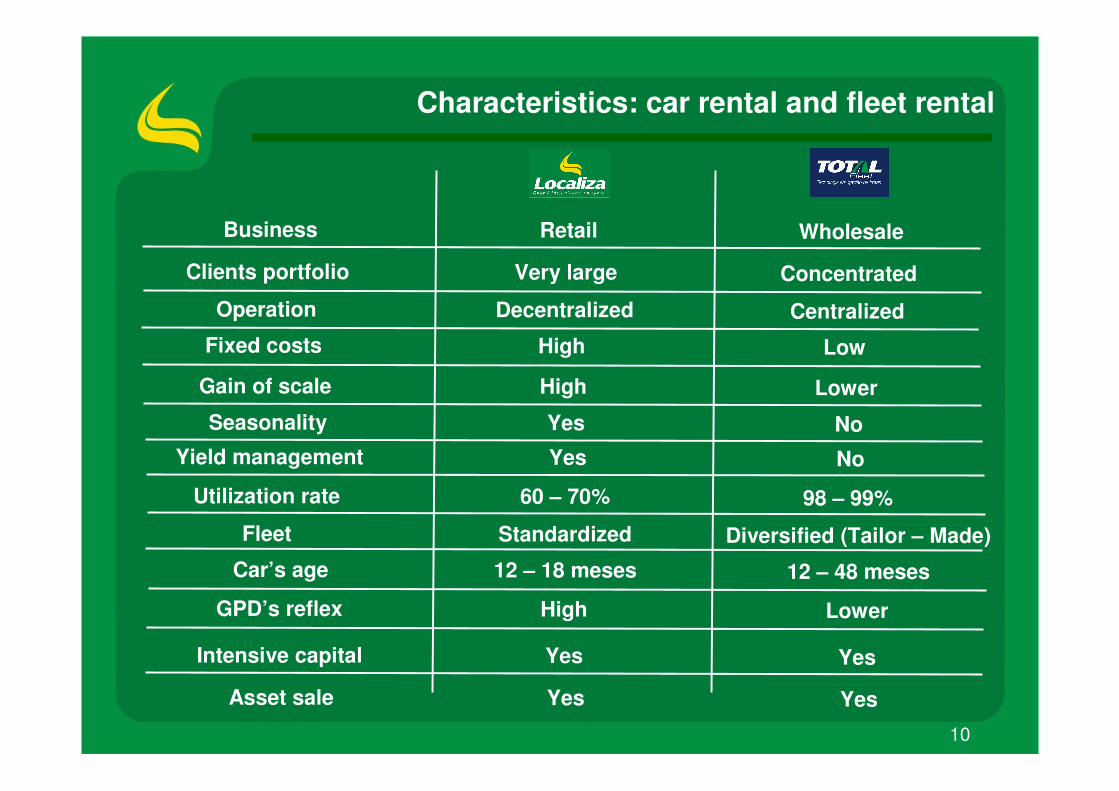
Characteristics: car rental and fleet rental
Retail WholesaleBusiness
Very large ConcentratedClients portfolio
Decentralized CentralizedOperation
High LowFixed costs
High LowerGain of scale
Yes NoSeasonality
Yes NoYield management
60 – 70% 98 – 99%Utilization rate
Standardized Diversified (Tailor – Made)Fleet
12 – 18 meses 12 – 48 mesesCar’s age
High LowerGPD’s reflex
Yes YesIntensive capital
Yes YesAsset sale
11
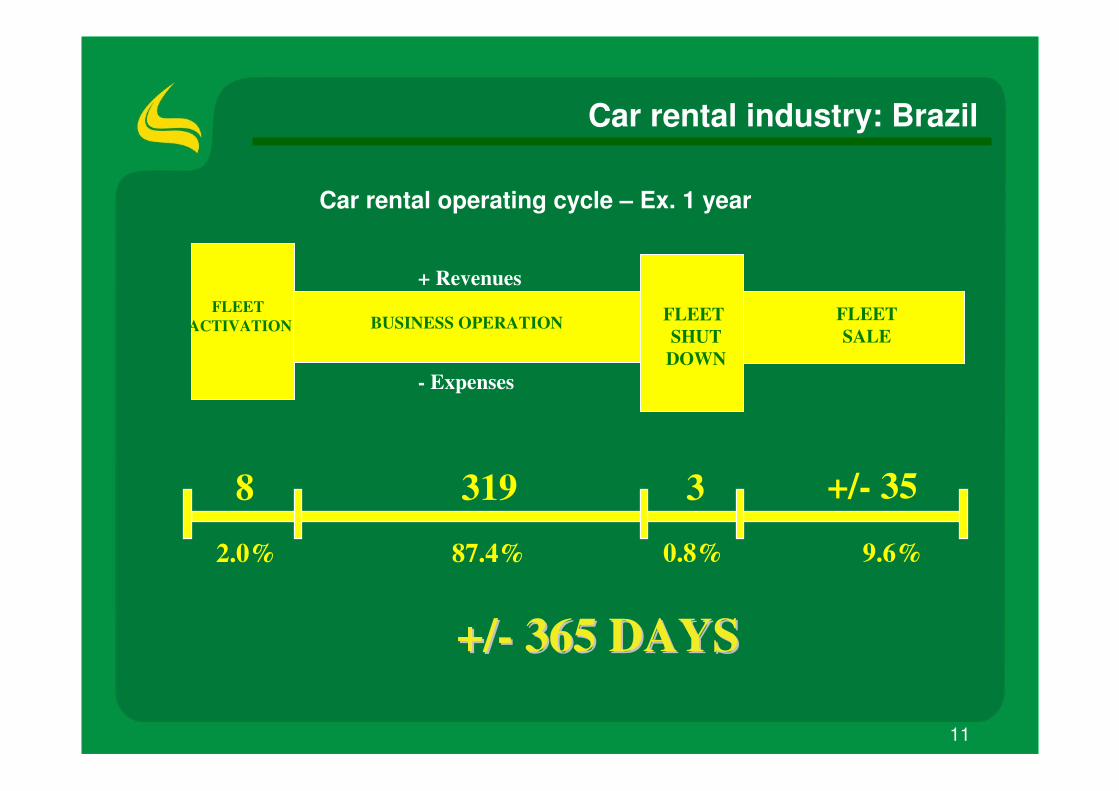
FLEET SALE
FLEET ACTIVATION BUSINESS OPERATION FLEET
SHUTDOWN
8 319 3 +/- 35
0.8% 9.6%
+/+/-- 365 DAYS365 DAYS
+ Revenues
- Expenses
2.0% 87.4%
Car rental operating cycle – Ex. 1 year
Car rental industry: Brazil
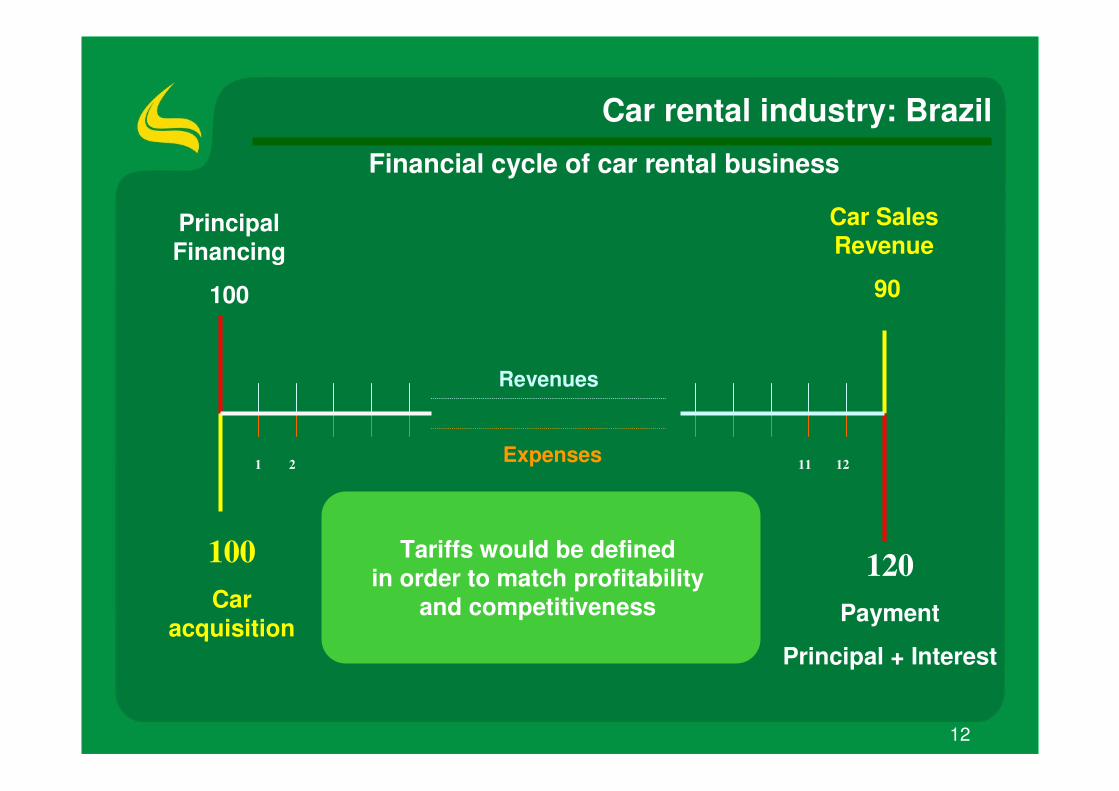
12
Principal Financing
100
120Payment
Principal + Interest
100Car
acquisition
Car Sales Revenue
90
Revenues
Expenses1 2 1211
Car rental industry: Brazil
Tariffs would be definedin order to match profitability
and competitiveness
Financial cycle of car rental business
13
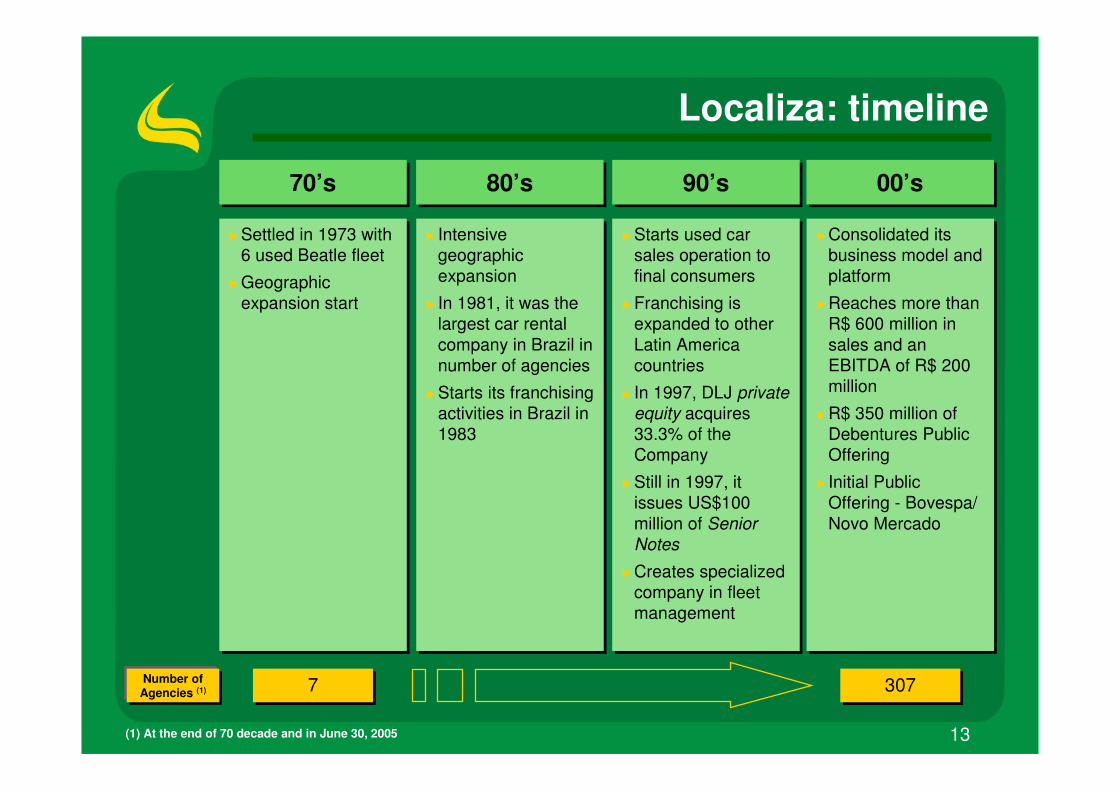
Localiza: timeline
� Settled in 1973 with 6 used Beatle fleet
� Geographic expansion start
� Settled in 1973 with 6 used Beatle fleet
� Geographic expansion start
70’s70’s 80’s80’s 90’s90’s 00’s00’s
� Intensive geographic expansion
� In 1981, it was the largest car rental company in Brazil in number of agencies
� Starts its franchising activities in Brazil in 1983
� Intensive geographic expansion
� In 1981, it was the largest car rental company in Brazil in number of agencies
� Starts its franchising activities in Brazil in 1983
� Starts used car sales operation to final consumers
� Franchising is expanded to other Latin America countries
� In 1997, DLJ private equity acquires 33.3% of the Company
� Still in 1997, it issues US$100 million of Senior Notes
� Creates specialized company in fleet management
� Starts used car sales operation to final consumers
� Franchising is expanded to other Latin America countries
� In 1997, DLJ private equity acquires 33.3% of the Company
� Still in 1997, it issues US$100 million of Senior Notes
� Creates specialized company in fleet management
� Consolidated its business model and platform
� Reaches more than R$ 600 million in sales and an EBITDA of R$ 200 million
� R$ 350 million of Debentures Public Offering
� Initial Public Offering - Bovespa/ Novo Mercado
� Consolidated its business model and platform
� Reaches more than R$ 600 million in sales and an EBITDA of R$ 200 million
� R$ 350 million of Debentures Public Offering
� Initial Public Offering - Bovespa/ Novo Mercado
77 307307
(1) At the end of 70 decade and in June 30, 2005
Number of Agencies (1)
14
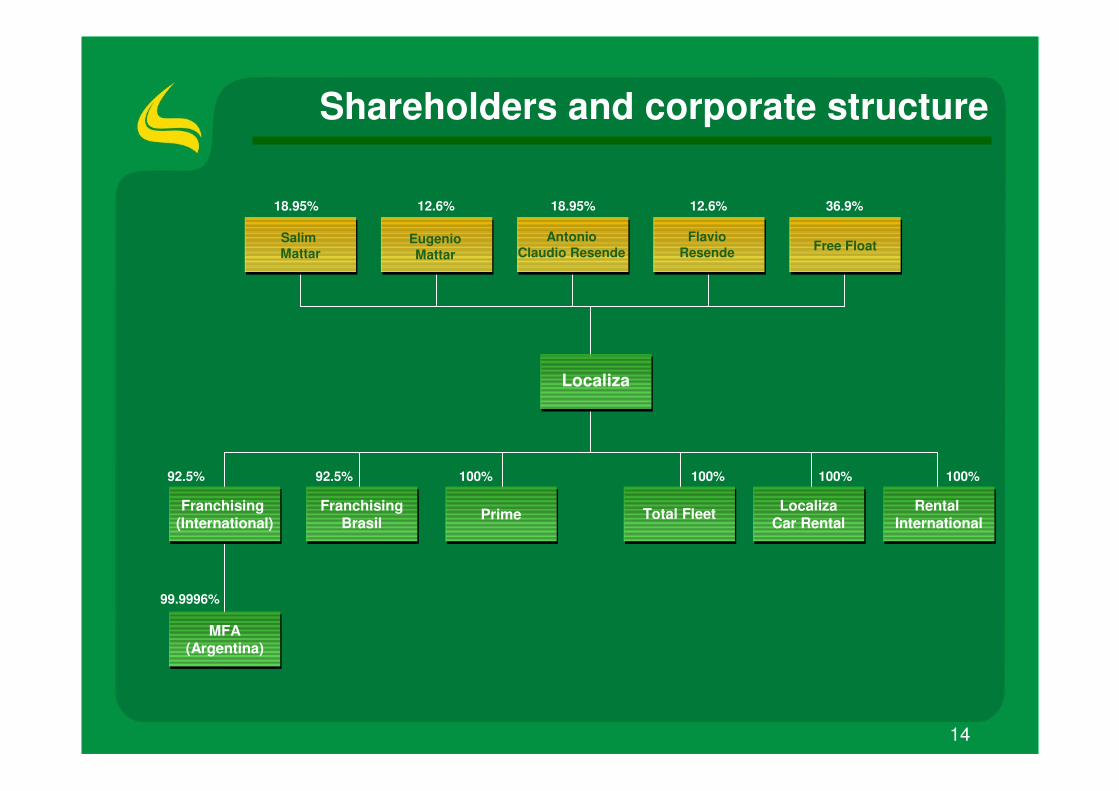
Shareholders and corporate structure
Localiza
MFA(Argentina)
99.9996%
EugenioMattar
AntonioClaudio Resende
FlavioResende Free Float
18.95% 12.6% 18.95% 12.6% 36.9%
Franchising (International) Prime Total FleetFranchising
Brasil
100%100%92.5%
LocalizaCar Rental
100%92.5%
Salim Mattar
RentalInternational
100%
15
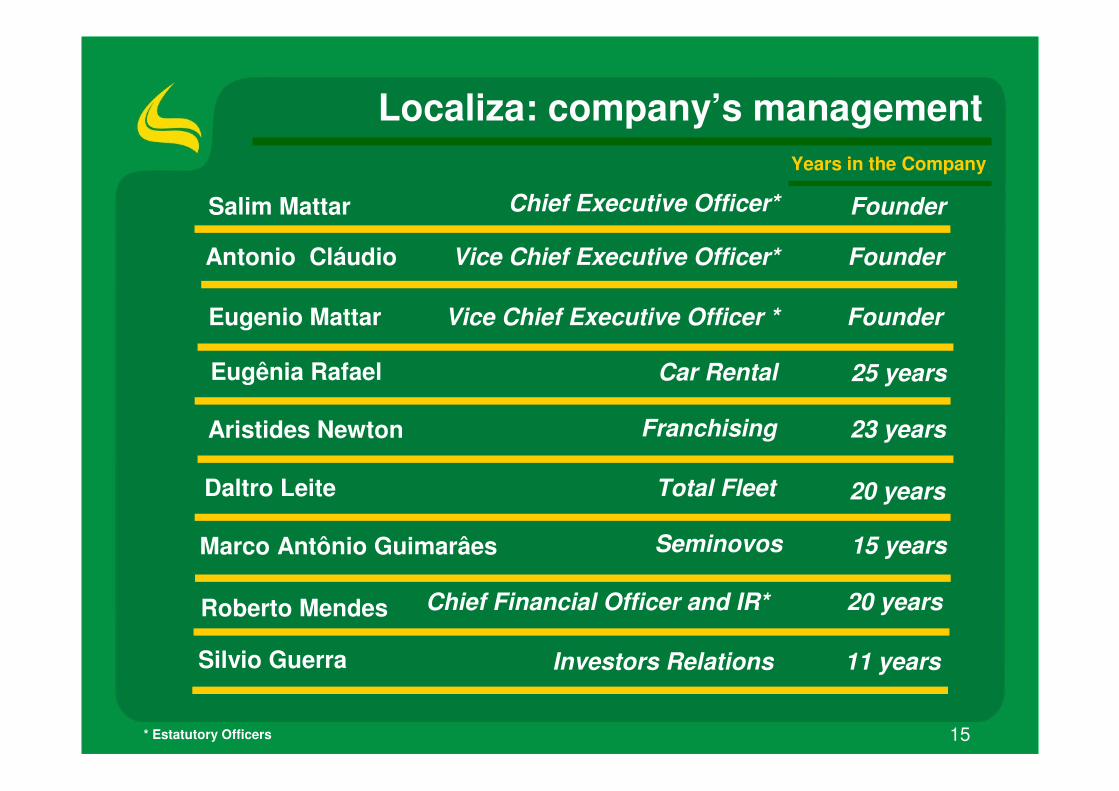
Localiza: company’s management
* Estatutory Officers
Chief Executive Officer*Salim Mattar
Vice Chief Executive Officer*
Eugenio Mattar
Antonio Cláudio
Vice Chief Executive Officer *
Founder
Founder
Founder
Chief Financial Officer and IR*Roberto Mendes 20 years
Aristides Newton Franchising 23 years
Investors RelationsSilvio Guerra 11 years
Eugênia Rafael Car Rental 25 years
Daltro Leite Total Fleet 20 years
Marco Antônio Guimarâes Seminovos 15 years
Years in the Company
16
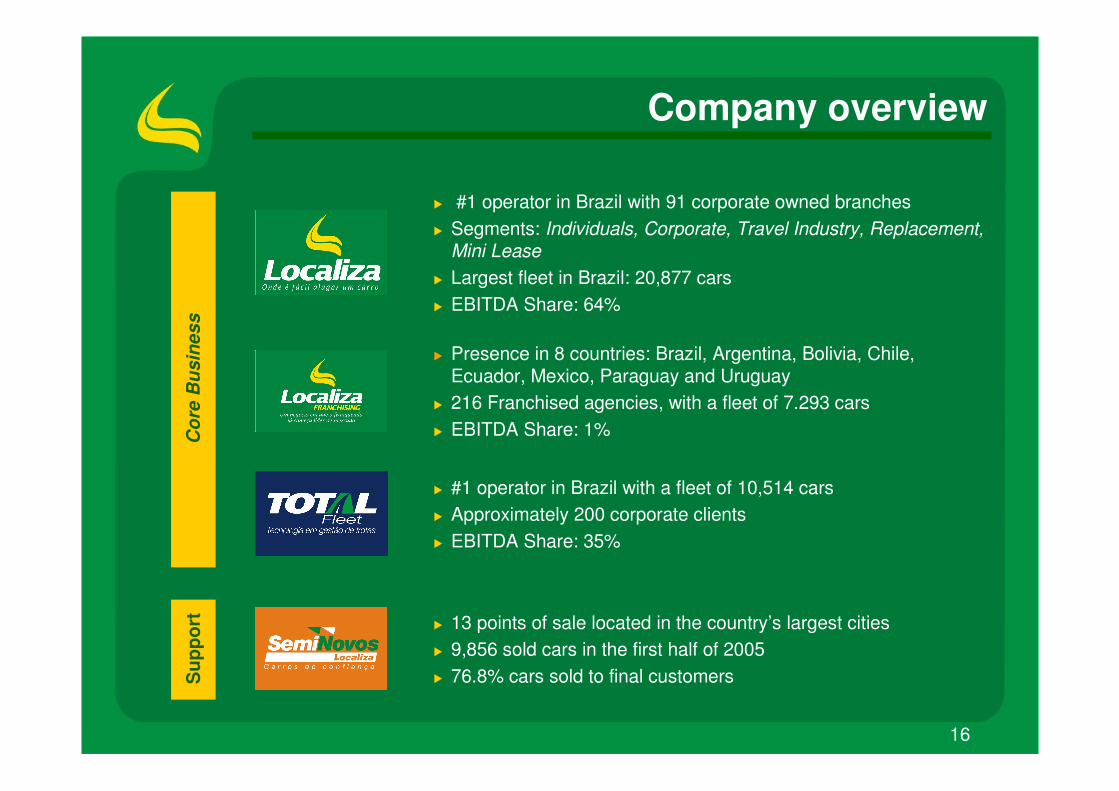
Company overview
Cor
e B
usin
ess
Sup
port
� #1 operator in Brazil with 91 corporate owned branches� Segments: Individuals, Corporate, Travel Industry, Replacement,
Mini Lease� Largest fleet in Brazil: 20,877 cars� EBITDA Share: 64%
� #1 operator in Brazil with a fleet of 10,514 cars� Approximately 200 corporate clients� EBITDA Share: 35%
� Presence in 8 countries: Brazil, Argentina, Bolivia, Chile, Ecuador, Mexico, Paraguay and Uruguay
� 216 Franchised agencies, with a fleet of 7.293 cars� EBITDA Share: 1%
� 13 points of sale located in the country’s largest cities � 9,856 sold cars in the first half of 2005� 76.8% cars sold to final customers
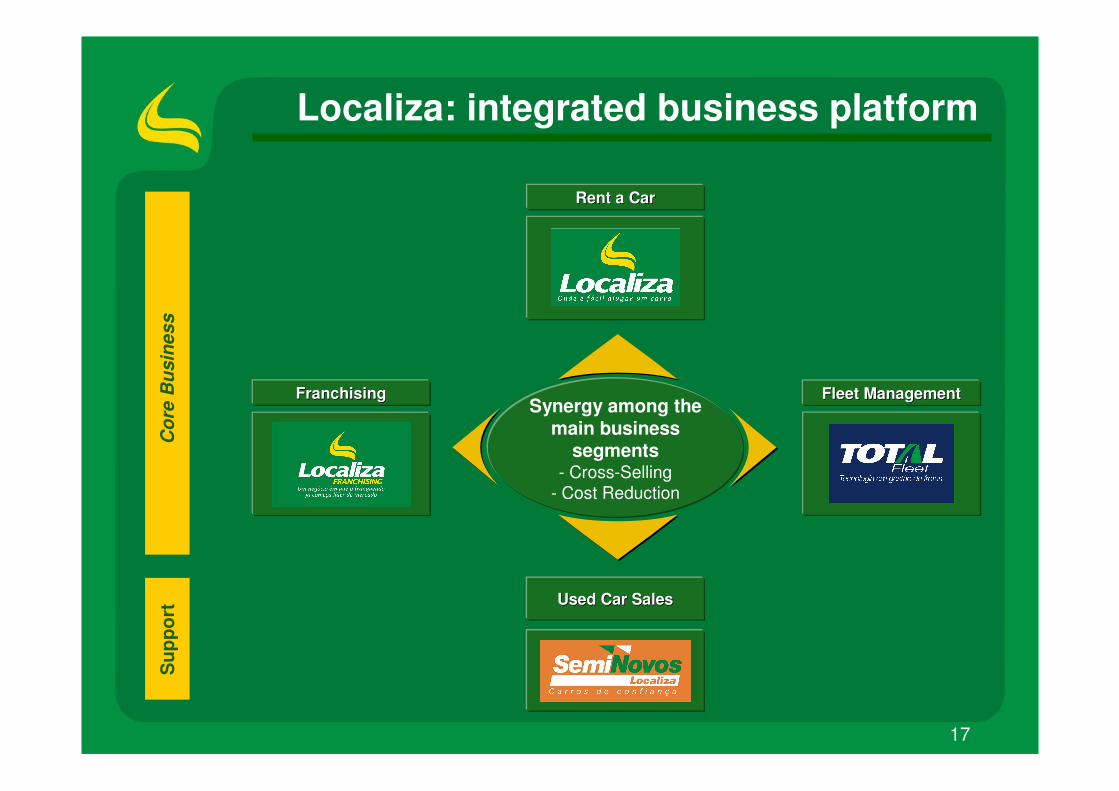
17
Localiza: integrated business platformC
ore
Bus
ines
sS
uppo
rt
Used Car SalesUsed Car Sales
Fleet ManagementFleet ManagementFranchisingFranchising
Rent a CarRent a Car
Synergy among the main business
segments- Cross-Selling
- Cost Reduction
18
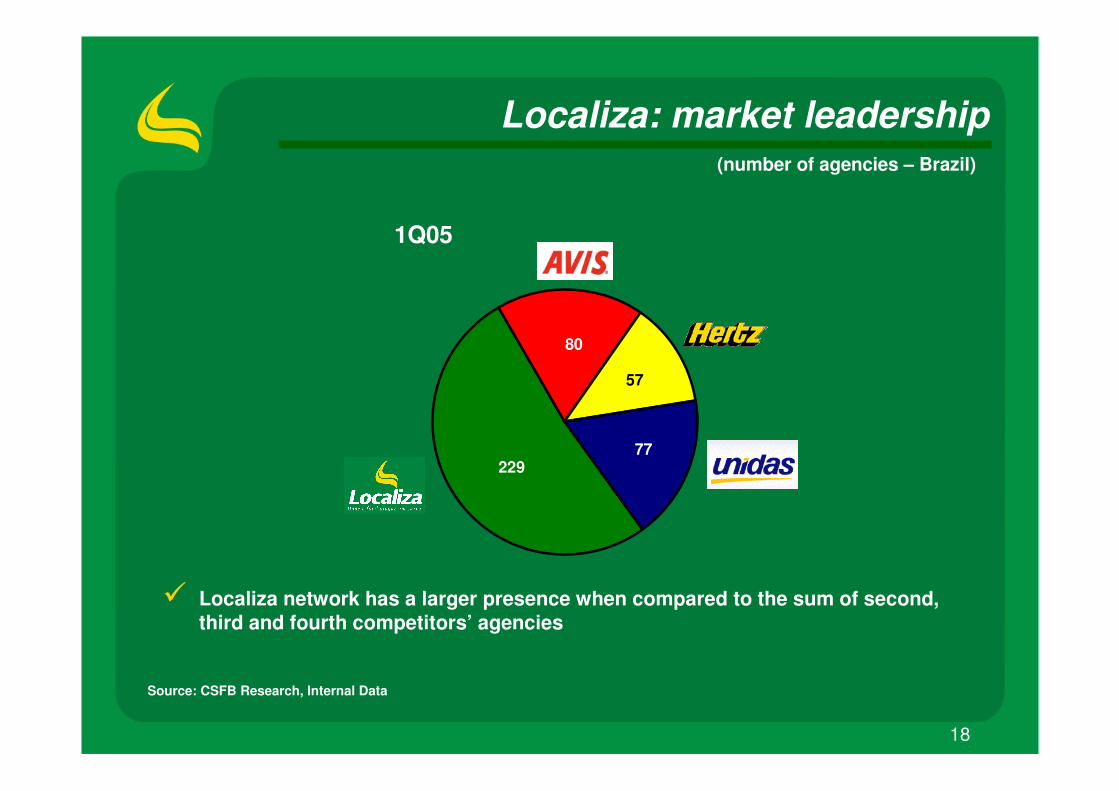
Localiza: market leadership
Source: CSFB Research, Internal Data
� Localiza network has a larger presence when compared to the sum of second, third and fourth competitors’ agencies
(number of agencies – Brazil)
80
57
77229
1Q05
19
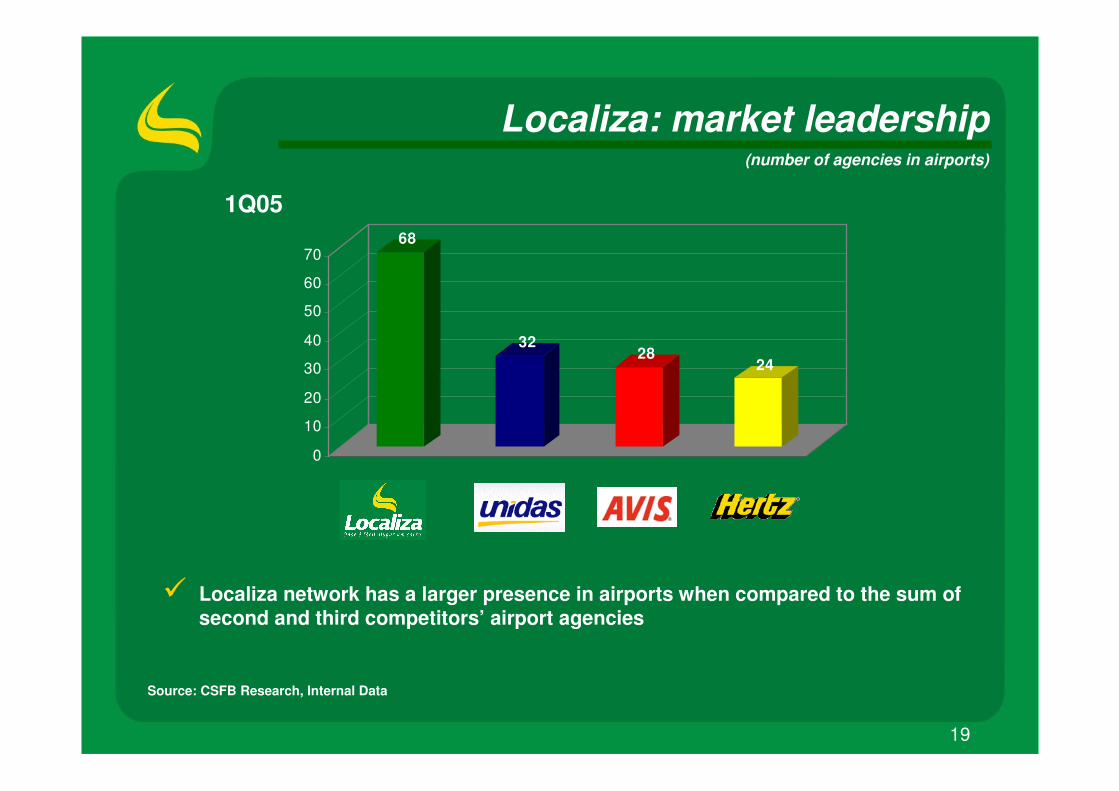
Localiza: market leadership(number of agencies in airports)
Source: CSFB Research, Internal Data
� Localiza network has a larger presence in airports when compared to the sum of second and third competitors’ airport agencies
68
3228
24
0
10
20
30
40
50
60
70
1Q05
20
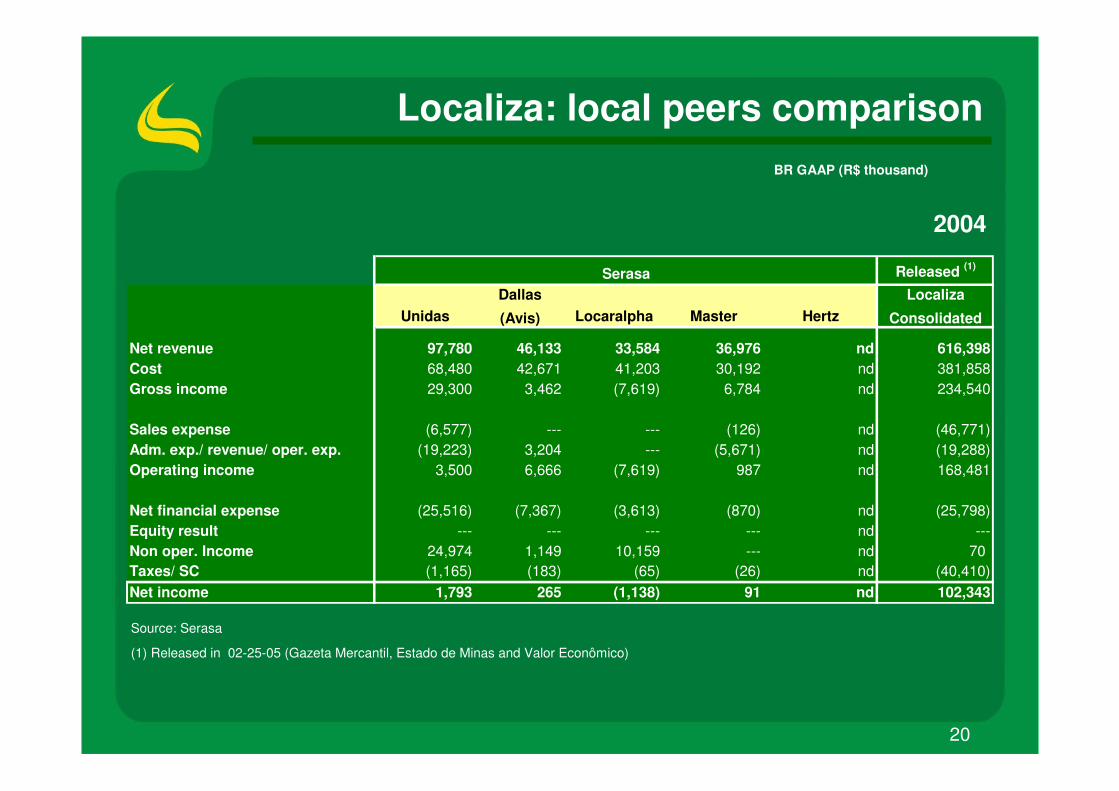
Localiza: local peers comparisonBR GAAP (R$ thousand)
Source: Serasa
(1) Released in 02-25-05 (Gazeta Mercantil, Estado de Minas and Valor Econômico)
2004
Released (1)
UnidasDallas
(Avis) Locaralpha Master HertzLocaliza
Consolidated
Net revenue 97,780 46,133 33,584 36,976 nd 616,398Cost 68,480 42,671 41,203 30,192 nd 381,858Gross income 29,300 3,462 (7,619) 6,784 nd 234,540
Sales expense (6,577) --- --- (126) nd (46,771)Adm. exp./ revenue/ oper. exp. (19,223) 3,204 --- (5,671) nd (19,288)Operating income 3,500 6,666 (7,619) 987 nd 168,481
Net financial expense (25,516) (7,367) (3,613) (870) nd (25,798)Equity result --- --- --- --- nd ---Non oper. Income 24,974 1,149 10,159 --- nd 70Taxes/ SC (1,165) (183) (65) (26) nd (40,410)Net income 1,793 265 (1,138) 91 nd 102,343
Serasa
21
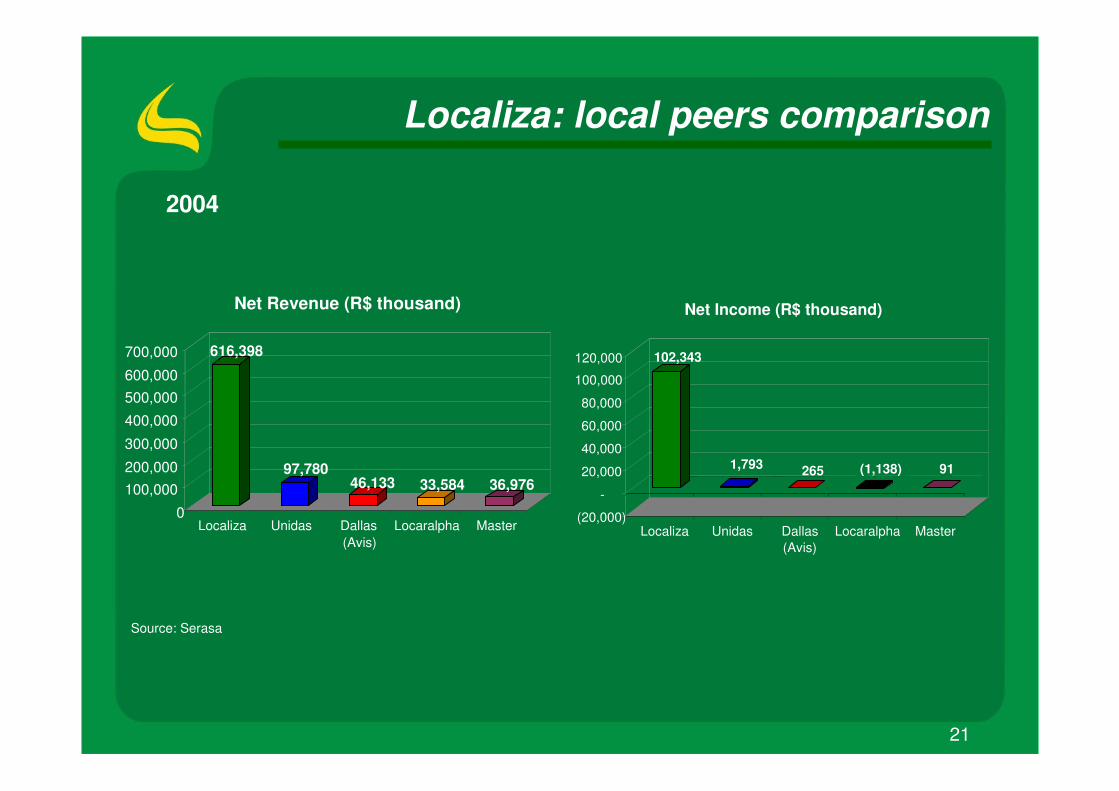
Localiza: local peers comparison
Source: Serasa
2004
616,398
97,78046,133 33,584 36,976
0
100,000200,000
300,000
400,000
500,000600,000
700,000
Localiza Unidas Dallas(Avis)
Locaralpha Master
Net Revenue (R$ thousand)
102,343
1,793 265 (1,138) 91
(20,000)
-
20,000
40,000
60,000
80,000
100,000
120,000
Localiza Unidas Dallas(Avis)
Locaralpha Master
Net Income (R$ thousand)
22
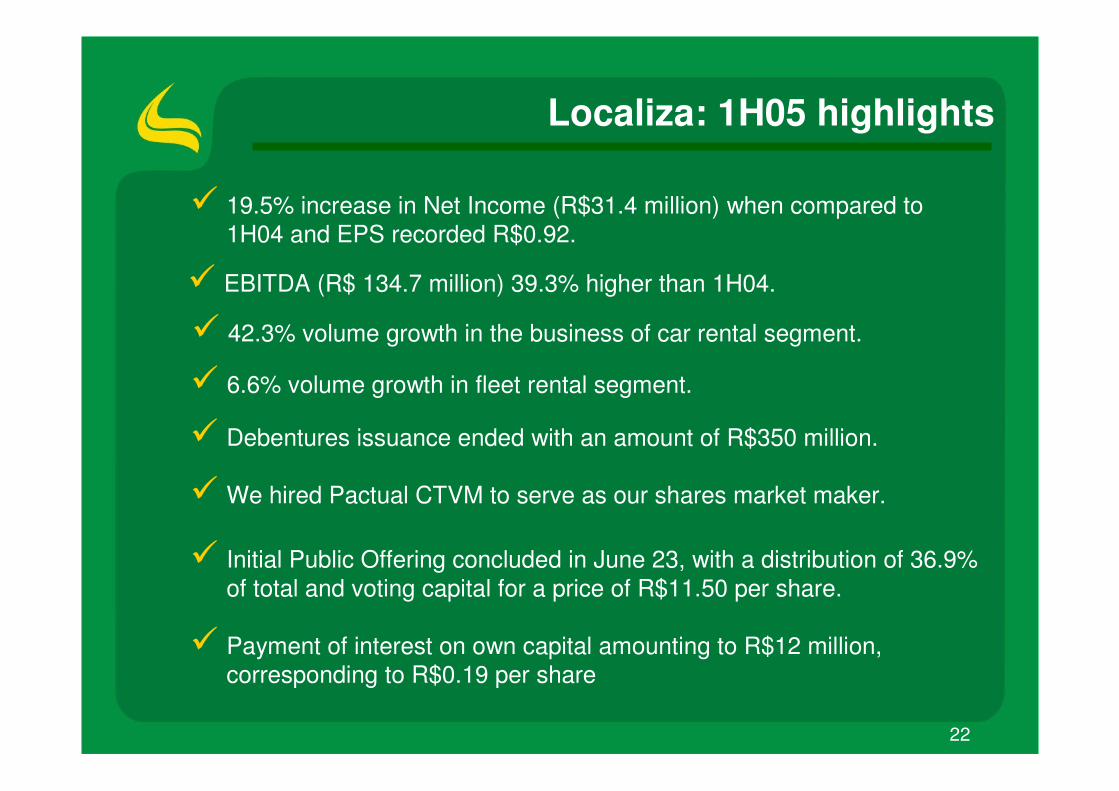
Localiza: 1H05 highlights
� 19.5% increase in Net Income (R$31.4 million) when compared to 1H04 and EPS recorded R$0.92.
� 42.3% volume growth in the business of car rental segment.
� 6.6% volume growth in fleet rental segment.
� Debentures issuance ended with an amount of R$350 million.
� We hired Pactual CTVM to serve as our shares market maker.
� Initial Public Offering concluded in June 23, with a distribution of 36.9% of total and voting capital for a price of R$11.50 per share.
� Payment of interest on own capital amounting to R$12 million, corresponding to R$0.19 per share
� EBITDA (R$ 134.7 million) 39.3% higher than 1H04.
23
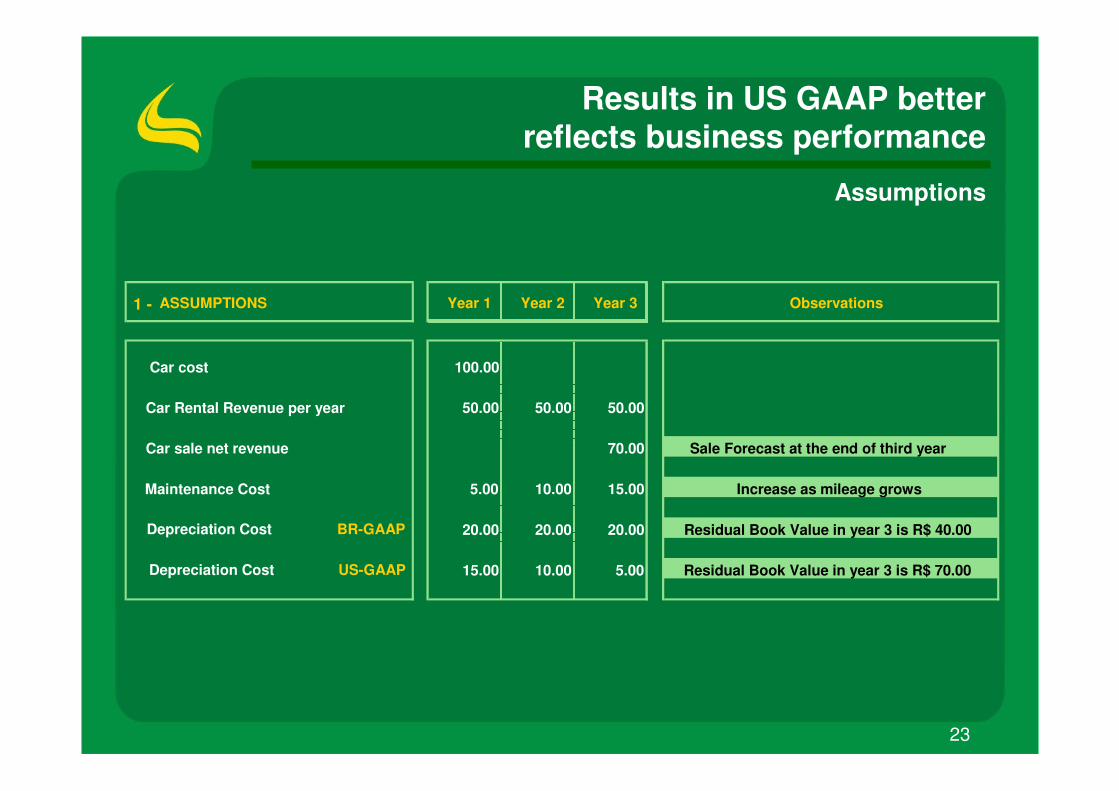
1 - ASSUMPTIONS Year 1 Year 2 Year 3 Observations
Car cost 100.00
Car Rental Revenue per year 50.00 50.00 50.00
Car sale net revenue 70.00 Sale Forecast at the end of third year
Maintenance Cost 5.00 10.00 15.00 Increase as mileage grows
Depreciation Cost BR-GAAP 20.00 20.00 20.00 Residual Book Value in year 3 is R$ 40.00
Depreciation Cost US-GAAP 15.00 10.00 5.00 Residual Book Value in year 3 is R$ 70.00
Results in US GAAP betterreflects business performance
Assumptions
24
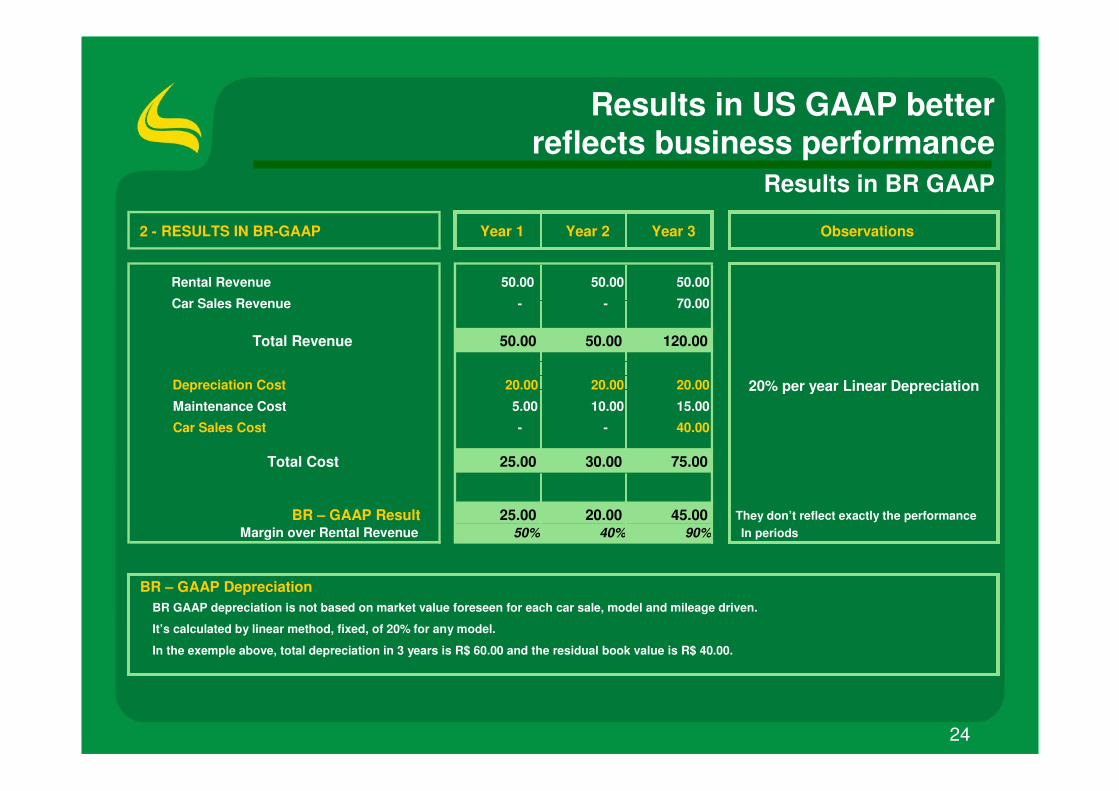
2 - RESULTS IN BR-GAAP Year 1 Year 2 Year 3 Observations
Rental Revenue 50.00 50.00 50.00
Car Sales Revenue - - 70.00
Total Revenue 50.00 50.00 120.00
Depreciation Cost 20.00 20.00 20.00 20% per year Linear DepreciationMaintenance Cost 5.00 10.00 15.00
Car Sales Cost - - 40.00
Total Cost 25.00 30.00 75.00
BR – GAAP Result 25.00 20.00 45.00 They don’t reflect exactly the performance Margin over Rental Revenue 50% 40% 90% In periods
BR – GAAP Depreciation
Results in US GAAP betterreflects business performance
Results in BR GAAP
BR GAAP depreciation is not based on market value foreseen for each car sale, model and mileage driven.
It’s calculated by linear method, fixed, of 20% for any model.
In the exemple above, total depreciation in 3 years is R$ 60.00 and the residual book value is R$ 40.00.
25
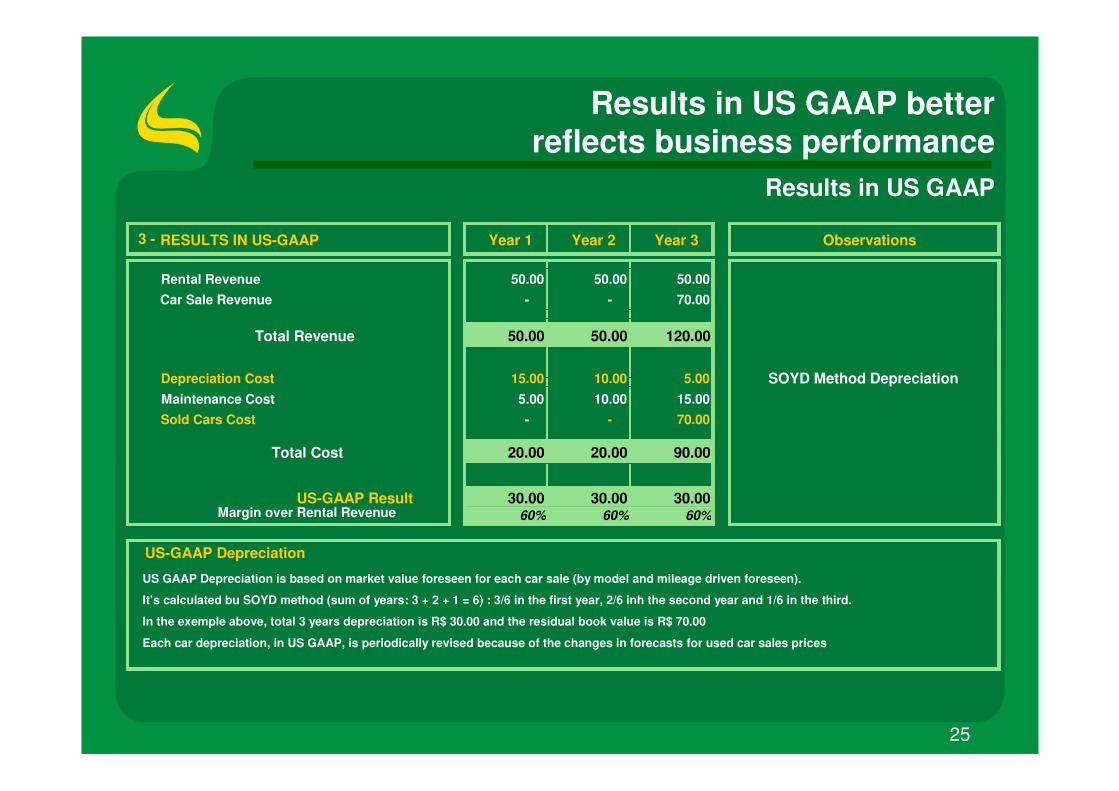
3 - RESULTS IN US-GAAP Year 1 Year 2 Year 3 Observations
Rental Revenue 50.00 50.00 50.00Car Sale Revenue - - 70.00
Total Revenue 50.00 50.00 120.00
Depreciation Cost 15.00 10.00 5.00 SOYD Method DepreciationMaintenance Cost 5.00 10.00 15.00Sold Cars Cost - - 70.00
Total Cost 20.00 20.00 90.00
US-GAAP Result 30.00 30.00 30.00Margin over Rental Revenue 60% 60% 60%
US-GAAP Depreciation
Results in US GAAP betterreflects business performance
Results in US GAAP
US GAAP Depreciation is based on market value foreseen for each car sale (by model and mileage driven foreseen).
It’s calculated bu SOYD method (sum of years: 3 + 2 + 1 = 6) : 3/6 in the first year, 2/6 inh the second year and 1/6 in the third.
In the exemple above, total 3 years depreciation is R$ 30.00 and the residual book value is R$ 70.00
Each car depreciation, in US GAAP, is periodically revised because of the changes in forecasts for used car sales prices
26
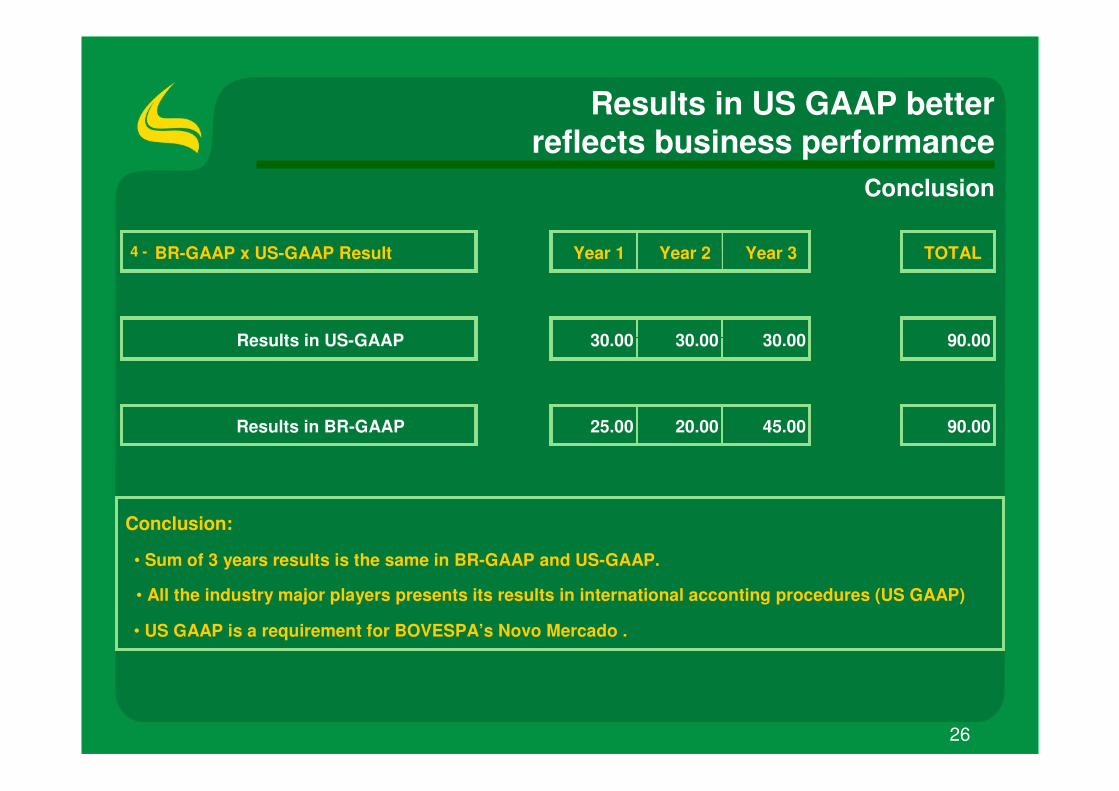
4 - BR-GAAP x US-GAAP Result Year 1 Year 2 Year 3 TOTAL
Results in US-GAAP 30.00 30.00 30.00 90.00
Results in BR-GAAP 25.00 20.00 45.00 90.00
Conclusion:
• Sum of 3 years results is the same in BR-GAAP and US-GAAP.
• All the industry major players presents its results in international acconting procedures (US GAAP)
Results in US GAAP betterreflects business performance
Conclusion
• US GAAP is a requirement for BOVESPA’s Novo Mercado .
27
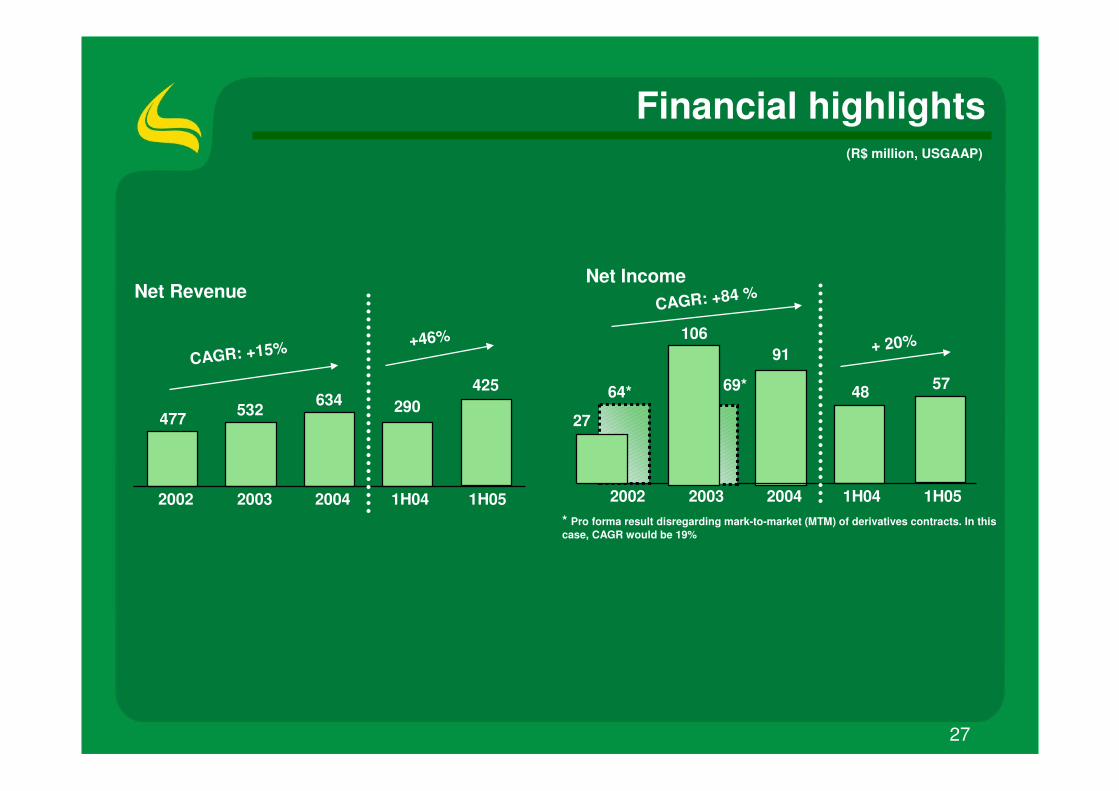
Financial highlights
634 290532477
2002 2003 2004 1H04 1H05
91
48
106
64*
2002 2003 2004 1H04 1H05
Net RevenueNet Income
425 57
CAGR: +84 %
CAGR: +15% +46% + 20%
(R$ million, USGAAP)
27
69*
* Pro forma result disregarding mark-to-market (MTM) of derivatives contracts. In this case, CAGR would be 19%
28
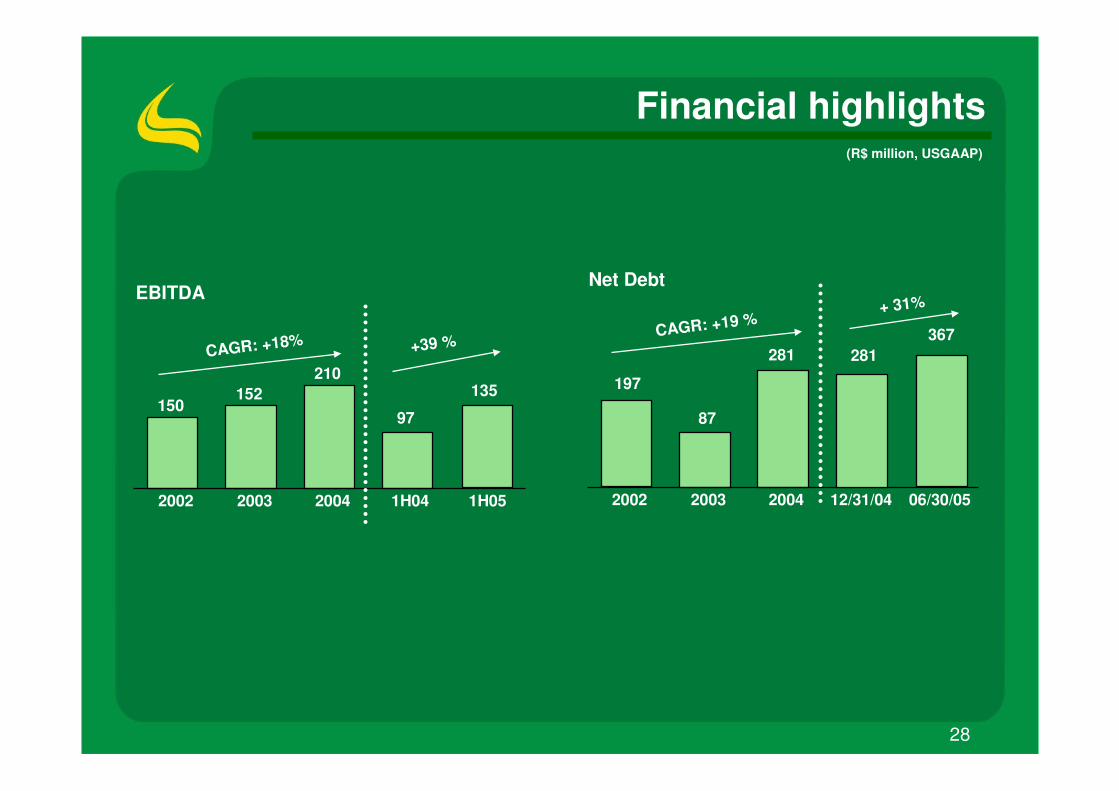
Financial highlights
210
97152
150
2002 2003 2004 1H04 1H05
281
87
2002 2003 2004 12/31/04 06/30/05
EBITDANet Debt
135
367CAGR: +18%
197
+39 %
(R$ million, USGAAP)
281CAGR: +19 %
+ 31%
29
Operating performance
(R$ million, USGAAP)
Net Revenue Fleet EBITDA
76
1H04 1H05
+86%
65
1H04 1H05
69
11,379
1H04 1H05
20,877
8,501*
1H04 1H05
10,514*
51
1H04 1H05
86
45
1H04 1H05
47
+83%
+70%
-9% +24%
+4%
80
88Car Rental
191168
313
Car Sales
54 39
119 108
Car Rental
Car Sales
39%
+6%
122
* Includes managed fleet
30
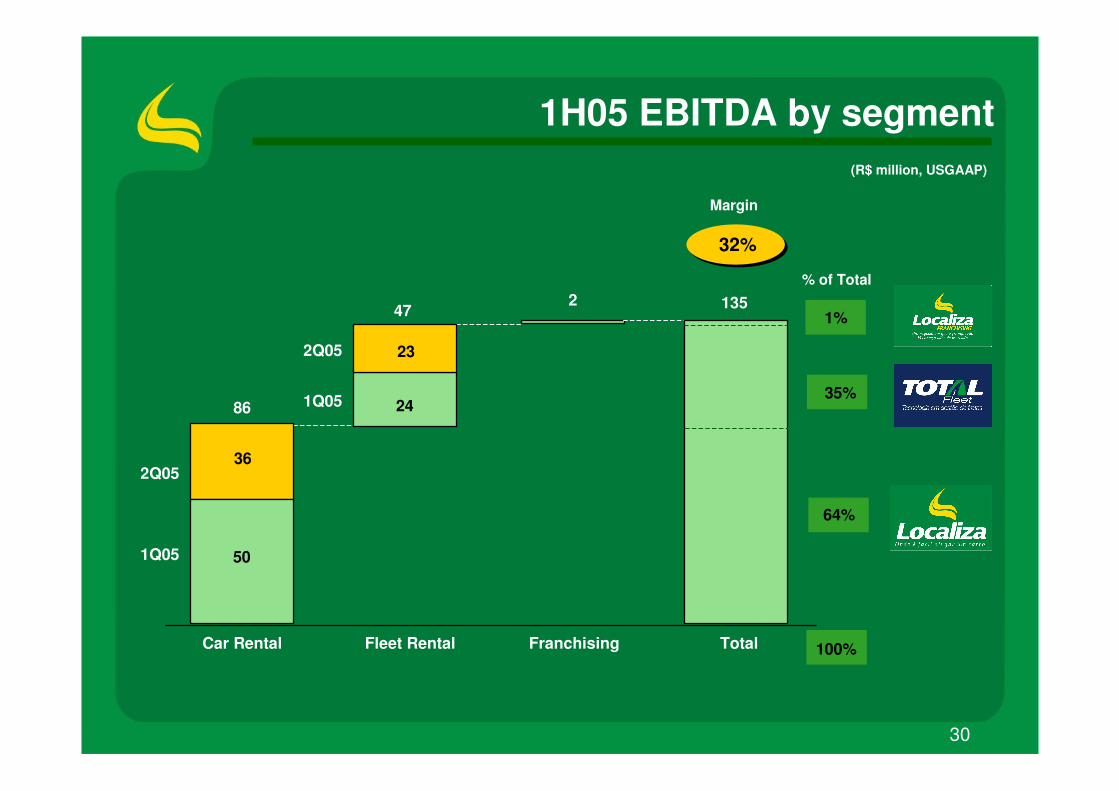
1H05 EBITDA by segment(R$ million, USGAAP)
2Q05
1Q05
Margin
247
Car Rental Fleet Rental Franchising Total
32%
1351%
35%
64%
% of Total
100%
86
50
36
24
232Q05
1Q05
31
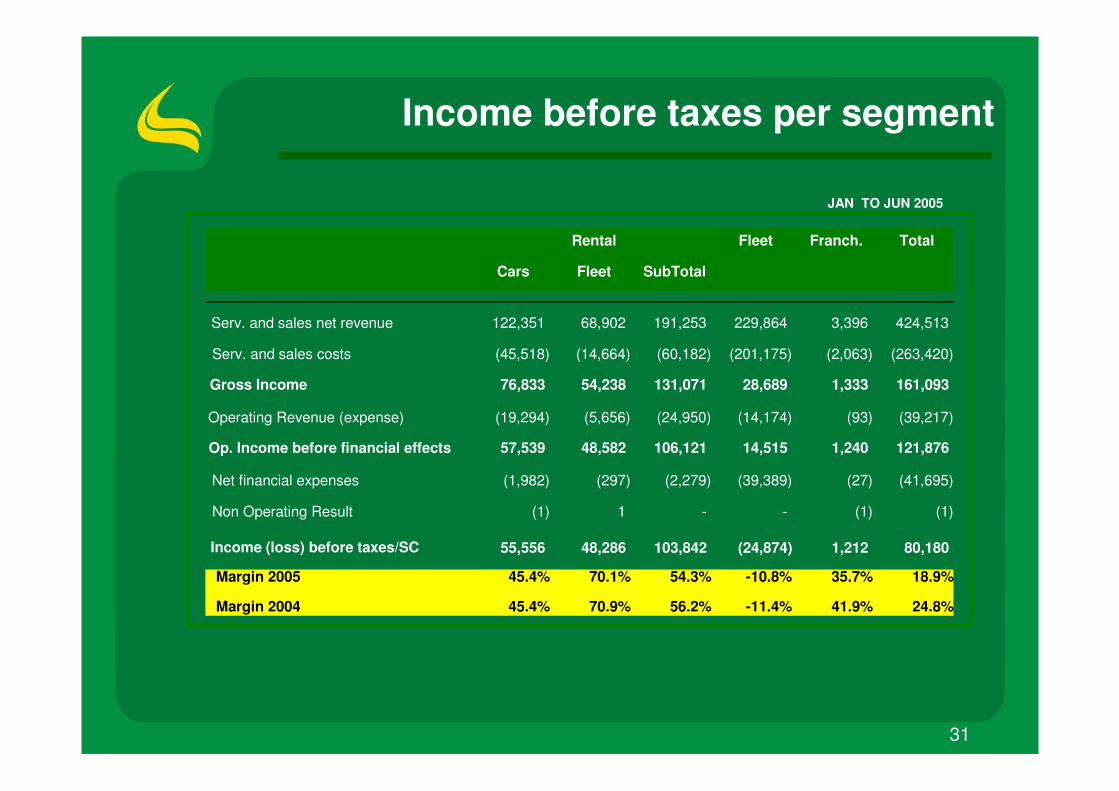
Income before taxes per segment
Fleet Franch. Total
Cars Fleet SubTotal
Serv. and sales net revenue 122,351 68,902 191,253 229,864 3,396 424,513
Serv. and sales costs (45,518) (14,664) (60,182) (201,175) (2,063) (263,420)
Gross Income 76,833 54,238 131,071 28,689 1,333 161,093
Operating Revenue (expense) (19,294) (5,656) (24,950) (14,174) (93) (39,217)
Op. Income before financial effects 57,539 48,582 106,121 14,515 1,240 121,876
Net financial expenses (1,982) (297) (2,279) (39,389) (27) (41,695)
Non Operating Result (1) 1 - - (1) (1)
Income (loss) before taxes/SC 55,556 48,286 103,842 (24,874) 1,212 80,180
Margin 2005 45.4% 70.1% 54.3% -10.8% 35.7% 18.9%
Margin 2004 45.4% 70.9% 56.2% -11.4% 41.9% 24.8%
JAN TO JUN 2005
Rental
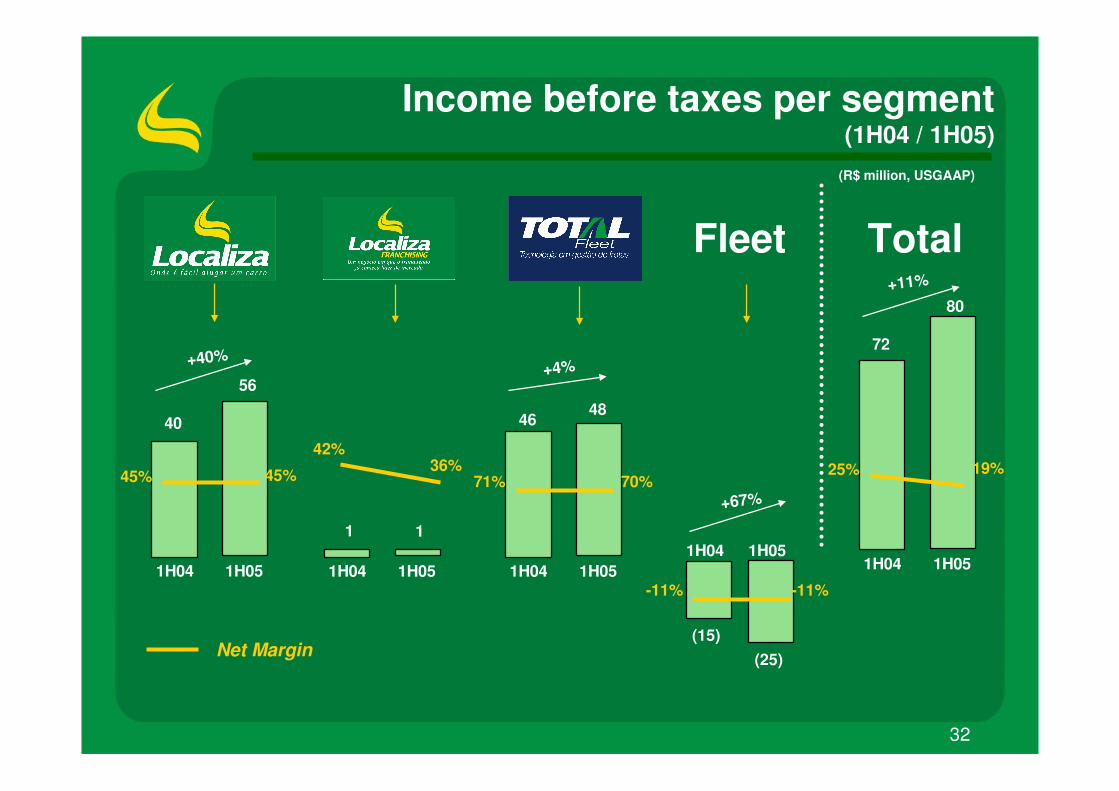
32
Income before taxes per segment (1H04 / 1H05)
(R$ million, USGAAP)
Fleet
Net Margin
40
1H04 1H05
56
+40%
1
1H04 1H05
1
46
1H04 1H05
48
+4%
(15)
1H04 1H05
(25)
+67%
42%36%
45% 45% 71% 70%
-11% -11%
72
1H04 1H05
80+11%
25% 19%
Total
33
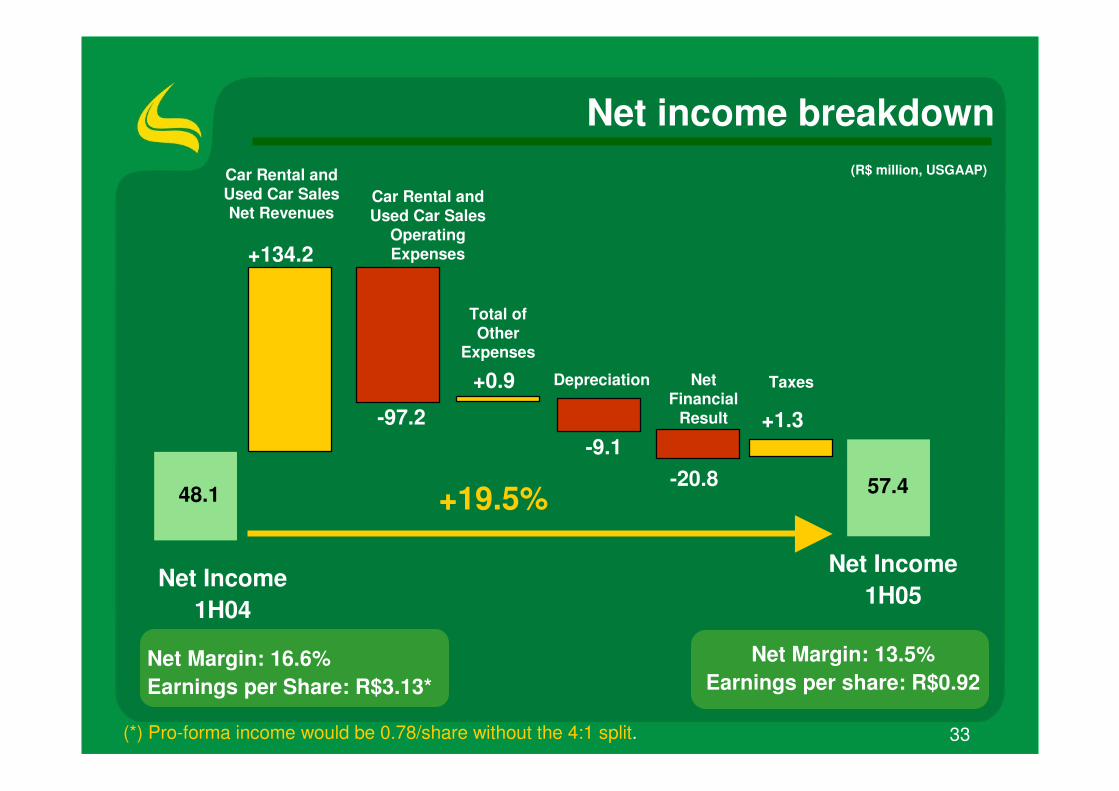
Net income breakdown
48.1
Net Income1H04
(R$ million, USGAAP)
+134.2
Car Rental and Used Car Sales Net Revenues
-97.2
Car Rental and Used Car Sales
Operating Expenses
+0.9
Total of Other
Expenses
Depreciation
-9.1-20.8
Net Financial
Result
Taxes
57.4
Net Income1H05
Net Margin: 16.6%Earnings per Share: R$3.13*
Net Margin: 13.5%Earnings per share: R$0.92
+19.5%
(*) Pro-forma income would be 0.78/share without the 4:1 split.
+1.3
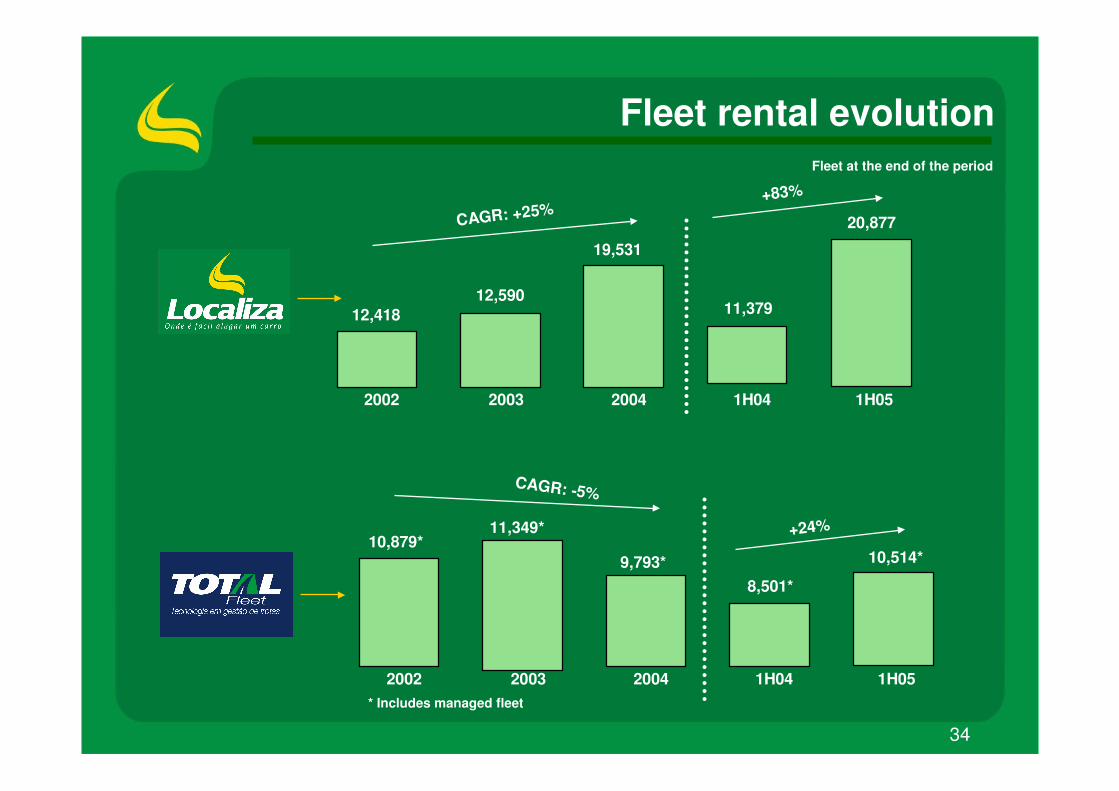
34
Fleet rental evolutionFleet at the end of the period
19,531
11,37912,590
12,418
2002 2003 2004 1H04 1H05
20,877CAGR: +25% +83%
* Includes managed fleet
9,793*8,501*
11,349*10,879*
2002 2003 2004 1H04 1H05
10,514*
CAGR: -5%
+24%
35
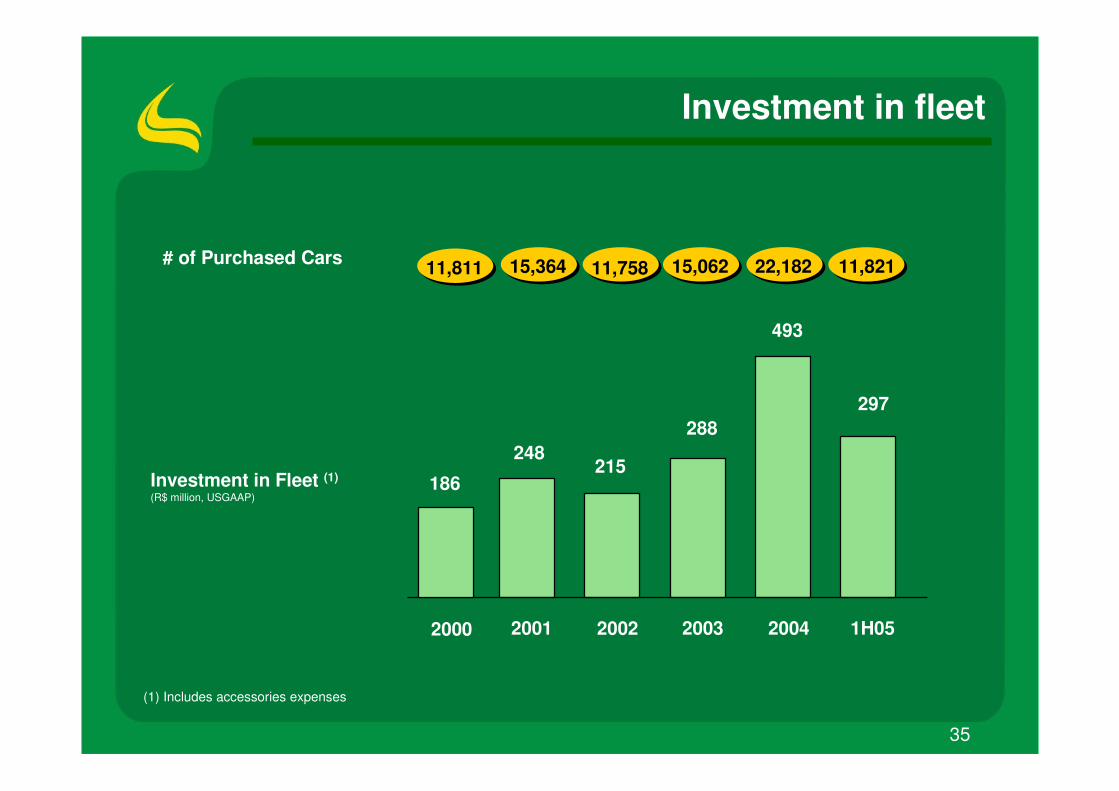
Investment in fleet
# of Purchased Cars
(1) Includes accessories expenses
Investment in Fleet (1)
(R$ million, USGAAP)
15,364 11,758 15,062 22,182 11,82111,811
186
248215
288
493
1H0520042003200220012000
297
36
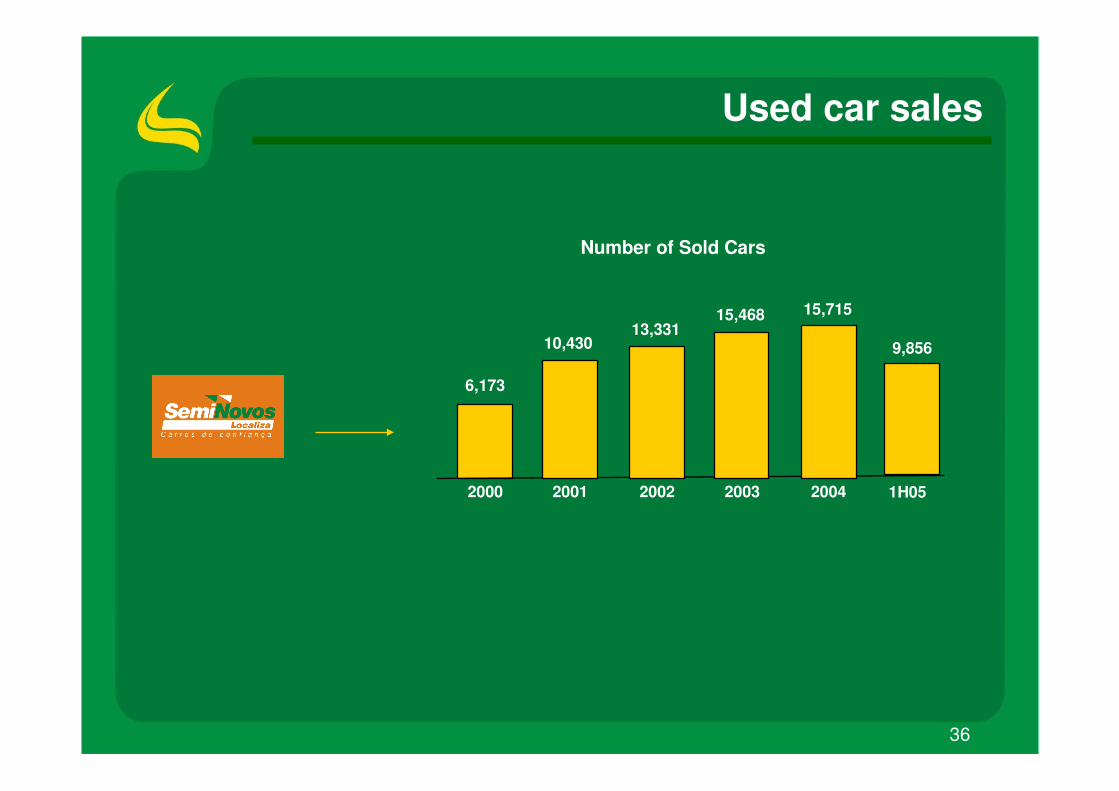
Used car sales
Number of Sold Cars
13,33115,715
10,430
6,173
2000 2001 2002 2003 2004
15,468
1H05
9,856
37
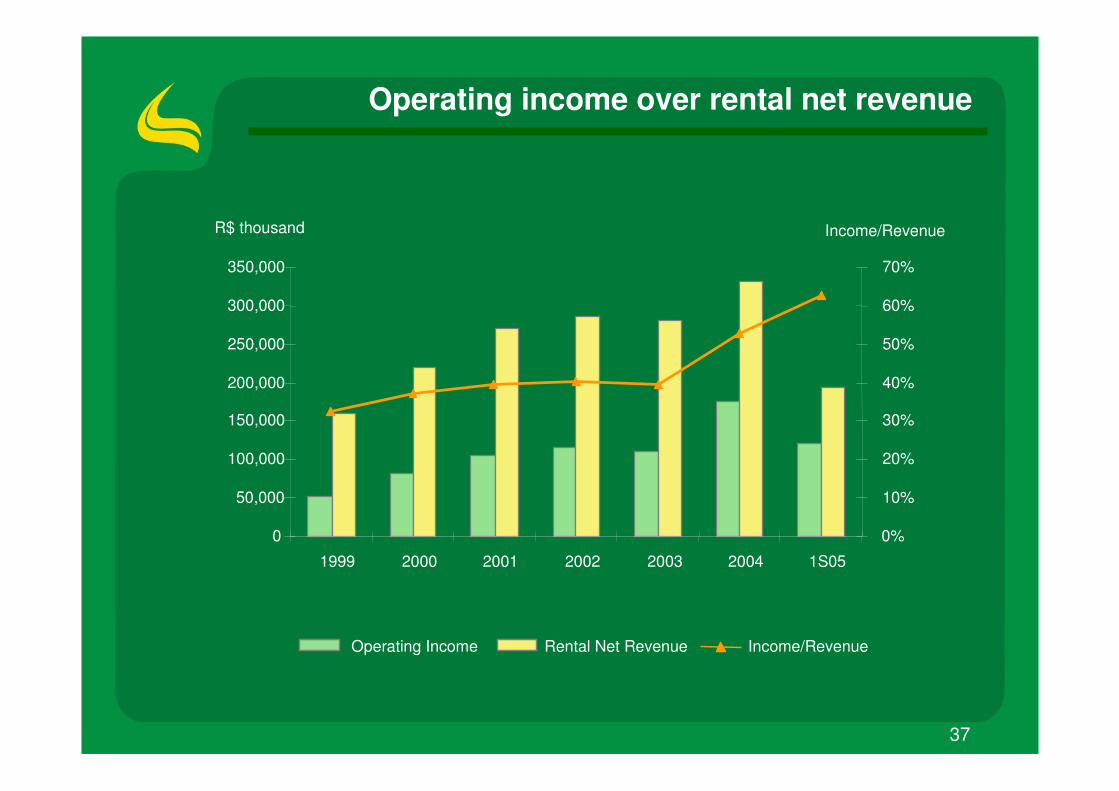
Operating income over rental net revenue
Operating Income Rental Net Revenue Income/Revenue
0
50,000
100,000
150,000
200,000
250,000
300,000
350,000
1999 2000 2001 2002 2003 2004 1S05
R$ thousand
0%
10%
20%
30%
40%
50%
60%
70%
Income/Revenue
38
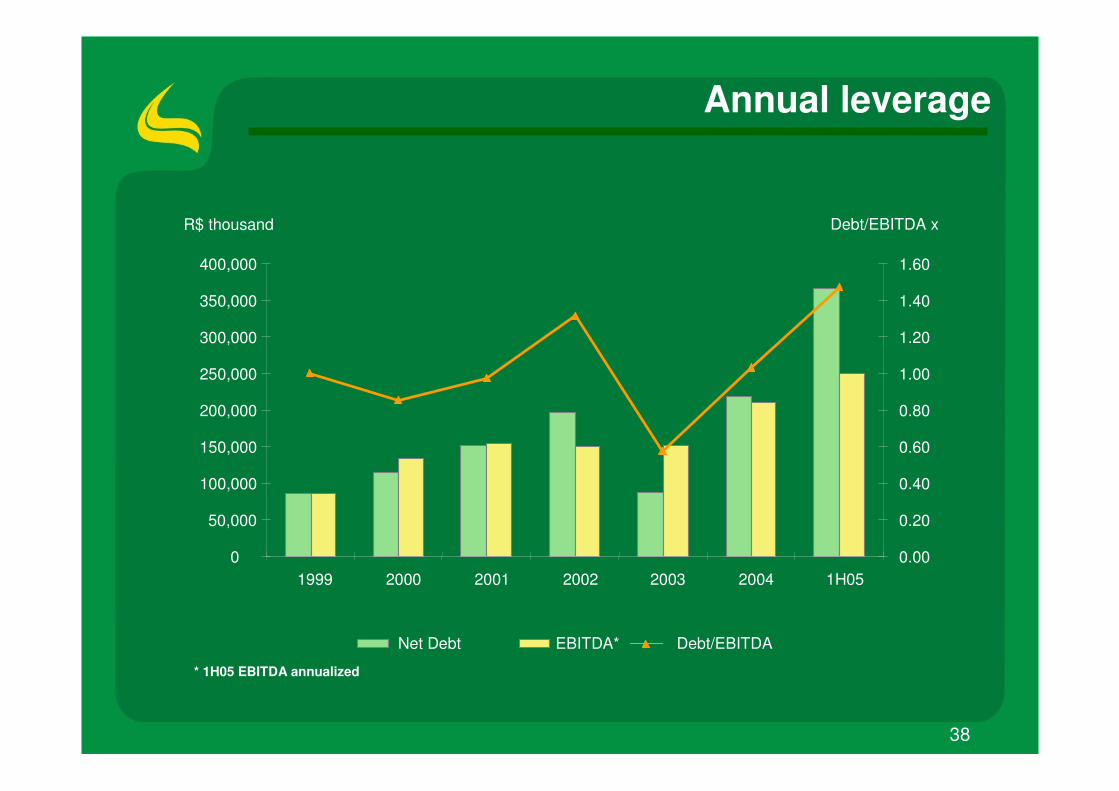
Annual leverage
0
50,000
100,000
150,000
200,000
250,000
300,000
350,000
400,000
1999 2000 2001 2002 2003 2004 1H05
R$ thousand
0.00
0.20
0.40
0.60
0.80
1.00
1.20
1.40
1.60
Debt/EBITDA x
Net Debt EBITDA* Debt/EBITDA
* 1H05 EBITDA annualized
39
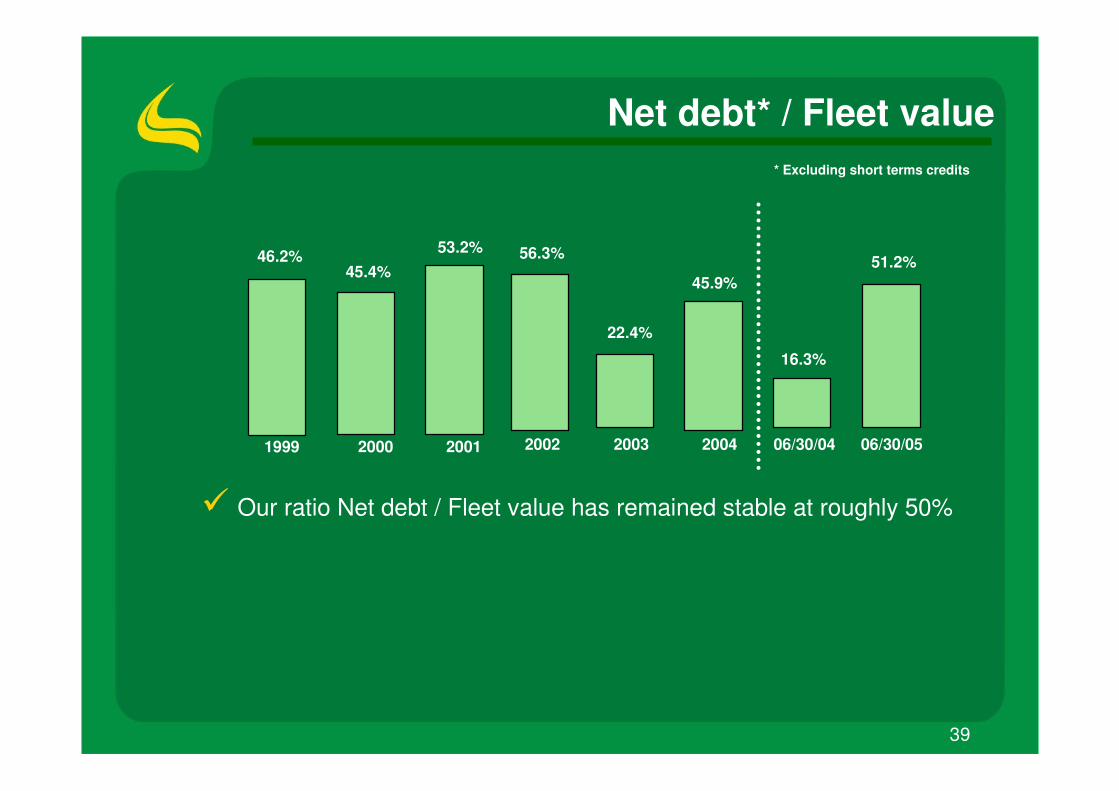
Net debt* / Fleet value
� Our ratio Net debt / Fleet value has remained stable at roughly 50%
* Excluding short terms credits
2002 2003 2004 06/30/04 06/30/051999 2000 2001
46.2%45.4%
53.2% 56.3%
22.4%
45.9%
16.3%
51.2%
40
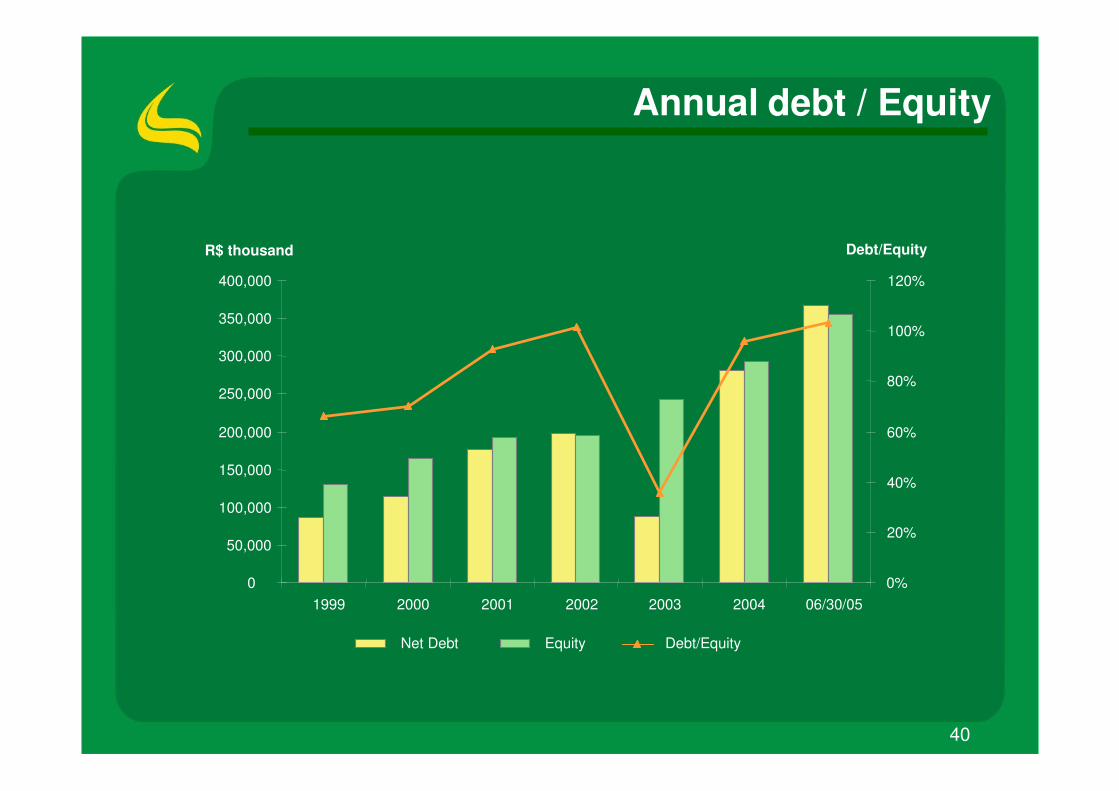
Annual debt / Equity
0
50,000
100,000
150,000
200,000
250,000
300,000
350,000
400,000
1999 2000 2001 2002 2003 2004 06/30/05
R$ thousand
0%
20%
40%
60%
80%
100%
120%
Debt/Equity
Net Debt Equity Debt/Equity
41
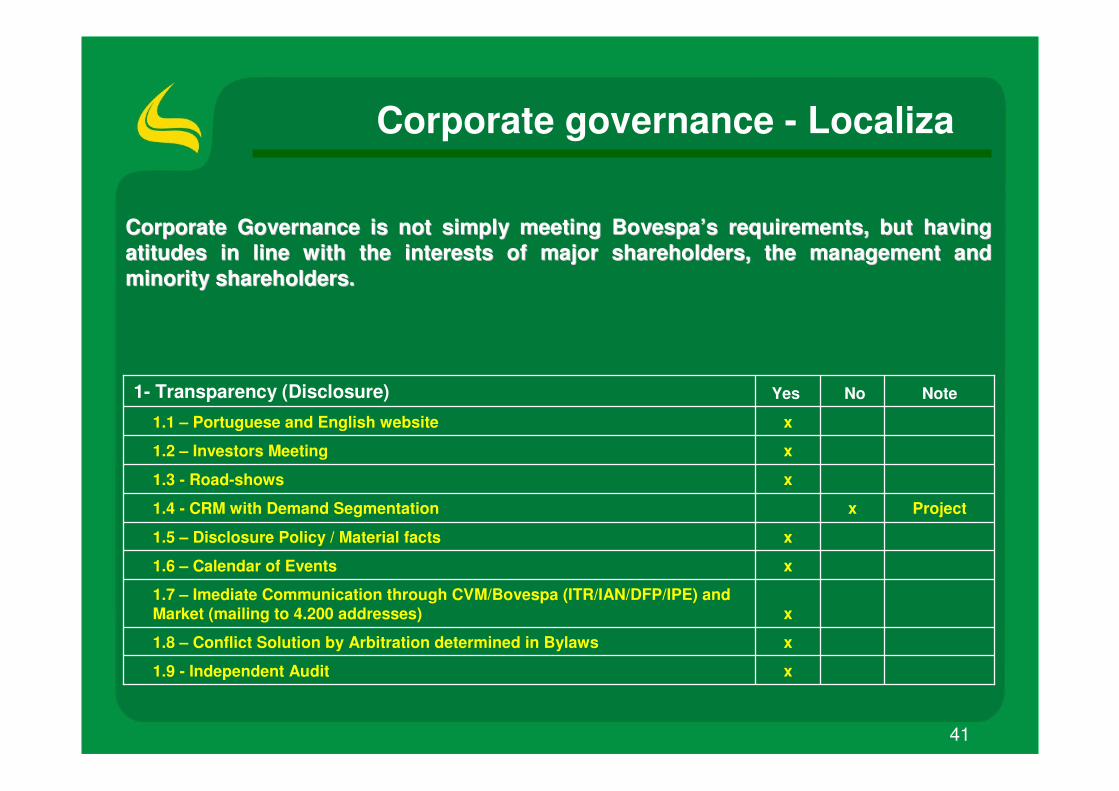
x1.9 - Independent Audit
x1.8 – Conflict Solution by Arbitration determined in Bylaws
x1.7 – Imediate Communication through CVM/Bovespa (ITR/IAN/DFP/IPE) andMarket (mailing to 4.200 addresses)
x1.6 – Calendar of Events
x1.5 – Disclosure Policy / Material facts
Projectx1.4 - CRM with Demand Segmentation
x1.3 - Road-shows
x1.2 – Investors Meeting
x1.1 – Portuguese and English website
NoteNoYes1- Transparency (Disclosure)
Corporate governance - Localiza
CorporateCorporate GovernanceGovernance is is notnot simplysimply meeting Bovespa’s meeting Bovespa’s requirementsrequirements, , butbut havinghavingatitudes in atitudes in lineline withwith thethe interestsinterests ofof major major shareholdersshareholders, , thethe management management andandminorityminority shareholdersshareholders..
42
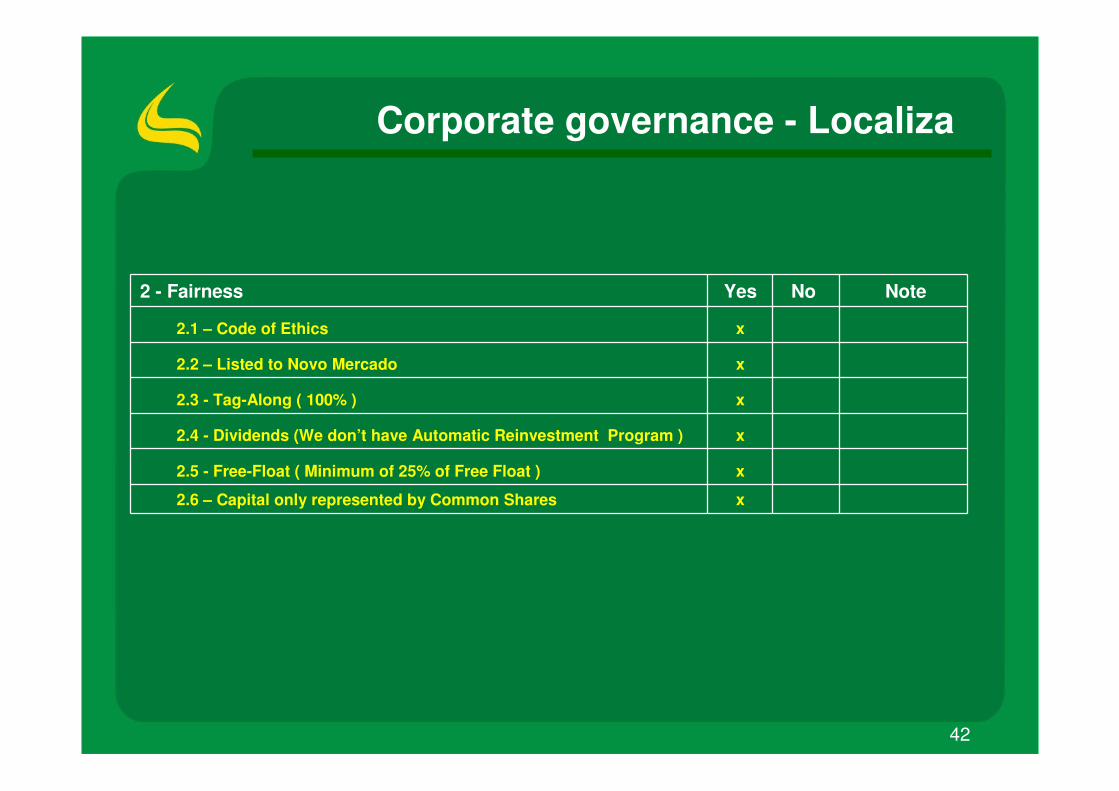
x2.6 – Capital only represented by Common Shares
x2.5 - Free-Float ( Minimum of 25% of Free Float )
x2.4 - Dividends (We don’t have Automatic Reinvestment Program )
x2.3 - Tag-Along ( 100% )
x2.2 – Listed to Novo Mercado
x2.1 – Code of Ethics
NoteNoYes2 - Fairness
Corporate governance - Localiza
43
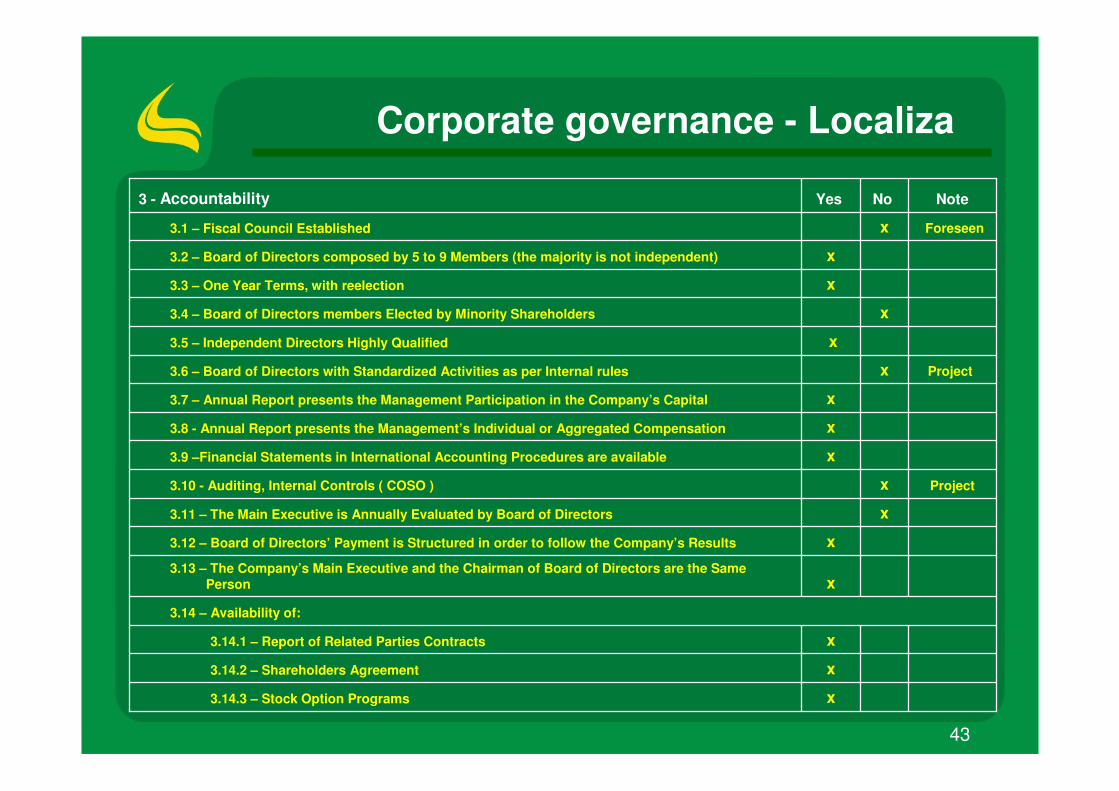
x3.14.3 – Stock Option Programs
x3.14.2 – Shareholders Agreement
x3.14.1 – Report of Related Parties Contracts
3.14 – Availability of:
x3.13 – The Company’s Main Executive and the Chairman of Board of Directors are the Same
Person
x3.12 – Board of Directors’ Payment is Structured in order to follow the Company’s Results
x3.11 – The Main Executive is Annually Evaluated by Board of Directors
Projectx3.10 - Auditing, Internal Controls ( COSO )
x3.9 –Financial Statements in International Accounting Procedures are available
x3.8 - Annual Report presents the Management’s Individual or Aggregated Compensation
x3.7 – Annual Report presents the Management Participation in the Company’s Capital
Projectx3.6 – Board of Directors with Standardized Activities as per Internal rules
x3.5 – Independent Directors Highly Qualified
x3.4 – Board of Directors members Elected by Minority Shareholders
x3.3 – One Year Terms, with reelection
x3.2 – Board of Directors composed by 5 to 9 Members (the majority is not independent)
Foreseenx3.1 – Fiscal Council Established
NoteNoYes3 - Accountability
Corporate governance - Localiza
44
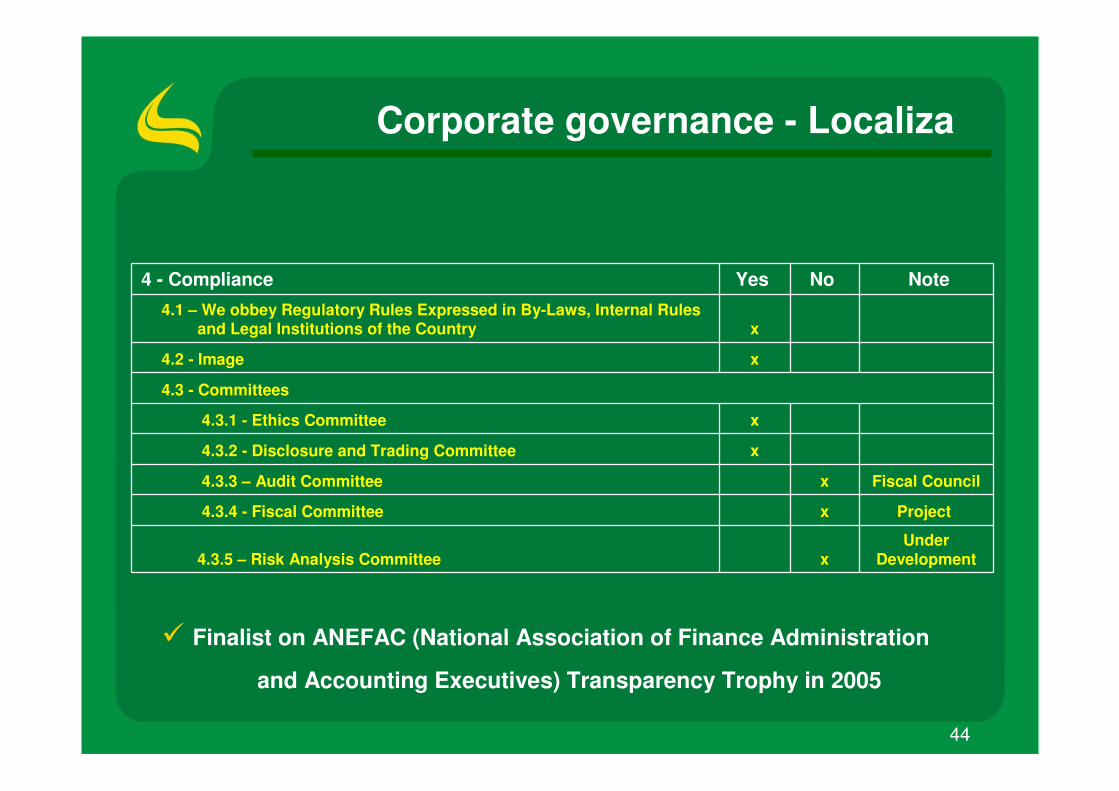
UnderDevelopmentx4.3.5 – Risk Analysis Committee
Projectx4.3.4 - Fiscal Committee
Fiscal Councilx4.3.3 – Audit Committee
x4.3.2 - Disclosure and Trading Committee
x4.3.1 - Ethics Committee
4.3 - Committees
x4.2 - Image
x4.1 – We obbey Regulatory Rules Expressed in By-Laws, Internal Rules
and Legal Institutions of the Country
NoteNoYes4 - Compliance
Corporate governance - Localiza
� Finalist on ANEFAC (National Association of Finance Administration
and Accounting Executives) Transparency Trophy in 2005
45
Total Fleet receives Valor 1000 Award
Total Fleet was chosen the best Company in SpecializedServices sector, according to a research made by Valor newspaper.
The award, which is on its fifth edition, selects, among the 1000 largestcompanies, the sector`s winners (27) which differ from the others by theirinnovation and technical rigor.
Total Fleet`s strong financial performance, high productivity, quality andtranparency associated to committed and qualified employees were the mainaspects to conquer the award.
46
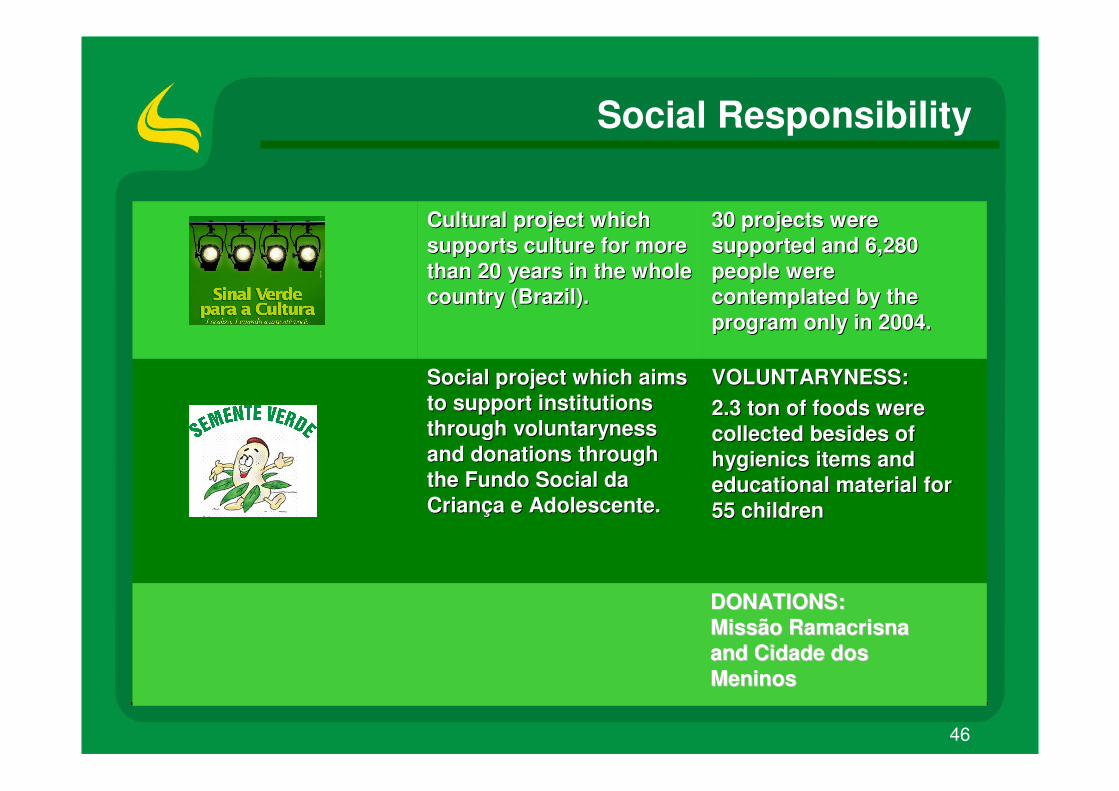
VOLUNTARYNESS: VOLUNTARYNESS: 2.3 2.3 tonton ofof foodsfoods werewerecollectedcollected besidesbesides ofofhygienicshygienics itemsitems andandeducationaleducational material for material for 55 55 childrenchildren
Social Social projectproject whichwhich aimsaimsto to supportsupport institutionsinstitutionsthroughthrough voluntarynessvoluntarynessandand donationsdonations throughthroughthethe Fundo Social da Fundo Social da Criança e Adolescente.Criança e Adolescente.
30 30 projectsprojects wereweresupportedsupported andand 6,280 6,280 peoplepeople werewerecontemplatedcontemplated byby thetheprogramprogram onlyonly in 2004.in 2004.
Cultural Cultural projectproject whichwhichsupportssupports cultureculture for more for more thanthan 20 20 yearsyears in in thethe wholewholecountry (country (BrazilBrazil).).
Social Responsibility
DONATIONS:DONATIONS:Missão Missão RamacrisnaRamacrisnaandand Cidade dos Cidade dos MeninosMeninos
47
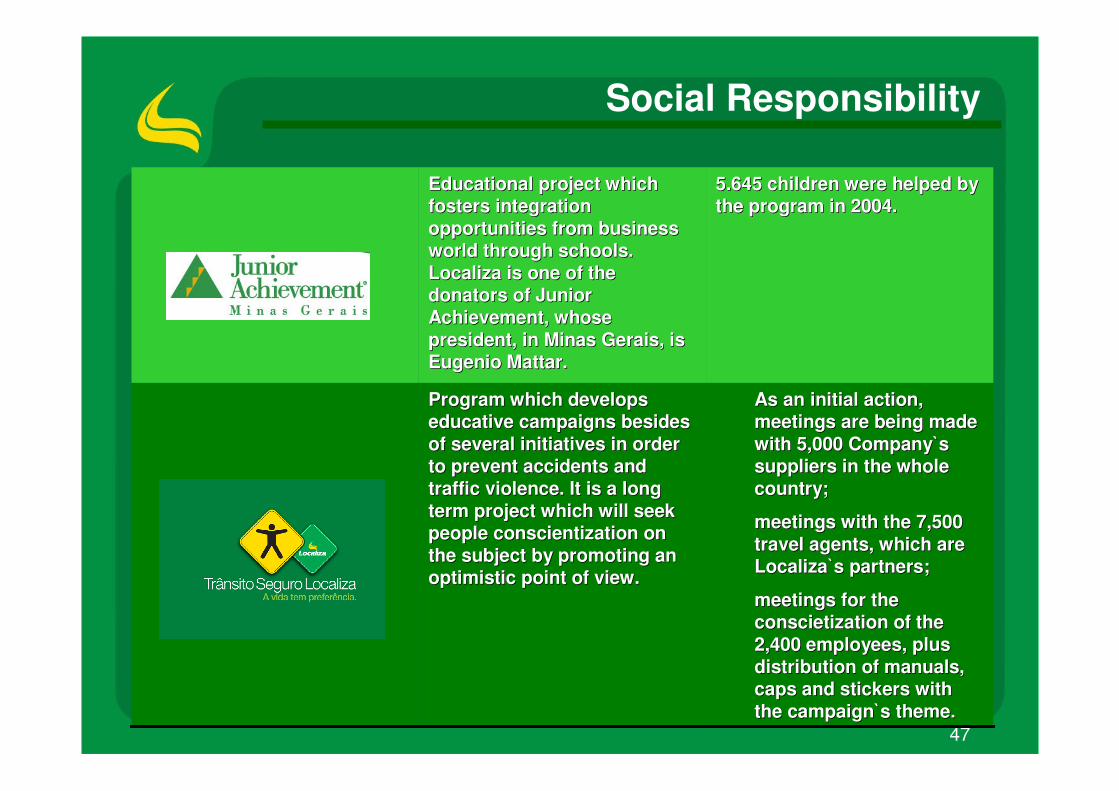
As As anan initialinitial actionaction, , meetingsmeetings are are beingbeing mademadewithwith 5,000 5,000 CompanyCompany`s `s supplierssuppliers in in thethe wholewholecountry;country;
meetingsmeetings withwith thethe 7,500 7,500 traveltravel agentsagents, , whichwhich are are Localiza`s Localiza`s partnerspartners;;
meetingsmeetings for for thetheconscietizationconscietization ofof thethe2,400 2,400 employeesemployees, , plusplusdistributiondistribution ofof manualsmanuals, , capscaps andand stickersstickers withwiththethe campaigncampaign`s `s themetheme. .
ProgramProgram whichwhich developsdevelopseducativeeducative campaignscampaigns besidesbesidesofof severalseveral initiativesinitiatives in in orderorderto to preventprevent accidentsaccidents andandtraffictraffic violenceviolence. It is a . It is a longlongtermterm projectproject whichwhich willwill seekseekpeoplepeople conscientizationconscientization ononthethe subjectsubject byby promotingpromoting ananoptimisticoptimistic pointpoint ofof viewview. .
5.645 5.645 childrenchildren werewere helpedhelped bybythethe programprogram in 2004.in 2004.
EducationalEducational projectproject whichwhichfostersfosters integrationintegrationopportunitiesopportunities fromfrom business business worldworld throughthrough schoolsschools. . Localiza is Localiza is oneone ofof thethedonatorsdonators ofof Junior Junior AchievementAchievement, , whosewhosepresidentpresident, in Minas Gerais, is , in Minas Gerais, is Eugenio Mattar.Eugenio Mattar.
Social Responsibility
48
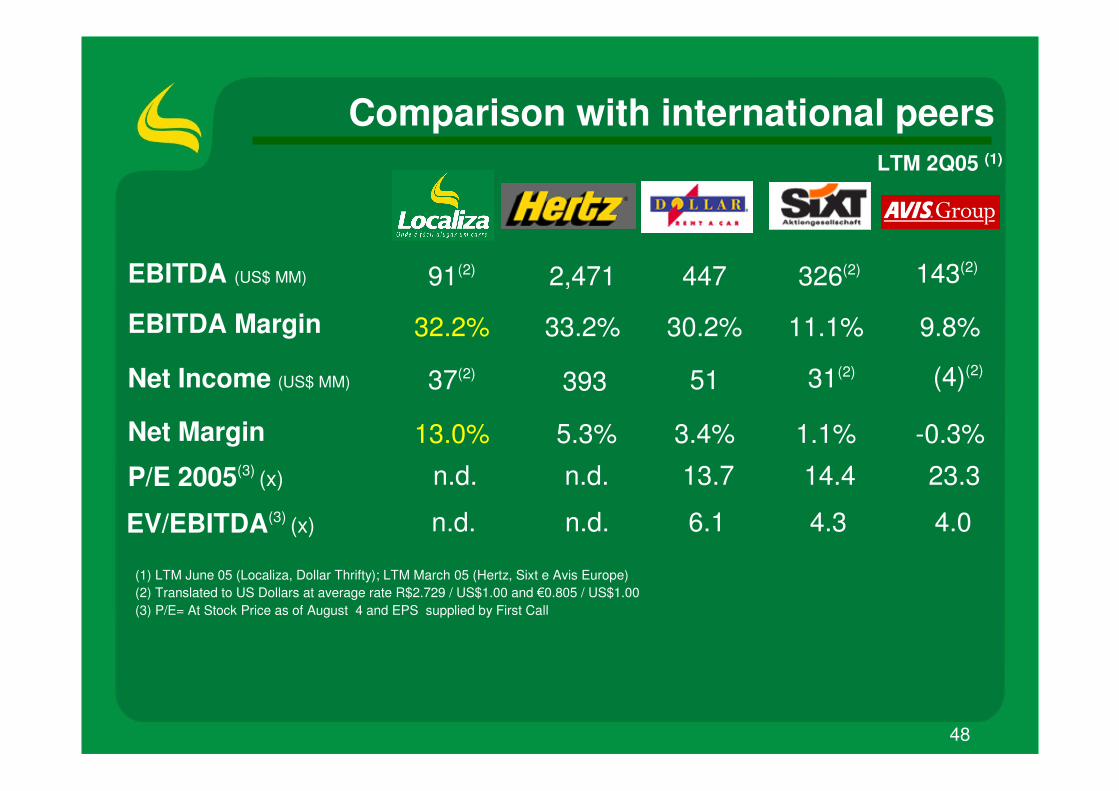
Comparison with international peers
Net Income (US$ MM)
EBITDA (US$ MM)
EBITDA Margin
P/E 2005(3) (x)
Net Margin
37(2)
91(2)
n.d.
32.2%
13.0%
14.4
11.1%
1.1%
51
447
13.7
30.2%
3.4%
393
2,471
n.d.
33.2%
5.3%
23.3
9.8%
-0.3%
EV/EBITDA(3) (x) n.d. 4.36.1n.d. 4.0
(1) LTM June 05 (Localiza, Dollar Thrifty); LTM March 05 (Hertz, Sixt e Avis Europe)(2) Translated to US Dollars at average rate R$2.729 / US$1.00 and �0.805 / US$1.00(3) P/E= At Stock Price as of August 4 and EPS supplied by First Call
143(2)
(4)(2)
326(2)
31(2)
LTM 2Q05 (1)
49
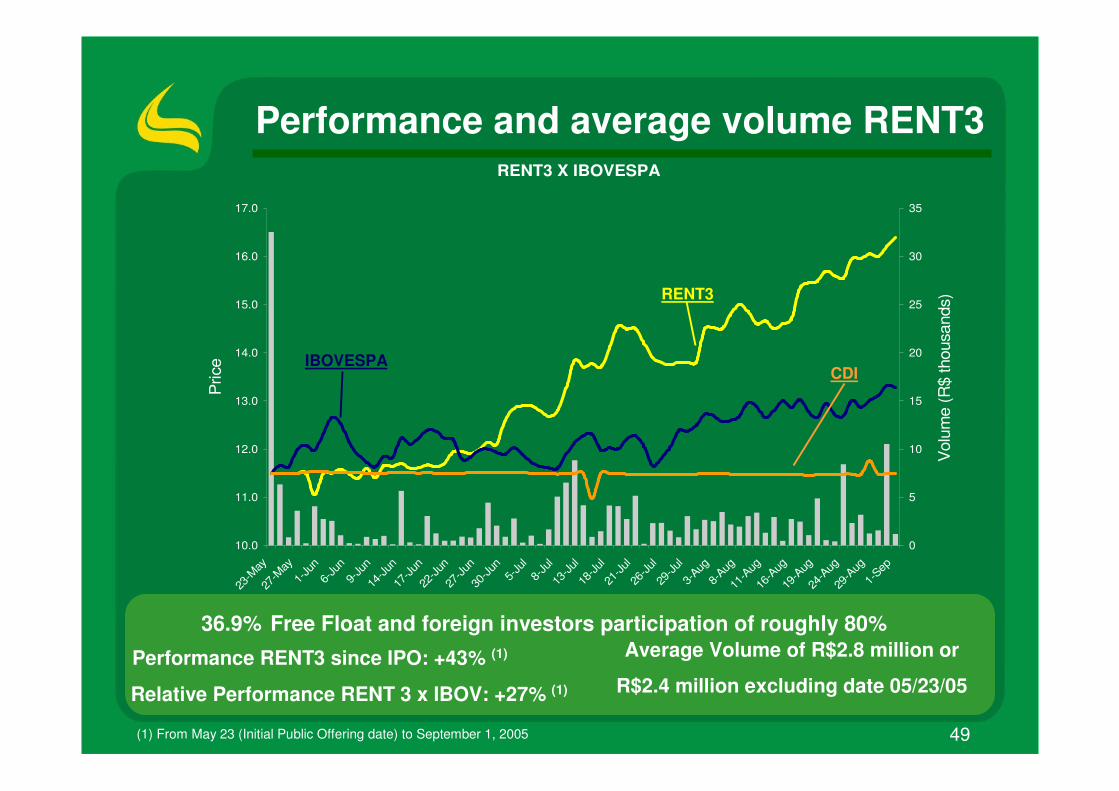
RENT3 X IBOVESPA
10.0
11.0
12.0
13.0
14.0
15.0
16.0
17.0
23-M
ay27
-May
1-Ju
n6-
Jun
9-Ju
n14
-Jun
17-Ju
n22
-Jun
27-Ju
n30
-Jun
5-Ju
l8-
Jul
13-Ju
l18
-Jul
21-Ju
l26
-Jul
29-Ju
l3-
Aug8-
Aug11
-Aug
16-A
ug19
-Aug
24-A
ug29
-Aug
1-Sep
Pric
e
0
5
10
15
20
25
30
35
Vol
ume
(R$
thou
sand
s)
Performance and average volume RENT3
36.9% Free Float and foreign investors participation of roughly 80%
Performance RENT3 since IPO: +43% (1)
Relative Performance RENT 3 x IBOV: +27% (1)
Average Volume of R$2.8 million or
R$2.4 million excluding date 05/23/05
(1) From May 23 (Initial Public Offering date) to September 1, 2005
RENT3
IBOVESPACDI
50
Disclaimer - Forward Looking Statements
The material that follows is a presentation of general background information about LOCALIZA as of the
date of the presentation. It is information in summary form and does not purport to be complete. It is not
intended to be relied upon as advice to potential investors. No representation or warranty, express or
implied, is made concerning, and no reliance should be placed on, the accuracy, fairness, or
completeness of the information presented herein.
This presentation contains statements that are forward-looking within the meaning of Section 27A of the
Securities Act of 1933 and Section 21E of the Securities Exchange Act of 1934. Such forward-looking
statements are only predictions and are not guarantees of future performance. Investors are cautioned
that any such forward-looking statements are and will be, as the case may be, subject to many risks,
uncertainties and factors relating to the operations and business environments of LOCALIZA and its
subsidiaries that may cause the actual results of the companies to be materially different from any future
results expressed or implied in such forward-looking statements.
Although LOCALIZA believes that the expectations and assumptions reflected in the forward-looking
statements are reasonable based on information currently available to LOCALIZA’s management,
LOCALIZA cannot guarantee future results or events. LOCALIZA expressly disclaims a duty to update
any of the forward-looking statement.