Embed Size (px)
Citation preview
GE CapitalFranchise Finance
2014Canadian ChainRestaurantIndustry Review
Research Partners

GE CapitalFranchise Finance
2014Canadian ChainRestaurantIndustry Review1 Preface . . . . . . . . . . . . . . . . . . . . . . . . . . . . . . . . . . . . . . . . . . . . . . . . . . . . . . 22 Introduction . . . . . . . . . . . . . . . . . . . . . . . . . . . . . . . . . . . . . . . . . . . . . . . . . . 53 Foodservice Industry Profile . . . . . . . . . . . . . . . . . . . . . . . . . . . . . . . . . . 64 Top-of-Mind: What CEOs Think . . . . . . . . . . . . . . . . . . . . . . . . . . . . . . .185 Trends Impacting Restaurants . . . . . . . . . . . . . . . . . . . . . . . . . . . . . . .246 Finance . . . . . . . . . . . . . . . . . . . . . . . . . . . . . . . . . . . . . . . . . . . . . . . . . . . . .327 Cost of Doing Business . . . . . . . . . . . . . . . . . . . . . . . . . . . . . . . . . . . . . .428 Top Chains . . . . . . . . . . . . . . . . . . . . . . . . . . . . . . . . . . . . . . . . . . . . . . . . . .629 Notes . . . . . . . . . . . . . . . . . . . . . . . . . . . . . . . . . . . . . . . . . . . . . . . . . . . . . . .64
Research Partners

Insightful and Trustworthy Data to Help Grow our Businesses
Welcome to GE Capital’s third annual Canadian Chain Restaurant Industry Review . I am pleased to bring you this extensive research report on the state of chain foodservice in this country with the goal of providing insight into key factors affecting our Canadian industry.
The Review is a comprehensive analysis and factual overview of market shares, revenue trends, costs, hot (and not-so-hot) products, consumer behaviour and the overall state of chain foodservice in Canada. These findings have implications for job growth, construction activity and other factors that will impact the economic health of Canada for 2014 and for several years to come . GE Capital wishes to thank fsSTRATEGY and NPD Group Canada for their great work at compiling and analyzing these results .
As our economy keeps on improving, the Review shows that Canadians continue to spend more and more at restaurants, with a year-over-year increase of 2% . In fact, total Canadian foodservice industry sales are expected to increase by 4 .4%, or almost $3 .2 billion, to $71 .1 billion in 2014 .
I find this data very encouraging for the future of our industry. Reading through the Review will undoubtedly give you food for thought . Our market insights will also assist you in building forward-looking plans to help grow your business .
The Canadian chain foodservice industry has gotten stronger in the past years and it’s thanks to your passion and dedication . I wish you all continued success in your endeavours .
Ed KhediguianGE Capital, CanadaFranchise Finance
GE CapitalFranchise Finance
Preface1
2
GE Capital, Franchise Finance Canada
We’re More Than Just Bankers, We’re Builders
GE Capital, Franchise Finance is a leading lender to the restaurant and hospitality industries in Canada. We specialize in financing regional and national restaurant businesses of all sizes across the country. In the past 12 years, we’ve financed more than 750 restaurant customers with upwards of 1,525 property locations . That’s in excess of $1 .35 billion that we’ve invested in the Canadian restaurant space .
In addition to financing at the franchisee and franchisor levels, we lend money for new developments, recapitalizations of existing businesses, mergers and acquisitions, and management-led buyouts .
But we offer our clients more than money.
At GE Capital, we’re not just bankers, we’re builders. On top of smart financing, we provide the know-how of GE to help your capital go further and do more . We’re excited that you’re building something great . It takes money, along with knowledge and expertise . That’s where we come in .
Here are some reasons to consider financing with us:
� A vast portfolio of national and regional restaurant relationships – in a variety of quick service and casual formats – that we’ve maintained through economic ups and downs;
� Deep expertise in the franchise business and a special understanding of the brands that operate in this market;
� A cash flow-based lending model that allows us to value a business based on performance, while taking into account seasonality and other operation issues that specifically affect restaurants; and
� The Access GE program, through which we bring the tools, resources, insights and expertise of GE to help business leaders with their most pressing challenges .
We look forward to working with you as you continue to grow and succeed .
GE CapitalFranchise Finance
1 | Preface
3

Now in its fifth year, the Canadian RestauRant investment summit has solidly established itself as the
annual business conference that brings the industry
into focus.
Operators, chain executives, franchise operators, investors,
lenders and key suppliers from across the country agree
that this is the event that delivers what they need—insight,
information and opportunity—all with meaningful content
and a tight focus that is uniquely Canadian.
Each year, the Summit presents topical issues and noted
thought leaders who share opinions, stimulate discussion
and create new directions. The entire conference program
is designed to yield authoritative information and the latest
data from across the country. When combined with the
powerful networking opportunities it presents, the Summit
is an experience that is unequalled anywhere in Canada.
maY 6+7, 2014EATON CHELSEA TOrONTO HOTEL
rESTAUrANTINVEST.CA rESTAUrANTINVEST.CA rESTAUrANTINVEST.CA rESTAUrANTINVEST.CA
TOP NAME INDUSTrY SPEAKErS.SErIOUS NETWOrKING.THANK YOU fOr jOINING THE DISCUSSION.
*Confirmed Sponsors as of March 21, 2014
Canadian RestauRantinvestment summit
PArTNErS & SPONSOrS
4
fsSTRATEGY Inc . (“fsSTRATEGY”) and The NPD Group, Inc . (“NPD”) are pleased to release this 2014 Canadian Chain Restaurant Review as part of the 2014 Canadian Restaurant Investment Summit .
This report is the culmination of extensive primary and secondary research conducted by fsSTRATEGY and NPD . Sources include:
� Research and data provided by Restaurants Canada, formerly the Canadian Restaurant and Foodservices Association (“CRFA”) .
� C-Suite Survey in January and February, 2014 conducted by fsSTRATEGY and sent to over 94 CEOs and CFOs in the Canadian chain foodservice market .
� Detailed data from NPD’s Future of Foodservice . � Interviews with selected food grower associations, foodservice distributors and landlords .
� Information prepared by GE Canada on the state of money markets and chain restaurant financing.
� Secondary research data from other sources such as Statistics Canada, PKF Consulting, TD Economics, the Conference Board of Canada, University of Guelph, Human Resources and Skills Development Canada, Canada Ministry of Labour, Ontario Energy Board, International Monetary Fund and RSMeans .
For further information, please contact:
Geoff Wilson or Jeff Dover Robert CarterfsSTRATEGY Inc . The NPD Group (Canada), Inc .gwilson@fsSTRATEGY .com robert .carter@npd .com jdover@fsSTRATEGY .com (647) 723-7767(416) 229-2290
Introduction2
5
2 | Introduction

FoodserviceIndustryProfile3.1 Canadian Foodservice Industry Sales3.2 Chain versus Independent Operator Sales 3.3 Provincial Sales Trends3.4 Same Store Sales Growth3.5 C-Suite Expectations for Sales and Traffic
3
6
3.1 Canadian Foodservice Industry Sales
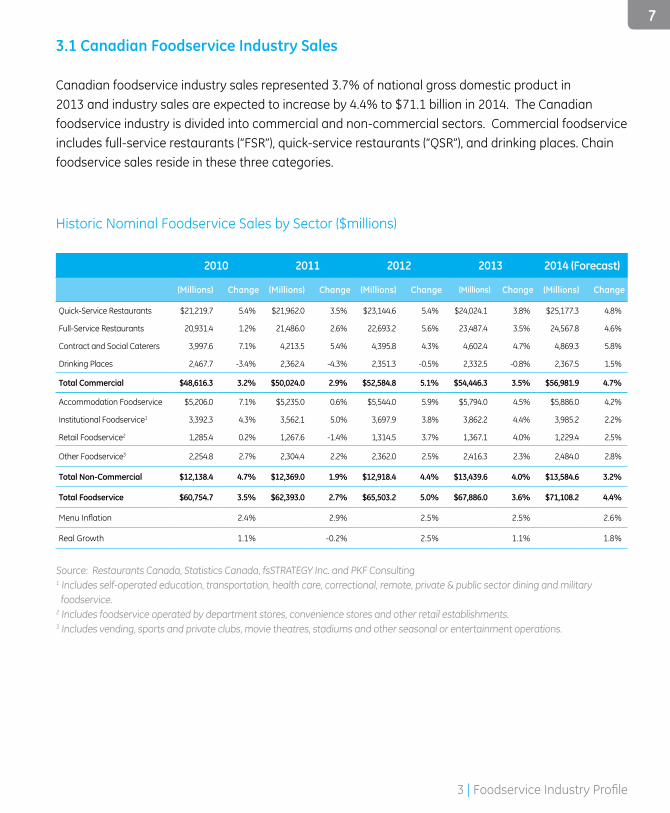
Canadian foodservice industry sales represented 3 .7% of national gross domestic product in 2013 and industry sales are expected to increase by 4 .4% to $71 .1 billion in 2014 . The Canadian foodservice industry is divided into commercial and non-commercial sectors . Commercial foodservice includes full-service restaurants (“FSR”), quick-service restaurants (“QSR”), and drinking places . Chain foodservice sales reside in these three categories .
Source: Restaurants Canada, Statistics Canada, fsSTRATEGY Inc . and PKF Consulting1 Includes self-operated education, transportation, health care, correctional, remote, private & public sector dining and military foodservice .2 Includes foodservice operated by department stores, convenience stores and other retail establishments .3 Includes vending, sports and private clubs, movie theatres, stadiums and other seasonal or entertainment operations .
Historic Nominal Foodservice Sales by Sector ($millions)
2010 2011 2012 2013 2014 (Forecast)
(Millions) Change (Millions) Change (Millions) Change (Millions) Change (Millions) Change
Quick-Service Restaurants $21,219 .7 5 .4% $21,962 .0 3 .5% $23,144 .6 5 .4% $24,024 .1 3 .8% $25,177 .3 4 .8%
Full-Service Restaurants 20,931 .4 1 .2% 21,486 .0 2 .6% 22,693 .2 5 .6% 23,487 .4 3 .5% 24,567 .8 4 .6%
Contract and Social Caterers 3,997 .6 7 .1% 4,213 .5 5 .4% 4,395 .8 4 .3% 4,602 .4 4 .7% 4,869 .3 5 .8%
Drinking Places 2,467 .7 -3 .4% 2,362 .4 -4 .3% 2,351 .3 -0 .5% 2,332 .5 -0 .8% 2,367 .5 1 .5%
Total Commercial $48,616.3 3.2% $50,024.0 2.9% $52,584.8 5.1% $54,446.3 3.5% $56,981.9 4.7%
Accommodation Foodservice $5,206 .0 7 .1% $5,235 .0 0 .6% $5,544 .0 5 .9% $5,794 .0 4 .5% $5,886 .0 4 .2%
Institutional Foodservice1 3,392 .3 4 .3% 3,562 .1 5 .0% 3,697 .9 3 .8% 3,862 .2 4 .4% 3,985 .2 2 .2%
Retail Foodservice2 1,285 .4 0 .2% 1,267 .6 -1 .4% 1,314 .5 3 .7% 1,367 .1 4 .0% 1,229 .4 2 .5%
Other Foodservice3 2,254 .8 2 .7% 2,304 .4 2 .2% 2,362 .0 2 .5% 2,416 .3 2 .3% 2,484 .0 2 .8%
Total Non-Commercial $12,138.4 4.7% $12,369.0 1.9% $12,918.4 4.4% $13,439.6 4.0% $13,584.6 3.2%
Total Foodservice $60,754.7 3.5% $62,393.0 2.7% $65,503.2 5.0% $67,886.0 3.6% $71,108.2 4.4%
Menu Inflation 2 .4% 2 .9% 2 .5% 2 .5% 2 .6%
Real Growth 1 .1% -0 .2% 2 .5% 1 .1% 1 .8%
7
3 | Foodservice Industry Profile
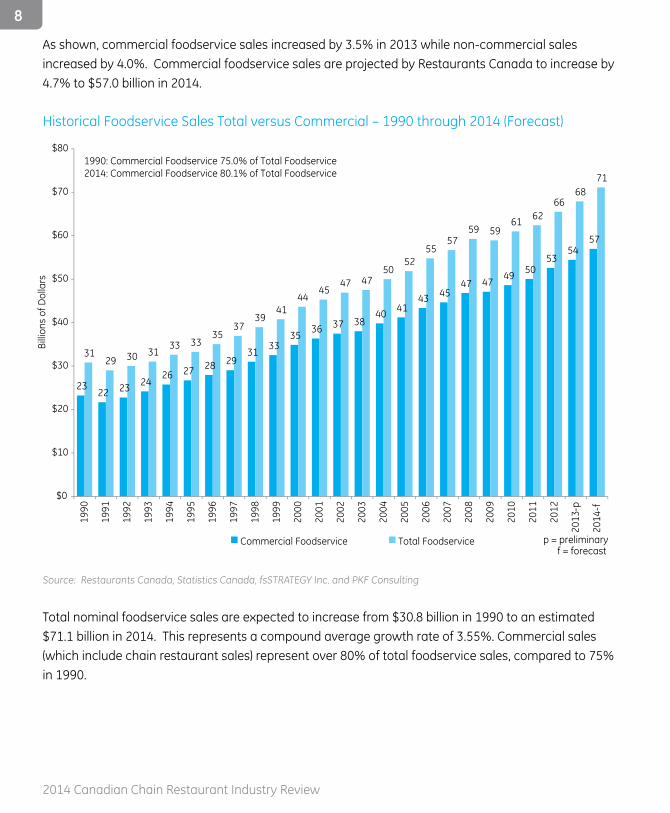
As shown, commercial foodservice sales increased by 3 .5% in 2013 while non-commercial sales increased by 4 .0% . Commercial foodservice sales are projected by Restaurants Canada to increase by 4 .7% to $57 .0 billion in 2014 .
Historical Foodservice Sales Total versus Commercial – 1990 through 2014 (Forecast)
Source: Restaurants Canada, Statistics Canada, fsSTRATEGY Inc . and PKF Consulting
Total nominal foodservice sales are expected to increase from $30 .8 billion in 1990 to an estimated $71 .1 billion in 2014 . This represents a compound average growth rate of 3 .55% . Commercial sales (which include chain restaurant sales) represent over 80% of total foodservice sales, compared to 75% in 1990 .
Billi
ons
of D
olla
rs
23 22 23 24
26 27 28 29 31
33 35 36 37 38
40 41 43 45
47 47 49 50
53 54
57
31 29 30 31
33 33 35
37 39
41 44
45 47 47
50 52
55 57
59 59 61 62
66 68
71
$0
$10
$20
$30
$40
$50
$60
$70
$80
1990
1991
1992
1993
1994
1995
1996
1997
1998
1999
2000
2001
2002
2003
2004
2005
2006
2007
2008
2009
2010
2011
2012
2013
-p
2014
-f
1990: Commercial Foodservice 75.0% of Total Foodservice2014: Commercial Foodservice 80.1% of Total Foodservice
Commercial Foodservice Total Foodservice p = preliminaryf = forecast
8
2014 Canadian Chain Restaurant Industry Review
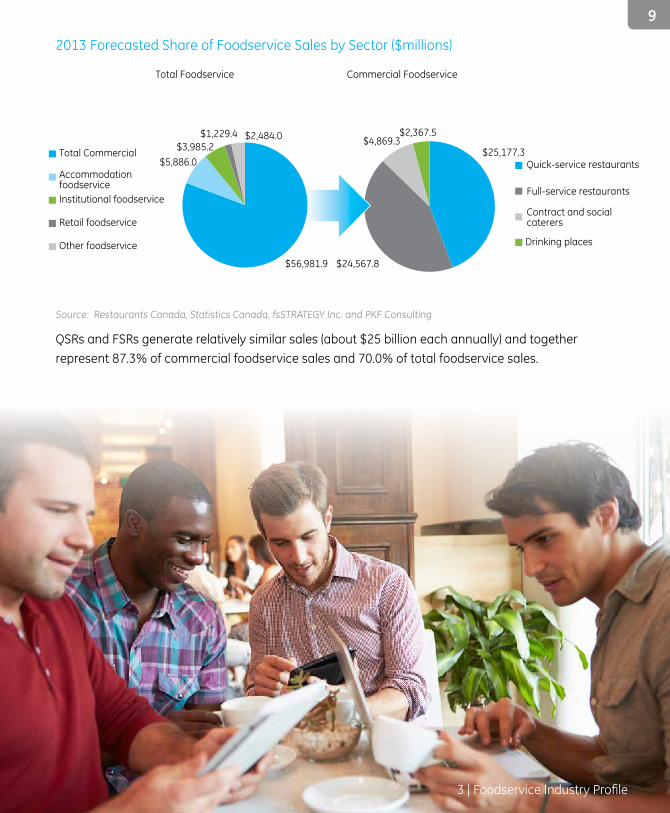
2013 Forecasted Share of Foodservice Sales by Sector ($millions)
Total Foodservice Commercial Foodservice
Source: Restaurants Canada, Statistics Canada, fsSTRATEGY Inc . and PKF Consulting
QSRs and FSRs generate relatively similar sales (about $25 billion each annually) and together represent 87 .3% of commercial foodservice sales and 70 .0% of total foodservice sales .
$56,981.9
$5,886.0 $3,985.2
$1,229.4 $2,484.0
$25,177.3
$24,567.8
$4,869.3 $2,367.5
Total Commercial
Accommodation foodserviceInstitutional foodservice
Retail foodservice
Other foodservice
Quick-service restaurants
Full-service restaurants
Contract and social caterers
Drinking places
3 | Foodservice Industry Profile
9
100.0
102.3
99.4 100.3 100.3
102.9
106.0
101.5
97.3 96.1 95.9
98.5
102.2
104.0 103.5
106.9 107.4
111.0
113.8
100.9
94.4
98.8
101.2
104.2
107.5
99.0
95.5
90.1
83.9
81.6 80.6 80.0
85.0
90.0
95.0
100.0
105.0
110.0
115.0
120.0
2007 2008 2009 2010 2011 2012 2013-p
Real Sales Index 2007 = 100
Total Commercial Full-Service Restaurants Quick-Service Restaurants Caterers Drinking Places
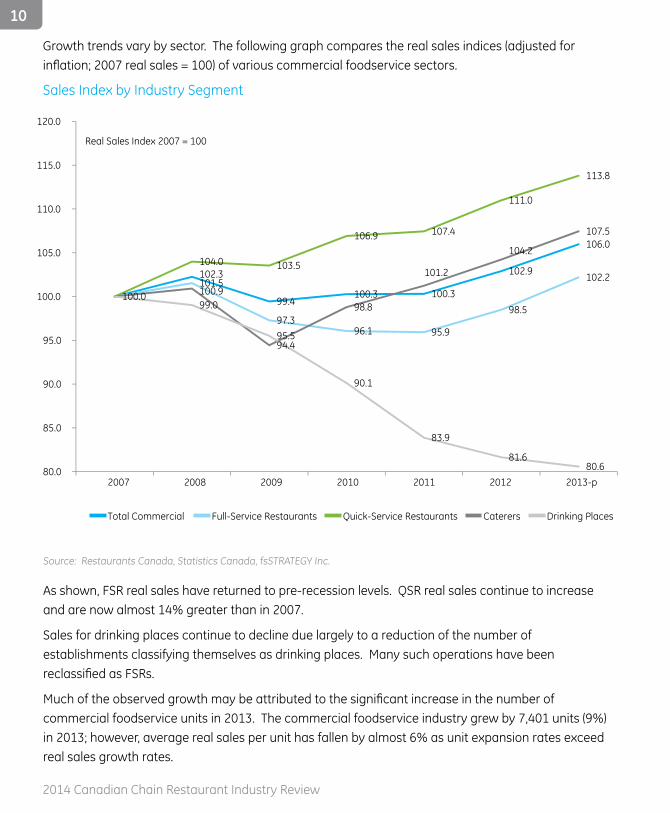
Growth trends vary by sector . The following graph compares the real sales indices (adjusted for inflation; 2007 real sales = 100) of various commercial foodservice sectors.
Sales Index by Industry Segment
Source: Restaurants Canada, Statistics Canada, fsSTRATEGY Inc .
As shown, FSR real sales have returned to pre-recession levels . QSR real sales continue to increase and are now almost 14% greater than in 2007 .
Sales for drinking places continue to decline due largely to a reduction of the number of establishments classifying themselves as drinking places . Many such operations have been reclassified as FSRs.
Much of the observed growth may be attributed to the significant increase in the number of commercial foodservice units in 2013 . The commercial foodservice industry grew by 7,401 units (9%) in 2013; however, average real sales per unit has fallen by almost 6% as unit expansion rates exceed real sales growth rates .
10
2014 Canadian Chain Restaurant Industry Review
3.2 Chain versus Independent Operator Sales
The chart below graphically depicts the share of chain and independent restaurant expenditures in various regions of Canada for 2013 .
Chain versus Independent Restaurant Expenditures – 2013
Source: The NPD Group/CREST®
As shown, 62 .2% of the expenditure in restaurants in Canada is in branded local, regional, national and international chains . Quebec has the greatest percentage of independent expenditures, with almost half of all restaurant sales unaffiliated with chains.
69.4%
51.6% 65.4% 63.2% 62.2%
30.6% 48.4%
34.6% 36.8% 37.8%
0%
20%
40%
60%
80%
100%
CanadaWestOntarioQuebecAtlantic
Chain Restaurants Independent Restaurants
11
3 | Foodservice Industry Profile
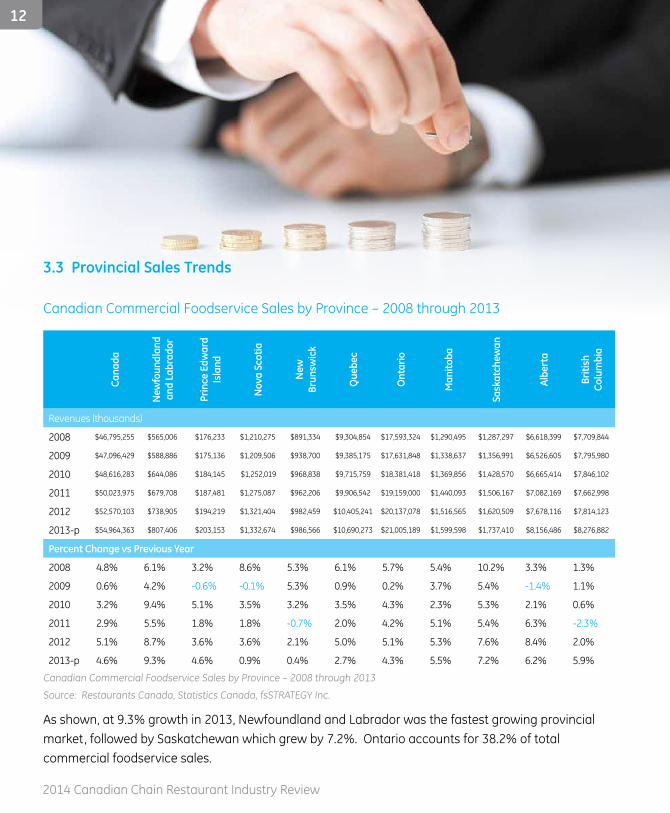
3.3 Provincial Sales Trends
Canadian Commercial Foodservice Sales by Province – 2008 through 2013
Cana
da
New
foun
dlan
d an
d La
brad
or
Prin
ce E
dwar
d Is
land
Nov
a Sc
otia
New
Br
unsw
ick
Que
bec
Ont
ario
Man
itoba
Sask
atch
ewan
Albe
rta
Briti
sh
Colu
mbi
a
Revenues (thousands)
2008 $46,795,255 $565,006 $176,233 $1,210,275 $891,334 $9,304,854 $17,593,324 $1,290,495 $1,287,297 $6,618,399 $7,709,844
2009 $47,096,429 $588,886 $175,136 $1,209,506 $938,700 $9,385,175 $17,631,848 $1,338,637 $1,356,991 $6,526,605 $7,795,980
2010 $48,616,283 $644,086 $184,145 $1,252,019 $968,838 $9,715,759 $18,381,418 $1,369,856 $1,428,570 $6,665,414 $7,846,102
2011 $50,023,975 $679,708 $187,481 $1,275,087 $962,206 $9,906,542 $19,159,000 $1,440,093 $1,506,167 $7,082,169 $7,662,998
2012 $52,570,103 $738,905 $194,219 $1,321,404 $982,459 $10,405,241 $20,137,078 $1,516,565 $1,620,509 $7,678,116 $7,814,123
2013-p $54,964,363 $807,406 $203,153 $1,332,674 $986,566 $10,690,273 $21,005,189 $1,599,598 $1,737,410 $8,156,486 $8,276,882
Percent Change vs Previous Year
2008 4 .8% 6 .1% 3 .2% 8 .6% 5 .3% 6 .1% 5 .7% 5 .4% 10 .2% 3 .3% 1 .3%
2009 0 .6% 4 .2% -0 .6% -0 .1% 5 .3% 0 .9% 0 .2% 3 .7% 5 .4% -1 .4% 1 .1%
2010 3 .2% 9 .4% 5 .1% 3 .5% 3 .2% 3 .5% 4 .3% 2 .3% 5 .3% 2 .1% 0 .6%
2011 2 .9% 5 .5% 1 .8% 1 .8% -0 .7% 2 .0% 4 .2% 5 .1% 5 .4% 6 .3% -2 .3%
2012 5 .1% 8 .7% 3 .6% 3 .6% 2 .1% 5 .0% 5 .1% 5 .3% 7 .6% 8 .4% 2 .0%
2013-p 4 .6% 9 .3% 4 .6% 0 .9% 0 .4% 2 .7% 4 .3% 5 .5% 7 .2% 6 .2% 5 .9%
Canadian Commercial Foodservice Sales by Province – 2008 through 2013
Source: Restaurants Canada, Statistics Canada, fsSTRATEGY Inc .
As shown, at 9 .3% growth in 2013, Newfoundland and Labrador was the fastest growing provincial market, followed by Saskatchewan which grew by 7 .2% . Ontario accounts for 38 .2% of total commercial foodservice sales .
12
2014 Canadian Chain Restaurant Industry Review
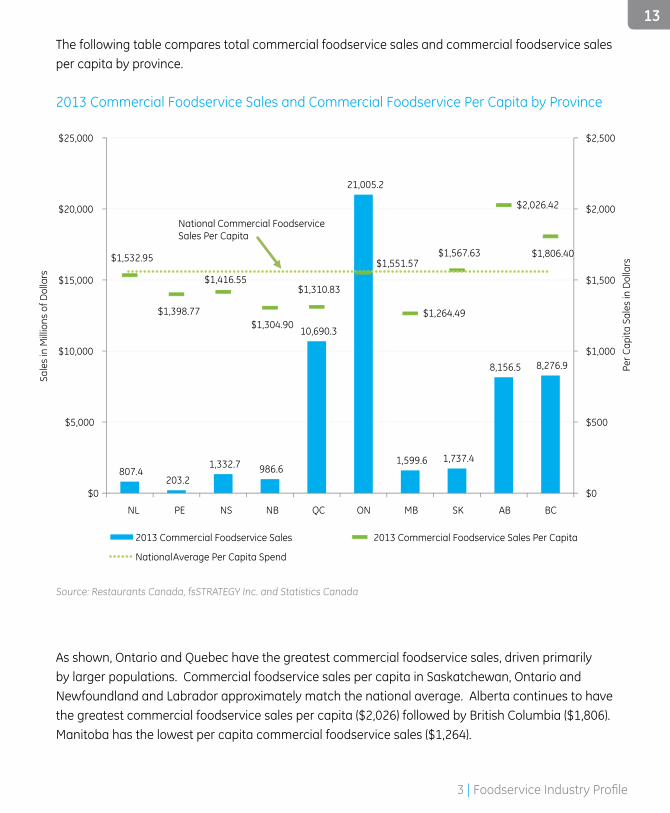
As shown, Ontario and Quebec have the greatest commercial foodservice sales, driven primarily by larger populations . Commercial foodservice sales per capita in Saskatchewan, Ontario and Newfoundland and Labrador approximately match the national average . Alberta continues to have the greatest commercial foodservice sales per capita ($2,026) followed by British Columbia ($1,806) . Manitoba has the lowest per capita commercial foodservice sales ($1,264) .
Source: Restaurants Canada, fsSTRATEGY Inc . and Statistics Canada
The following table compares total commercial foodservice sales and commercial foodservice sales per capita by province .
2013 Commercial Foodservice Sales and Commercial Foodservice Per Capita by Province
807.4 203.2
1,332.7 986.6
10,690.3
21,005.2
1,599.6 1,737.4
8,156.5 8,276.9
$1,532.95
$1,398.77
$1,304.90
$1,310.83
$1,551.57
$1,264.49
$1,567.63
$2,026.42
$1,806.40
$0
$500
$1,000
$1,500
$2,000
$2,500
$0
$5,000
$10,000
$15,000
$20,000
$25,000
National Commercial Foodservice Sales Per Capita
2013 Commercial Foodservice Sales 2013 Commercial Foodservice Sales Per Capita
National Average Per Capita Spend
NL PE NS NB QC ON MB SK AB BC
$1,416.55
Per C
apita
Sal
es in
Dol
lars
Sale
s in
Mill
ions
of D
olla
rs
13
3 | Foodservice Industry Profile
Same Store Sales Growth 2007 through 2013, Selected Publicly-Traded Restaurant Chains
3.1%
1.8%
-2.5%
1.2%
2.5%
1.3%
0.1%
-3%
-2%
-1%
0%
1%
2%
3%
4%
2007 2008 2009 20112010 2012 2013
Source: Company annual and quarterly reports .1 .Selected publicly traded Canadian chains . 2013 data year-to-date 2nd or 3rd quarter results .
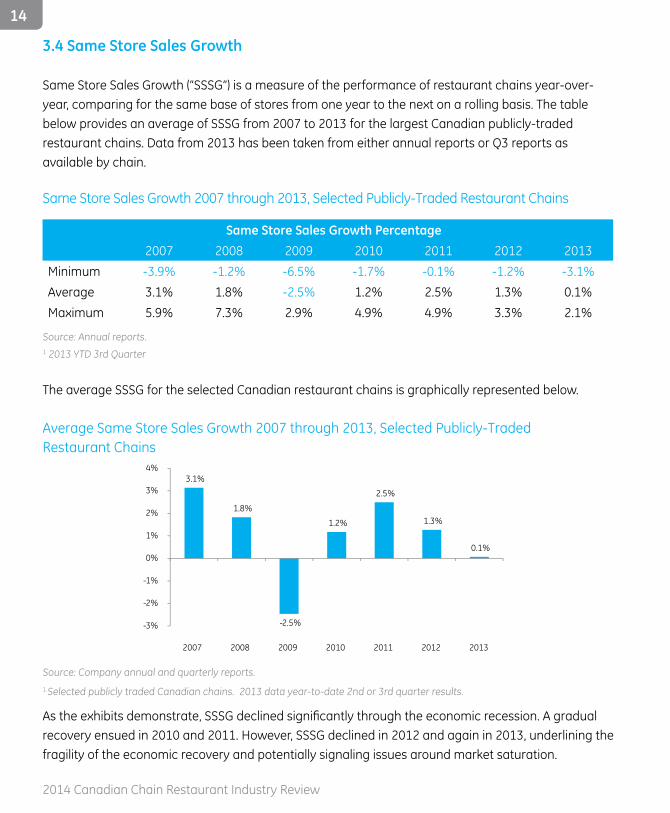
As the exhibits demonstrate, SSSG declined significantly through the economic recession. A gradual recovery ensued in 2010 and 2011 . However, SSSG declined in 2012 and again in 2013, underlining the fragility of the economic recovery and potentially signaling issues around market saturation .
Same Store Sales Growth Percentage2007 2008 2009 2010 2011 2012 2013
Minimum -3 .9% -1 .2% -6 .5% -1 .7% -0 .1% -1 .2% -3 .1%Average 3 .1% 1 .8% -2 .5% 1 .2% 2 .5% 1 .3% 0 .1%Maximum 5 .9% 7 .3% 2 .9% 4 .9% 4 .9% 3 .3% 2 .1%
Source: Annual reports .1 2013 YTD 3rd Quarter
The average SSSG for the selected Canadian restaurant chains is graphically represented below .
Average Same Store Sales Growth 2007 through 2013, Selected Publicly-Traded Restaurant Chains
3.4 Same Store Sales Growth
Same Store Sales Growth (“SSSG”) is a measure of the performance of restaurant chains year-over-year, comparing for the same base of stores from one year to the next on a rolling basis . The table below provides an average of SSSG from 2007 to 2013 for the largest Canadian publicly-traded restaurant chains . Data from 2013 has been taken from either annual reports or Q3 reports as available by chain .
14
2014 Canadian Chain Restaurant Industry Review
14

Same Store Sales Growth 2007 through 2013, Selected Publicly-Traded Restaurant Chains
15
3 | Foodservice Industry Profile
16
2014 Canadian Chain Restaurant Industry Review
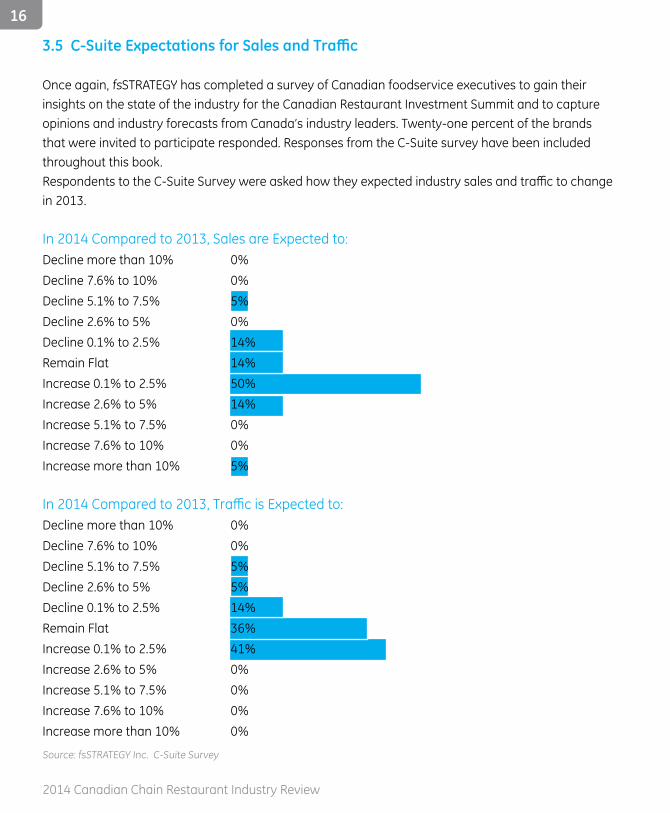
3.5 C-Suite Expectations for Sales and Traffic
Once again, fsSTRATEGY has completed a survey of Canadian foodservice executives to gain their insights on the state of the industry for the Canadian Restaurant Investment Summit and to capture opinions and industry forecasts from Canada’s industry leaders . Twenty-one percent of the brands that were invited to participate responded . Responses from the C-Suite survey have been included throughout this book .Respondents to the C-Suite Survey were asked how they expected industry sales and traffic to change in 2013 .
In 2014 Compared to 2013, Sales are Expected to: Decline more than 10% 0%Decline 7 .6% to 10% 0%Decline 5 .1% to 7 .5% 5%Decline 2 .6% to 5% 0%Decline 0 .1% to 2 .5% 14%Remain Flat 14%Increase 0 .1% to 2 .5% 50%Increase 2 .6% to 5% 14%Increase 5 .1% to 7 .5% 0%Increase 7 .6% to 10% 0%Increase more than 10% 5%
In 2014 Compared to 2013, Traffic is Expected to: Decline more than 10% 0%Decline 7 .6% to 10% 0%Decline 5 .1% to 7 .5% 5%Decline 2 .6% to 5% 5%Decline 0 .1% to 2 .5% 14%Remain Flat 36%Increase 0 .1% to 2 .5% 41%Increase 2 .6% to 5% 0%Increase 5 .1% to 7 .5% 0%Increase 7 .6% to 10% 0%Increase more than 10% 0%
Source: fsSTRATEGY Inc . C-Suite Survey
Most respondents (50%) expect industry sales to increase by up to 2 .5% in 2014 with 14% expecting growth of between 2 .6% and 5% . In last year’s study, respondents were more positive with 60% of respondents expected sales to increase by 0 .1% to 2 .5% and 30% expecting revenues to increase by 2.6% to 5% in 2013. Thirty-six percent of respondents expect industry traffic to remain flat in 2014 and 41% expect traffic to grow by up to 2.5%. Respondents to the 2014 survey were more positive than 2013 respondents with respect to industry traffic with 41% expecting traffic to increase by up to 2 .5% . Once again this year, the survey strongly suggests that revenue increases will depend on operators’ ability to increase average cheques .
Approximately 40% of respondents to Restaurant Canada’s Restaurant Outlook Survey for Q4 2013 experienced a decrease in year-over-year same store sales and one quarter of respondents feel that same store sales will decrease in the next six months; although, based on historical results, Restaurants Canada suggests this decrease may reflect seasonality.
17
3 | Foodservice Industry Profile

Top-of-Mind:What CEOsThink4.1 Opportunities4.2 Challenges4.3 Biggest Changes4.4 Sustainability
4
18
2014 Canadian Chain Restaurant Industry Review
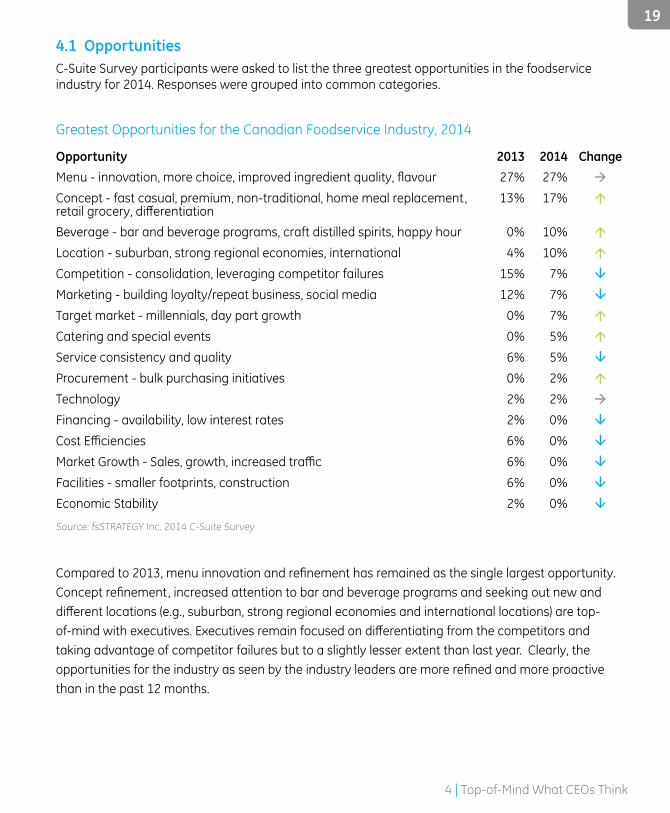
4.1 OpportunitiesC-Suite Survey participants were asked to list the three greatest opportunities in the foodservice industry for 2014 . Responses were grouped into common categories .
Greatest Opportunities for the Canadian Foodservice Industry, 2014
Opportunity 2013 2014 Change Menu - innovation, more choice, improved ingredient quality, flavour 27% 27% à
Concept - fast casual, premium, non-traditional, home meal replacement, retail grocery, differentiation
13% 17% á
Beverage - bar and beverage programs, craft distilled spirits, happy hour 0% 10% á
Location - suburban, strong regional economies, international 4% 10% á
Competition - consolidation, leveraging competitor failures 15% 7% â
Marketing - building loyalty/repeat business, social media 12% 7% â
Target market - millennials, day part growth 0% 7% á
Catering and special events 0% 5% á
Service consistency and quality 6% 5% â
Procurement - bulk purchasing initiatives 0% 2% á
Technology 2% 2% à
Financing - availability, low interest rates 2% 0% â
Cost Efficiencies 6% 0% â
Market Growth - Sales, growth, increased traffic 6% 0% â
Facilities - smaller footprints, construction 6% 0% â
Economic Stability 2% 0% â
Source: fsSTRATEGY Inc . 2014 C-Suite Survey
Compared to 2013, menu innovation and refinement has remained as the single largest opportunity. Concept refinement, increased attention to bar and beverage programs and seeking out new and different locations (e.g., suburban, strong regional economies and international locations) are top-of-mind with executives. Executives remain focused on differentiating from the competitors and taking advantage of competitor failures but to a slightly lesser extent than last year . Clearly, the opportunities for the industry as seen by the industry leaders are more refined and more proactive than in the past 12 months .
19
4 | Top-of-Mind What CEOs Think
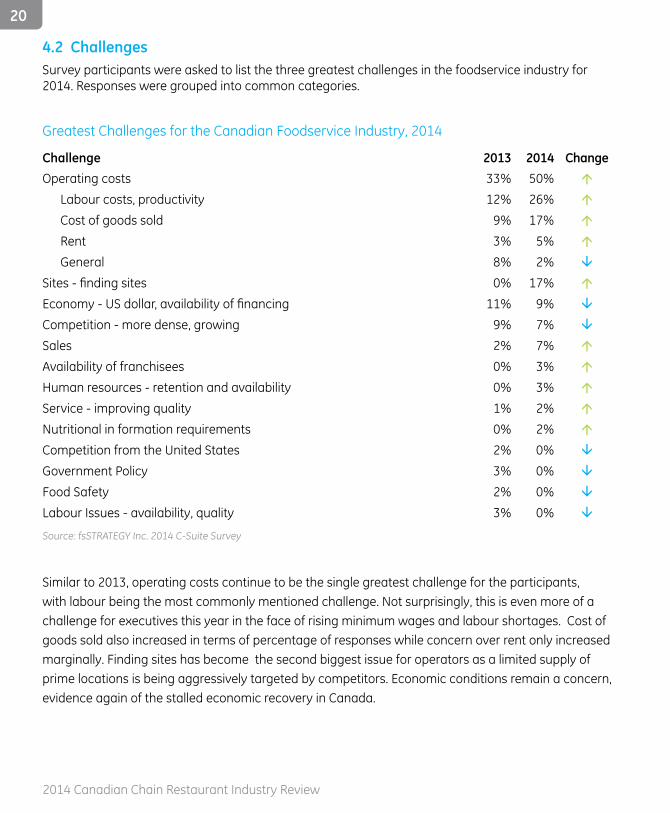
4.2 ChallengesSurvey participants were asked to list the three greatest challenges in the foodservice industry for 2014 . Responses were grouped into common categories .
Greatest Challenges for the Canadian Foodservice Industry, 2014
Challenge 2013 2014 ChangeOperating costs 33% 50% á
Labour costs, productivity 12% 26% á
Cost of goods sold 9% 17% á
Rent 3% 5% á
General 8% 2% â
Sites - finding sites 0% 17% á
Economy - US dollar, availability of financing 11% 9% â
Competition - more dense, growing 9% 7% â
Sales 2% 7% á
Availability of franchisees 0% 3% á
Human resources - retention and availability 0% 3% á
Service - improving quality 1% 2% á
Nutritional in formation requirements 0% 2% á
Competition from the United States 2% 0% â
Government Policy 3% 0% â
Food Safety 2% 0% â
Labour Issues - availability, quality 3% 0% â
Source: fsSTRATEGY Inc . 2014 C-Suite Survey
Similar to 2013, operating costs continue to be the single greatest challenge for the participants, with labour being the most commonly mentioned challenge . Not surprisingly, this is even more of a challenge for executives this year in the face of rising minimum wages and labour shortages . Cost of goods sold also increased in terms of percentage of responses while concern over rent only increased marginally . Finding sites has become the second biggest issue for operators as a limited supply of prime locations is being aggressively targeted by competitors . Economic conditions remain a concern, evidence again of the stalled economic recovery in Canada .
20
2014 Canadian Chain Restaurant Industry Review
4.3 Biggest Changes
4 .3 .1 Short-Term Changes
C-Suite Survey participants were asked what they thought would be the biggest short-term changes in the foodservice industry .
In 2013, participants cited intensifying competition, industry consolidation, increasing specialization of menus and the growth of social media as an influencer in success.
This year, participants continued the themes of intensifying competition and industry consolidation . Competition is expected to grow in smaller markets and operators continue to expect entries into the market by US chains . Participants believe there will be further mergers, acquisitions and closures in the chain restaurant industry in Canada . Some operators also suggest that independent restaurants will recapture market share they have been losing to the chains, especially in the premium casual market .
New this year, operators suggested that they expect consumer confidence to improve somewhat, yet consumers will have even higher value expectations .
Finally, operators expect labour shortages to persist, regulation to tighten, real estate costs to rise and availability to be limited and supply management to continue to burden cost of goods sold .
4 .3 .2 Long-Term Changes
C-Suite Survey participants were asked what they thought would be the biggest long-term changes in the foodservice industry .
In 2013, participants cited contraction and redefinition, concept changes, technology and changing consumer behaviour as baby boomers retire .
This year, participants reiterated their belief that the industry can expect more consolidation over the long-term, suggesting that there are too many chains doing the same thing . Participants also echoed the expectations of industry redefinition and concept changes . Of note, participants suggested the following:
� emergence of more fast casual concepts; � expansion of premium casual dining at the expense of fine and mid-scale family dining but with higher consumer expectations of premium casual dining; and
� FSRs getting out of the lunch business .This year, while demographic changes as the population ages continue to be top-of-mind, operators also mentioned growing population ethnicity as a long-term influencer of the industry.Finally, labour shortages and rising labour costs are also expected to be long-term issues for our industry .
21
4 | Top-of-Mind What CEOs Think

22
2014 Canadian Chain Restaurant Industry Review
4.4 Sustainability
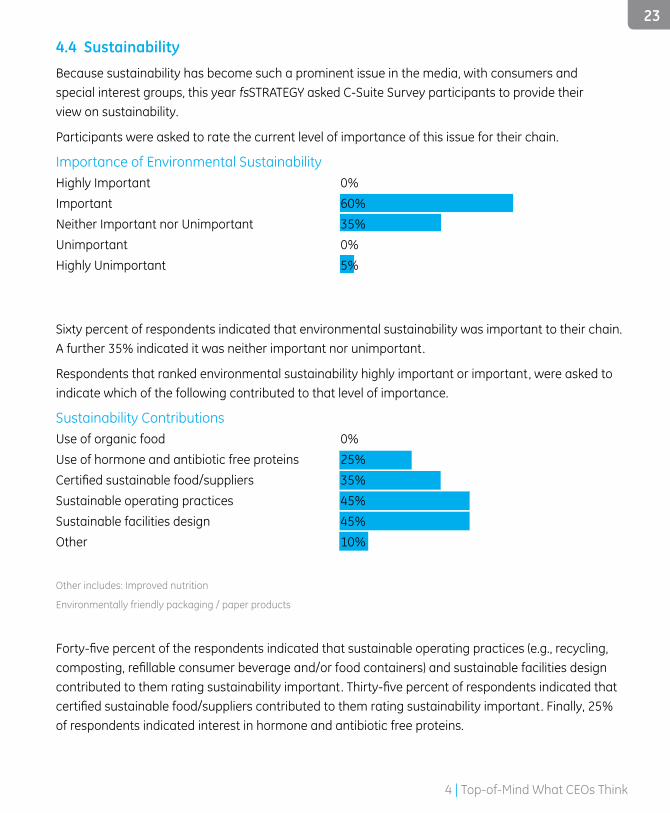
Because sustainability has become such a prominent issue in the media, with consumers and special interest groups, this year fsSTRATEGY asked C-Suite Survey participants to provide their view on sustainability .
Participants were asked to rate the current level of importance of this issue for their chain .
Importance of Environmental SustainabilityHighly Important 0%Important 60%Neither Important nor Unimportant 35%Unimportant 0%Highly Unimportant 5%
Sixty percent of respondents indicated that environmental sustainability was important to their chain . A further 35% indicated it was neither important nor unimportant .
Respondents that ranked environmental sustainability highly important or important, were asked to indicate which of the following contributed to that level of importance .
Sustainability ContributionsUse of organic food 0%Use of hormone and antibiotic free proteins 25%Certified sustainable food/suppliers 35%Sustainable operating practices 45%Sustainable facilities design 45%Other 10%
Other includes: Improved nutrition
Environmentally friendly packaging / paper products
Forty-five percent of the respondents indicated that sustainable operating practices (e.g., recycling, composting, refillable consumer beverage and/or food containers) and sustainable facilities design contributed to them rating sustainability important. Thirty-five percent of respondents indicated that certified sustainable food/suppliers contributed to them rating sustainability important. Finally, 25% of respondents indicated interest in hormone and antibiotic free proteins .
23
4 | Top-of-Mind What CEOs Think

TrendsImpactingRestaurants5.1 Key Consumer Profiles5.2 Key Foodservice Industry Trends5.3 Looking Ahead
5
24
2014 Canadian Chain Restaurant Industry Review
5.1 Key Consumer Profiles
5.1.1 Commercial Restaurant Traffic by Age Group
Canadians love using restaurants, but restaurant traffic did not grow in the past year. During 2013, the percentage of Canadians aged 13+ that visited a restaurant daily decreased to 45% . Compared to 2012, fewer consumers have been eating out across all age groups, making restaurants challenged in the Canadian foodservice market . While uncertain economic conditions appear to be a factor having an impact on consumers eating out of home, Canadians still enjoy going out to restaurants to eat for several reasons, such as family/friends getting together, convenience, and indulgence .
Many restaurants across Canada have been heavily focusing on attracting 18 to 34 year olds, specifically known as “Millennials”, as their population growth is alluring to a foodservice industry making slow gains .
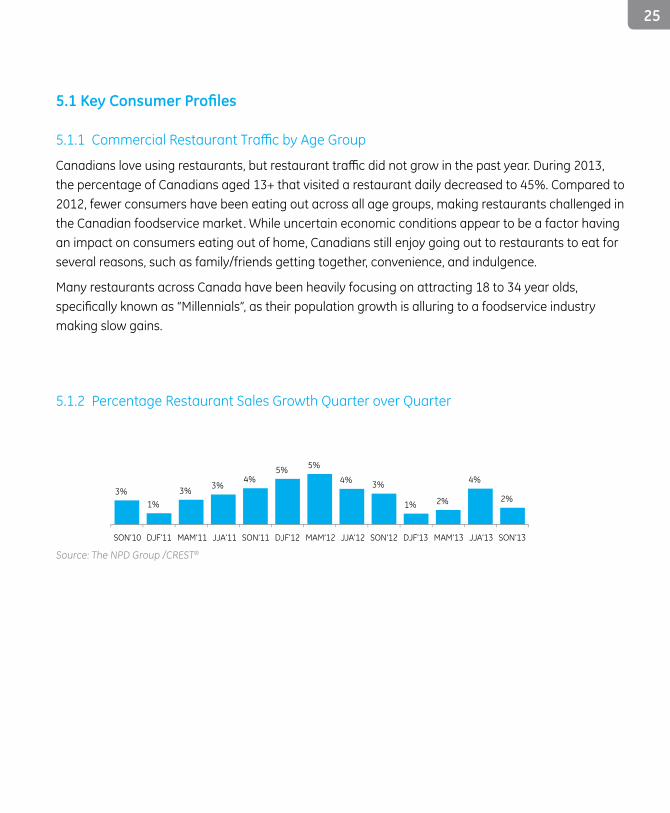
5 .1 .2 Percentage Restaurant Sales Growth Quarter over Quarter
SON’10 DJF’11 MAM’11 JJA’11 SON’11 DJF’12 MAM’12 JJA’12 SON’12 DJF’13 MAM’13 JJA’13 SON’13
3% 1%
3% 3% 4%
5% 5%
4% 3%
1% 2%
4%
2%
Source: The NPD Group /CREST®
25
5.2 Key Foodservice Industry Trends
While the Canadian foodservice industry is still in a fragile recovery as a result of the negative impacts of the global crisis, the ‘battle for share’ environment continues to intensify across all restaurant market segments. All provinces reflected a similar trend with visits remaining flat in the past five years.
With a +1% compound annual growth rate in foodservice visits since 2008 and -1% in the latest year, the Canadian Restaurant Market remains a challenging environment particularly for the QSR segment in Canada, which represents two thirds of visits . The QSRs that are winning in today’s market are those that have capitalized on urbanization through improvements on restaurant décor that reflects an upscale, casual image, as well as those who have an emphasis on menu innovation and promote the concept of premium menu items .
Customer traffic to the QSR segment has been soft to flat since 2008 in most provinces; Alberta is the only province exhibiting modest QSR traffic growth of +3% in the last five years.
The FSR segment, which represents 21% of all restaurant traffic continues to experience challenges in attracting customers on a regular basis . Hardest hit since 2008, all provinces continue to experience flat to declining customer traffic in this segment since.
During the past five years, Home Meal Replacement (“HMR”) has been one of the best performing segments of the Canadian foodservice industry . Today, all of the top Grocery Stores are allocating more resources to their HMR program in order to capture a greater share of consumers’ food dollar . The challenge for Grocery Stores, similar to the greater challenges faced in the overall restaurant market is that the volume of out of home prepared meals is expected to remain flat in 2014 versus last year . Published in late 2013, NPD’s Exploring Untapped Opportunities at HMR report provides a comprehensive study on how Grocery Stores can successfully increase customer traffic to their HMR programs, which highlights the strategies that have helped QSR operators realize gains in this challenging market .
Trends Analysis
Canada’s daypart sales share has experienced a slight change in distribution, which reflects the changing eating habits of Canadians over the past five years. In particular, morning meal is the fastest growing daypart in visits versus any other occasion . Success at morning meal is mainly driven by QSR as a result of convenience, with a +3% compound annual growth since 2008 . FSR faces morning meal challenges with visits down -3% in the last five years. Core offerings such as coffee, breakfast sandwiches, and muffins are supporting the morning meal success at QSR. QSR restaurants that play a dominant role in the morning meal daypart are likely to continue to penetrate the existing habitual preferences among Canadian morning meal consumers .
26
2014 Canadian Chain Restaurant Industry Review
5 | Trends Impacting Restaurants
Source: The NPD Group /CREST®
27
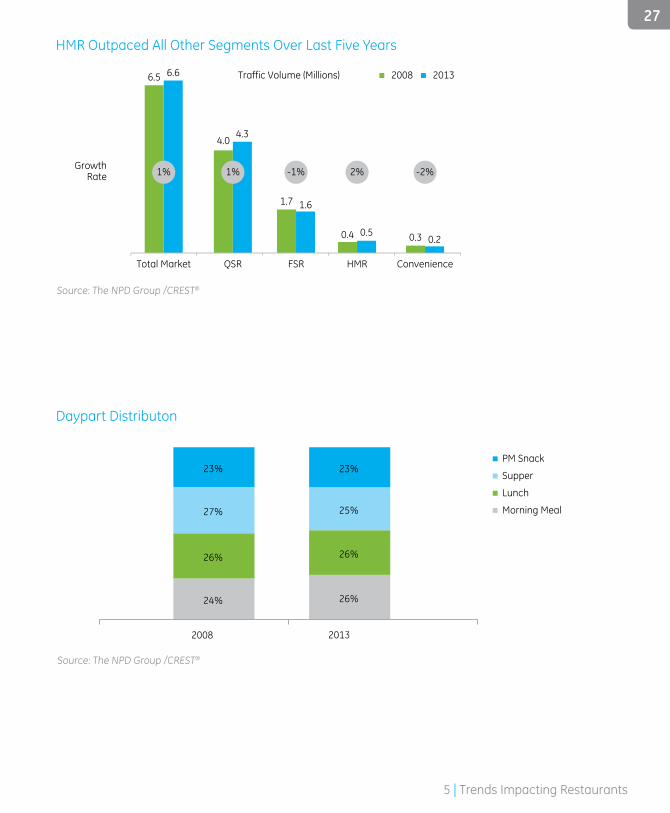
HMR Outpaced All Other Segments Over Last Five Years
5 | Trends Impacting Restaurants
Source: The NPD Group /CREST®
Source: The NPD Group /CREST®
27
Trends Analysis
Canada’s daypart sales share has experienced a slight change in distribution, which reflects the changing eating habits of Canadians over the past five years. In particular, morning meal is the fastest growing daypart in visits versus any other occasion . Success at morning meal is mainly driven by QSR as a result of convenience, with a +3% compound annual growth since 2008 . FSR faces morning meal challenges with visits down -3% in the last five years. Core offerings such as coffee, breakfast sandwiches, and muffins are supporting the morning meal success at QSR. QSR restaurants that play a dominant role in the morning meal daypart are likely to continue to penetrate the existing habitual preferences among Canadian morning meal consumers .
Dollars
4%
3%
-2%
1%
2%
Traffic
11
10
13
65
-2%
-1%
-6%0%
1%
PCYA PCYA
QSR
Family/Midscale
Casual Dining
Fine Dining
Prepared Food from Retail
PCYA = Percent Change vs. Year Ago
7
22
21
46
41
GrowthRate
2013 2008Traffic Volume (Millions)6.66.5
Total Market
4.34.0
QSR
1.61.7
FSR
0.50.4
HMR
0.20.3
Convenience
1% -2%2%-1%1%
Restaurant Market Segments – Share of Traffic and Dollar Sales
HMR Outpaced All Other Segments Over Last Five Years
Source: The NPD Group /CREST®
24% 26%
26% 26%
27% 25%
23% 23%
20132008
PM Snack
Supper
Lunch
Morning Meal
Daypart Distributon

28
2014 Canadian Chain Restaurant Industry Review
5.3 Looking Ahead
5 .3 .1 Population trends
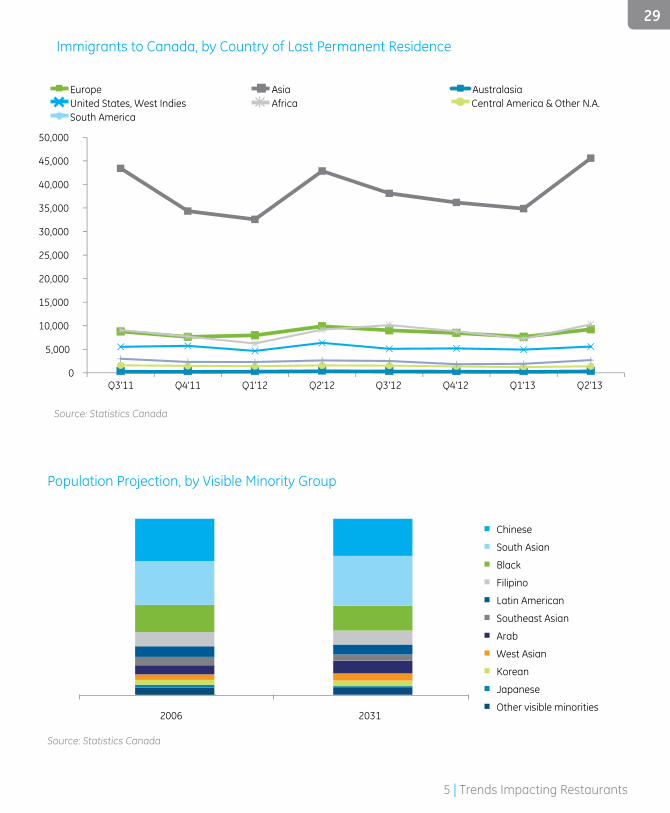
Canada’s demographic environment continues to change with much of the population growth fueled by immigration . The importance of immigration to Canada is put into context when compared to the United States . For instance, over the next ten years, the net migration rate in Canada is forecasted to be nearly 50 percent higher than our neighbours to the south . Immigration to Canada will continue to come primarily from Asia, and though this represents a varied cross-section of groups from a cultural and linguistic perspective, linkages among these groups surface when compared to the population . Visible minorities skew younger and newcomers are more likely to live in a larger household . Given the younger age and larger household size of this population segment, newcomers can be considered a prime growth target .
29
Source: Statistics Canada
0
5,000
10,000
15,000
20,000
25,000
30,000
35,000
40,000
45,000
50,000
Europe Asia Australasia United States, West Indies Africa Central America & Other N.A. South America
Q3'11 Q4'11 Q1'12 Q2'12 Q3'12 Q4'12 Q1'13 Q2'13
Population Projection, by Visible Minority Group
Immigrants to Canada, by Country of Last Permanent Residence
2006 2031
Chinese
South Asian
Black
Filipino
Latin American
Southeast Asian
Arab
West Asian
Korean
Japanese
Other visible minorities
Source: Statistics Canada
5 | Trends Impacting Restaurants

Average After-Tax Income (000s), by Economic Family Type
78
59
81 76
88
109
45
32
79
58
82 76
89
115
46
33
79
58
83 76
89
116
48
33
79
58
83 75
91
114
48
33
80
58
84 76
94
115
45
31
Economic families, two persons or
more
Elderly families (2)
Non-elderly families (3)
Married couples
Two-parent families with
children
Married couples with
other relatives
Lone-parent families
Unattached individuals
2007 2008 2009 2010 2011
Source: Statistics Canada
30
2014 Canadian Chain Restaurant Industry Review
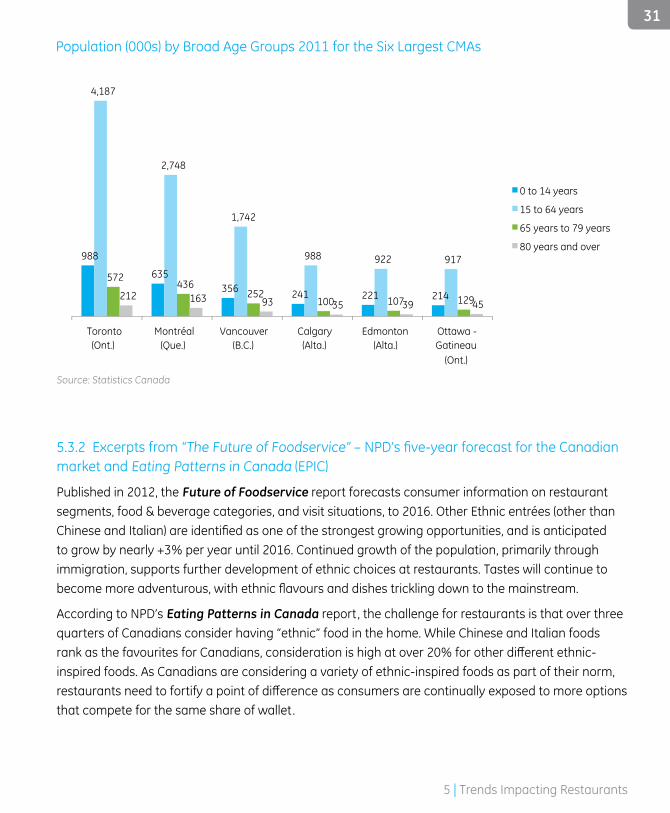
Population (000s) by Broad Age Groups 2011 for the Six Largest CMAs
5 .3 .2 Excerpts from “The Future of Foodservice” – NPD’s five-year forecast for the Canadian market and Eating Patterns in Canada (EPIC)
Published in 2012, the Future of Foodservice report forecasts consumer information on restaurant segments, food & beverage categories, and visit situations, to 2016 . Other Ethnic entrées (other than Chinese and Italian) are identified as one of the strongest growing opportunities, and is anticipated to grow by nearly +3% per year until 2016 . Continued growth of the population, primarily through immigration, supports further development of ethnic choices at restaurants . Tastes will continue to become more adventurous, with ethnic flavours and dishes trickling down to the mainstream.
According to NPD’s Eating Patterns in Canada report, the challenge for restaurants is that over three quarters of Canadians consider having “ethnic” food in the home . While Chinese and Italian foods rank as the favourites for Canadians, consideration is high at over 20% for other different ethnic-inspired foods . As Canadians are considering a variety of ethnic-inspired foods as part of their norm, restaurants need to fortify a point of difference as consumers are continually exposed to more options that compete for the same share of wallet .
Source: Statistics Canada
988
635 356 241 221 214
4,187
2,748
1,742
988 922 917
572 436
252 100 107 129 212 163 93 35 39 45
Toronto (Ont.)
Montréal (Que.)
Vancouver (B.C.)
Calgary (Alta.)
Edmonton (Alta.)
Ottawa - Gatineau
(Ont.)
0 to 14 years
15 to 64 years
65 years to 79 years
80 years and over
5 | Trends Impacting Restaurants
31

Finance 6.1 The Economy6.2 Global Financial Markets6.3 Financial Markets in Canada6.4 Total Financeable Debt Market Size and Loan Volumes
6
32
2014 Canadian Chain Restaurant Industry Review
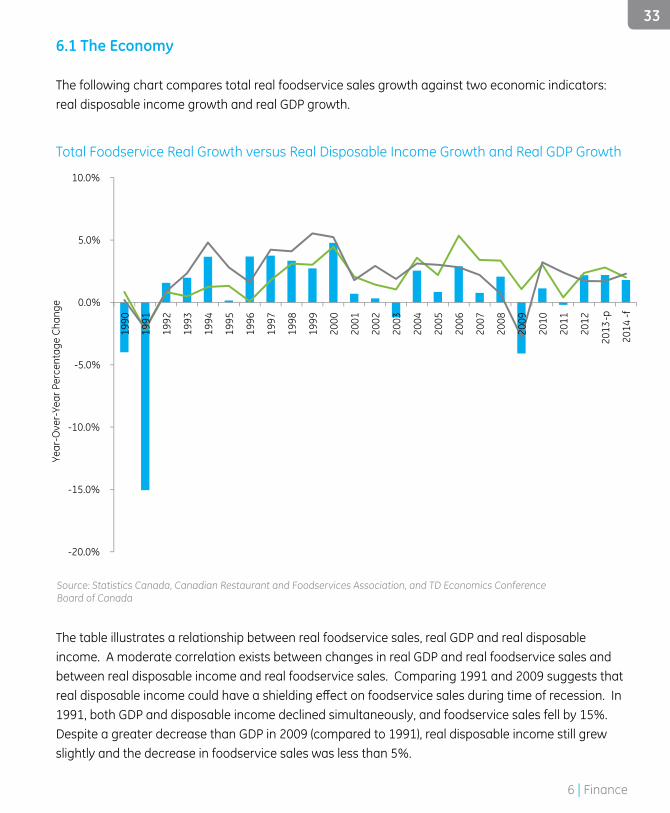
6.1 The Economy
The following chart compares total real foodservice sales growth against two economic indicators: real disposable income growth and real GDP growth .
The table illustrates a relationship between real foodservice sales, real GDP and real disposable income . A moderate correlation exists between changes in real GDP and real foodservice sales and between real disposable income and real foodservice sales . Comparing 1991 and 2009 suggests that real disposable income could have a shielding effect on foodservice sales during time of recession. In 1991, both GDP and disposable income declined simultaneously, and foodservice sales fell by 15% . Despite a greater decrease than GDP in 2009 (compared to 1991), real disposable income still grew slightly and the decrease in foodservice sales was less than 5% .
Total Foodservice Real Growth versus Real Disposable Income Growth and Real GDP Growth
Source: Statistics Canada, Canadian Restaurant and Foodservices Association, and TD Economics Conference Board of Canada
-20.0%
-15.0%
-10.0%
-5.0%
0.0%
5.0%
10.0%
1990
1991
1992
1993
1994
1995
1996
1997
1998
1999
2000
2001
2002
2003
2004
2005
2006
2007
2008
2009
2010
2011
2012
2013
-p
2014
-f
Year
-Ove
r-Ye
ar P
erce
ntag
e Ch
ange
Real Foodservice Sales-Total Real Disposable Income Real GDP
33
6 | Finance
6.2 Global Financial Markets
The positive outlook of the 2014 global economy is shaped by key trends: US, Japan and the Eurozone are experiencing their first synchronized expansion since 2010, supporting global growth in 2014; consumer confidence is increasing in North America; and financial markets are stabilizing in developing economies with China’s strong 7 .5% GDP growth target for this year .
But while strong, China’s growth will be an important support for the global economy in 2014, debt has grown quickly and rebalancing the economy has a long way to go . Also, escalating geopolitical tensions in East Asia and the fast-changing new developments in Ukraine could have substantial economic repercussions that disrupt growth and trade .
Central banks will maintain loose monetary policies to combat deflationary pressures and the European Central Bank (ECB) will ease money supply further at a time when the US Fed considers tapering . The Euro is up by 3% since January, which reduces the ability of Eurozone peripheral countries to benefit from export boom to offset the decline in domestic demand.
The growing importance of liquidity of financial markets will continue to drive swings in assets and commodity prices . In 2013, commodities underperformed developed market equities for the third consecutive year, following ten years of outperformance; slowing China growth, US Fed tightening and rising supply expectations were the main factors weighing on prices . But 2014 could be a turnaround year as a slight increase in metal prices could be expected and oil and gas prices are likely to remain range-bound providing tactical trade opportunities .
Policy response such as tightening rates in emerging markets (EM) in 2013, market volatility and capital flow exposed some weaknesses, especially in India, Brazil, Indonesia, and Turkey leaving less room for fiscal stimulus; fiscal balances deteriorated in most EMs since the onset of the global financial crisis, while the social pressure to expand government spending remained.
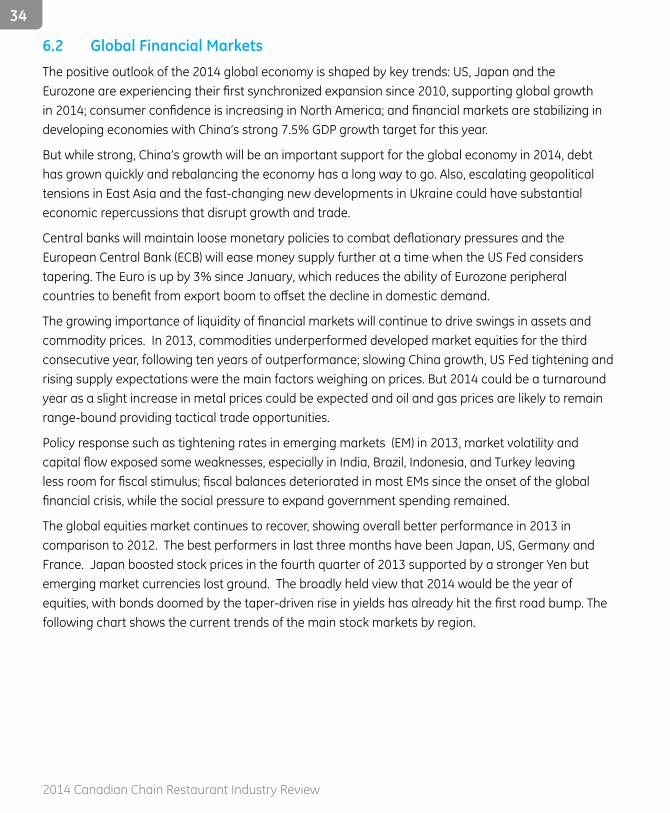
The global equities market continues to recover, showing overall better performance in 2013 in comparison to 2012 . The best performers in last three months have been Japan, US, Germany and France . Japan boosted stock prices in the fourth quarter of 2013 supported by a stronger Yen but emerging market currencies lost ground . The broadly held view that 2014 would be the year of equities, with bonds doomed by the taper-driven rise in yields has already hit the first road bump. The following chart shows the current trends of the main stock markets by region .
34
2014 Canadian Chain Restaurant Industry Review
0
50
100
150
200
250
300
All Commodities Industrials Materials Food Crude Oil
Commodity Prices, IMF IndicesJanuary 2000 = 100
International Stock Market Trends
60
70
80
90
100
110
120
130
140
Jan-
12M
ay-1
2Se
p-12
Jan-
13M
ay-1
3Se
p-13
Jan-
14Ja
n-12
May
-12
Sep-
12Ja
n-13
May
-13
Sep-
13Ja
n-14
Jan-
12M
ay-1
2Se
p-12
Jan-
13M
ay-1
3Se
p-13
Jan-
14
Jan-
12M
ay-1
2Se
p-12
Jan-
13M
ay-1
3Se
p-13
Jan-
14Ja
n-12
May
-12
Sep-
12Ja
n-13
May
-13
Sep-
13Ja
n-14
Jan-
12M
ay-1
2Se
p-12
Jan-
13M
ay-1
3Se
p-13
Jan-
14
Jan-
12M
ay-1
2Se
p-12
Jan-
13M
ay-1
3Se
p-13
Jan-
14Ja
n-12
May
-12
Sep-
12Ja
n-13
May
-13
Sep-
13Ja
n-14
Jan-
12M
ay-1
2Se
p-12
Jan-
13M
ay-1
3Se
p-13
Jan-
14
Jan-
12M
ay-1
2Se
p-12
Jan-
13M
ay-1
3Se
p-13
Jan-
14Ja
n-12
May
-12
Sep-
12Ja
n-13
May
-13
Sep-
13Ja
n-14
Jan-
12M
ay-1
2Se
p-12
Jan-
13M
ay-1
3Se
p-13
Jan-
14
Inde
x (J
an 2
011=
100)
MIItaly
CAC 40France
Hang SengChina
BovespaBrazil
NIKKEIJapan
AX 20Australia
DaxGermany
FTSEUK
Dow JonesUS
S&PUS
MexBolMexico
IBEXSpain
North AmericaLatin AmericaEuropeAsia Pacific
Source: GE Market Intelligence Network
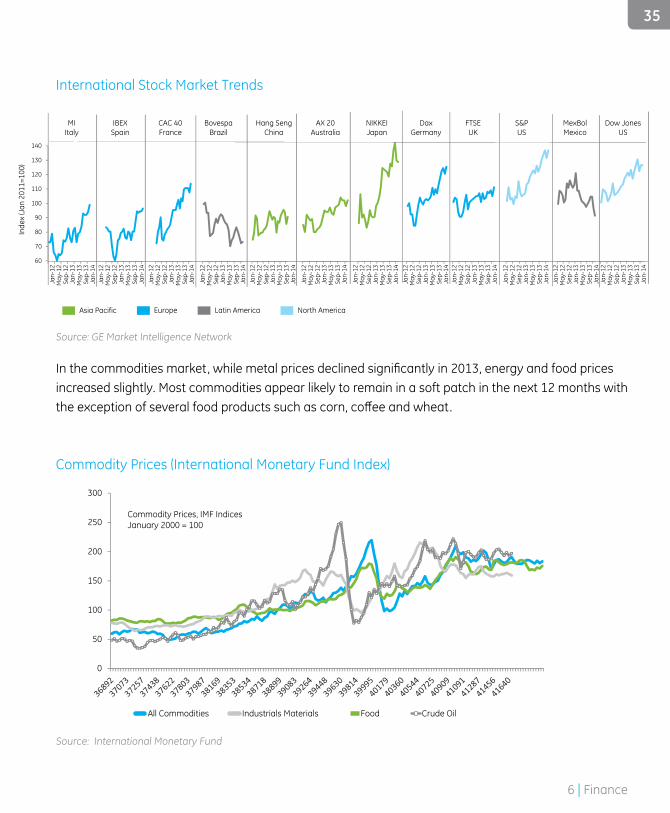
In the commodities market, while metal prices declined significantly in 2013, energy and food prices increased slightly . Most commodities appear likely to remain in a soft patch in the next 12 months with the exception of several food products such as corn, coffee and wheat.
Commodity Prices (International Monetary Fund Index)
Source: International Monetary Fund
35
6 | Finance
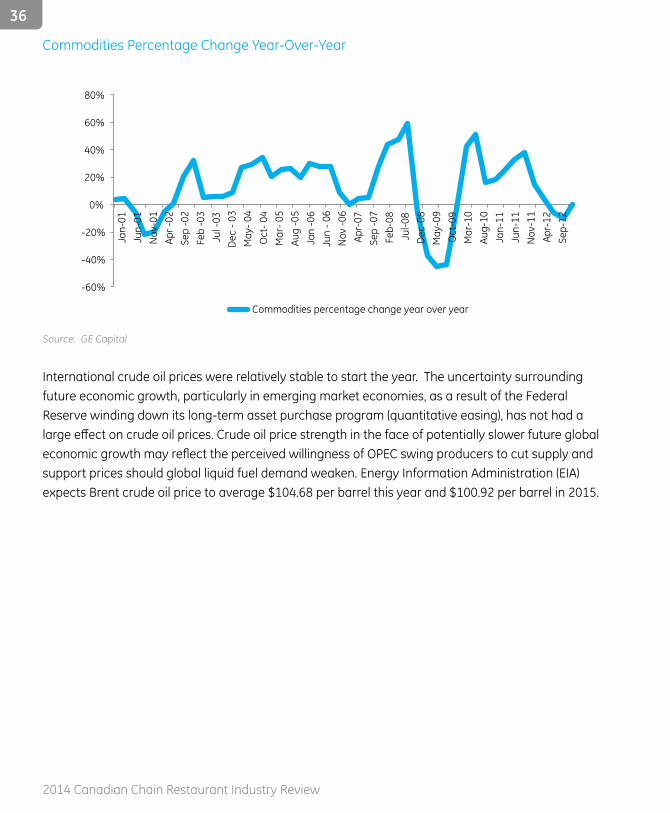
Commodities Percentage Change Year-Over-Year
Source: GE Capital
International crude oil prices were relatively stable to start the year . The uncertainty surrounding future economic growth, particularly in emerging market economies, as a result of the Federal Reserve winding down its long-term asset purchase program (quantitative easing), has not had a large effect on crude oil prices. Crude oil price strength in the face of potentially slower future global economic growth may reflect the perceived willingness of OPEC swing producers to cut supply and support prices should global liquid fuel demand weaken . Energy Information Administration (EIA) expects Brent crude oil price to average $104 .68 per barrel this year and $100 .92 per barrel in 2015 .
-60%
-40%
-20%
0%
20%
40%
60%
80%
Commodities percentage change year over year
Jan-
01
Jun-
01
Nov
-01
Apr -
02
Sep
-02
Feb
-03
Jul -
03
Dec
- 03
M
ay- 0
4 O
ct- 0
4 M
ar- 0
5 Au
g -0
5 Ja
n -0
6 Ju
n - 0
6 N
ov -0
6 Ap
r-07
Se
p -0
7 Fe
b-08
Ju
l-08
Dec
-08
May
-09
Oct
-09
Mar
-10
Aug-
10
Jan-
11
Jun-
11
Nov
-11
Apr-
12
Sep-
12
36
2014 Canadian Chain Restaurant Industry Review

Crude Oil Prices (Price per Barrel) Since 2000
Source: GE Capital & EIA
0
20
40
60
80
100
120
140
160
Jul-0
0
Jul-1
2
$US Dollars
Brent Crude Oil Price Per Barrel
37
6 | Finance
6.3 Financial Markets in Canada
Analysis
The Europe and US economic recovery will benefit Canada’s near-term economic outlook and the stability of its financial markets. The domestic demand is improving, the unemployment rate is falling, the Purchasing Manager’s index increasing and business confidence is up. However, high tensions and geopolitical uncertainty (e .g ., Ukraine) are tempering global economic optimism in 2014 .
Concerns about the high level of Canadian household debt is still persisting, so a rise in the base interest rate would be troublesome because so much debt is tied to mortgages and could cause a sudden deleveraging .
The Bank of Canada held firm on keeping its interest rate at 1% as an incentive to increase investment and exports as foreign demand strengthens and uncertainty diminishes. With an inflation rate close to 2% and the economy expanding, GE Capital expects that the Bank of Canada will hold interest rates steady until the end of 2014 .
Since October last year, the Canadian dollar lost 6 .8% against the US dollar driven by soft exports, a limited shift toward business investment, and US Fed’s stance . As the US recovery builds, and exports and investment improve, GE Capital expects the Canadian dollar to stabilize .
Forecast
Although Canada’s overall export growth rates were below expectations in 2013, the Canadian economy rebounded at 2 .9% GDP growth on a quarter to quarter basis annualized in the fourth quarter, representing 2% on an annual basis; the oil extraction and mining sectors showed the strongest growth supporting the GDP’s increase . In 2014, strong increases in investment will be expected in transportation and warehousing, housing and public administration sectors . Geographically, total capital investment is anticipated to increase in six of 13 provinces and territories in 2014 . Alberta anticipates the largest increase to support the oil and gas industry .
Despite the unexpected decrease of employment in January, the Canadian unemployment rate will continue to be close to 7% with a moderated wage growth in the next three years that will help to keep prices in line as the Canadian government holds the interest rate steady during 2014 .
GE Capital sees Canada’s GDP growth picking up to 2 .3% in 2014 based on recovery of US, China and Europe, increased government investment and the weak Canadian dollar that will boost Canadian exports .
The US economy is forecasted to grow by almost 4% in 2014 with the labour market improving, US consumer confidence growing, steady gasoline prices and increasing US housing starts.
38
2014 Canadian Chain Restaurant Industry Review
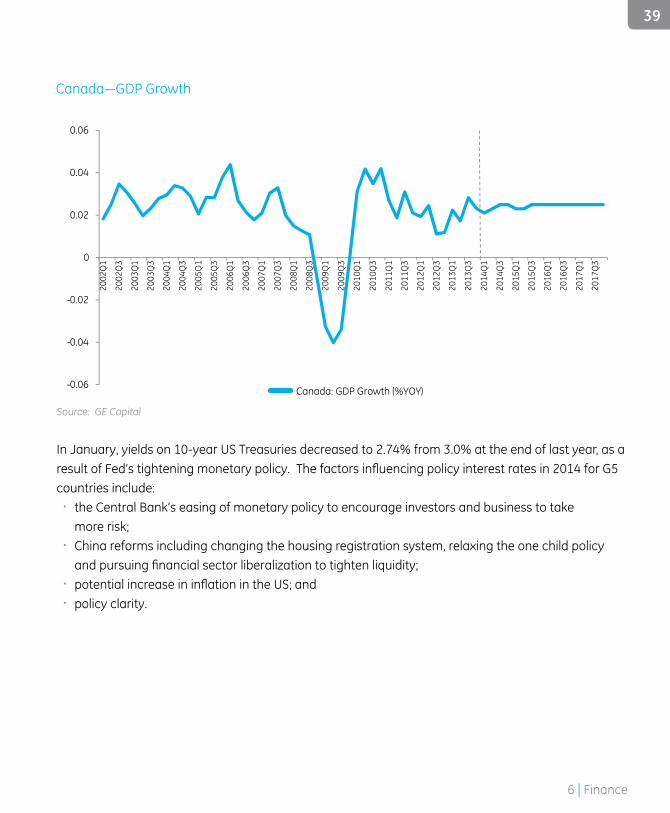
Canada—GDP Growth
Source: GE Capital
In January, yields on 10-year US Treasuries decreased to 2 .74% from 3 .0% at the end of last year, as a result of Fed’s tightening monetary policy. The factors influencing policy interest rates in 2014 for G5 countries include:
� the Central Bank’s easing of monetary policy to encourage investors and business to take more risk;
� China reforms including changing the housing registration system, relaxing the one child policy and pursuing financial sector liberalization to tighten liquidity;
� potential increase in inflation in the US; and � policy clarity .
-0.06
-0.04
-0.02
0
0.02
0.04
0.06
2002
Q1
2002
Q3
2003
Q1
2003
Q3
2004
Q1
2004
Q3
2005
Q1
2005
Q3
2006
Q1
2006
Q3
2007
Q1
2007
Q3
2008
Q1
2008
Q3
2009
Q1
2009
Q3
2010
Q1
2010
Q3
2011
Q1
2011
Q3
2012
Q1
2012
Q3
2013
Q1
2013
Q3
2014
Q1
2014
Q3
2015
Q1
2015
Q3
2016
Q1
2016
Q3
2017
Q1
2017
Q3
Canada: GDP Growth (%YOY)
39
6 | Finance

G5 Average Policy Interest Rates
Source: GE Capital
Note: The G5 economies include the United States, the Euro Area, Japan, the United Kingdom and Canada .
0%
1%
2%
3%
4%
5%
6%M
ar-0
0
Nov
-01
Jul-0
1
Mar
-02
Nov
-02
Jul-0
3
Mar
-04
Nov
-04
Jul-0
5
Mar
-06
Nov
-06
Jul-0
7
Mar
-08
Nov
-08
Jul-0
9
Mar
-10
Nov
-10
Jul-1
1
Mar
-12
Nov
-12
Jul-1
3
Mar
-14
GE Average Policy Interest Rate
40
2014 Canadian Chain Restaurant Industry Review
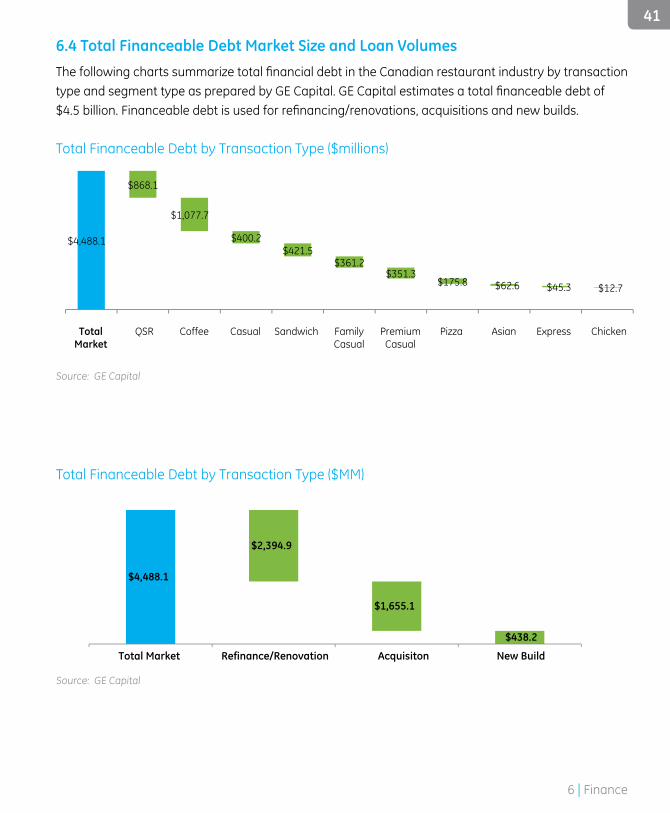
6.4 Total Financeable Debt Market Size and Loan Volumes
The following charts summarize total financial debt in the Canadian restaurant industry by transaction type and segment type as prepared by GE Capital. GE Capital estimates a total financeable debt of $4.5 billion. Financeable debt is used for refinancing/renovations, acquisitions and new builds.
Total Financeable Debt by Transaction Type ($millions)
Total Financeable Debt by Transaction Type ($MM)
Source: GE Capital
Source: GE Capital
$4,488.1
$868.1
$1,077.7
$400.2 $421.5
$361.2 $351.3
$175.8 $62.6 $45.3 $12.7
TotalMarket
QSR Coffee Casual Sandwich Pizza Asian Express ChickenFamilyCasual
PremiumCasual
$4,488.1
$2,394.9
$1,655.1
$438.2
Total Market Refinance/Renovation Acquisiton New Build
41
6 | Finance

Cost ofDoing Business 7.1 Cost of Sales7.2 Labour Costs7.3 Rental and Occupancy Costs7.4 Other Operating Costs 7.5 CAPEX
7
42
2014 Canadian Chain Restaurant Industry Review
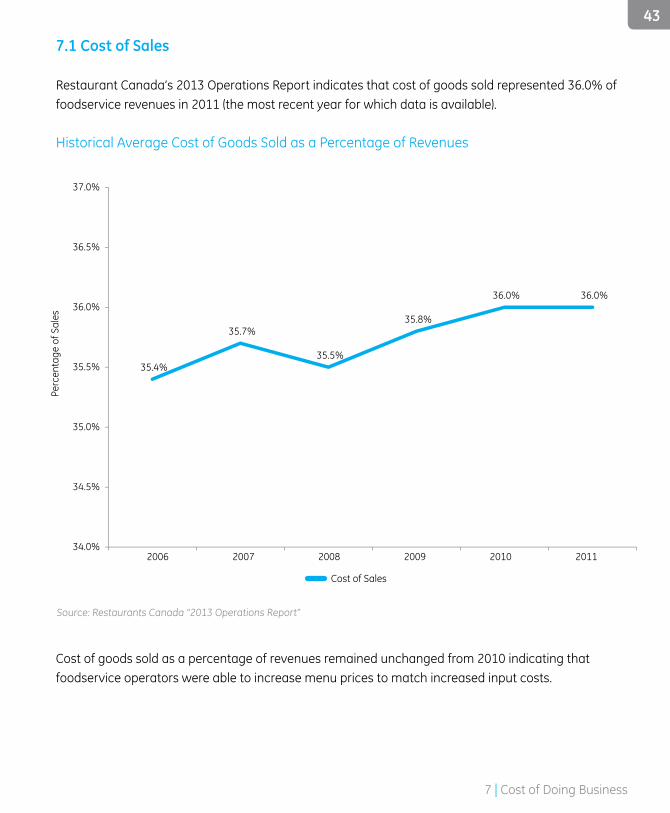
7.1 Cost of Sales
Restaurant Canada’s 2013 Operations Report indicates that cost of goods sold represented 36 .0% of foodservice revenues in 2011 (the most recent year for which data is available) .
Historical Average Cost of Goods Sold as a Percentage of Revenues
Cost of goods sold as a percentage of revenues remained unchanged from 2010 indicating that foodservice operators were able to increase menu prices to match increased input costs .
35.4%
35.7%
35.5%
35.8%
36.0% 36.0%
34.0%
34.5%
35.0%
35.5%
36.0%
36.5%
37.0%
2006 2007 2008 2009 2010 2011
Perc
enta
ge o
f Sal
es
Cost of Sales
Source: Restaurants Canada “2013 Operations Report”
43
7 | Cost of Doing Business
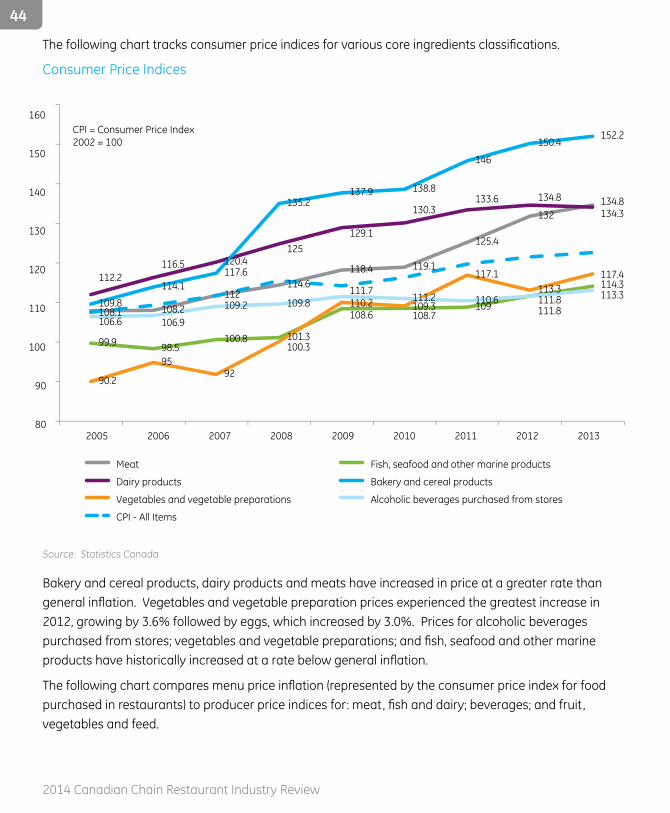
The following chart tracks consumer price indices for various core ingredients classifications.
Consumer Price Indices
Bakery and cereal products, dairy products and meats have increased in price at a greater rate than general inflation. Vegetables and vegetable preparation prices experienced the greatest increase in 2012, growing by 3 .6% followed by eggs, which increased by 3 .0% . Prices for alcoholic beverages purchased from stores; vegetables and vegetable preparations; and fish, seafood and other marine products have historically increased at a rate below general inflation.
The following chart compares menu price inflation (represented by the consumer price index for food purchased in restaurants) to producer price indices for: meat, fish and dairy; beverages; and fruit, vegetables and feed .
108.1 108.2 112
114.6 118.4 119.1
125.4
132 134.8
99.9 98.5 100.8 101.3
108.6
108.7 109 111.8
114.3 112.2
116.5
120.4 125
129.1
130.3
133.6
134.8
134.3
109.8
114.1 117.6
135.2 137.9 138.8
146
150.4 152.2
90.2
95 92
100.3
110.2 109.3
117.1 113.3
117.4
106.6 106.9
109.2 109.8 111.7 111.2 110.6
111.8 113.3
80
90
100
110
120
130
140
150
160
20062005 2007 2008 2009 2010 2011 20132012
Meat Fish, seafood and other marine products
Dairy products Bakery and cereal products
Vegetables and vegetable preparations Alcoholic beverages purchased from stores
CPI - All Items
CPI = Consumer Price Index2002 = 100
Source: Statistics Canada
44
2014 Canadian Chain Restaurant Industry Review
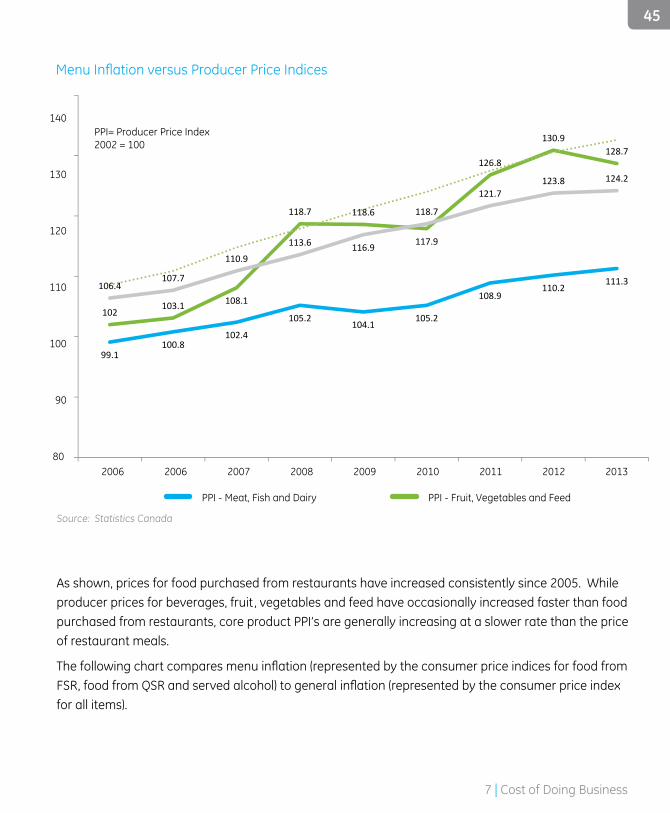
Menu Inflation versus Producer Price Indices
As shown, prices for food purchased from restaurants have increased consistently since 2005 . While producer prices for beverages, fruit, vegetables and feed have occasionally increased faster than food purchased from restaurants, core product PPI’s are generally increasing at a slower rate than the price of restaurant meals .
The following chart compares menu inflation (represented by the consumer price indices for food from FSR, food from QSR and served alcohol) to general inflation (represented by the consumer price index for all items) .
Source: Statistics Canada
99.1 100.8
102.4
105.2 104.1
105.2
108.9 110.2
111.3
102 103.1 108.1
118.7 118.6
117.9
126.8
130.9 128.7
106.4 107.7
110.9
113.6 116.9
118.7
121.7 123.8 124.2
80
90
100
110
120
130
140PPI= Producer Price Index2002 = 100
2006 2006 2007 2008 2009 2010 2011 2012 2013
PPI - Meat, Fish and Dairy PPI - Fruit, Vegetables and Feed
PPI - Beverages CPI - Food from Restaurants
45
7 | Cost of Doing Business
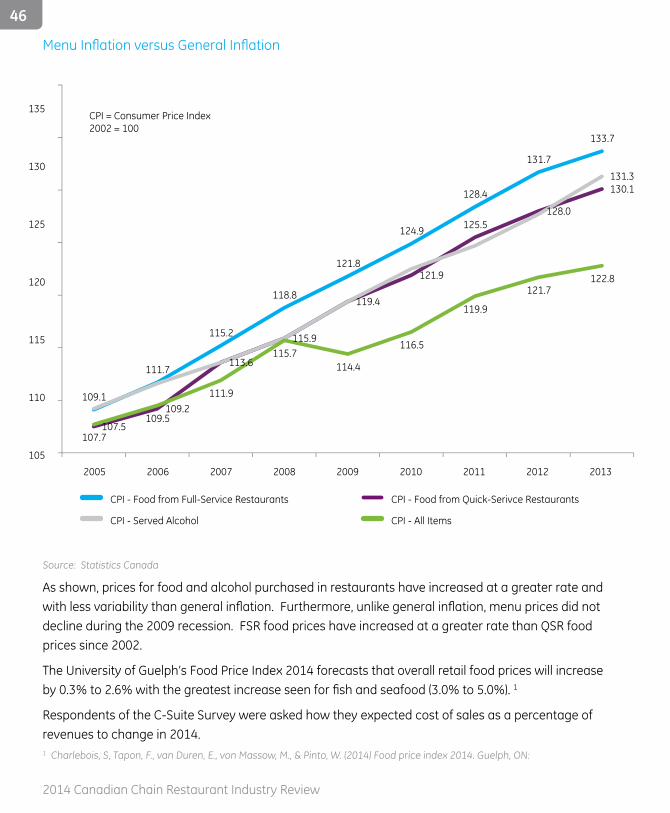
Menu Inflation versus General Inflation
As shown, prices for food and alcohol purchased in restaurants have increased at a greater rate and with less variability than general inflation. Furthermore, unlike general inflation, menu prices did not decline during the 2009 recession . FSR food prices have increased at a greater rate than QSR food prices since 2002 .
The University of Guelph’s Food Price Index 2014 forecasts that overall retail food prices will increase by 0.3% to 2.6% with the greatest increase seen for fish and seafood (3.0% to 5.0%). 1
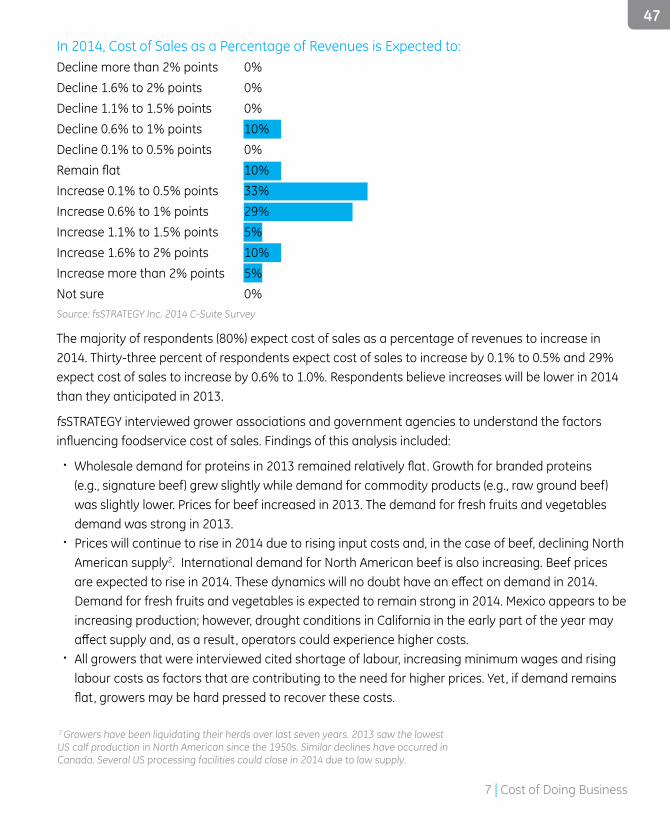
Respondents of the C-Suite Survey were asked how they expected cost of sales as a percentage of revenues to change in 2014 .
Source: Statistics Canada
1 Charlebois, S, Tapon, F ., van Duren, E ., von Massow, M ., & Pinto, W . (2014) Food price index 2014 . Guelph, ON:
109.1
111.7
115.2
118.8
121.8
124.9
128.4
131.7
133.7
107.5
109.2
113.6
115.9
119.4
121.9
125.5 128.0
130.1 131.3
107.7
109.5
111.9
115.7 114.4
116.5
119.9
121.7 122.8
CPI = Consumer Price Index 2002 = 100
105
110
115
120
125
130
135
2005 2006 2007 2008 2009 2010 2011 20132012
CPI - Food from Full-Service Restaurants CPI - Food from Quick-Serivce Restaurants
CPI - Served Alcohol CPI - All Items
46
2014 Canadian Chain Restaurant Industry Review
2 Growers have been liquidating their herds over last seven years . 2013 saw the lowest US calf production in North American since the 1950s . Similar declines have occurred in Canada . Several US processing facilities could close in 2014 due to low supply .
47
In 2014, Cost of Sales as a Percentage of Revenues is Expected to:Decline more than 2% points 0%Decline 1 .6% to 2% points 0%Decline 1 .1% to 1 .5% points 0%Decline 0 .6% to 1% points 10%Decline 0 .1% to 0 .5% points 0%Remain flat 10%Increase 0 .1% to 0 .5% points 33%Increase 0 .6% to 1% points 29%Increase 1 .1% to 1 .5% points 5%Increase 1 .6% to 2% points 10%Increase more than 2% points 5%Not sure 0%Source: fsSTRATEGY Inc . 2014 C-Suite Survey
The majority of respondents (80%) expect cost of sales as a percentage of revenues to increase in 2014 . Thirty-three percent of respondents expect cost of sales to increase by 0 .1% to 0 .5% and 29% expect cost of sales to increase by 0 .6% to 1 .0% . Respondents believe increases will be lower in 2014 than they anticipated in 2013 .
fsSTRATEGY interviewed grower associations and government agencies to understand the factors influencing foodservice cost of sales. Findings of this analysis included:
� Wholesale demand for proteins in 2013 remained relatively flat. Growth for branded proteins (e .g ., signature beef) grew slightly while demand for commodity products (e .g ., raw ground beef) was slightly lower . Prices for beef increased in 2013 . The demand for fresh fruits and vegetables demand was strong in 2013 .
� Prices will continue to rise in 2014 due to rising input costs and, in the case of beef, declining North American supply2 . International demand for North American beef is also increasing . Beef prices are expected to rise in 2014. These dynamics will no doubt have an effect on demand in 2014. Demand for fresh fruits and vegetables is expected to remain strong in 2014 . Mexico appears to be increasing production; however, drought conditions in California in the early part of the year may affect supply and, as a result, operators could experience higher costs.
� All growers that were interviewed cited shortage of labour, increasing minimum wages and rising labour costs as factors that are contributing to the need for higher prices . Yet, if demand remains flat, growers may be hard pressed to recover these costs.
7 | Cost of Doing Business
7.2 Labour Costs
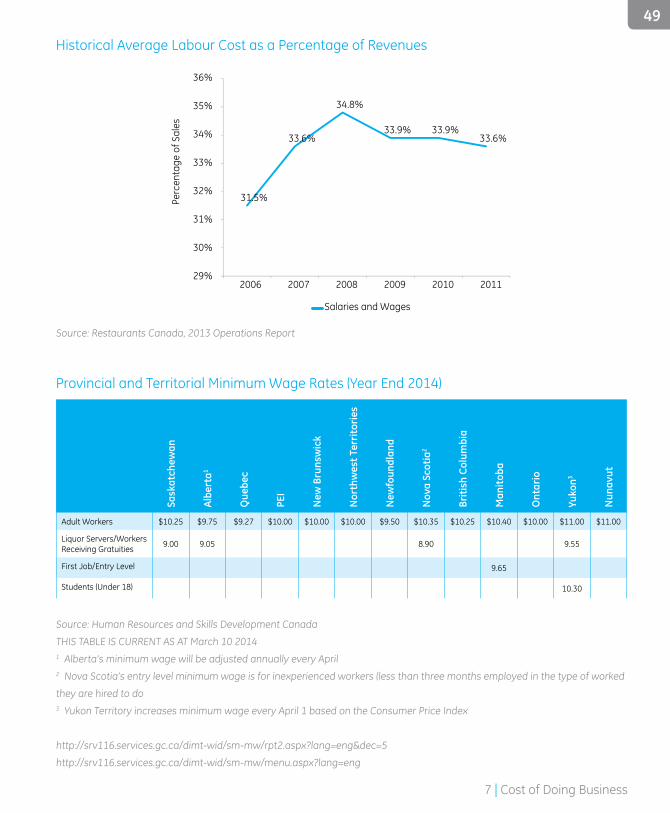
Restaurants Canada’s 2013 Operations Report indicates that salaries and wages represented 33 .6% of foodservice revenues in 2011 (the most recent year for which data is available) .
Salaries and wages as a percentage of revenues in 2011 decreased slightly from 33 .9% in 2009 and 2010 to 33 .6% in 2011 .
By the end of 2014, provincial and territorial minimum wages for adult workers will have increased by 15% from minimum wages at the end of 2009 .
3 Operators will need to innovate with existing ingredients as opposed to using new producer products .
fsSTRATEGY also interviewed foodservice distributors to understand the factors influencing foodservice cost of sales . Findings of this analysis included:
� Foodservice distributors report demand in 2013 remained relatively flat compared to 2012. The only growth experienced was from independent operators; chain demand remained flat. Distributors did not see prices increase as much as expected, as some of the dire cost increases that were predicted did not materialize from suppliers .
� Distributors expect foodservice sales to grow by two to three percent in 2014, with a small amount of traffic growth and the majority of growth coming through operator price increases. Weather conditions in the early part of 2014 have dampened restaurant traffic. Some distributors hope that the declining Canadian dollar will spur some additional cross border tourism and, therefore, foodservice demand. Distributors are facing significant labour shortage issues and rising fuel costs. Distributors expect price increases for their customers in 2014 will be at or just over inflation. Distributors are working hard to absorb rising costs by introducing greater efficiency through technological innovations and better route scheduling .
� Distributors suggest that a number of issues will affect the foodservice industry in 2014. These include:
� continuing concern over supply-managed products and their effect on foodservice operating costs;
� limited product innovation on the part of food processors, leading to some limitations on new product introduction by foodservice operators3; and
� continuing consolidation in both the food distribution and foodservice operator sectors .
48
2014 Canadian Chain Restaurant Industry Review
31.5%
33.6%
34.8%
33.9% 33.9% 33.6%
29%
30%
31%
32%
33%
34%
35%
36%
2006 2007 2008 2009 2010 2011
Perc
enta
ge o
f Sal
es
Salaries and Wages
Historical Average Labour Cost as a Percentage of Revenues
Provincial and Territorial Minimum Wage Rates (Year End 2014)
Sask
atch
ewan
Albe
rta1
Que
bec
PEI
New
Bru
nsw
ick
Nor
thw
est T
erri
tori
es
New
foun
dlan
d
Nov
a Sc
otia
2
Briti
sh C
olum
bia
Man
itoba
Ont
ario
Yuko
n3
Nun
avut
Adult Workers $10 .25 $9 .75 $9 .27 $10 .00 $10 .00 $10 .00 $9 .50 $10 .35 $10 .25 $10 .40 $10 .00 $11 .00 $11 .00
Liquor Servers/Workers Receiving Gratuities 9 .00 9 .05 8 .90 9 .55
First Job/Entry Level 9 .65
Students (Under 18) 10 .30
Source: Human Resources and Skills Development Canada
THIS TABLE IS CURRENT AS AT March 10 20141 Alberta’s minimum wage will be adjusted annually every April2 Nova Scotia’s entry level minimum wage is for inexperienced workers (less than three months employed in the type of worked
they are hired to do3 Yukon Territory increases minimum wage every April 1 based on the Consumer Price Index
http://srv116.services.gc.ca/dimt-wid/sm-mw/rpt2.aspx?lang=eng&dec=5
http://srv116.services.gc.ca/dimt-wid/sm-mw/menu.aspx?lang=eng
Source: Restaurants Canada, 2013 Operations Report
49
7 | Cost of Doing Business
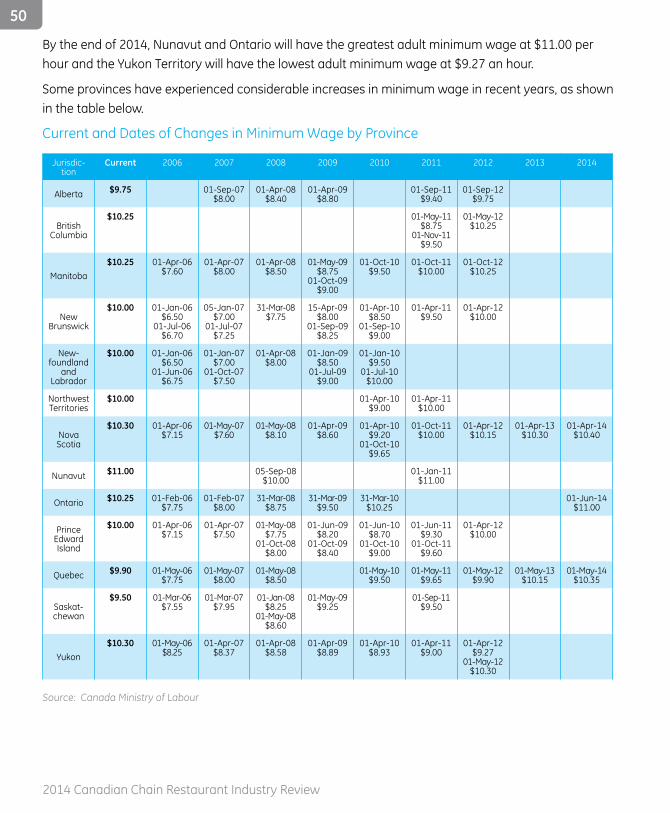
By the end of 2014, Nunavut and Ontario will have the greatest adult minimum wage at $11 .00 per hour and the Yukon Territory will have the lowest adult minimum wage at $9 .27 an hour .
Some provinces have experienced considerable increases in minimum wage in recent years, as shown in the table below .
Current and Dates of Changes in Minimum Wage by Province
Jurisdic-tion
Current 2006 2007 2008 2009 2010 2011 2012 2013 2014
Alberta $9.75 01-Sep-07$8 .00
01-Apr-08$8 .40
01-Apr-09$8 .80
01-Sep-11$9 .40
01-Sep-12$9 .75
British Columbia
$10.25 01-May-11$8 .75
01-Nov-11$9 .50
01-May-12$10 .25
Manitoba$10.25 01-Apr-06
$7 .6001-Apr-07
$8 .0001-Apr-08
$8 .5001-May-09
$8 .7501-Oct-09
$9 .00
01-Oct-10$9 .50
01-Oct-11$10 .00
01-Oct-12$10 .25
New Brunswick
$10.00 01-Jan-06$6 .50
01-Jul-06$6 .70
05-Jan-07$7 .00
01-Jul-07$7 .25
31-Mar-08$7 .75
15-Apr-09$8 .00
01-Sep-09$8 .25
01-Apr-10$8 .50
01-Sep-10$9 .00
01-Apr-11$9 .50
01-Apr-12$10 .00
New-foundland
and Labrador
$10.00 01-Jan-06$6 .50
01-Jun-06$6 .75
01-Jan-07$7 .00
01-Oct-07$7 .50
01-Apr-08$8 .00
01-Jan-09$8 .50
01-Jul-09$9 .00
01-Jan-10$9 .50
01-Jul-10$10 .00
Northwest Territories
$10.00 01-Apr-10$9 .00
01-Apr-11$10 .00
Nova Scotia
$10.30 01-Apr-06$7 .15
01-May-07$7 .60
01-May-08$8 .10
01-Apr-09$8 .60
01-Apr-10$9 .20
01-Oct-10$9 .65
01-Oct-11$10 .00
01-Apr-12$10 .15
01-Apr-13$10 .30
01-Apr-14$10 .40
Nunavut $11.00 05-Sep-08$10 .00
01-Jan-11$11 .00
Ontario $10.25 01-Feb-06$7 .75
01-Feb-07$8 .00
31-Mar-08$8 .75
31-Mar-09$9 .50
31-Mar-10$10 .25
01-Jun-14$11 .00
Prince Edward Island
$10.00 01-Apr-06$7 .15
01-Apr-07$7 .50
01-May-08$7 .75
01-Oct-08$8 .00
01-Jun-09$8 .20
01-Oct-09$8 .40
01-Jun-10$8 .70
01-Oct-10$9 .00
01-Jun-11$9 .30
01-Oct-11$9 .60
01-Apr-12$10 .00
Quebec $9.90 01-May-06$7 .75
01-May-07$8 .00
01-May-08$8 .50
01-May-10$9 .50
01-May-11$9 .65
01-May-12$9 .90
01-May-13$10 .15
01-May-14$10 .35
Saskat-chewan
$9.50 01-Mar-06$7 .55
01-Mar-07$7 .95
01-Jan-08$8 .25
01-May-08$8 .60
01-May-09$9 .25
01-Sep-11$9 .50
Yukon$10.30 01-May-06
$8 .2501-Apr-07
$8 .3701-Apr-08
$8 .5801-Apr-09
$8 .8901-Apr-10
$8 .9301-Apr-11
$9 .0001-Apr-12
$9 .2701-May-12
$10 .30
Source: Canada Ministry of Labour
50
2014 Canadian Chain Restaurant Industry Review
Employment Indices—All Industries, Foodservice and Employees per Foodservice Location
Source: Labour Force Survey, Statistics Canada
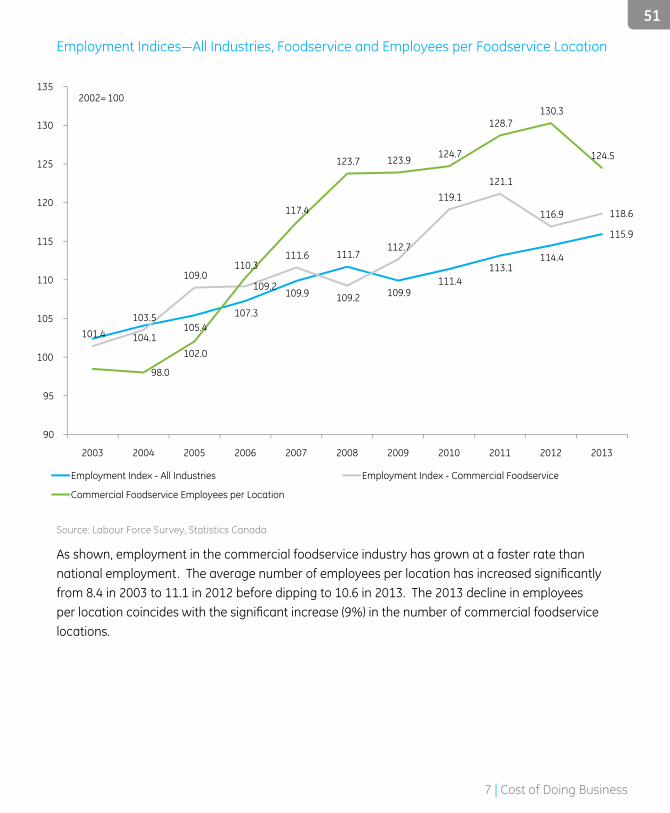
As shown, employment in the commercial foodservice industry has grown at a faster rate than national employment. The average number of employees per location has increased significantly from 8 .4 in 2003 to 11 .1 in 2012 before dipping to 10 .6 in 2013 . The 2013 decline in employees per location coincides with the significant increase (9%) in the number of commercial foodservice locations .
104.1 105.4
107.3
109.9
111.7
109.9 111.4
113.1 114.4
115.9
101.4
103.5
109.0 109.2
111.6
109.2
112.7
119.1 121.1
116.9 118.6
98.0
102.0
110.3
117.4
123.7 123.9 124.7
128.7 130.3
124.5
90
95
100
105
110
115
120
125
130
135
Employment Index - All Industries Employment Index - Commercial Foodservice
Commercial Foodservice Employees per Location
2002 = 100
20052003 2004 2006 2007 2008 2009 2010 2011 20132012
51
7 | Cost of Doing Business
6.8%
7.0%
7.2% 7.2%
7.6% 7.7%
6.2%
6.4%
6.6%
6.8%
7.0%
7.2%
7.4%
7.6%
7.8%
Rental and leasing
Perc
enta
ge o
f Sal
es
2006 2007 2008 2009 2010 2011
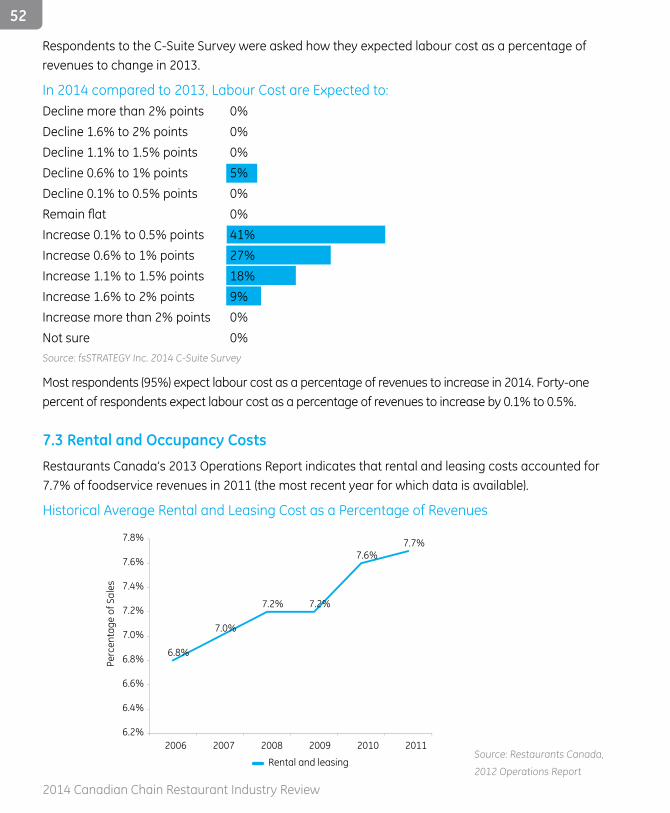
7.3 Rental and Occupancy Costs
Restaurants Canada’s 2013 Operations Report indicates that rental and leasing costs accounted for 7 .7% of foodservice revenues in 2011 (the most recent year for which data is available) .
Historical Average Rental and Leasing Cost as a Percentage of Revenues
Source: Restaurants Canada,
2012 Operations Report
52
2014 Canadian Chain Restaurant Industry Review
Respondents to the C-Suite Survey were asked how they expected labour cost as a percentage of revenues to change in 2013 .
In 2014 compared to 2013, Labour Cost are Expected to:Decline more than 2% points 0%Decline 1 .6% to 2% points 0%Decline 1 .1% to 1 .5% points 0%Decline 0 .6% to 1% points 5%Decline 0 .1% to 0 .5% points 0%Remain flat 0%Increase 0 .1% to 0 .5% points 41%Increase 0 .6% to 1% points 27%Increase 1 .1% to 1 .5% points 18%Increase 1 .6% to 2% points 9%Increase more than 2% points 0%Not sure 0%Source: fsSTRATEGY Inc . 2014 C-Suite Survey
Most respondents (95%) expect labour cost as a percentage of revenues to increase in 2014 . Forty-one percent of respondents expect labour cost as a percentage of revenues to increase by 0 .1% to 0 .5% .
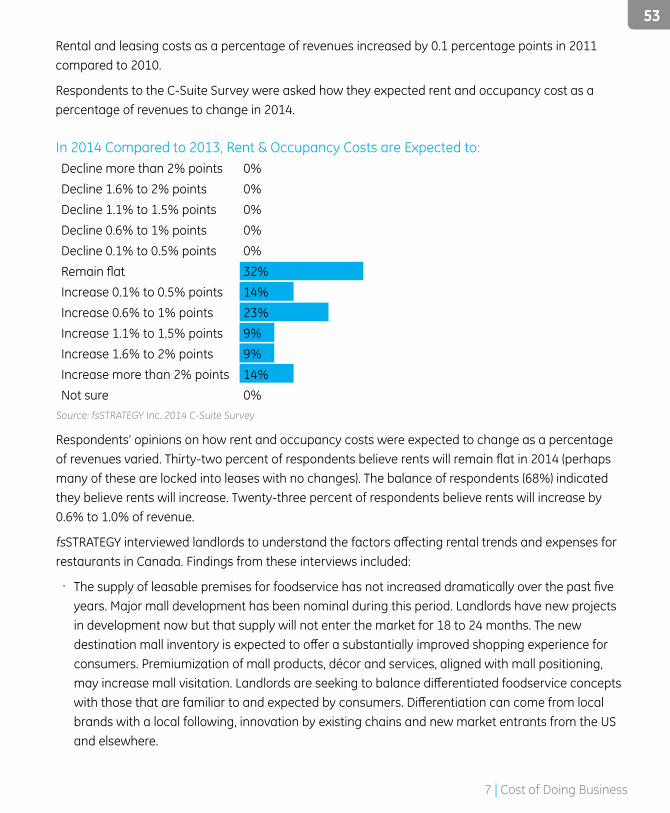
Rental and leasing costs as a percentage of revenues increased by 0 .1 percentage points in 2011 compared to 2010 .
Respondents to the C-Suite Survey were asked how they expected rent and occupancy cost as a percentage of revenues to change in 2014 .
53
In 2014 Compared to 2013, Rent & Occupancy Costs are Expected to: Decline more than 2% points 0%Decline 1 .6% to 2% points 0%Decline 1 .1% to 1 .5% points 0%Decline 0 .6% to 1% points 0%Decline 0 .1% to 0 .5% points 0%Remain flat 32%Increase 0 .1% to 0 .5% points 14%Increase 0 .6% to 1% points 23%Increase 1 .1% to 1 .5% points 9%Increase 1 .6% to 2% points 9%Increase more than 2% points 14%Not sure 0%
Source: fsSTRATEGY Inc . 2014 C-Suite Survey
Respondents’ opinions on how rent and occupancy costs were expected to change as a percentage of revenues varied. Thirty-two percent of respondents believe rents will remain flat in 2014 (perhaps many of these are locked into leases with no changes) . The balance of respondents (68%) indicated they believe rents will increase . Twenty-three percent of respondents believe rents will increase by 0 .6% to 1 .0% of revenue .
fsSTRATEGY interviewed landlords to understand the factors affecting rental trends and expenses for restaurants in Canada . Findings from these interviews included:
� The supply of leasable premises for foodservice has not increased dramatically over the past five years . Major mall development has been nominal during this period . Landlords have new projects in development now but that supply will not enter the market for 18 to 24 months . The new destination mall inventory is expected to offer a substantially improved shopping experience for consumers . Premiumization of mall products, décor and services, aligned with mall positioning, may increase mall visitation. Landlords are seeking to balance differentiated foodservice concepts with those that are familiar to and expected by consumers. Differentiation can come from local brands with a local following, innovation by existing chains and new market entrants from the US and elsewhere .
53
7 | Cost of Doing Business
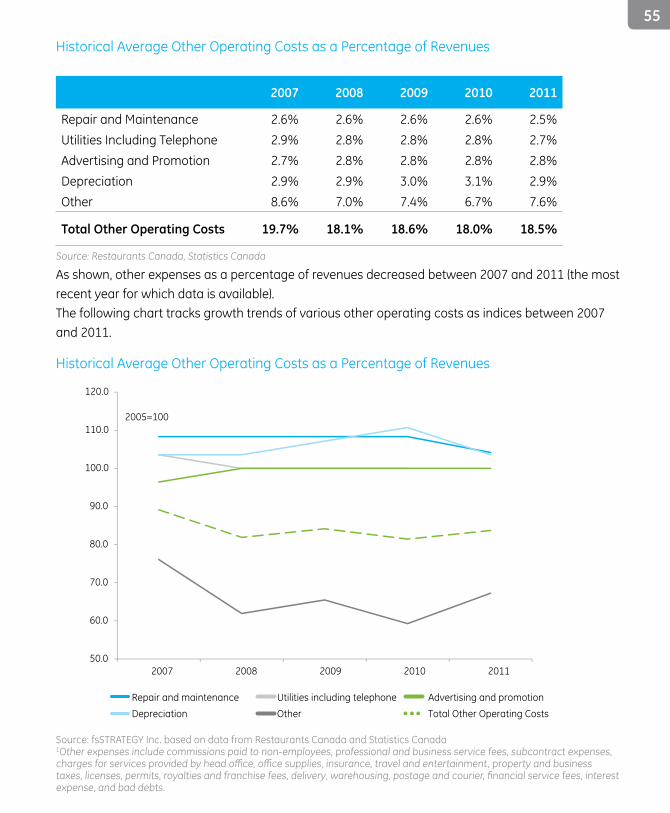
7.4 Other Operating CostsOther operating costs include utilities (including telephone), repair and maintenance, advertising and promotion, depreciation and other operating costs .Restaurants Canada’s 2013 Operations Report indicates that total other operating costs represented 18% of foodservice sales in 2011 . The following table shows the average other operating costs as a percentage of revenues for the most recent five year period available (2007 to 2011).
� Landlords report demand for foodservice space continues to rise . Demand for 1,500 to 3,000 square foot spaces from US chains testing the Canadian market is prevalent . Western Canadian chains are exploring Eastern Canada sites with greater interest . Some operators are beginning to favour the economics of regional as opposed to destination malls .
� Landlords indicate that while foodservice leasing rates are climbing due to market dynamics; compared to retail leasing, prices are relatively attractive . In addition, foodservice operators are demanding greater tenant inducements. Landlords confirm that there is very little good space left in urban areas .
� Landlords reported that leasing prices rose anywhere between 2% and 6% in 2013, depending on regional economic and market conditions . Increases in Alberta and Saskatchewan were at the higher end of the range . Landlords expect price increases in 2014 to track similarly, but perhaps slightly less in Alberta and Saskatchewan .
Time strapped consumers are aggregating their shopping and dining experiences . In addition to ongoing demand for new quick service concepts, fast casual dining (modified counter service) and premium casual dining concepts with healthy food options are in high demand from consumers . Operators able to offer differentiated concepts of these types will have an advantage in gaining lease space .While the leasing market clearly favours landlords, opportunities exist for foodservice operators who can respond to these trends .
54
2014 Canadian Chain Restaurant Industry Review
50.0
60.0
70.0
80.0
90.0
100.0
110.0
120.0
Repair and maintenance Utilities including telephone Advertising and promotion
Depreciation Other Total Other Operating Costs
2007 2008 2009 20112010
2005=100
Historical Average Other Operating Costs as a Percentage of Revenues
Historical Average Other Operating Costs as a Percentage of Revenues
2007 2008 2009 2010 2011
Repair and Maintenance 2 .6% 2 .6% 2 .6% 2 .6% 2 .5%Utilities Including Telephone 2 .9% 2 .8% 2 .8% 2 .8% 2 .7%Advertising and Promotion 2 .7% 2 .8% 2 .8% 2 .8% 2 .8%Depreciation 2 .9% 2 .9% 3 .0% 3 .1% 2 .9%Other 8 .6% 7 .0% 7 .4% 6 .7% 7 .6%
Total Other Operating Costs 19.7% 18.1% 18.6% 18.0% 18.5%
Source: Restaurants Canada, Statistics Canada
As shown, other expenses as a percentage of revenues decreased between 2007 and 2011 (the most recent year for which data is available) . The following chart tracks growth trends of various other operating costs as indices between 2007 and 2011 .
Source: fsSTRATEGY Inc . based on data from Restaurants Canada and Statistics Canada1Other expenses include commissions paid to non-employees, professional and business service fees, subcontract expenses, charges for services provided by head office, office supplies, insurance, travel and entertainment, property and business taxes, licenses, permits, royalties and franchise fees, delivery, warehousing, postage and courier, financial service fees, interest expense, and bad debts .
55
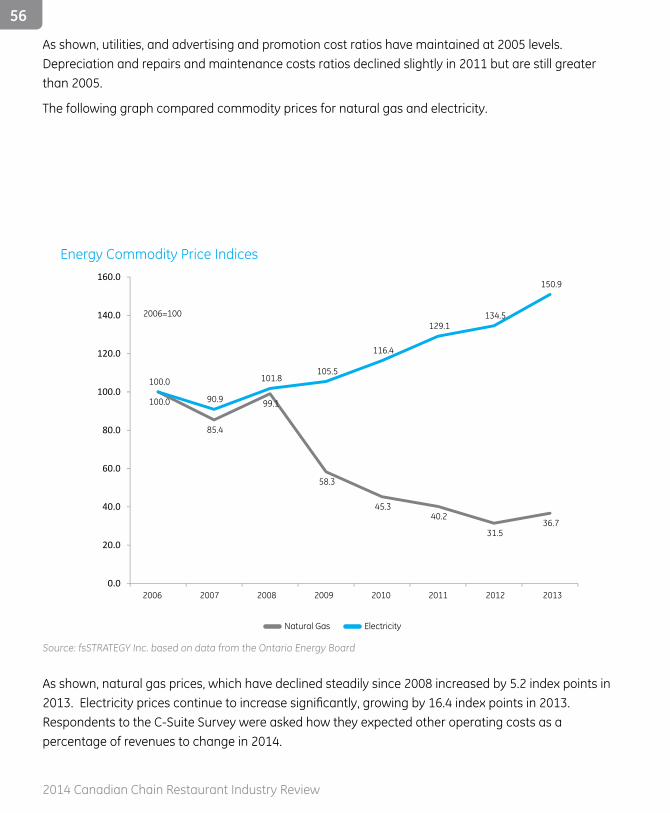
100.0
85.4
99.1
58.3
45.3 40.2
31.5 36.7
100.0
90.9
101.8 105.5
116.4
129.1 134.5
150.9
0.0
20.0
40.0
60.0
80.0
100.0
120.0
140.0
160.0
2006=100
Natural Gas Electricity
2006 2007 2008 2009 2010 2011 2012 2013
Energy Commodity Price Indices
Source: fsSTRATEGY Inc . based on data from the Ontario Energy Board
As shown, natural gas prices, which have declined steadily since 2008 increased by 5 .2 index points in 2013. Electricity prices continue to increase significantly, growing by 16.4 index points in 2013.Respondents to the C-Suite Survey were asked how they expected other operating costs as a percentage of revenues to change in 2014 .
As shown, utilities, and advertising and promotion cost ratios have maintained at 2005 levels . Depreciation and repairs and maintenance costs ratios declined slightly in 2011 but are still greater than 2005 .
The following graph compared commodity prices for natural gas and electricity .
56
2014 Canadian Chain Restaurant Industry Review
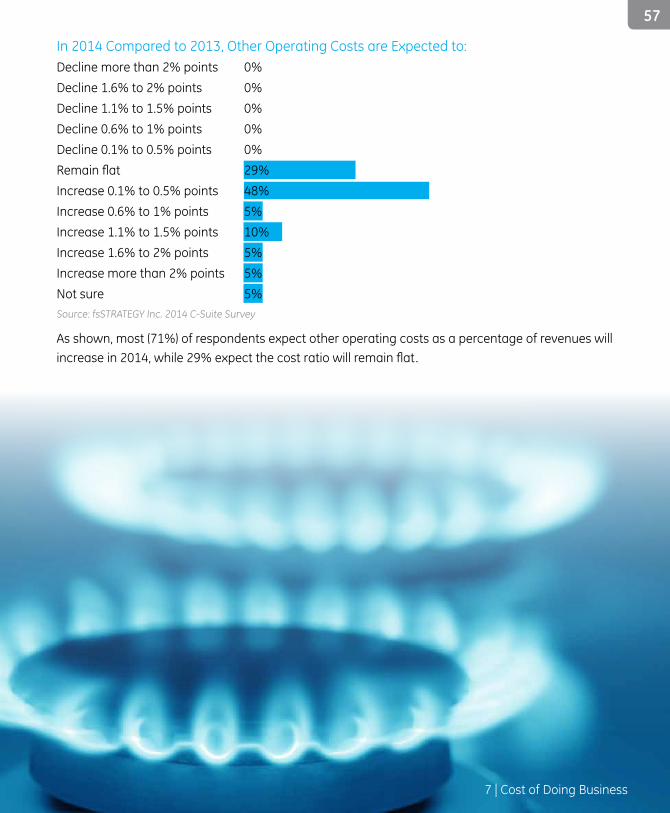
57
In 2014 Compared to 2013, Other Operating Costs are Expected to: Decline more than 2% points 0%Decline 1 .6% to 2% points 0%Decline 1 .1% to 1 .5% points 0%Decline 0 .6% to 1% points 0%Decline 0 .1% to 0 .5% points 0%Remain flat 29%Increase 0 .1% to 0 .5% points 48%Increase 0 .6% to 1% points 5%Increase 1 .1% to 1 .5% points 10%Increase 1 .6% to 2% points 5%Increase more than 2% points 5%Not sure 5%Source: fsSTRATEGY Inc . 2014 C-Suite Survey
As shown, most (71%) of respondents expect other operating costs as a percentage of revenues will increase in 2014, while 29% expect the cost ratio will remain flat.
7 | Cost of Doing Business
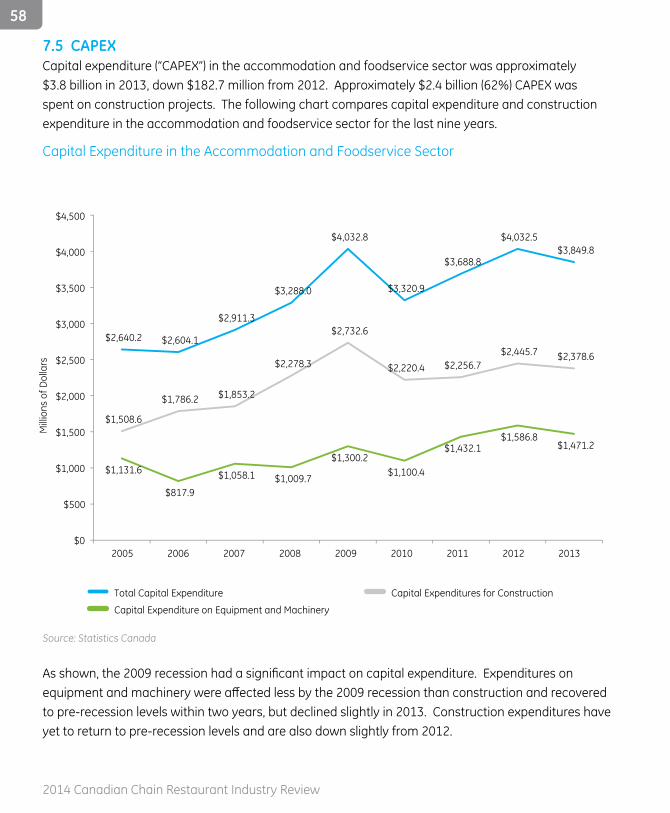
7.5 CAPEXCapital expenditure (“CAPEX”) in the accommodation and foodservice sector was approximately $3 .8 billion in 2013, down $182 .7 million from 2012 . Approximately $2 .4 billion (62%) CAPEX was spent on construction projects . The following chart compares capital expenditure and construction expenditure in the accommodation and foodservice sector for the last nine years .
$2,640.2 $2,604.1
$2,911.3
$3,288.0
$4,032.8
$3,320.9
$3,688.8
$4,032.5 $3,849.8
$1,508.6
$1,786.2 $1,853.2
$2,278.3
$2,732.6
$2,220.4 $2,256.7 $2,445.7 $2,378.6
$1,131.6
$817.9
$1,058.1 $1,009.7
$1,300.2 $1,100.4
$1,432.1 $1,586.8
$1,471.2
$0
$500
$1,000
$1,500
$2,000
$2,500
$3,000
$3,500
$4,000
$4,500
2005 2006 2007 2008 2009 2010 2011 20132012
Mill
ions
of D
olla
rs
Total Capital Expenditure Capital Expenditures for Construction
Capital Expenditure on Equipment and Machinery
As shown, the 2009 recession had a significant impact on capital expenditure. Expenditures on equipment and machinery were affected less by the 2009 recession than construction and recovered to pre-recession levels within two years, but declined slightly in 2013 . Construction expenditures have yet to return to pre-recession levels and are also down slightly from 2012 .
Source: Statistics Canada
Capital Expenditure in the Accommodation and Foodservice Sector
58
2014 Canadian Chain Restaurant Industry Review
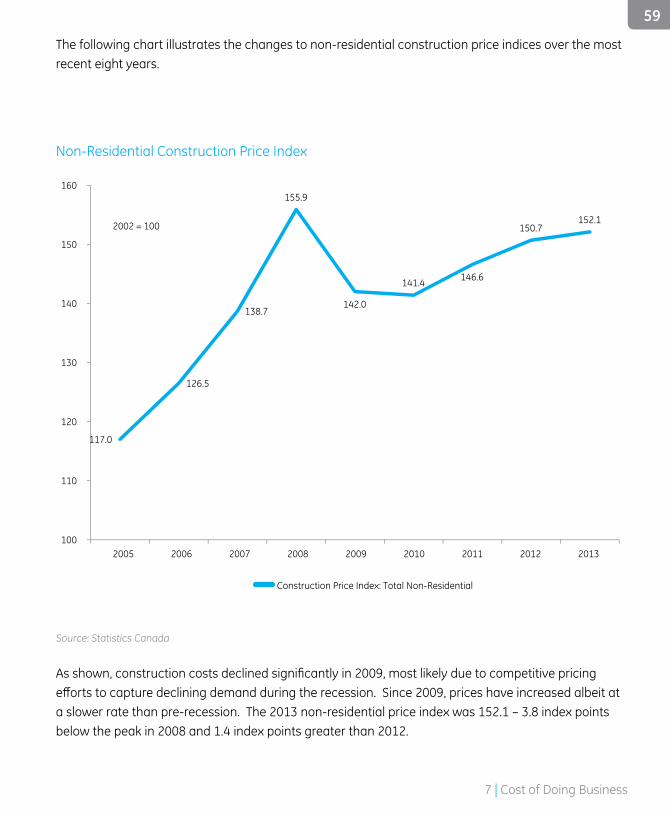
As shown, construction costs declined significantly in 2009, most likely due to competitive pricing efforts to capture declining demand during the recession. Since 2009, prices have increased albeit at a slower rate than pre-recession . The 2013 non-residential price index was 152 .1 – 3 .8 index points below the peak in 2008 and 1 .4 index points greater than 2012 .
117.0
126.5
138.7
155.9
142.0
141.4 146.6
150.7 152.1
100
110
120
130
140
150
160
Construction Price Index: Total Non-Residential
2005 2006 2007 2008 2009 2010 2011 20132012
2002 = 100
The following chart illustrates the changes to non-residential construction price indices over the most recent eight years .
Source: Statistics Canada
Non-Residential Construction Price Index
59
7 | Cost of Doing Business
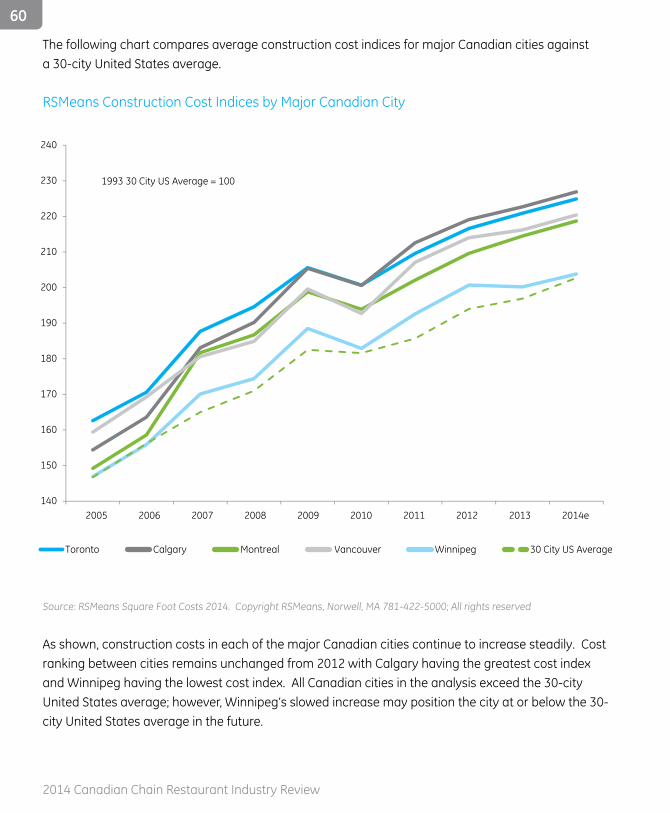
The following chart compares average construction cost indices for major Canadian cities against a 30-city United States average .
RSMeans Construction Cost Indices by Major Canadian City
140
150
160
170
180
190
200
210
220
230
240
Toronto Calgary Montreal Vancouver Winnipeg 30 City US Average
2005 2006 2007 2008 2009 2010 2011 2012 2014e2013
1993 30 City US Average = 100
Source: RSMeans Square Foot Costs 2014 . Copyright RSMeans, Norwell, MA 781-422-5000; All rights reserved
As shown, construction costs in each of the major Canadian cities continue to increase steadily . Cost ranking between cities remains unchanged from 2012 with Calgary having the greatest cost index and Winnipeg having the lowest cost index . All Canadian cities in the analysis exceed the 30-city United States average; however, Winnipeg’s slowed increase may position the city at or below the 30-city United States average in the future .
60
2014 Canadian Chain Restaurant Industry Review
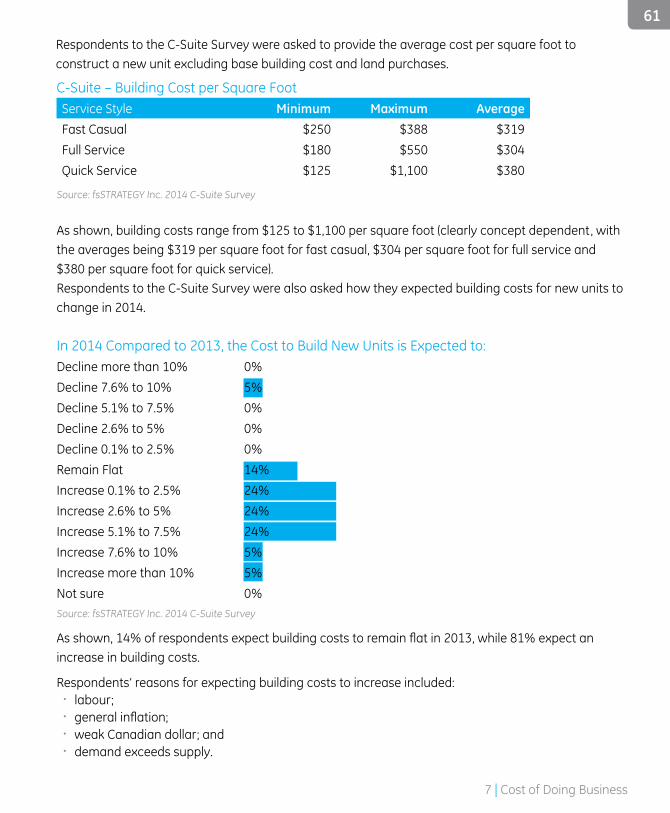
Respondents to the C-Suite Survey were asked to provide the average cost per square foot to construct a new unit excluding base building cost and land purchases .
C-Suite – Building Cost per Square FootService Style Minimum Maximum AverageFast Casual $250 $388 $319Full Service $180 $550 $304Quick Service $125 $1,100 $380
Source: fsSTRATEGY Inc . 2014 C-Suite Survey
As shown, building costs range from $125 to $1,100 per square foot (clearly concept dependent, with the averages being $319 per square foot for fast casual, $304 per square foot for full service and $380 per square foot for quick service) .Respondents to the C-Suite Survey were also asked how they expected building costs for new units to change in 2014 .
In 2014 Compared to 2013, the Cost to Build New Units is Expected to: Decline more than 10% 0%Decline 7 .6% to 10% 5%Decline 5 .1% to 7 .5% 0%Decline 2 .6% to 5% 0%Decline 0 .1% to 2 .5% 0%Remain Flat 14%Increase 0 .1% to 2 .5% 24%Increase 2 .6% to 5% 24%Increase 5 .1% to 7 .5% 24%Increase 7 .6% to 10% 5%Increase more than 10% 5%Not sure 0%Source: fsSTRATEGY Inc . 2014 C-Suite Survey
As shown, 14% of respondents expect building costs to remain flat in 2013, while 81% expect an increase in building costs .
Respondents’ reasons for expecting building costs to increase included: � labour; � general inflation; � weak Canadian dollar; and � demand exceeds supply .
61
7 | Cost of Doing Business

Top Chains 8
62
2014 Canadian Chain Restaurant Industry Review
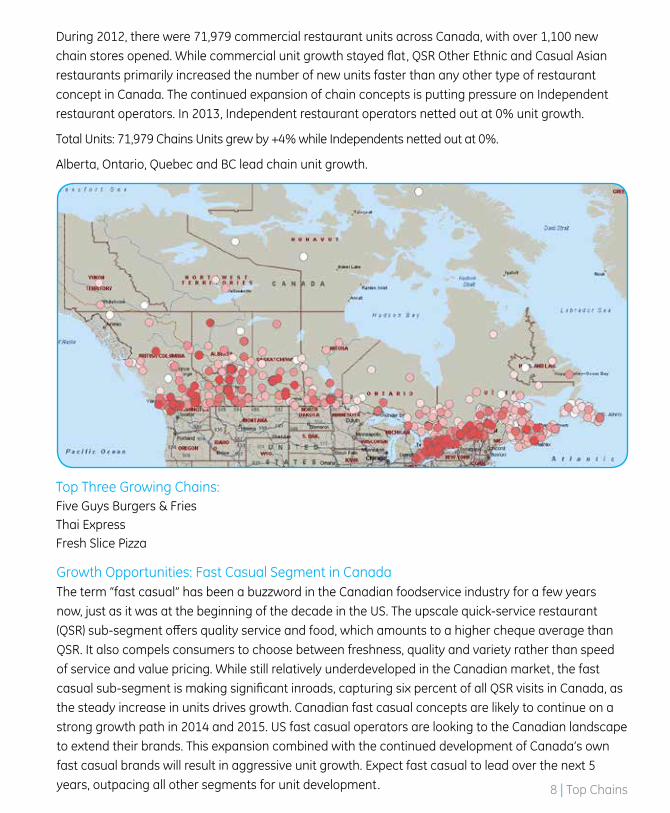
During 2012, there were 71,979 commercial restaurant units across Canada, with over 1,100 new chain stores opened. While commercial unit growth stayed flat, QSR Other Ethnic and Casual Asian restaurants primarily increased the number of new units faster than any other type of restaurant concept in Canada . The continued expansion of chain concepts is putting pressure on Independent restaurant operators . In 2013, Independent restaurant operators netted out at 0% unit growth .
Total Units: 71,979 Chains Units grew by +4% while Independents netted out at 0% .
Alberta, Ontario, Quebec and BC lead chain unit growth .
Growth Opportunities: Fast Casual Segment in CanadaThe term “fast casual” has been a buzzword in the Canadian foodservice industry for a few years now, just as it was at the beginning of the decade in the US . The upscale quick-service restaurant (QSR) sub-segment offers quality service and food, which amounts to a higher cheque average than QSR . It also compels consumers to choose between freshness, quality and variety rather than speed of service and value pricing . While still relatively underdeveloped in the Canadian market, the fast casual sub-segment is making significant inroads, capturing six percent of all QSR visits in Canada, as the steady increase in units drives growth . Canadian fast casual concepts are likely to continue on a strong growth path in 2014 and 2015 . US fast casual operators are looking to the Canadian landscape to extend their brands . This expansion combined with the continued development of Canada’s own fast casual brands will result in aggressive unit growth . Expect fast casual to lead over the next 5 years, outpacing all other segments for unit development .
Top Three Growing Chains:Five Guys Burgers & FriesThai ExpressFresh Slice Pizza
8 | Top Chains
Notes About This Report
This report is not a complete analysis of every material fact with respect to any company, segment or industry . Data has been obtained from sources considered reliable, but are not guaranteed and GE Capital, fsSTRATEGY and The NPD Group make no representations or warranties as to the accuracy or completeness of this data. Discussion of tax, financial, and economic developments and the potential consequences of those developments is provided for informational purposes only . Nothing in this report should be construed as investment, tax or financial advice. Readers of the report are encouraged to consult their own tax, financial or legal advisor before acting upon the information provided herein .
Notes 9
64
2014 Canadian Chain Restaurant Industry Review
fsSTRATEGY is an alliance of senior consultants focusing on business strategy support - research, analysis, innovation and implementation - for the foodservice industry. Our team has extensive consulting experience in foodservice across Canada. We also offer international experience, having worked in the United States, Australia, South America, Africa and Europe. Our team is unique in that we provide service to all foodservice sectors (restaurants, attractions, hotels and resorts, gaming establishments and institutions) and all levels of the foodservice supply chain (growers, processors, distributors and operators).
The NPD Group provides global information and advisory services to drive better business decisions. By combining unique data assets with unmatched industry expertise, we help our clients track their markets, understand consumers, and drive profitable growth. Practice areas include automotive, beauty, consumer electronics, entertainment, fashion, food/foodservice, home, luxury, mobile, office supplies, sports, technology, toys, and video games. For more information, visit npdgroup.ca and npdgroupblog.com. Follow us on Twitter: @npdgroup