Embed Size (px)
Citation preview

August 16th, 2013
2Q13 Results

2
Disclaimer
The stand-alone and consolidated financial statements were prepared in accordance with the accounting
principles adopted in Brazil, which include corporation law, the pronouncements, instructions and
interpretations issued by the Accounting Pronouncements Committee (CPC) and the regulations of the
Securities and Exchange Commission of Brazil (CVM), combined with specific legislation issued by the
National Electric Power Agency (ANEEL). As the industry regulator, ANEEL has powers to regulate the
concessions. The results are usually presented in both IFRS and former formats in order to permit
comparisons with other periods. However, the results presented in “Regulatory” format are not audited.
ALUPAR uses the audited results based on the IFRS principles to declare dividends.
The forward-looking statements contained in this document relating to the business outlook, projections of
operational and financial results and the growth prospects of ALUPAR are merely projections, and as such
are based exclusively on management’s expectations for the future of the business. These expectations
depend materially on changes in market conditions and the performance of the Brazilian economy, the
sector and international markets and therefore are subject to change without prior notice.

3
RS
SC
PR
SP
MG
GO
MT
AC
AM
RR
ROBA
PI
MAPA
AP
TO
CE RN
PE
AL
SE
MS
RJ
ES
DF
PB
Colômbia
Brasil
Chile
Alupar at a Glance Alupar is the only listed company in Brazil operating in transmission and generation segments
Geographic Footprint of the Assets
Operational Under construction
Portfolio of 27 long-term
concessions, starting to expire
in 2030 (transmission) and
2034 (generation)
Transmission
Generation
Begin Concession End
2000
2001
2001
2002
2002
2004
2004
2005
2005
2004
2006
2007
2005
2008
2009
2010
2010
2009
2012
2012
2004
2004
2006
2006
2010
2011
2012
2030
2031
2031
2032
2032
2034
2034
2035
2035
2034
2036
2037
2038
2039
2040
2040
2039
2042
2042
2034
2034
2041
2041
2047
Type Asset
Alupar Concession – Transmission and Generation
Today
Lifetime
Lifetime
Transmission
Transmission
Transmission
Transmission
Transmission
Transmission
Transmission
Transmission
Transmission
Transmission
Transmission
Transmission
Transmission
Transmission
Transmission
Transmission
Transmission
Transmission
Transmission
Transmission
Generation
Generation
Generation
Generation
Generation
Generation
Generation
Transchile
Operating Under Construction
2045

4
Company’s Assets
Nota:
(1) TBE holds 10 transmission assets: EATE, EBTE, ECTE, ENTE, ERTE, ESDE, ETEP; ETSE, LUMITRANS e STC.
V 50.01%
T 35.01%
100%
50.01% V 50.02%
T 50.02%
V 100%
T 50.01%
70.02%
V 50.01%
T 35.01%
99.90%
41.00%
41.00%
41.00%
Transminas
Lavrinhas
47.51%
50.99%
V 50.02%
T 50.02%
51.00%
80.00% 15.00% 80.00% 20.00%
Transirapé
Transleste
Rio Claro
Ijuí
Queluz
STC
EBTE
Transudeste
Lumitrans
ETES
50.01%
V 100%
T 50.01%
STN ENTE EATE
ECTE
ERTE
ETEP
ETEM 62.6%
ETVG
ESDE Ferreira
Gomes
100%
TNE 51.00%
Risaralda 99.86%
100%
ETSE 100%
46.00%
TME
50.99% Energia
dos Ventos
51.00% Transchile
TBE
TBE
TBE
TBE
TBE TBE TBE
TBE TBE
TBE
10.00%
10.00%
10.00%
Alupar is a holding Company with a portfolio of 27 long-term concessions
Transmission
Generation
Under Construction
TBE TBE group’s assets

5
Alupar’s Business Culture
Financial Discipline
Responsible and Sustainable Growth
Efficient Capital Structure
Corporate Governance and Transparency
Skilled and Motivated Team

6
• BM&FBovespa – Level 2 Listing
• UNITs (1 common share + 2 preferred shares ) Securities
• 100% Primary Offering
Breakdown
• 44,390,600 units Shares Issued
• Investments to support Company’s growth in transmission and generation activities Use of Proceeds
• April 23th, 2013 CVM Register
• ALUP11 Ticker
• R$ 787.7 million Net Proceeds
• R$ 821.2 million Gross Offering
Conclusion of Alupar IPO
Notice to the Market, June 3th, 2013

7
• ITAUVEST DTVM S.A. Market Maker
• 6 (six) months renewed automatically Period
• May 28th, 2013 Begin of
Services
Market Maker contracted
• Any time at no cost by either party by written notice with at least thirty days in advance Rescission
Terms
Notice to the Market, May 27th, 2013

8
Annual Permited Revenue - RAP 2013/2014 Cycle
Notes:
(1) Includes RBNI that are not included in the Ratificatory Decision 1559/2013
(2) Was not included in the Ratificatory Decision of previous year (calculated by Alupar)
(3) Not included in the Ratificatory Decision1559/2013 (calculated by Alupar)
(4) USD = BRL 2,20
Notice to the Market, Jul 1st, 2013
BRL million
Transmission Co. 2012/2013 Cycle 2013/2014 Cycle Reajustment
EATE 319,7 339,6 6,2%
ETEP 72,8 77,4 6,2%
ENTE 167,3 177,7 6,2%
ECTE 70,6 75,0 6,2%
ERTE 37,6 39,9 6,2%
STC 30,1 32,0 6,5%
LUMITRANS 19,8 21,0 6,2%
TRANSUDESTE 18,8 20,0 6,2%
TRANSLESTE 30,3 32,2 6,2%
TRANSIRAPE¹ 16,8 23,3 38,7%
ETES 11,1 11,9 6,5%
STN 133,9 142,2 6,2%
EBTE 34,0 36,7 7,8%
TME 33,4 35,6 6,5%
ETEM 10,0 10,7 6,5%
ETVG 3,4 3,6 6,5%
ESDE 10,1 10,8 6,5%
ETSE² 14,8 15,8 6,8%
TNE³ 126,3 134,5 6,5%
Transchile⁴ 14,8 15,4 3,9%
TOTAL 1.175,6 1.255,1 6,8%

9
Material Fact, August 8th, 2013
Transmission Assets share acquisition by EATE (direct subsidiary)
V 50.02%
T 50.02%
70.02%
Transminas
Transirapé
Transleste
Transudeste
EATE
TBE
10.00%
10.00%
10.00%
70.02%
41.00%
41.00%
41.00%
Transminas
Transirapé
Transleste
Transudeste
Before Indirect Interest
28.71%
After Indirect Interest
33.71%
R$ 34,1 million Base Price
Approving
from
Buyer
41.00%
41.00%
41.00%
Debt Holders, ANEEL e CADE
EATE
Seller ORTENG
Assets Concession Oper.
Begin Line Ext. RAP/RBNI
Inflation
Index.
Tariff
Review Begin End Km BRL mm
Transleste 2004 2034 2005 150 32,2 IGP - M No
Transudeste 2005 2035 2007 140 20,0 IGP - M No
Transirapé 2005 2035 2007 65 23,3 IGP - M No
355 km BRL 75,5 mi

10
Material Fact, August 14th, 2013
Transmission Assets share acquisition ( ECTE - direct subsidiary)
Before Direct Interest
45.01%
After Direct Interest
47.51% R$ 4,430 million Base Price
Buyer Alupar
Seller MDU Sul
Assets Concession Oper.
Begin Line Ext. RAP/RBNI
Inflation Index. Tariff
Review Begin End Km BRL mm
ECTE 2000 2030 2002 252Km 75,0 IGP - M No

11
Energy Price Hike
0
50
100
150
200
250
300
350
400
450
jan/12 fev/12 mar/12 abr/12 mai/12 jun/12 jul/12 ago/12 set/12 out/12 nov/12 dez/12 jan/13 fev/13 mar/13 abr/13 mai/13 jun/13 jul/13
PLD1 PLD F Averg. PLD1 2012 Averag. PLD1 2013
Energy Spot Prices – BRL
BRL166
BRL 262
0
10
20
30
40
50
60
70
80
90
Jan Fev Mar Abr Mai Jun Jul Ago Set Out Nov Dez
2012
2013
SE/CO Regions Reservoirs - %

12
New eletric energy price methodology due to Resolution CNPE nº03
Expectancy of higher spot prices – PLD - Difference Settlement Price;
Expectancy of reduction in Thermal Dispatch from the thermal plants outside the
order of merit;
Expectancy of reduction of ESS charges

Financial Highlights

14
Financial Highlights
R$ MM 2Q13 2Q12 Var.% 1H13 1H12 % Chg.
Adjusted Net Revenue 302.2 274.4 10.2% 583.3 540.3 8.0%EBITDA (CVM 527) 260.9 219.2 19.0% 488.3 444.6 9.8%Adjusted EBITDA Margin 86.3% 79.9% 6.4 p.p 83.7% 82.3% 1.4 p.pEBITDA (Excluding GSF effects) - - - 501.9 - 12.9%EBITDA Margin (Excluding GSF effects) - - - 86.0% - 3.7 p.pFinancial Result -44.2 -53.1 -16.9% -96.0 -105.6 -9.1%Consolidated Net Income 168.5 128.7 30.9% 315.6 270.2 16.8%Subsidiaries' Minority Interest 92.9 73.6 26.3% 176.0 151.6 16.1%Net Income - Alupar 75.6 55.1 37.1% 139.6 118.7 17.6%Earnings per UNIT (R$) 0.36 0.26 37.1% 0.67 0.57 17.6%Net Income - Alupar (Excluding GSF ) - - - 144.8 - 22.0%Net Debt* 2,159.7 2,501.0 -13.6% 2,159.7 2,501.0 -13.6%Net Debt / Ebitda** 2.1 2.9 -27.4% 2.2 2.8 -21.4%
Key Indicators "CORPORATE LAW(IFRS)"
R$ MM 2Q13 2Q12 Var.% 1H13 1H12 % Chg.
Net Revenue 267.0 251.6 6.1% 536.5 501.2 7.0%EBITDA (CVM 527) 222.5 194.1 14.6% 435.1 400.3 8.7%Ebitda Margin 83.3% 77.2% 6.2 p.p 81.1% 79.9% 1.2 p.pEBITDA (Excluding GSF effects) - - - 448.7 - 12.1%EBITDA Margin (Excluding GSF effects) - - - 83.6% - 3.7 p.pFinancial Result -44.2 -53.0 -16.6% -96.0 -105.5 -9.0%Consolidated Net Income 117.5 94.1 24.9% 220.0 193.3 13.8%Subsidiaries' Minority Interest 69.1 57.4 20.5% 124.5 114.9 8.3%Net Income - Alupar 48.4 36.7 31.7% 95.5 78.4 21.9%Earnings per UNIT (R$) 0.23 0.18 31.7% 0.46 0.38 21.9%Net Income - Alupar (Excluding GSF ) - - - 100.7 - 28.5%Net Debt* 2,159.7 2,501.0 -13.6% 2,159.7 2,501.0 -13.6%Net Debt / Ebitda** 2.4 3.2 -24.7% 2.5 3.1 -20.6%
* Including Securities under Non-Current Assets
**Annualized EBITDA
Key Indicators "REGULATORY"

15
Consolidated Financial Highlights- IFRS
219.2
260.9
79.9% 86.3%
2Q12 2Q13
EBITDA (R$ MM) and Margin (%)
55.1
75.6
2Q12 2Q13
Net Income Alupar (R$ MM)
274.4 302.2
2Q12 2Q13
Ajusted Net Revenues (R$ MM)
540.3 583.3
1H12 1H13
Adjusted Net Revenues (R$ MM)
444.6
488.3 501.9
13.6
1H12 1H13 GSF Adjust. Adjusted 1H13
EBITDA (R$ MM) e Margin (%)
83.7% 86.0%
82.3%
118.7
139.6 144.8 5.2
1H12 1H13 GSF Adjust. Adjusted 1H13
Net Income Alupar (R$ MM)

16
Consolidated Financial Highlights - Regulatory
194.1
222.5
77.2% 83.3%
2Q12 2Q13
EBITDA (R$ MM) e Margin (%)
36.7
48.4
2Q12 2Q13
Net Income Alupar (R$ MM)
251.6
267.0
2Q12 2Q13
Net Revenue (R$ MM)
501.2 536.5
1H12 1H13
Net Revenue (R$ MM)
400.3
435.1 448.7 13.6
1H12 1H13 GSF Adjust. Adjusted 1H13
EBITDA (R$ MM) e Margin (%)
81.1% 83.6%
79.9%
78.4
95.5 100.7 5.2
1H12 1H13 GSF Adjust. 1S13 Ajustado
Net Income Alupar (R$ MM)
17
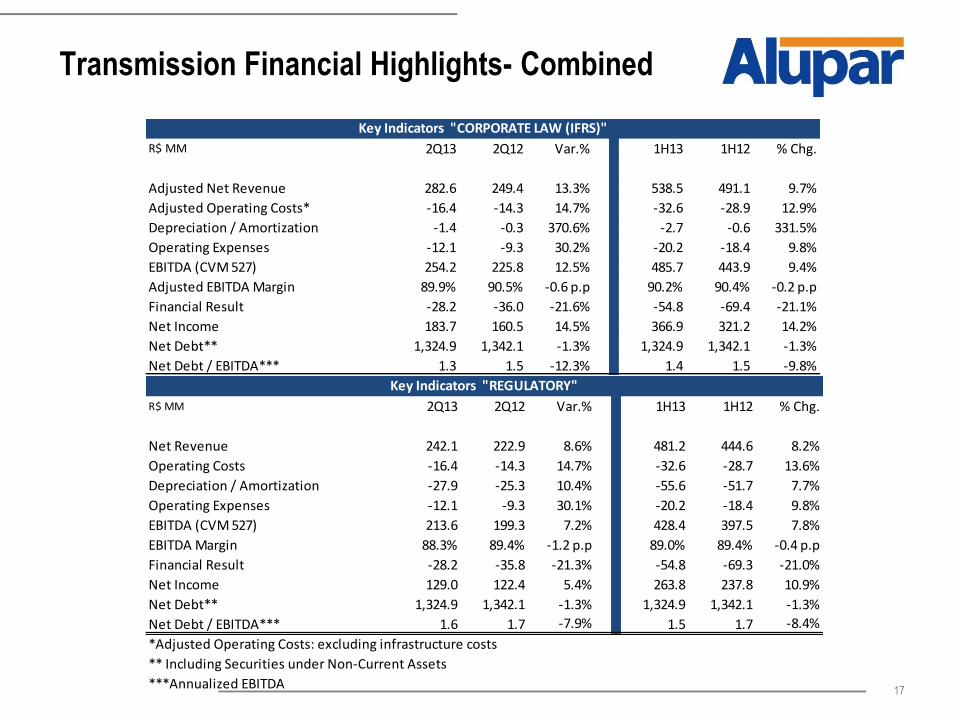
Transmission Financial Highlights- Combined
R$ MM 2Q13 2Q12 Var.% 1H13 1H12 % Chg.
Adjusted Net Revenue 282.6 249.4 13.3% 538.5 491.1 9.7%
Adjusted Operating Costs* -16.4 -14.3 14.7% -32.6 -28.9 12.9%
Depreciation / Amortization -1.4 -0.3 370.6% -2.7 -0.6 331.5%
Operating Expenses -12.1 -9.3 30.2% -20.2 -18.4 9.8%
EBITDA (CVM 527) 254.2 225.8 12.5% 485.7 443.9 9.4%
Adjusted EBITDA Margin 89.9% 90.5% -0.6 p.p 90.2% 90.4% -0.2 p.p
Financial Result -28.2 -36.0 -21.6% -54.8 -69.4 -21.1%
Net Income 183.7 160.5 14.5% 366.9 321.2 14.2%
Net Debt** 1,324.9 1,342.1 -1.3% 1,324.9 1,342.1 -1.3%
Net Debt / EBITDA*** 1.3 1.5 -12.3% 1.4 1.5 -9.8%
Key Indicators "CORPORATE LAW (IFRS)"
R$ MM 2Q13 2Q12 Var.% 1H13 1H12 % Chg.
Net Revenue 242.1 222.9 8.6% 481.2 444.6 8.2%
Operating Costs -16.4 -14.3 14.7% -32.6 -28.7 13.6%
Depreciation / Amortization -27.9 -25.3 10.4% -55.6 -51.7 7.7%
Operating Expenses -12.1 -9.3 30.1% -20.2 -18.4 9.8%
EBITDA (CVM 527) 213.6 199.3 7.2% 428.4 397.5 7.8%
EBITDA Margin 88.3% 89.4% -1.2 p.p 89.0% 89.4% -0.4 p.p
Financial Result -28.2 -35.8 -21.3% -54.8 -69.3 -21.0%
Net Income 129.0 122.4 5.4% 263.8 237.8 10.9%
Net Debt** 1,324.9 1,342.1 -1.3% 1,324.9 1,342.1 -1.3%
Net Debt / EBITDA*** 1.6 1.7 -7.9% 1.5 1.7 -8.4%
*Adjusted Operating Costs: excluding infrastructure costs
** Including Securities under Non-Current Assets
***Annualized EBITDA
Key Indicators "REGULATORY"

18
Transmission Financial Highlights- Combined
249.4 282.6
491.1 538.5
2Q12 2Q13 1H12 1H13
Adjusted Net Revenue (R$ MM)
222.9 242.1
444.6 481.2
2Q12 2Q13 1H12 1H13
Net Revenue (R$ MM)
122.4 129.0
237.8 263.8
2Q12 2Q13 1H12 1H13
Net Income (R$ MM)
Corporate Law (IFRS)
Regulatory
160.5 183.7
321.2
366.9
2Q12 2Q13 1H13 1H13
Net Income (R$ MM)
225.8 254.2
443.9 485.7
90.5% 89.9% 90.4% 90.2%
2Q12 2Q13 1H12 1H13
EBITDA (R$ MM) and Margin (%)
199,3 213,6
397,5 428,4
89.4% 88.3% 89.4% 89.0%
2Q12 2Q13 1H12 1H13
EBITDA (R$ MM) e Margin (%)
19
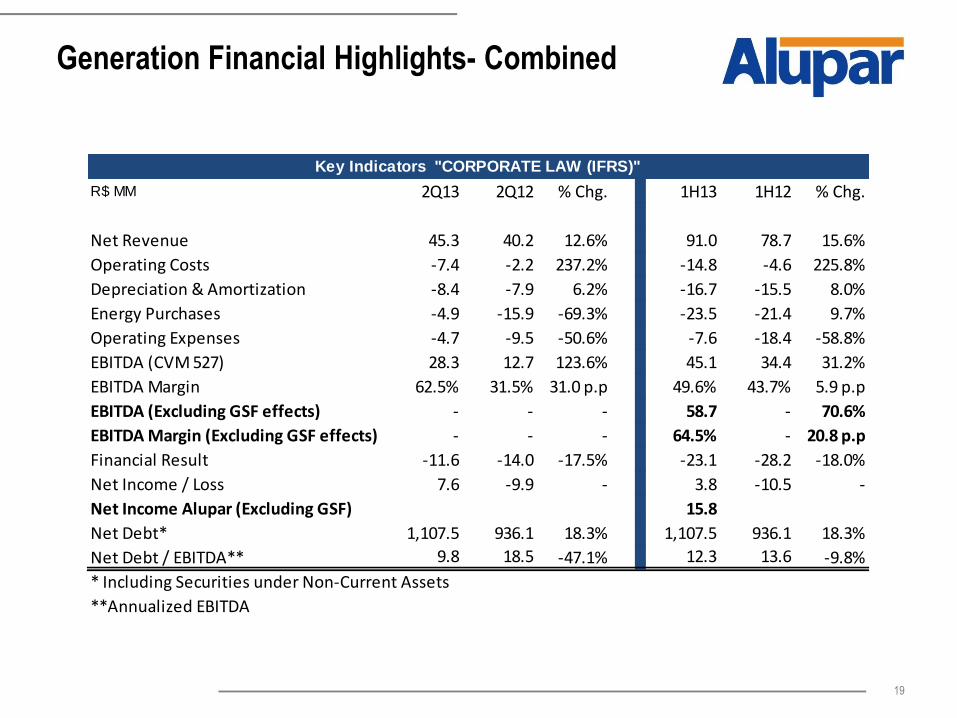
Generation Financial Highlights- Combined
R$ MM 2Q13 2Q12 % Chg. 1H13 1H12 % Chg.
Net Revenue 45.3 40.2 12.6% 91.0 78.7 15.6%
Operating Costs -7.4 -2.2 237.2% -14.8 -4.6 225.8%
Depreciation & Amortization -8.4 -7.9 6.2% -16.7 -15.5 8.0%
Energy Purchases -4.9 -15.9 -69.3% -23.5 -21.4 9.7%
Operating Expenses -4.7 -9.5 -50.6% -7.6 -18.4 -58.8%
EBITDA (CVM 527) 28.3 12.7 123.6% 45.1 34.4 31.2%
EBITDA Margin 62.5% 31.5% 31.0 p.p 49.6% 43.7% 5.9 p.p
EBITDA (Excluding GSF effects) - - - 58.7 - 70.6%
EBITDA Margin (Excluding GSF effects) - - - 64.5% - 20.8 p.p
Financial Result -11.6 -14.0 -17.5% -23.1 -28.2 -18.0%
Net Income / Loss 7.6 -9.9 - 3.8 -10.5 -
Net Income Alupar (Excluding GSF) 15.8
Net Debt* 1,107.5 936.1 18.3% 1,107.5 936.1 18.3%
Net Debt / EBITDA** 9.8 18.5 -47.1% 12.3 13.6 -9.8%
* Including Securities under Non-Current Assets
**Annualized EBITDA
Key Indicators "CORPORATE LAW (IFRS)"

20
34.4
45.1
58.7
13.6
1H12 1H13 GSF Adjust. 1S13 Ajustado
EBITDA (R$ MM) and Margin (%)
49.6%
64.5%
Generation Financial Highlights - Combined
40.2
45.3
2Q12 2Q13
Net Revenue (R$ MM)
78.7
91.0
1H12 1H13
Net Revenue (R$ MM)
12.7
28.3 31.5%
62.5%
2Q12 2Q13
EBITDA (R$ MM) and Margin (%)
(9.9)
7.6
2T12 2T13
Net Income (R$ MM)
(10.5)
3.8
15.8
12.0
1H12 1H13 GSF Adjust. Adjusted 1H13
Net Income (R$ mm)
43.7%

21
Indebtedness - Consolidated
33.9%
40.2%
11.0%
0.2% 14.8%
CDI
TJLP
Fixed
Foreign Currency
IPCA
Gross Debt by Index (%)
1,341.4
307.8
4.6 6.4
1,570.9
BNDES (TJLP / IGP-M)
Other Development banks
Others
Foreign Currency
Debentures
Debt Compositon (R$ MM)
3,231.1
1,071.5
2,159.7
Gross Debt Cash and Cash Equivalents Net Debt
Total Debt (R$ MM)
17%
83%
Debt Profile (%)
Short Term Long Term

22
Indebtness - Consolidated
278.9
137.3
424.0
316.3 277.9 250.4
135.2
925.1
792.5
117,1
92.1
83.8 34.1 133.1
79.9
224.9
Cash and Cash Equivalents
2013 2014 2015 2016 2017 2018 after 2018
Debt Amortization Schedule (R$ MM)
Subsidiárias Controladora Bridges
156.9
Moody’s Investors Service
Corporate (national scale) AA+ Corporate (national scale) Aa2.br Corporate (global scale) Ba1
August, 16th , 2013
IR Contacts
Marcelo Costa – IRO
IR Specialist
Guilherme Villani
Luiz Coimbra
Tel.: (011) 2184-9600


![1Q14 RESULTS PRESENTATION - NOS · 1Q14 RESULTS PRESENTATION Monthly Bill per Unique Corporate, SME and SoHo subscribers [Euros] 0 ä 200 ä 1Q13 2Q13 3Q13 4Q13 1Q14 Monthly Bill](https://img.pdfslide.net/doc/110x75/5f4bf904fbd0f2207a556b26/1q14-results-presentation-nos-1q14-results-presentation-monthly-bill-per-unique.jpg)