Embed Size (px)
Citation preview
Mongolian Economy: Investment Opportunities /Challenges
Jim Dwyer, Executive Director, Business Council of Mongolia
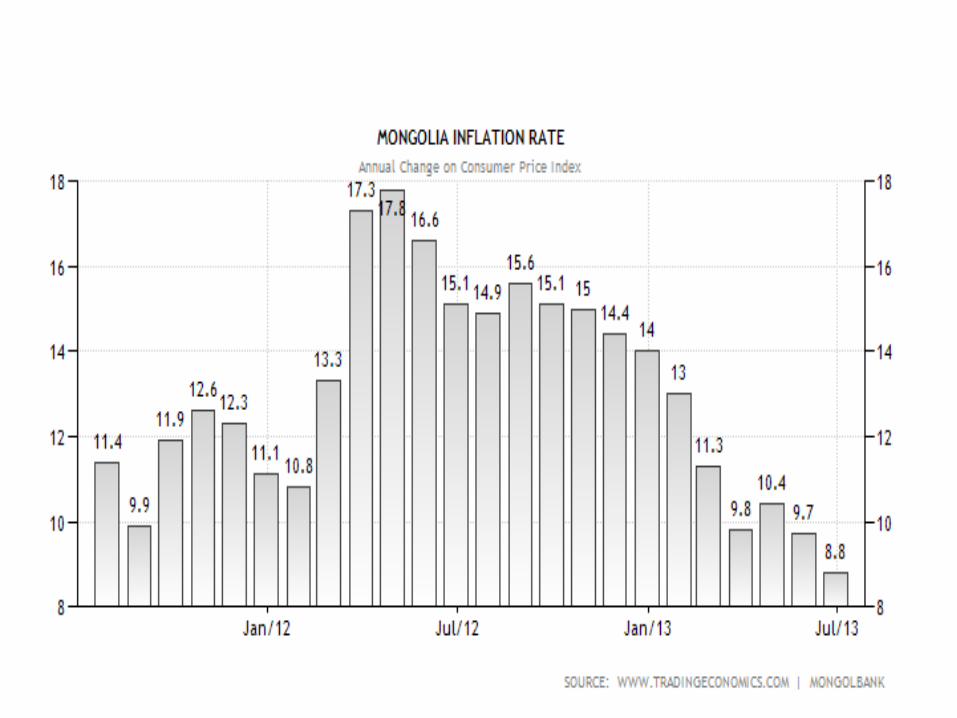
SLOWING BUT STILL GROWING ECONOMY
Source: National Statistical Office: Economic Report * - price compare with 2013.06
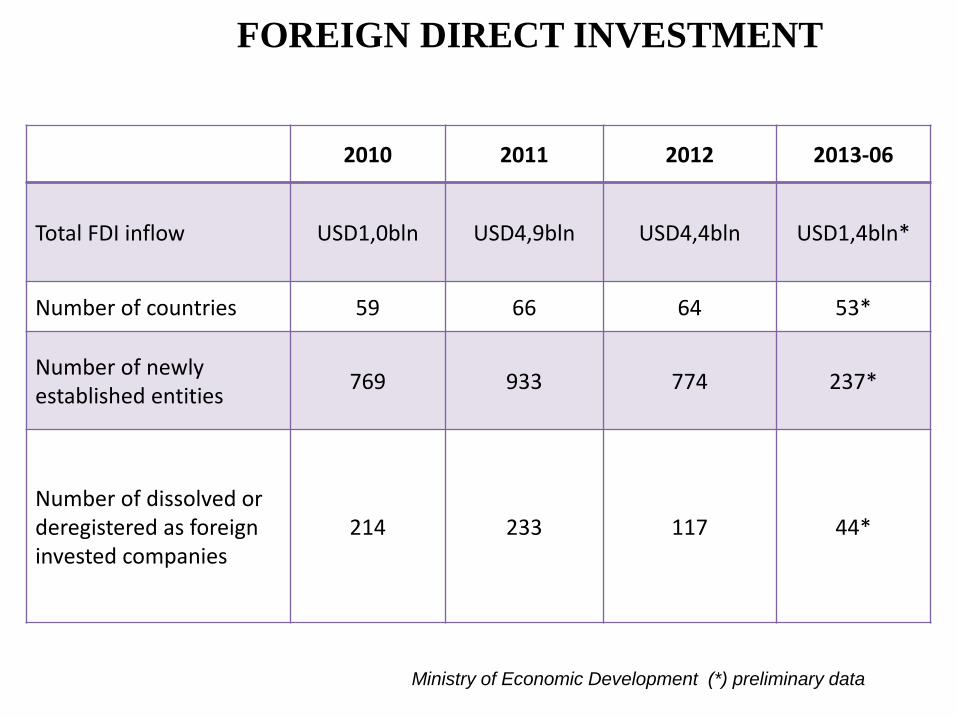
FOREIGN DIRECT INVESTMENT
Investment
Ministry of Economic Development (*) preliminary data
2010 2011 2012 2013-06
Total FDI inflow USD1,0bln USD4,9bln USD4,4bln USD1,4bln*
Number of countries 59 66 64 53*
Number of newly established entities
769 933 774 237*
Number of dissolved or deregistered as foreign invested companies
214 233 117 44*
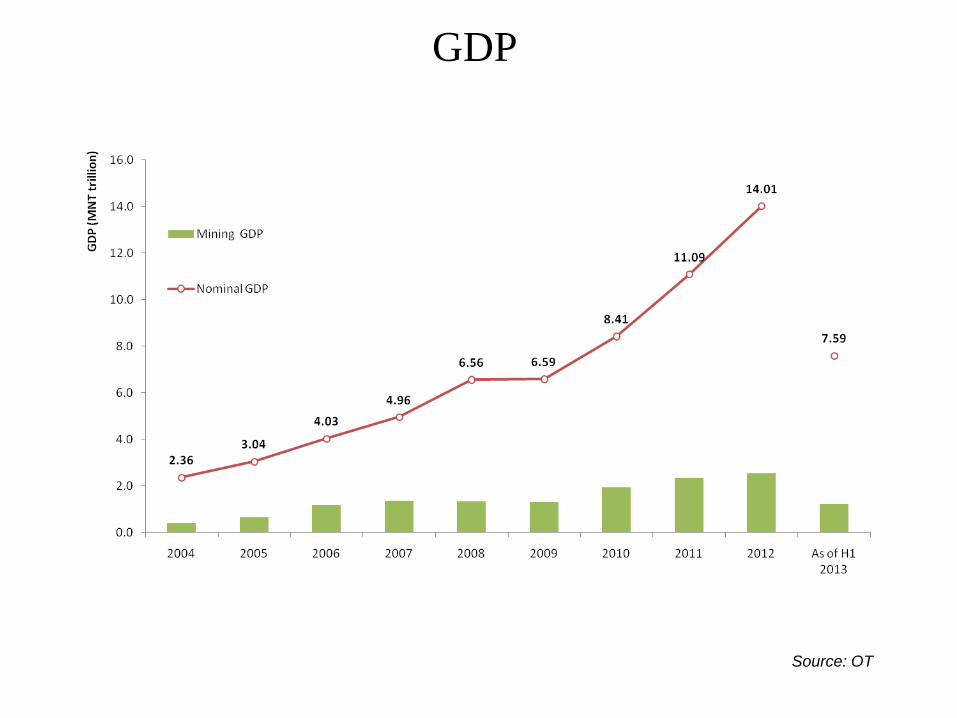
GDP
Source: OT
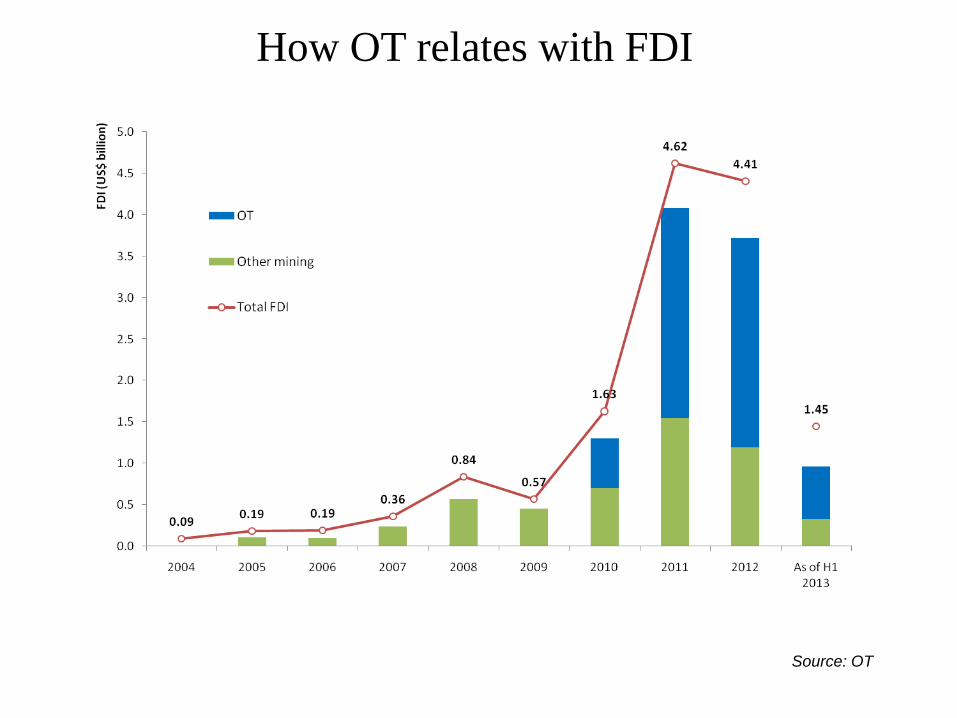
How OT relates with FDI
Source: OT
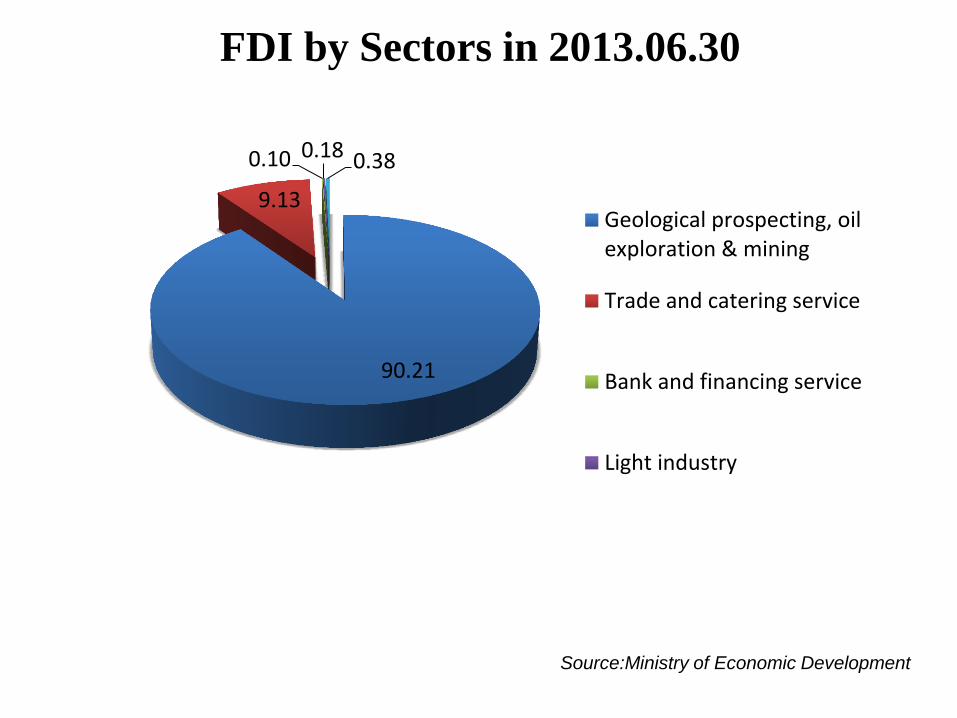
FDI by Sectors in 2013.06.30
90.21
9.13
0.10 0.18 0.38
Geological prospecting, oilexploration & mining
Trade and catering service
Bank and financing service
Light industry
Source:Ministry of Economic Development
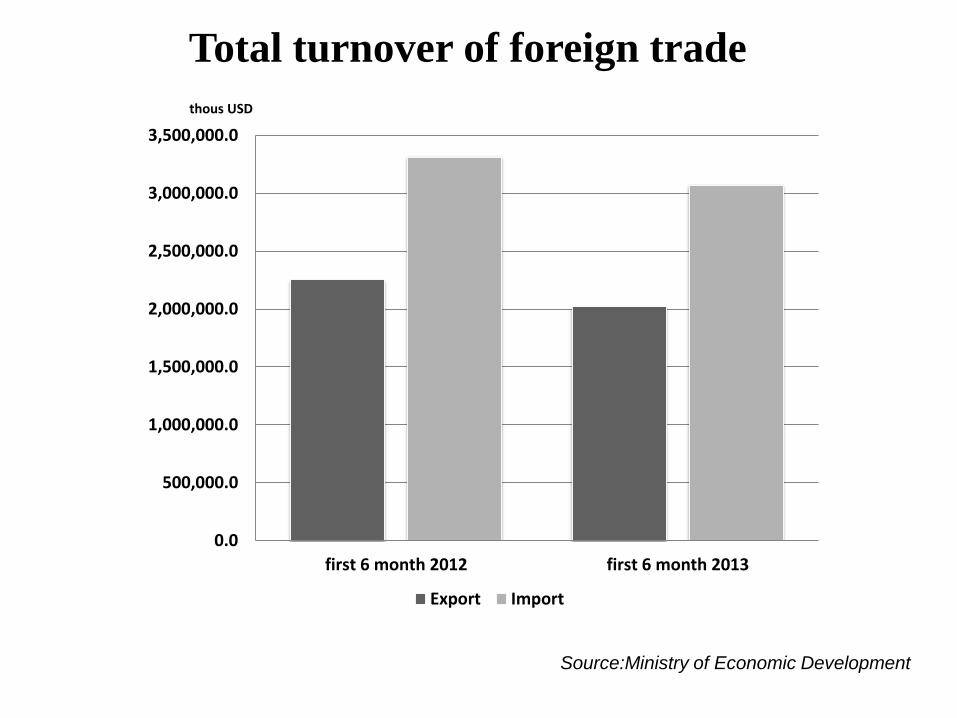
0.0
500,000.0
1,000,000.0
1,500,000.0
2,000,000.0
2,500,000.0
3,000,000.0
3,500,000.0
first 6 month 2012 first 6 month 2013
thous USD
Export Import
Total turnover of foreign trade
Source:Ministry of Economic Development
Ministry of Economic Development
-60
-40
-20
0
20
40
60
80
100
120
140
-60
-40
-20
0
20
40
60
80
100
120
140Ja
n-0
8
Ap
r-08
Jul-
08
Oct
-08
Jan
-09
Ap
r-09
Jul-
09
Oct
-09
Jan
-10
Ap
r-10
Jul-
10
Oct
-10
Jan
-11
Ap
r-11
Jul-
11
Oct
-11
Jan
-12
Ap
r-12
Jul-
12
Oct
-12
Jan
-13
Ap
r-13
Jul-
13
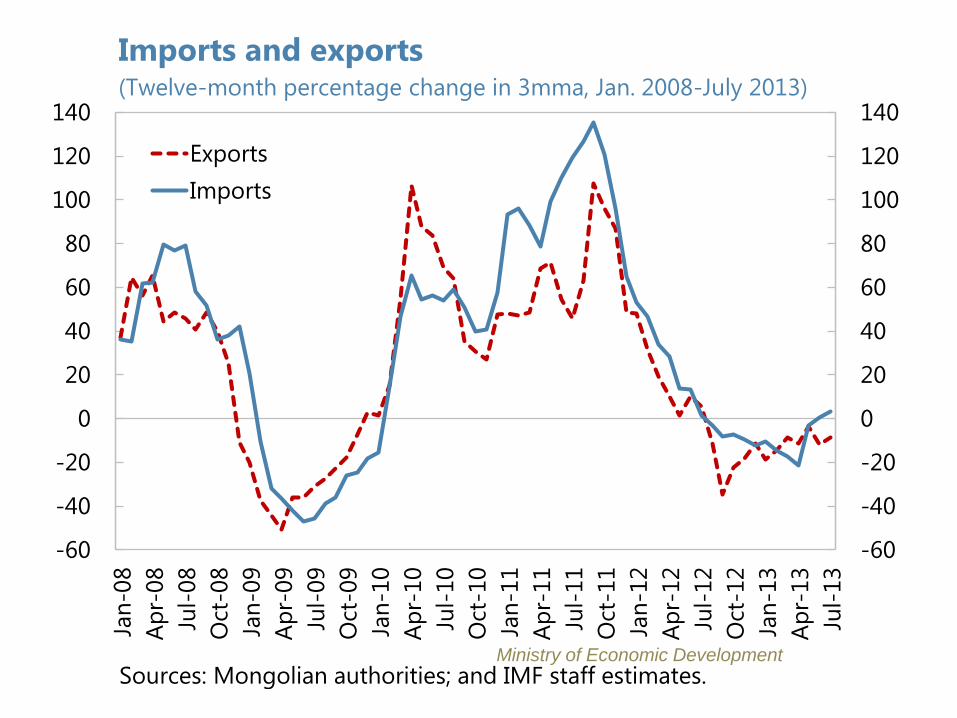
Exports
Imports
Sources: Mongolian authorities; and IMF staff estimates.
Imports and exports (Twelve-month percentage change in 3mma, Jan. 2008-July 2013)
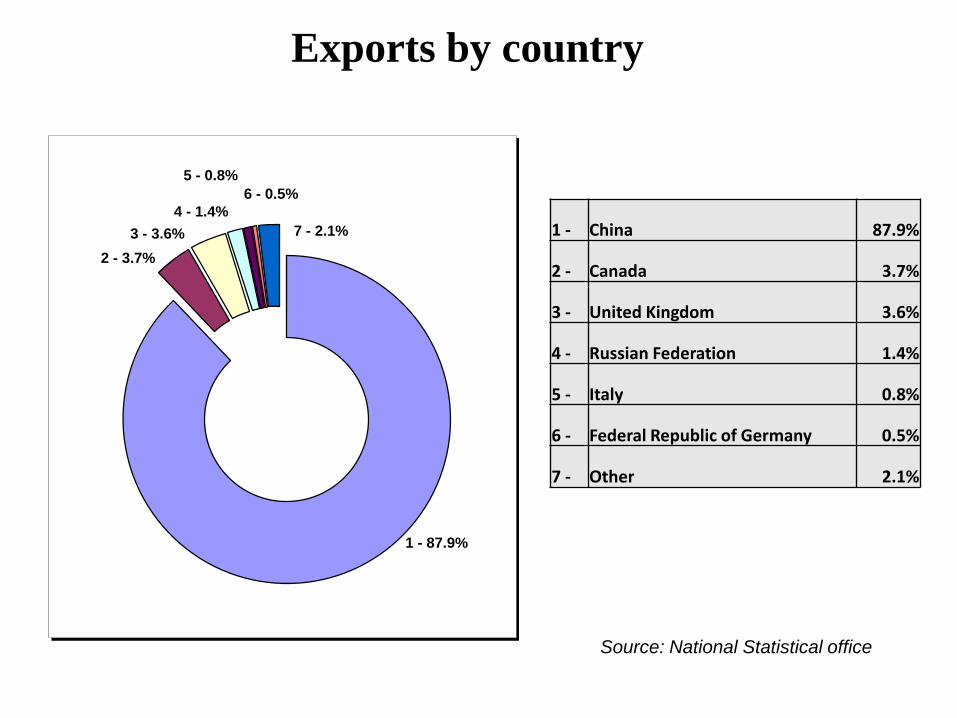
Exports by country
1 - 87.9%
2 - 3.7%
3 - 3.6%
4 - 1.4%
5 - 0.8%
6 - 0.5%
7 - 2.1% 1 - China 87.9%
2 - Canada 3.7%
3 - United Kingdom 3.6%
4 - Russian Federation 1.4%
5 - Italy 0.8%
6 - Federal Republic of Germany 0.5%
7 - Other 2.1%
Source: National Statistical office
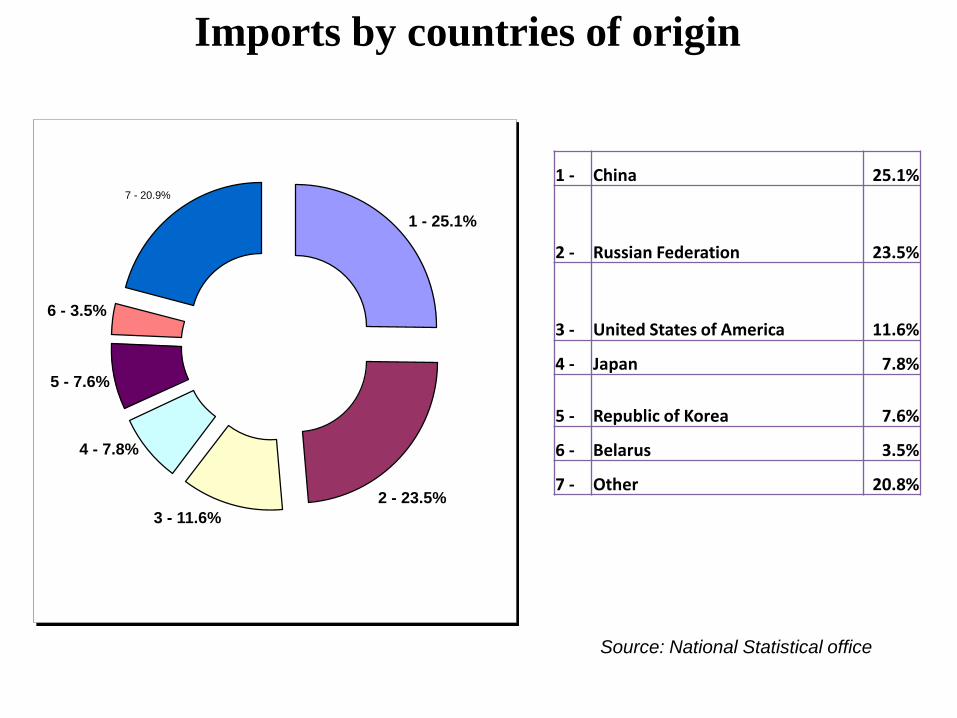
Imports by countries of origin
1 - 25.1%
2 - 23.5%
3 - 11.6%
4 - 7.8%
5 - 7.6%
6 - 3.5%
7 - 20.9%
1 - China 25.1%
2 - Russian Federation 23.5%
3 - United States of America 11.6%
4 - Japan 7.8%
5 - Republic of Korea 7.6%
6 - Belarus 3.5%
7 - Other 20.8%
Source: National Statistical office
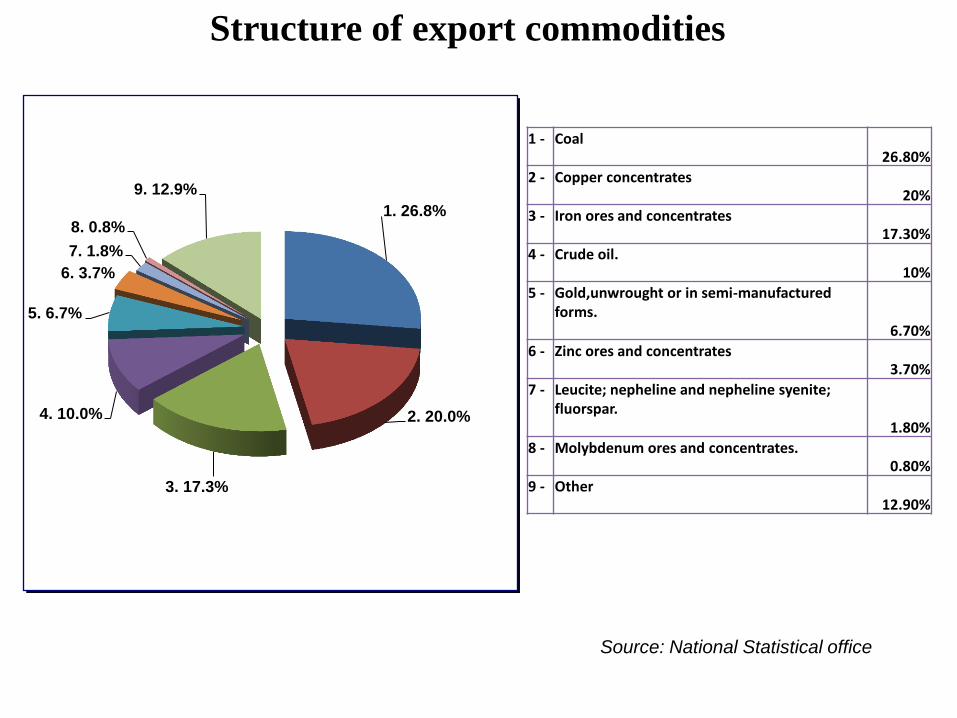
Structure of export commodities
1. 26.8%
2. 20.0%
3. 17.3%
4. 10.0%
5. 6.7%
6. 3.7%
7. 1.8%
8. 0.8%
9. 12.9%
1 - Coal 26.80%
2 - Copper concentrates
20%
3 - Iron ores and concentrates
17.30%
4 - Crude oil. 10%
5 - Gold,unwrought or in semi-manufactured forms.
6.70%
6 - Zinc ores and concentrates
3.70%
7 - Leucite; nepheline and nepheline syenite; fluorspar.
1.80%
8 - Molybdenum ores and concentrates. 0.80%
9 - Other 12.90%
Source: National Statistical office
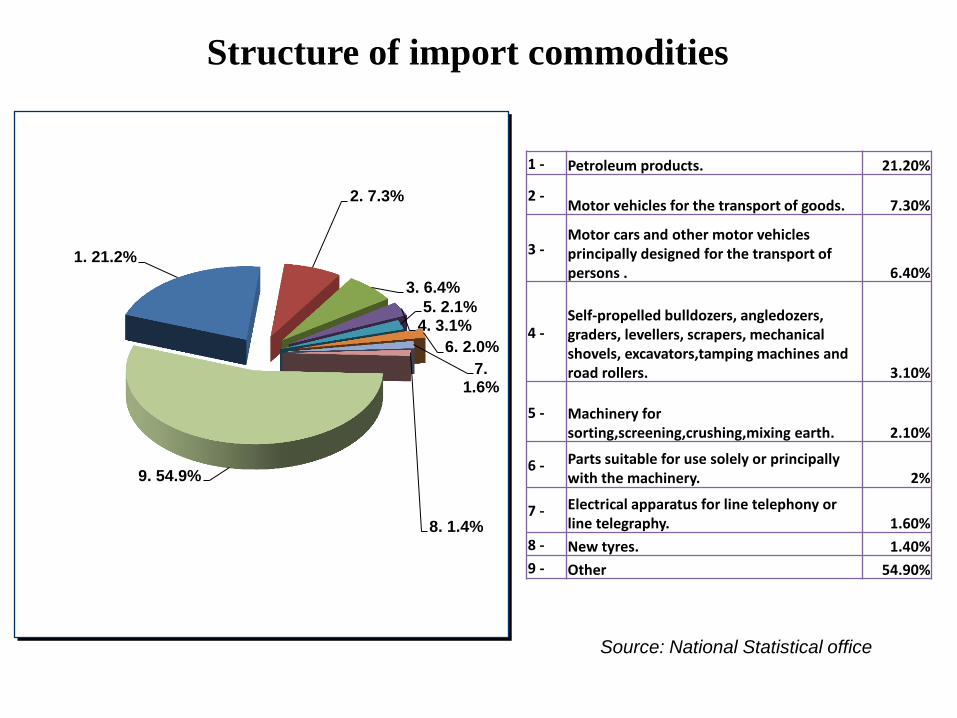
Structure of import commodities
1. 21.2%
2. 7.3%
3. 6.4%
4. 3.1% 5. 2.1%
6. 2.0%
7. 1.6%
8. 1.4%
9. 54.9%
1 - Petroleum products. 21.20%
2 - Motor vehicles for the transport of goods. 7.30%
3 - Motor cars and other motor vehicles principally designed for the transport of persons . 6.40%
4 - Self-propelled bulldozers, angledozers, graders, levellers, scrapers, mechanical shovels, excavators,tamping machines and road rollers. 3.10%
5 - Machinery for sorting,screening,crushing,mixing earth. 2.10%
6 - Parts suitable for use solely or principally with the machinery. 2%
7 - Electrical apparatus for line telephony or line telegraphy. 1.60%
8 - New tyres. 1.40%
9 - Other 54.90%
Source: National Statistical office
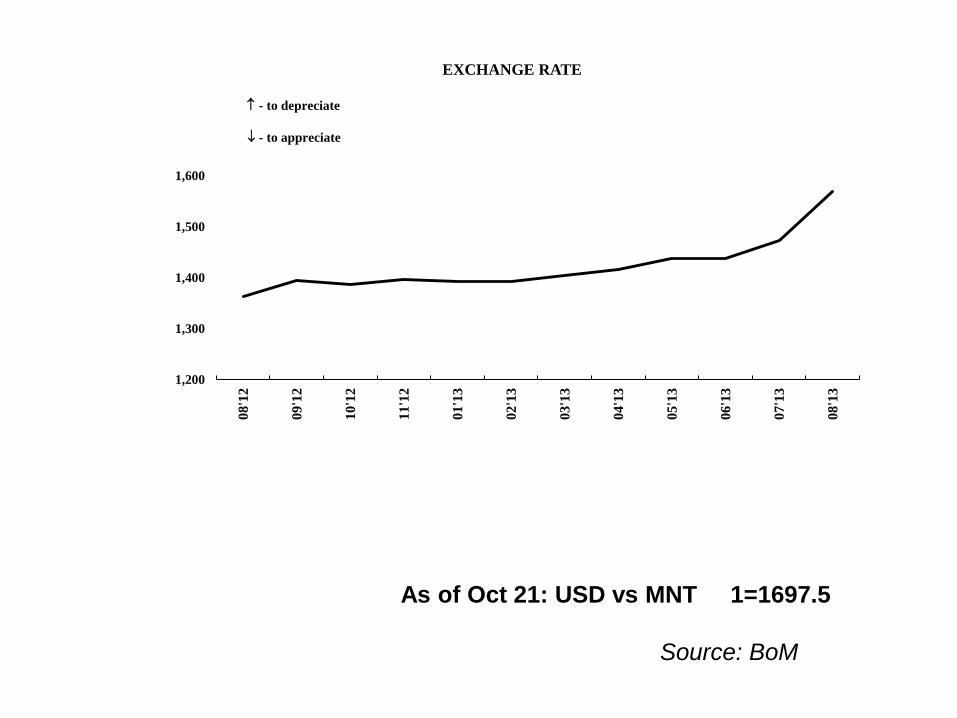
As of Oct 21: USD vs MNT 1=1697.5
Source: BoM
1,200
1,300
1,400
1,500
1,600
08'1
2
09'1
2
10'1
2
11'1
2
01'1
3
02'1
3
03'1
3
04'1
3
05'1
3
06'1
3
07'1
3
08'1
3
EXCHANGE RATE
- to depreciate
- to appreciate
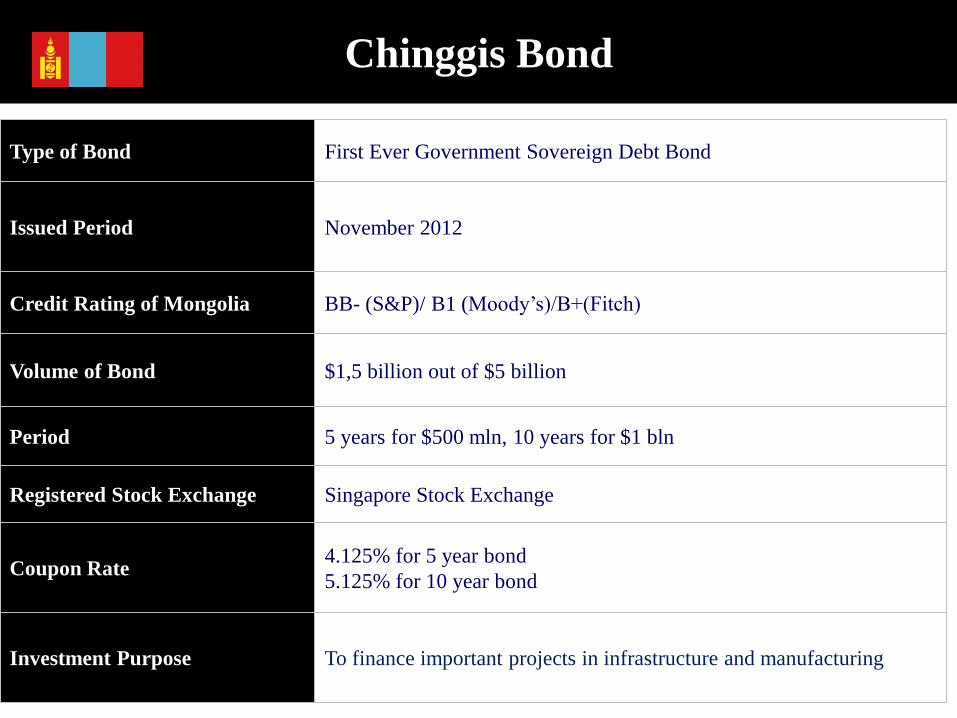
Type of Bond First Ever Government Sovereign Debt Bond
Issued Period November 2012
Credit Rating of Mongolia BB- (S&P)/ B1 (Moody’s)/B+(Fitch)
Volume of Bond $1,5 billion out of $5 billion
Period 5 years for $500 mln, 10 years for $1 bln
Registered Stock Exchange Singapore Stock Exchange
Coupon Rate 4.125% for 5 year bond
5.125% for 10 year bond
Investment Purpose To finance important projects in infrastructure and manufacturing
Chinggis Bond
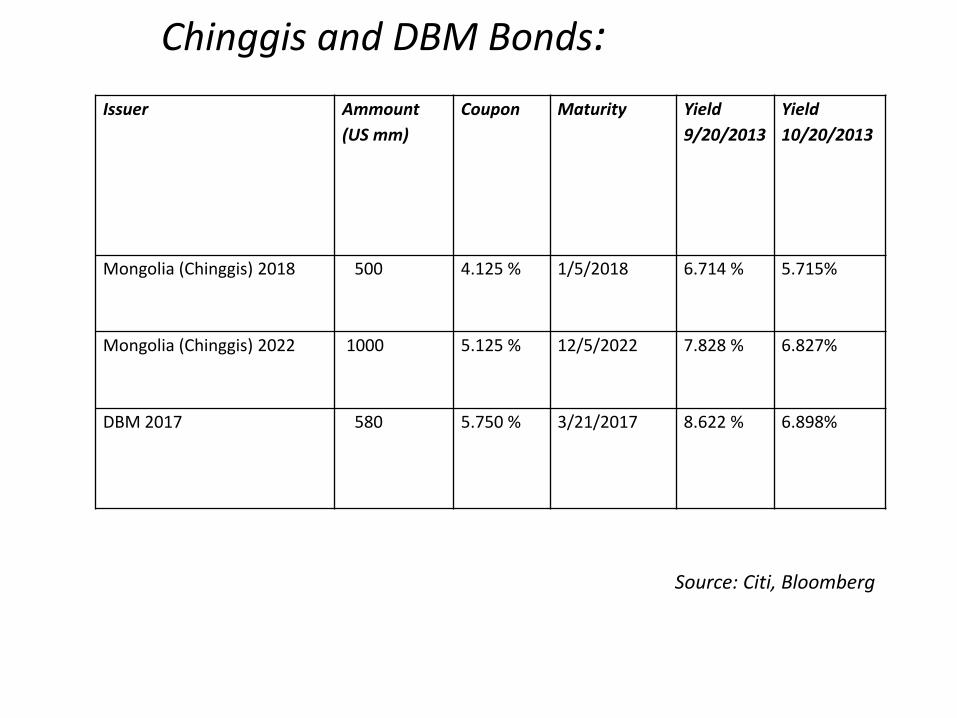
Issuer Ammount
(US mm)
Coupon Maturity Yield
9/20/2013
Yield
10/20/2013
Mongolia (Chinggis) 2018 500 4.125 % 1/5/2018 6.714 %
5.715%
Mongolia (Chinggis) 2022 1000 5.125 % 12/5/2022 7.828 %
6.827%
DBM 2017 580 5.750 % 3/21/2017 8.622 %
6.898%
Source: Citi, Bloomberg
Chinggis and DBM Bonds:
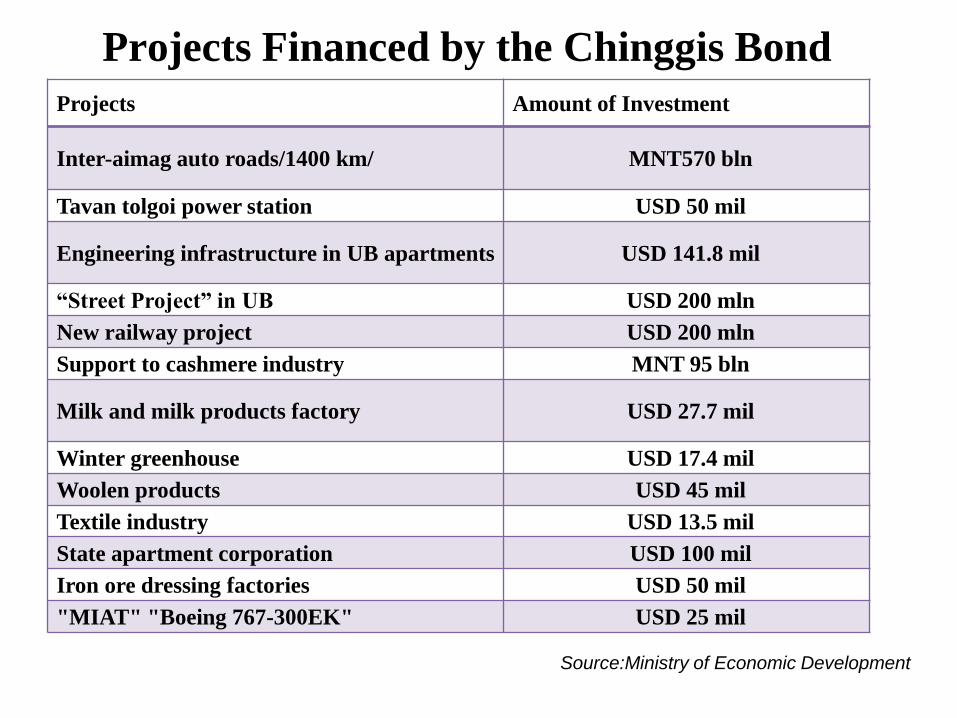
Projects Financed by the Chinggis Bond
e Chingiss Bond Projects Amount of Investment
Inter-aimag auto roads/1400 km/ MNT570 bln
Tavan tolgoi power station USD 50 mil
Engineering infrastructure in UB apartments USD 141.8 mil
“Street Project” in UB USD 200 mln
New railway project USD 200 mln
Support to cashmere industry MNT 95 bln
Milk and milk products factory USD 27.7 mil
Winter greenhouse USD 17.4 mil
Woolen products USD 45 mil
Textile industry USD 13.5 mil
State apartment corporation USD 100 mil
Iron ore dressing factories USD 50 mil
"MIAT" "Boeing 767-300EK" USD 25 mil
Source:Ministry of Economic Development
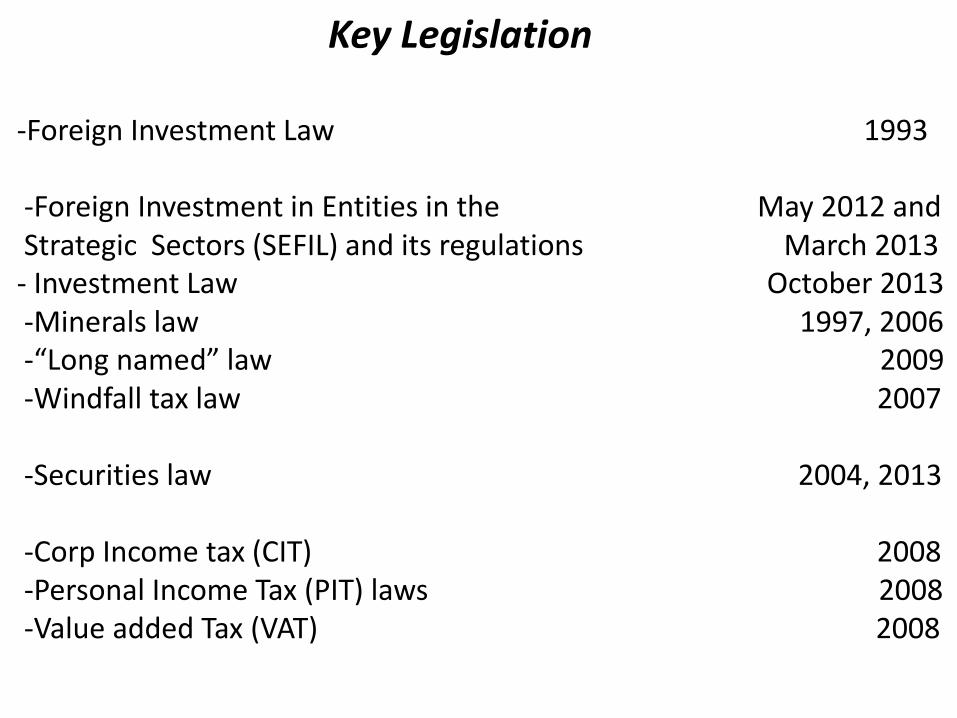
Key Legislation -Foreign Investment Law 1993
-Foreign Investment in Entities in the May 2012 and Strategic Sectors (SEFIL) and its regulations March 2013 - Investment Law October 2013 -Minerals law 1997, 2006
-“Long named” law 2009 -Windfall tax law 2007
-Securities law 2004, 2013
-Corp Income tax (CIT) 2008
-Personal Income Tax (PIT) laws 2008
-Value added Tax (VAT) 2008
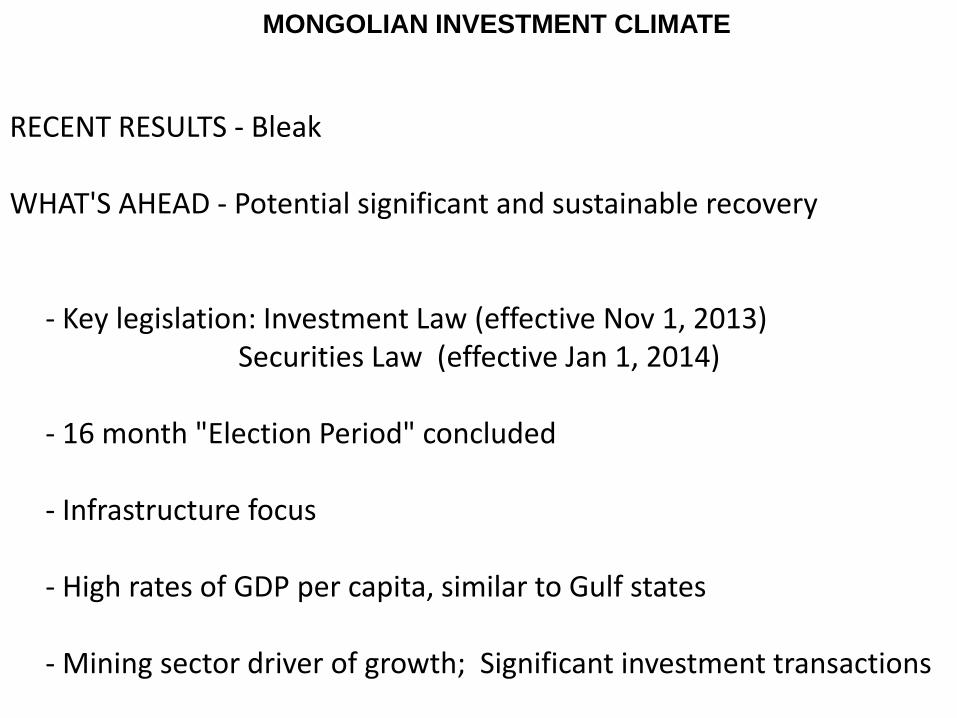
MONGOLIAN INVESTMENT CLIMATE
RECENT RESULTS - Bleak WHAT'S AHEAD - Potential significant and sustainable recovery - Key legislation: Investment Law (effective Nov 1, 2013) Securities Law (effective Jan 1, 2014) - 16 month "Election Period" concluded - Infrastructure focus - High rates of GDP per capita, similar to Gulf states - Mining sector driver of growth; Significant investment transactions
АНХААРАЛ ТАВЬСАНД БАЯРЛАЛАА
Stay Tuned To Mongolia!