Embed Size (px)
DESCRIPTION
BASF Performance Products including an overview of BASF's Dispersions & Pigments, Paper Chemicals, Performance Chemicals and Care Chemicals.
Citation preview
1BASF Performance Products Investor Day 2010
Growth. Value. Sustainability.
BASF Performance ProductsOutperforming: Growth. Value. Sustainability.Dr. John Feldmann
2BASF Performance Products Investor Day 2010
Growth. Value. Sustainability.
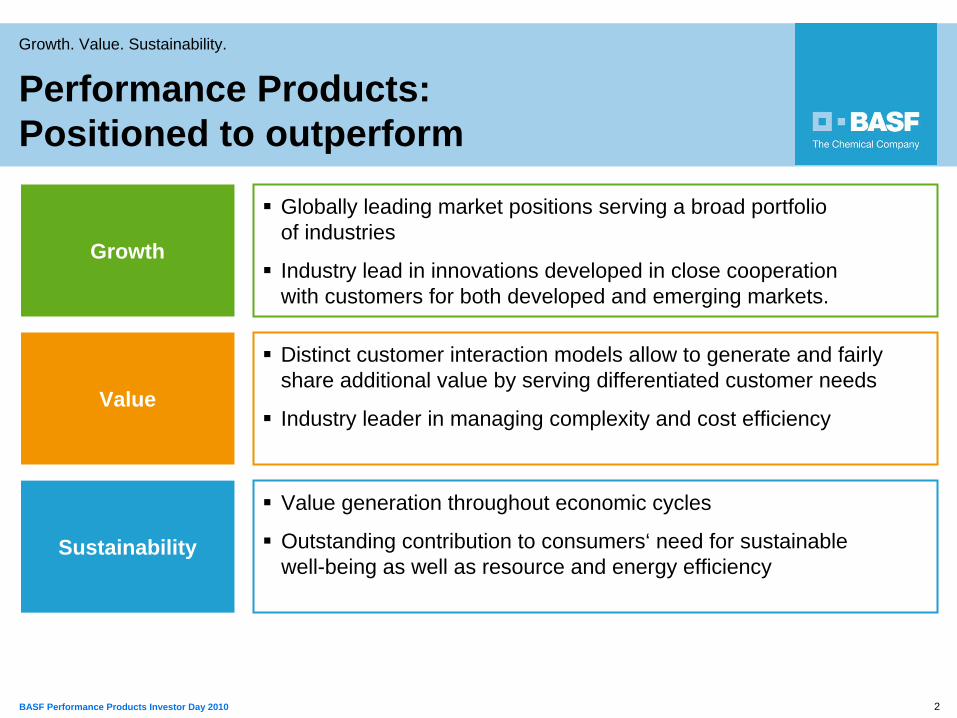
Distinct customer interaction models allow to generate and fairly share additional value by serving differentiated customer needs
Industry leader in managing complexity and cost efficiency
Globally leading market positions serving a broad portfolio of industries
Industry lead in innovations developed in close cooperation with customers for both developed and emerging markets.
Growth
Value
Sustainability
Performance Products: Positioned to outperform
Value generation throughout economic cycles
Outstanding contribution to consumers‘ need for sustainable well-being as well as resource and energy efficiency
3BASF Performance Products Investor Day 2010
Growth. Value. Sustainability.
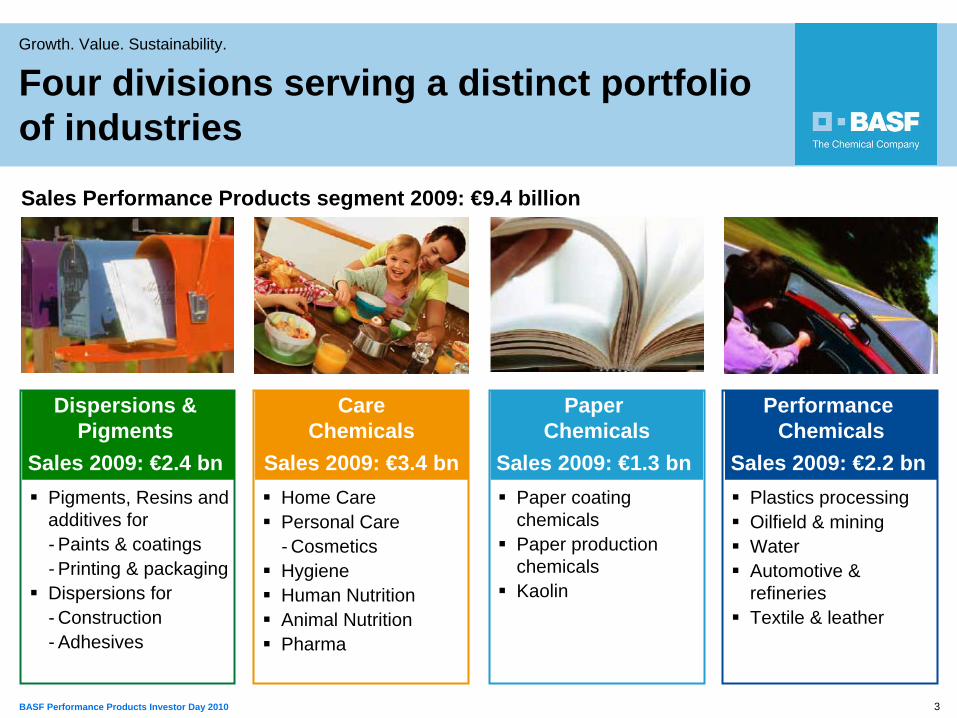
Four divisions serving a distinct portfolio of industries
Sales Performance Products segment 2009: €9.4 billion
Paper coating chemicals Paper production chemicals Kaolin
Paper Chemicals
Sales 2009: €1.3 bnPigments, Resins and additives for- Paints & coatings- Printing & packagingDispersions for- Construction- Adhesives
Dispersions & Pigments
Sales 2009: €2.4 bnHome CarePersonal Care- CosmeticsHygieneHuman NutritionAnimal NutritionPharma
Care Chemicals
Sales 2009: €3.4 bnPlastics processingOilfield & miningWaterAutomotive & refineries Textile & leather
Performance Chemicals
Sales 2009: €2.2 bn
4BASF Performance Products Investor Day 2010
Growth. Value. Sustainability.
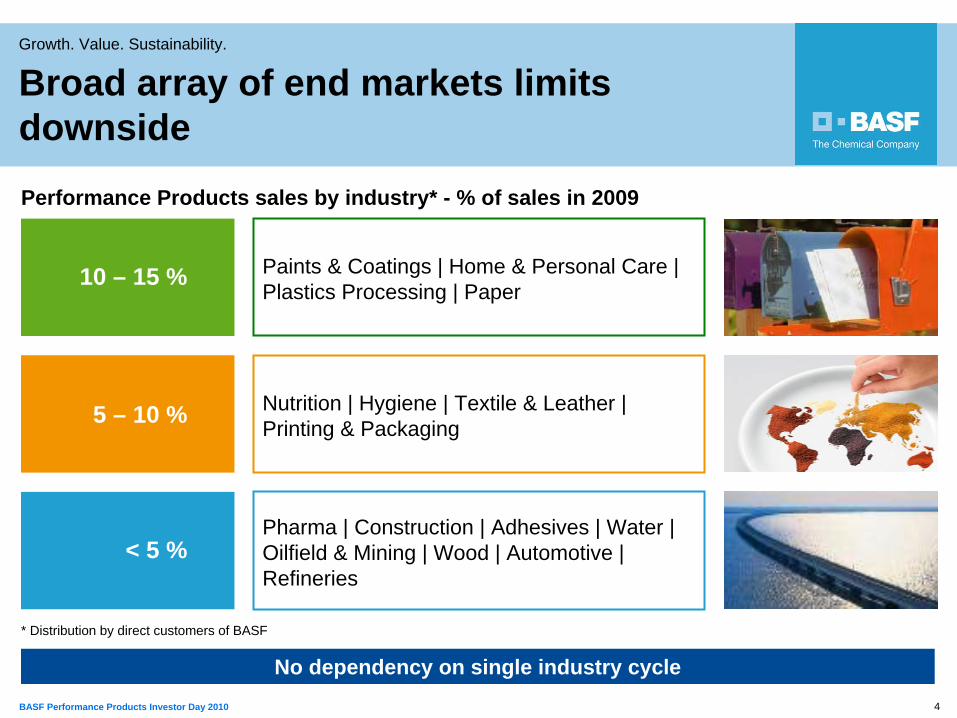
Nutrition | Hygiene | Textile & Leather | Printing & Packaging
10 – 15 %
5 – 10 %
< 5 %Pharma | Construction | Adhesives | Water | Oilfield & Mining | Wood | Automotive | Refineries
Paints & Coatings | Home & Personal Care | Plastics Processing | Paper
No dependency on single industry cycle
Performance Products sales by industry* - % of sales in 2009
* Distribution by direct customers of BASF
Broad array of end markets limits downside
5BASF Performance Products Investor Day 2010
Growth. Value. Sustainability.
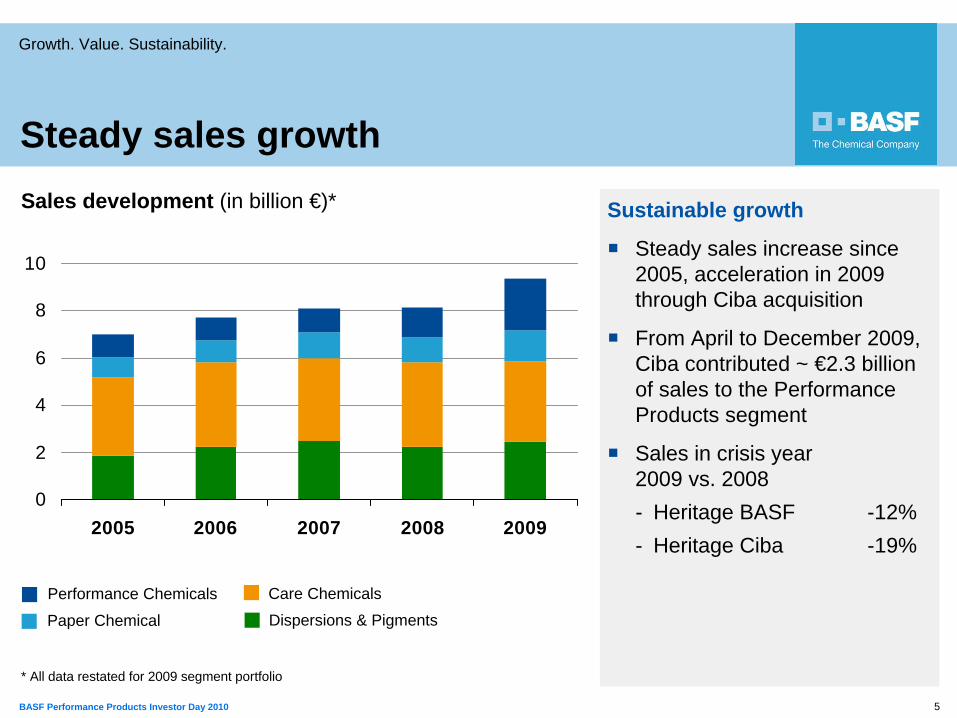
Sales development (in billion €)*
0
2
4
6
8
10
2005 2006 2007 2008 2009
Steady sales growth
Sustainable growth
Steady sales increase since 2005, acceleration in 2009 through Ciba acquisition
From April to December 2009, Ciba contributed ~ €2.3 billion of sales to the Performance Products segment
Sales in crisis year 2009 vs. 2008 - Heritage BASF -12%- Heritage Ciba -19%
Dispersions & PigmentsPaper Chemical
Care ChemicalsPerformance Chemicals
* All data restated for 2009 segment portfolio
6BASF Performance Products Investor Day 2010
Growth. Value. Sustainability.
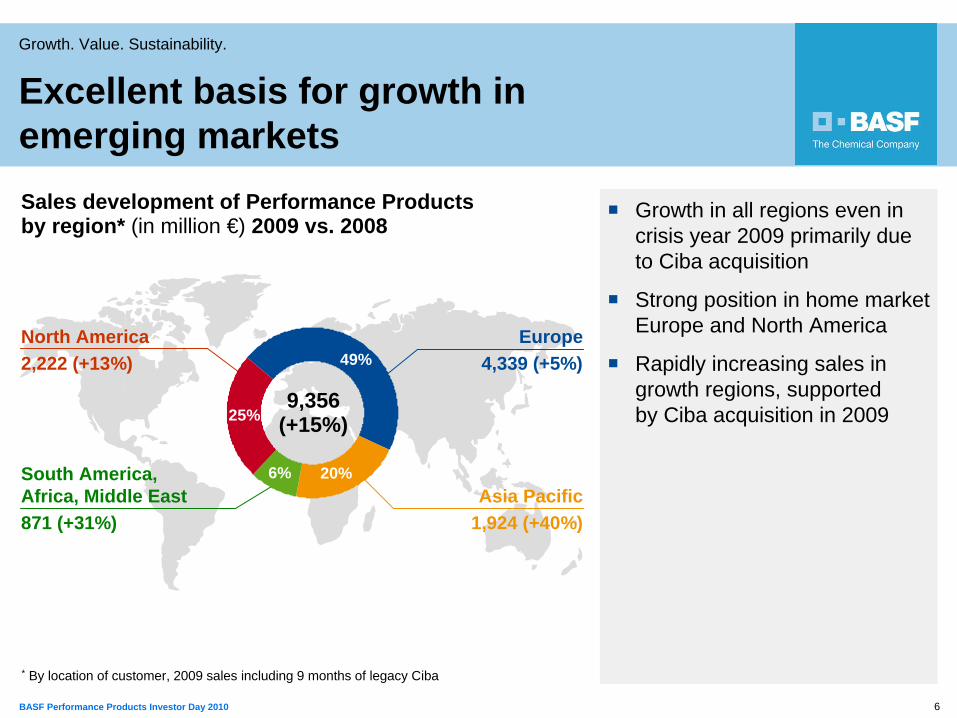
Sales development of Performance Products by region* (in million €) 2009 vs. 2008
25%
Growth in all regions even in crisis year 2009 primarily due to Ciba acquisition
Strong position in home market Europe and North America
Rapidly increasing sales in growth regions, supported by Ciba acquisition in 2009
Excellent basis for growth in emerging markets
North America2,222 (+13%)
Europe4,339 (+5%)
Asia Pacific1,924 (+40%)
South America, Africa, Middle East871 (+31%)
49%
20%6%
25%
* By location of customer, 2009 sales including 9 months of legacy Ciba
9,356(+15%)
7BASF Performance Products Investor Day 2010
Growth. Value. Sustainability.
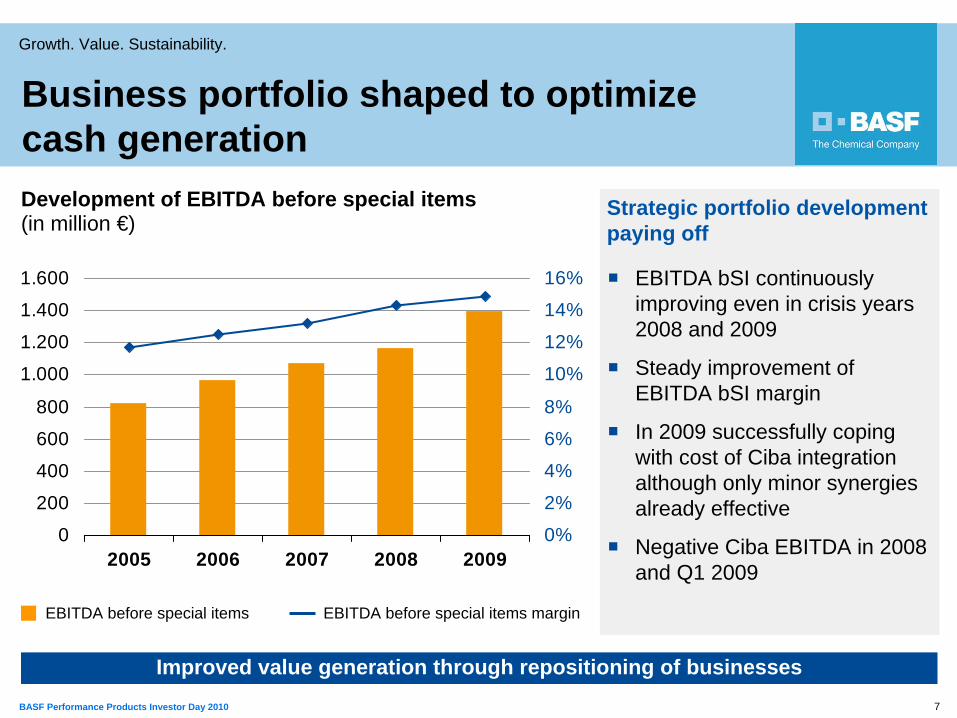
Development of EBITDA before special items (in million €)
Business portfolio shaped to optimize cash generation
EBITDA bSI continuously improving even in crisis years 2008 and 2009
Steady improvement of EBITDA bSI margin
In 2009 successfully coping with cost of Ciba integration although only minor synergies already effective
Negative Ciba EBITDA in 2008 and Q1 2009
Strategic portfolio development paying off
Improved value generation through repositioning of businesses
EBITDA before special items EBITDA before special items margin
0
200
400
600
800
1.000
1.200
1.400
1.600
2005 2006 2007 2008 20090%
2%
4%
6%
8%
10%
12%
14%
16%
8BASF Performance Products Investor Day 2010
Growth. Value. Sustainability.
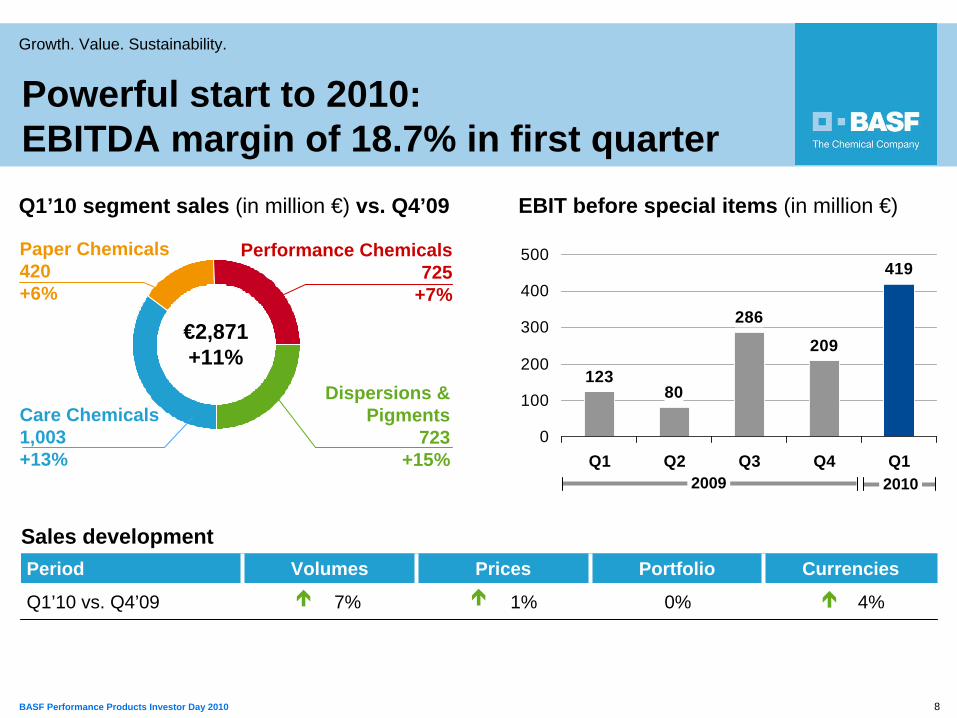
419
123
209
286
80
0
100
200
300
400
500
Q1 Q2 Q3 Q4 Q1
Sales developmentPeriod Volumes Prices Portfolio Currencies
Q1’10 vs. Q4’09 7% 1% 0% 4%
Dispersions & Pigments
723+15%
Performance Chemicals725
+7%
Paper Chemicals420+6%
€2,871 +11%
Care Chemicals1,003+13%
Q1’10 segment sales (in million €) vs. Q4’09 EBIT before special items (in million €)
20102009
Powerful start to 2010: EBITDA margin of 18.7% in first quarter
9BASF Performance Products Investor Day 2010
Growth. Value. Sustainability.
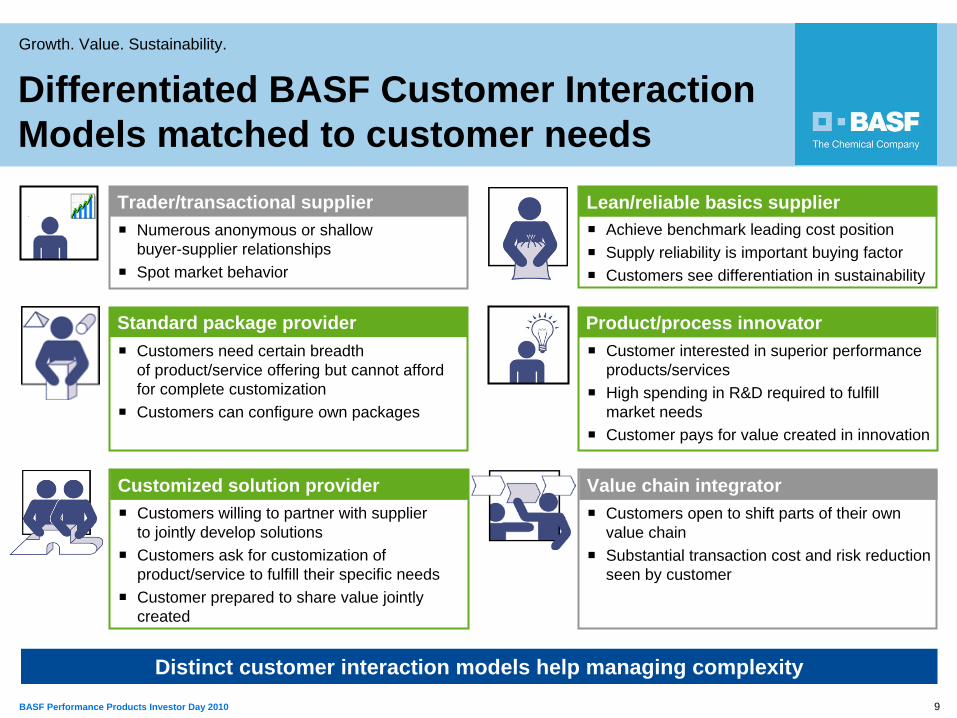
Customers need certain breadth of product/service offering but cannot afford for complete customizationCustomers can configure own packages
Numerous anonymous or shallow buyer-supplier relationshipsSpot market behavior
Customers willing to partner with supplier to jointly develop solutionsCustomers ask for customization of product/service to fulfill their specific needsCustomer prepared to share value jointly created
Achieve benchmark leading cost positionSupply reliability is important buying factorCustomers see differentiation in sustainability
Differentiated BASF Customer Interaction Models matched to customer needs
Distinct customer interaction models help managing complexity
Trader/transactional supplier
Standard package provider
Customized solution provider
Lean/reliable basics supplier
Customers open to shift parts of their own value chain Substantial transaction cost and risk reduction seen by customer
Value chain integrator
Customer interested in superior performance products/servicesHigh spending in R&D required to fulfill market needsCustomer pays for value created in innovation
Product/process innovator
10BASF Performance Products Investor Day 2010
Growth. Value. Sustainability.
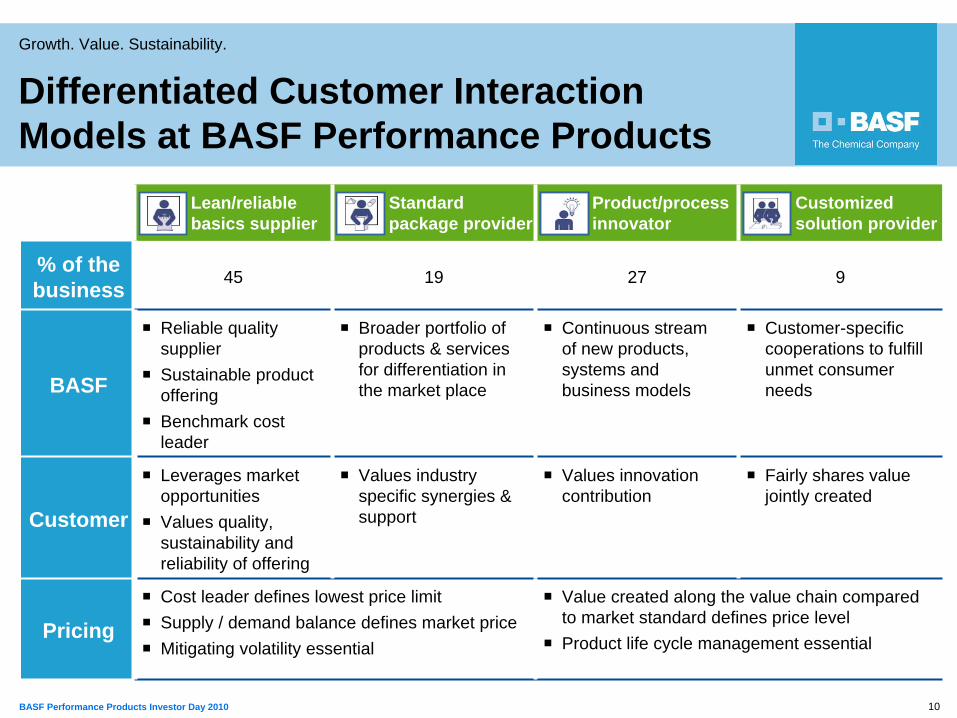
Differentiated Customer Interaction Models at BASF Performance Products
Lean/reliable basics supplier
Standard package provider
Product/process innovator
Customized solution provider
% of the business 45 19 27 9
BASF
Reliable quality supplierSustainable product offering Benchmark cost leader
Broader portfolio of products & services for differentiation in the market place
Continuous stream of new products, systems and business models
Customer-specific cooperations to fulfill unmet consumer needs
Customer
Leverages market opportunitiesValues quality, sustainability and reliability of offering
Values industry specific synergies & support
Values innovation contribution
Fairly shares value jointly created
PricingCost leader defines lowest price limit Supply / demand balance defines market priceMitigating volatility essential
Value created along the value chain compared to market standard defines price level Product life cycle management essential
11BASF Performance Products Investor Day 2010
Growth. Value. Sustainability.
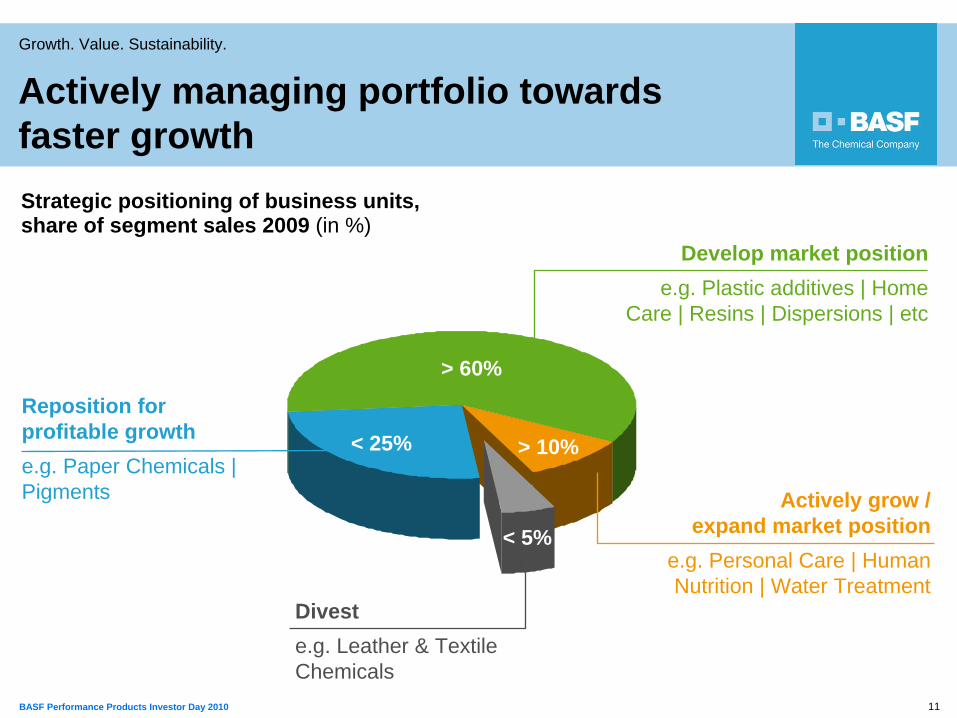
> 60%
Diveste.g. Leather & Textile Chemicals
Reposition for profitable growthe.g. Paper Chemicals | Pigments
Develop market positione.g. Plastic additives | Home
Care | Resins | Dispersions | etc
Actively grow / expand market position
e.g. Personal Care | Human Nutrition | Water Treatment
< 5%
< 25% > 10%
Actively managing portfolio towards faster growthStrategic positioning of business units, share of segment sales 2009 (in %)
12BASF Performance Products Investor Day 2010
Growth. Value. Sustainability.
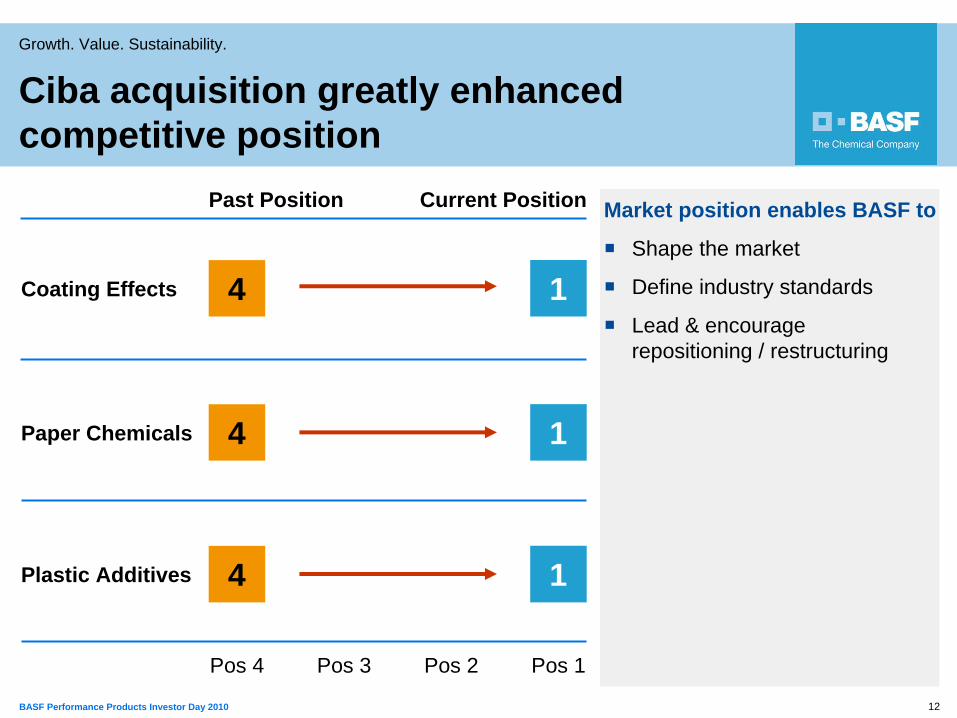
Market position enables BASF to
Shape the market
Define industry standards
Lead & encourage repositioning / restructuring
Coating Effects 1
Paper Chemicals
Past Position
Plastic Additives
Current Position
Ciba acquisition greatly enhanced competitive position
4
1
1
4
4
Pos 4 Pos 1Pos 3 Pos 2
13BASF Performance Products Investor Day 2010
Growth. Value. Sustainability.
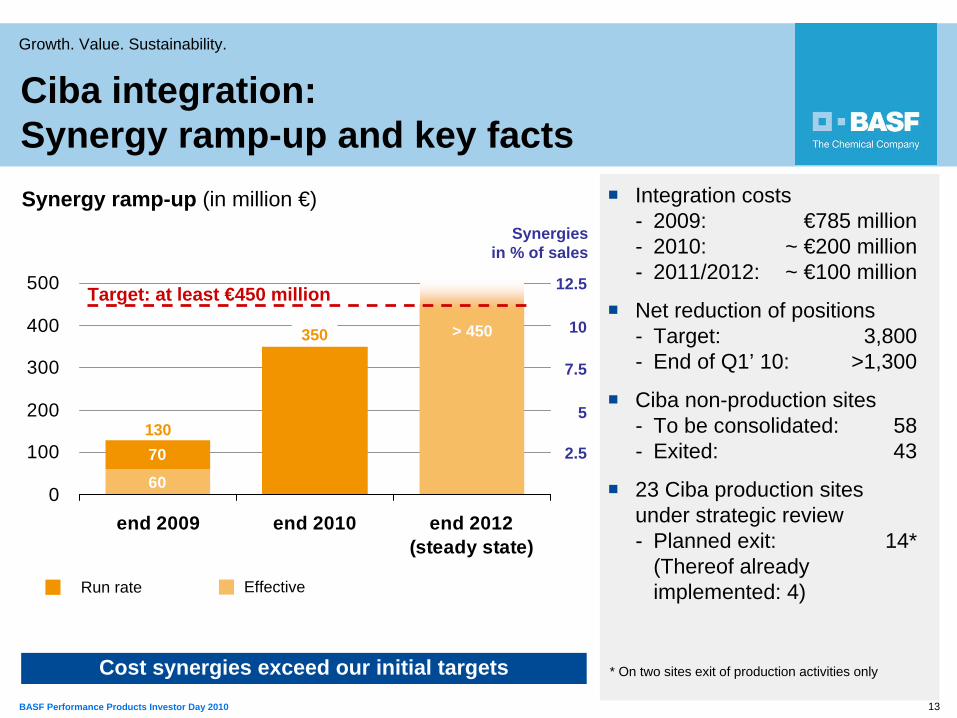
Synergy ramp-up (in million €)
70
600
100
200
300
400
500
end 2009 end 2010 end 2012(steady state)
Target: at least €450 million
Synergies in % of sales
10
5
7.5
2.5
12.5
130
Cost synergies exceed our initial targets
> 450
Ciba integration: Synergy ramp-up and key facts
Integration costs- 2009: €785 million- 2010: ~ €200 million- 2011/2012: ~ €100 million
Net reduction of positions- Target: 3,800- End of Q1’ 10: >1,300
Ciba non-production sites- To be consolidated: 58- Exited: 43
23 Ciba production sites under strategic review- Planned exit: 14*
(Thereof already implemented: 4)
* On two sites exit of production activities only
350
EffectiveRun rate
14BASF Performance Products Investor Day 2010
Growth. Value. Sustainability.
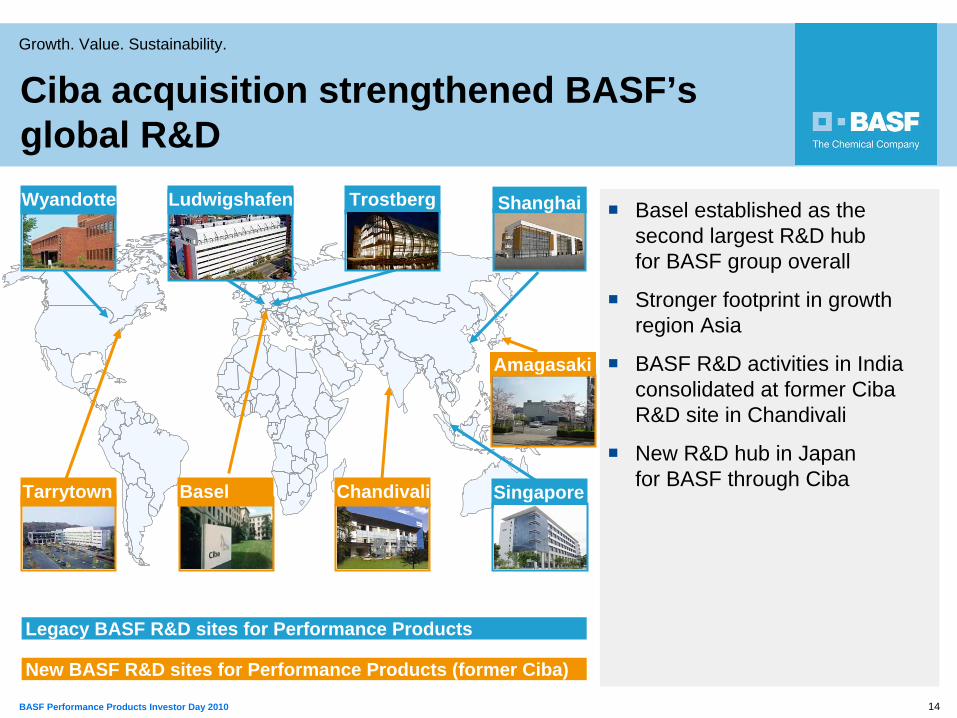
Amagasaki
Singapore
Trostberg
Legacy BASF R&D sites for Performance Products
New BASF R&D sites for Performance Products (former Ciba)
Ciba acquisition strengthened BASF’s global R&D
Basel established as the second largest R&D hub for BASF group overall
Stronger footprint in growth region Asia
BASF R&D activities in India consolidated at former Ciba R&D site in Chandivali
New R&D hub in Japan for BASF through CibaTarrytown Chandivali
Wyandotte Ludwigshafen Shanghai
Basel
15BASF Performance Products Investor Day 2010
Growth. Value. Sustainability.
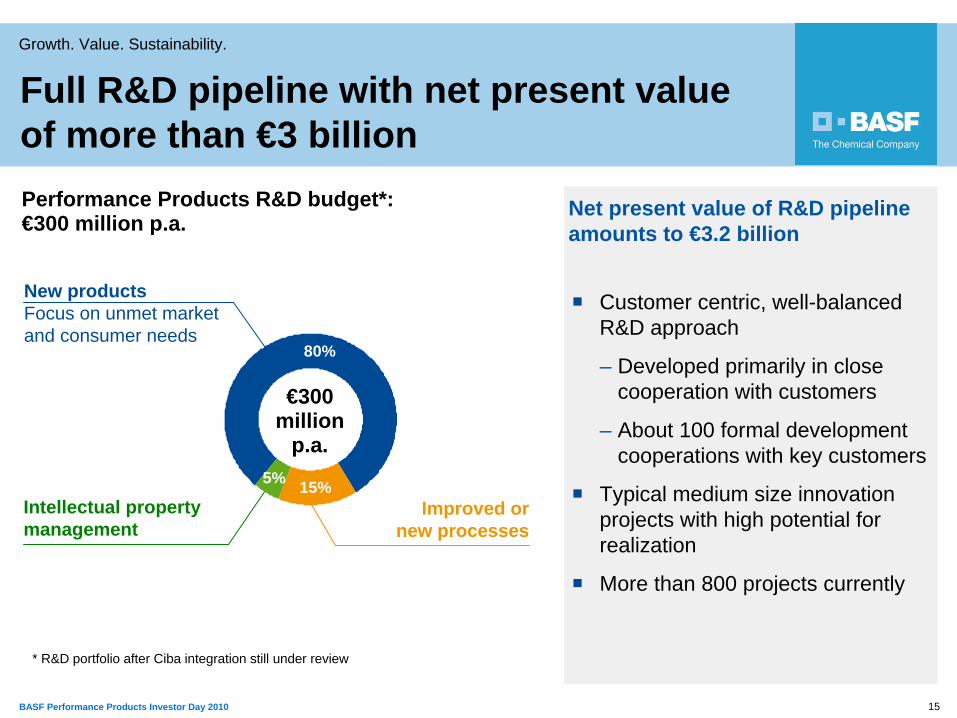
Customer centric, well-balanced R&D approach
– Developed primarily in close cooperation with customers
– About 100 formal development cooperations with key customers
Typical medium size innovation projects with high potential for realization
More than 800 projects currently
Net present value of R&D pipeline amounts to €3.2 billion
New products Focus on unmet market and consumer needs
Improved or new processes
Intellectual property management
80%
15%5%
€300million
p.a.
Performance Products R&D budget*: €300 million p.a.
* R&D portfolio after Ciba integration still under review
Full R&D pipeline with net present value of more than €3 billion
16BASF Performance Products Investor Day 2010
Growth. Value. Sustainability.
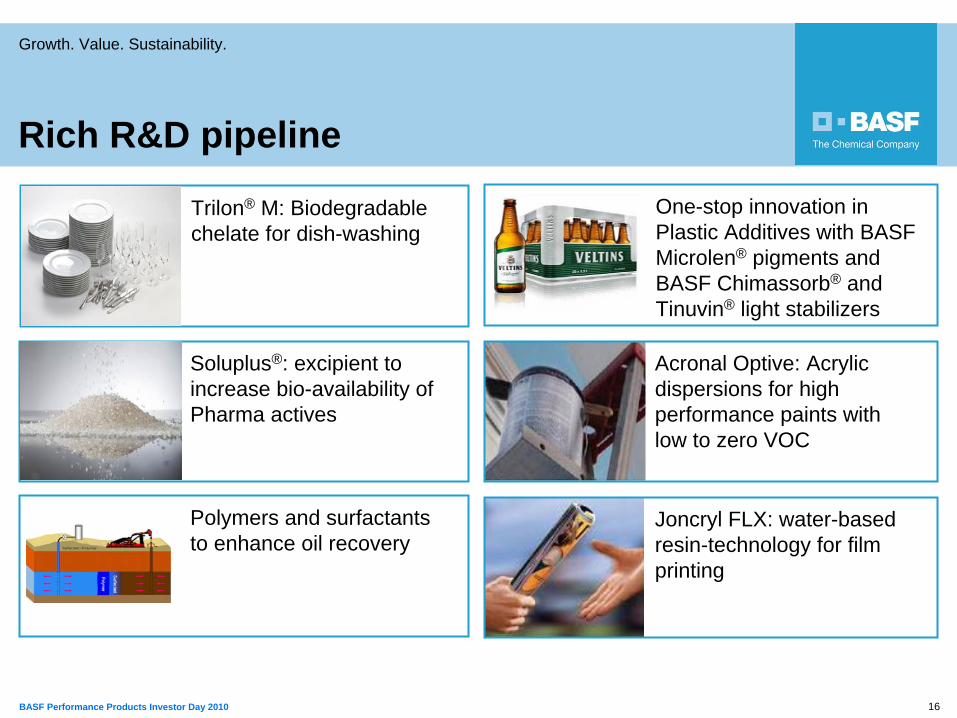
Trilon® M: Biodegradable chelate for dish-washing
Joncryl FLX: water-based resin-technology for film printing
One-stop innovation in Plastic Additives with BASF Microlen® pigments and BASF Chimassorb® and Tinuvin® light stabilizers
Soluplus®: excipient to increase bio-availability of Pharma actives
Polymers and surfactantsto enhance oil recovery
Acronal Optive: Acrylic dispersions for high performance paints with low to zero VOC
Rich R&D pipeline
17BASF Performance Products Investor Day 2010
Growth. Value. Sustainability.
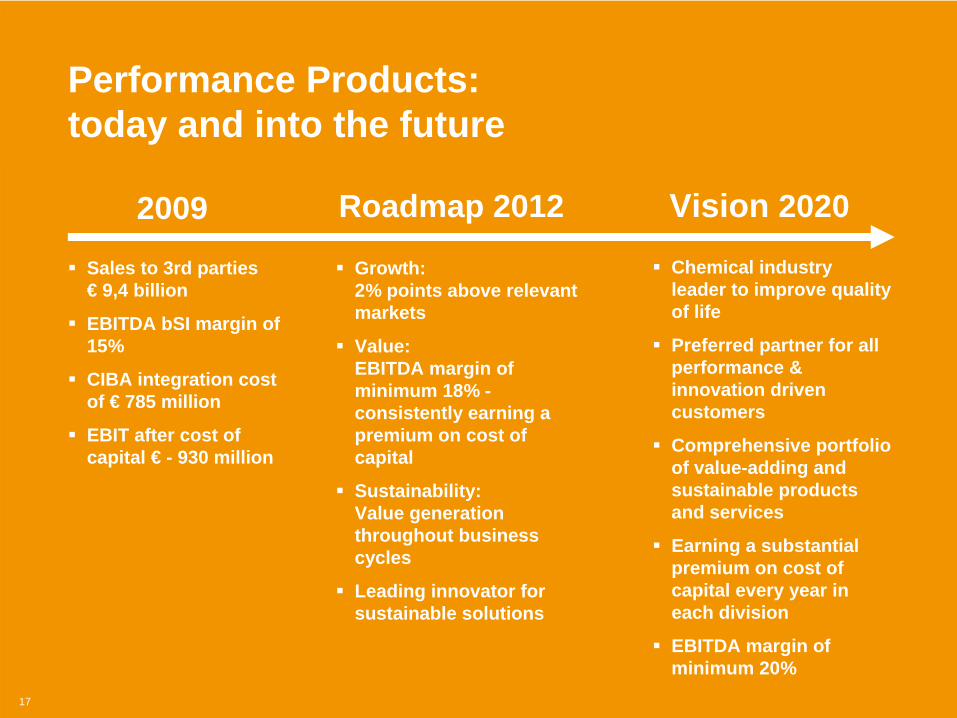
Performance Products: today and into the future
Vision 20202009
17
Chemical industry leader to improve quality of life
Preferred partner for all performance & innovation driven customers
Comprehensive portfolio of value-adding and sustainable products and services
Earning a substantial premium on cost of capital every year in each division
EBITDA margin of minimum 20%
Growth: 2% points above relevant markets
Value: EBITDA margin of minimum 18% -consistently earning a premium on cost of capital
Sustainability: Value generation throughout business cycles
Leading innovator for sustainable solutions
Sales to 3rd parties € 9,4 billion
EBITDA bSI margin of 15%
CIBA integration cost of € 785 million
EBIT after cost of capital € - 930 million
Roadmap 2012
1BASF Performance Products Investor Day 2010
Growth. Value. Sustainability.
1 | Dispersions & Pigments Markus Kramer
2 | Paper Chemicals Fred Baumgartner
3 | Performance Chemicals Hans W. Reiners
4 | Care Chemicals Gabriel Tanbourgi
1
2BASF Performance Products Investor Day 2010
Growth. Value. Sustainability.
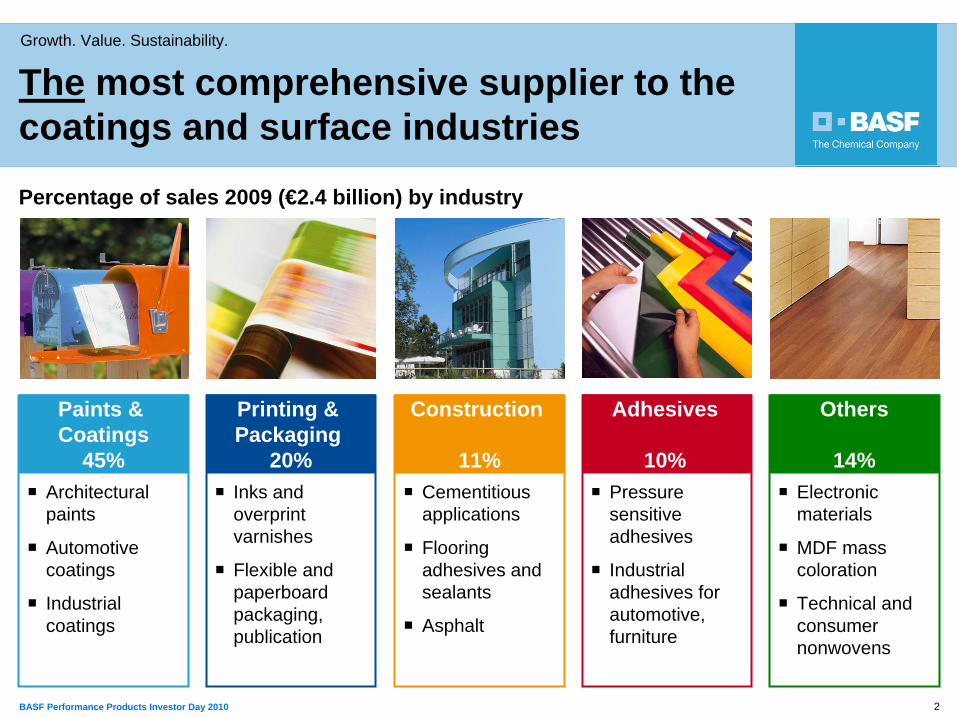
Architectural paints
Automotive coatings
Industrial coatings
Cementitious applications
Flooring adhesives and sealants
Asphalt
Pressure sensitive adhesives
Industrial adhesives for automotive, furniture
Electronic materials
MDF mass coloration
Technical and consumer nonwovens
Inks and overprint varnishes
Flexible and paperboard packaging, publication
Paints & Coatings
45%
Construction
11%
Adhesives
10%
Others
14%
Printing & Packaging
20%
Percentage of sales 2009 (€2.4 billion) by industry
The most comprehensive supplier to the coatings and surface industries
3BASF Performance Products Investor Day 2010
Growth. Value. Sustainability.
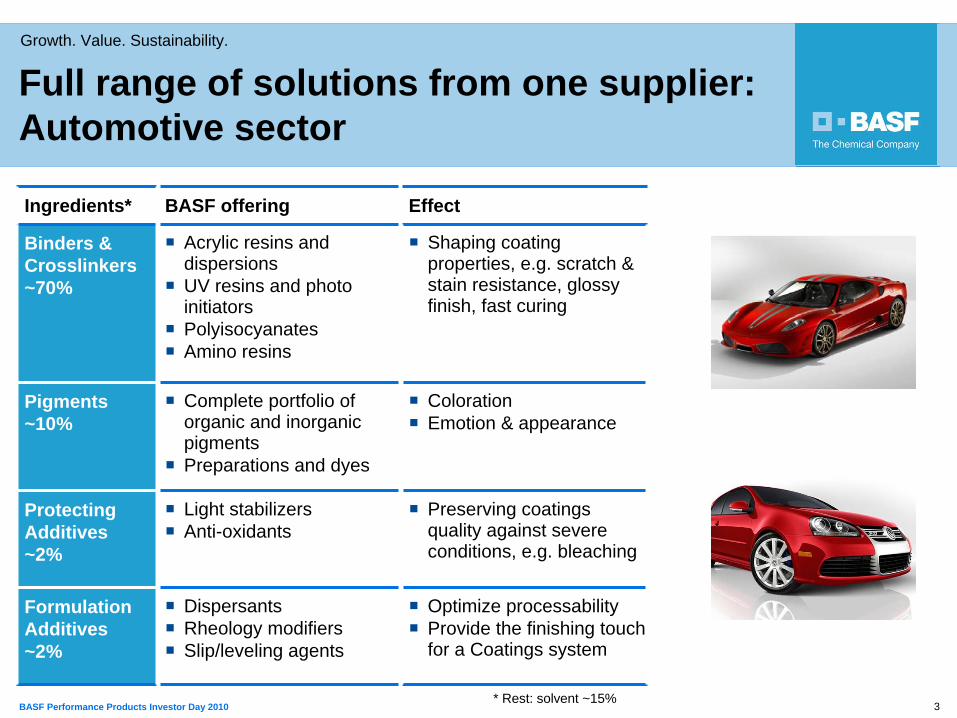
Full range of solutions from one supplier: Automotive sector
Ingredients* BASF offering Effect
Binders & Crosslinkers ~70%
Acrylic resins and dispersionsUV resins and photo initiatorsPolyisocyanatesAmino resins
Shaping coating properties, e.g. scratch & stain resistance, glossy finish, fast curing
Pigments ~10%
Complete portfolio of organic and inorganic pigmentsPreparations and dyes
ColorationEmotion & appearance
Protecting Additives ~2%
Light stabilizersAnti-oxidants
Preserving coatings quality against severe conditions, e.g. bleaching
Formulation Additives ~2%
DispersantsRheology modifiersSlip/leveling agents
Optimize processabilityProvide the finishing touch for a Coatings system
* Rest: solvent ~15%
4BASF Performance Products Investor Day 2010
Growth. Value. Sustainability.
Binders & Crosslinkers
Pigments
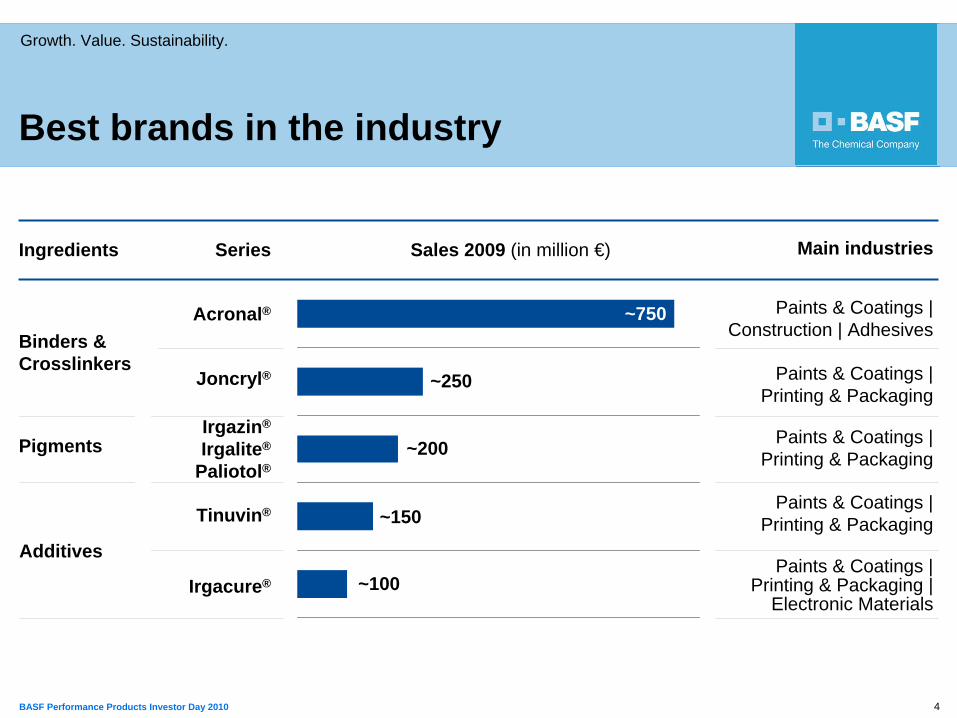
0 100 200 300 400 500 600 700 800
Series Sales 2009 (in million €)
Paints & Coatings | Construction | Adhesives
Paints & Coatings | Printing & Packaging
Paints & Coatings | Printing & Packaging
Paints & Coatings | Printing & Packaging
Paints & Coatings | Printing & Packaging |
Electronic MaterialsIrgacure®
Joncryl®
Tinuvin®
Acronal®
Ingredients
Irgazin®
Irgalite®
Paliotol®
Main industries
~750
~250
~200
~150
~100
Additives
Best brands in the industry
5BASF Performance Products Investor Day 2010
Growth. Value. Sustainability.
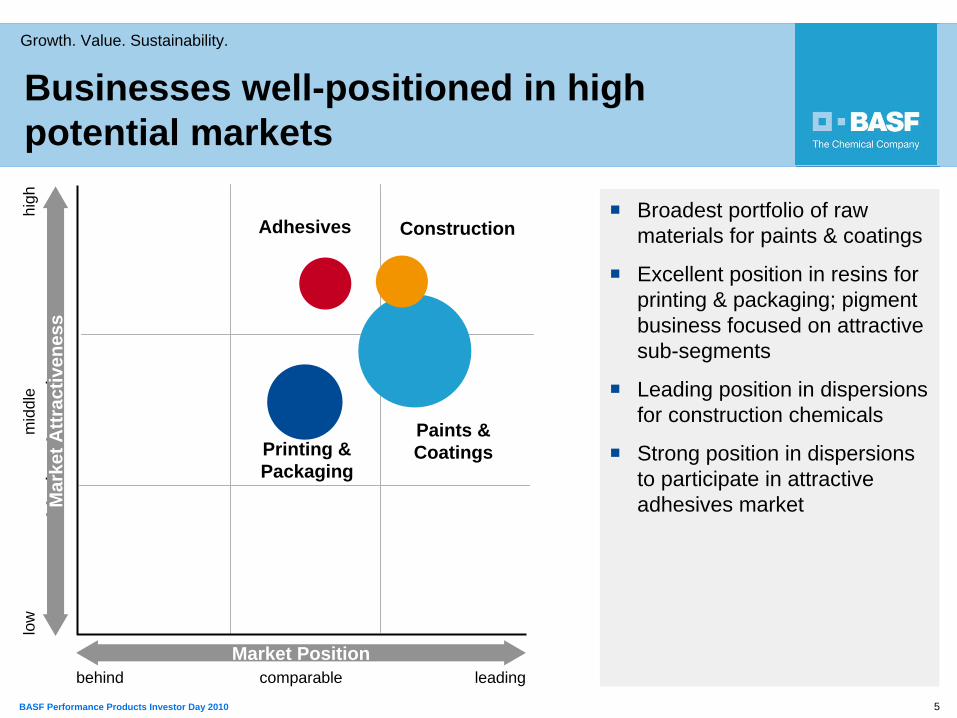
Businesses well-positioned in high potential markets
Mar
ket A
ttrac
tiven
ess
Paints & CoatingsPrinting &
Packaging
Adhesives ConstructionBroadest portfolio of raw materials for paints & coatings
Excellent position in resins for printing & packaging; pigment business focused on attractive sub-segments
Leading position in dispersions for construction chemicals
Strong position in dispersions to participate in attractive adhesives market
low
mid
dle
high
Mar
ket A
ttrac
tiven
ess
leadingcomparablebehindMarket Position
6BASF Performance Products Investor Day 2010
Growth. Value. Sustainability.
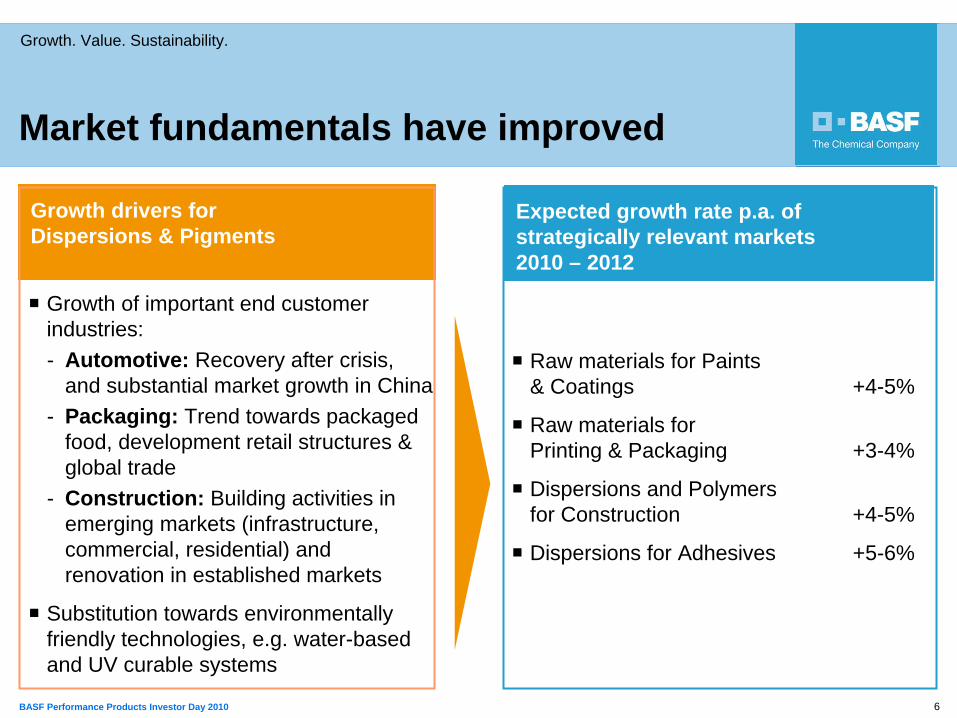
Growth drivers forDispersions & Pigments
Expected growth rate p.a. of strategically relevant markets 2010 – 2012
Growth of important end customer industries:- Automotive: Recovery after crisis,
and substantial market growth in China - Packaging: Trend towards packaged
food, development retail structures & global trade
- Construction: Building activities in emerging markets (infrastructure, commercial, residential) and renovation in established markets
Substitution towards environmentally friendly technologies, e.g. water-based and UV curable systems
Raw materials for Paints & Coatings +4-5%
Raw materials for Printing & Packaging +3-4%
Dispersions and Polymers for Construction +4-5%
Dispersions for Adhesives +5-6%
Market fundamentals have improved
7BASF Performance Products Investor Day 2010
Growth. Value. Sustainability.
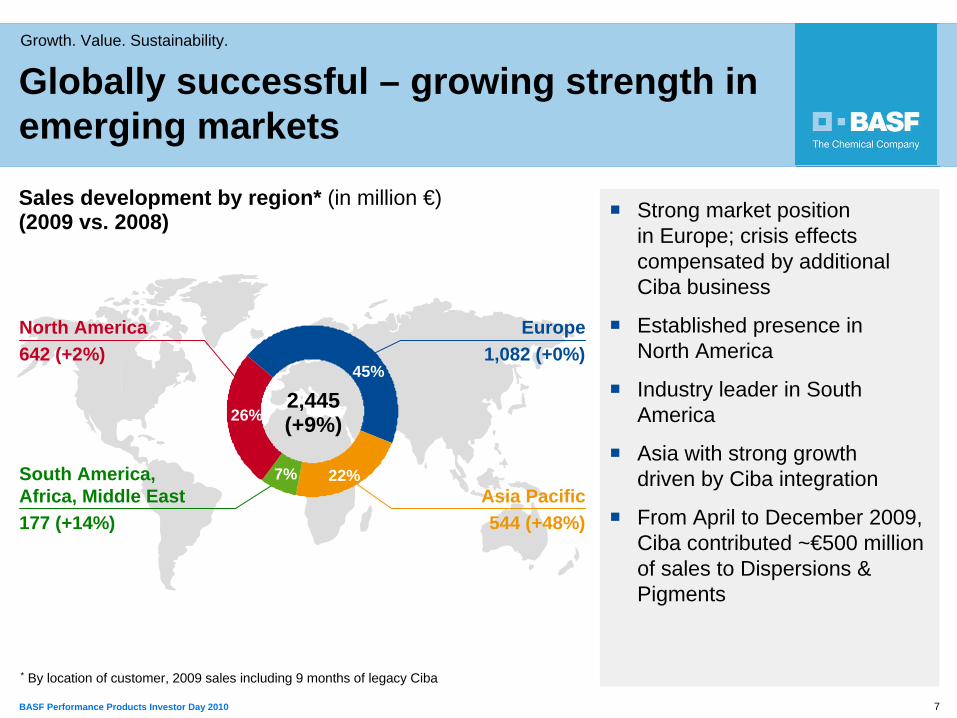
Sales development by region* (in million €) (2009 vs. 2008)
* By location of customer, 2009 sales including 9 months of legacy Ciba
25%
Strong market position in Europe; crisis effects compensated by additional Ciba business
Established presence in North America
Industry leader in South America
Asia with strong growth driven by Ciba integration
From April to December 2009, Ciba contributed ~€500 million of sales to Dispersions & Pigments
Globally successful – growing strength in emerging markets
North America642 (+2%)
Europe1,082 (+0%)
Asia Pacific544 (+48%)
South America, Africa, Middle East177 (+14%)
45%
22%7%
26%2,445(+9%)
8BASF Performance Products Investor Day 2010
Growth. Value. Sustainability.
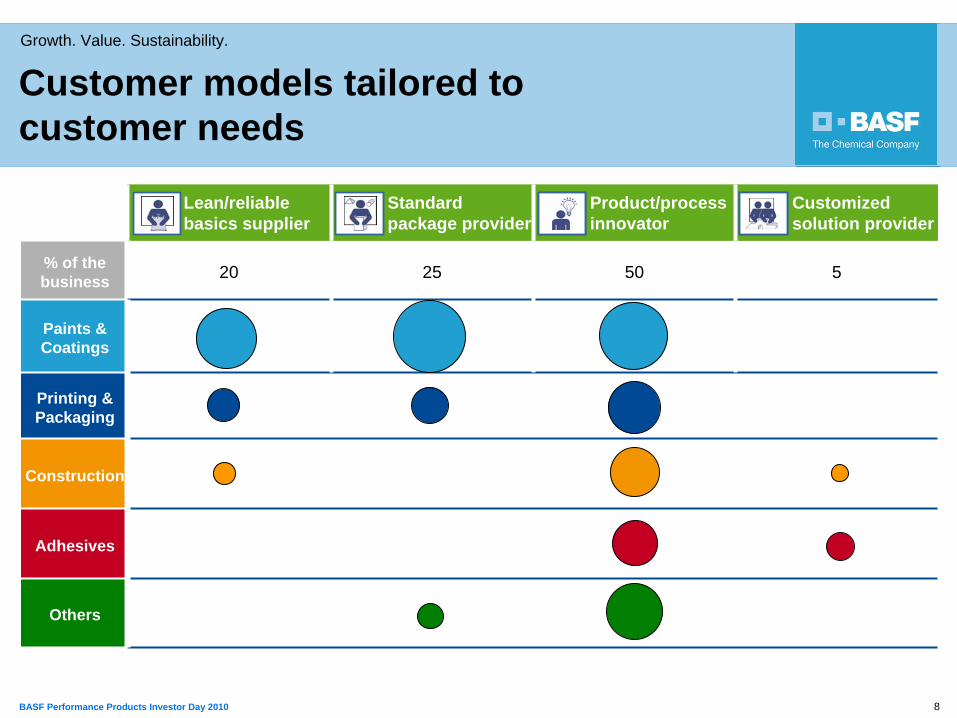
Customer models tailored to customer needs
Lean/reliable basics supplier
Standard package provider
Product/process innovator
Customized solution provider
% of the business 20 25 50 5
Paints & Coatings
Printing & Packaging
Construction
Adhesives
Others
9BASF Performance Products Investor Day 2010
Growth. Value. Sustainability.
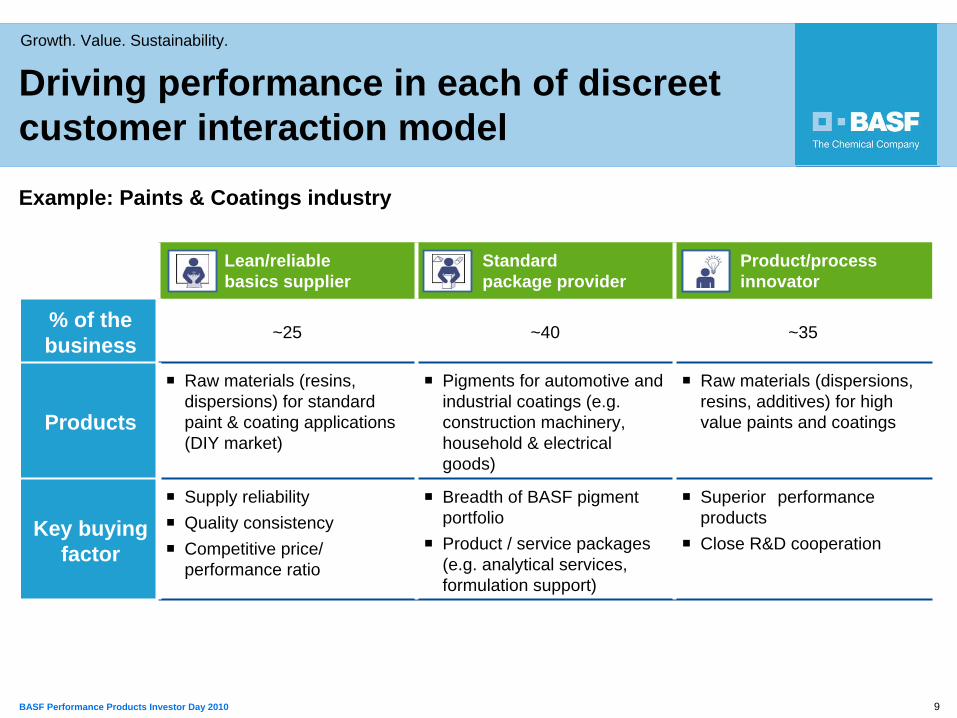
Driving performance in each of discreet customer interaction model
Lean/reliable basics supplier
Standard package provider
Product/process innovator
% of the business ~25 ~40 ~35
Products
Raw materials (resins, dispersions) for standard paint & coating applications (DIY market)
Pigments for automotive and industrial coatings (e.g. construction machinery, household & electrical goods)
Raw materials (dispersions, resins, additives) for high value paints and coatings
Key buying factor
Supply reliabilityQuality consistencyCompetitive price/ performance ratio
Breadth of BASF pigment portfolioProduct / service packages (e.g. analytical services, formulation support)
Superior performance productsClose R&D cooperation
Example: Paints & Coatings industry
10BASF Performance Products Investor Day 2010
Growth. Value. Sustainability.
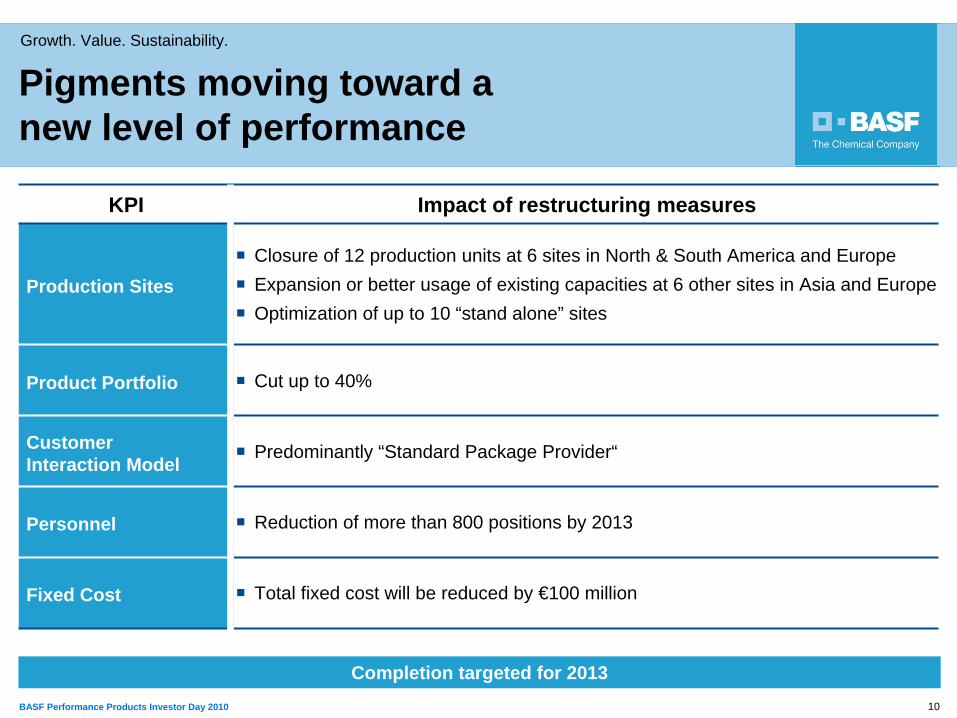
KPI Impact of restructuring measures
Production SitesClosure of 12 production units at 6 sites in North & South America and EuropeExpansion or better usage of existing capacities at 6 other sites in Asia and EuropeOptimization of up to 10 “stand alone” sites
Product Portfolio Cut up to 40%
Customer Interaction Model
Predominantly “Standard Package Provider“
Personnel Reduction of more than 800 positions by 2013
Fixed Cost Total fixed cost will be reduced by €100 million
Pigments moving toward a new level of performance
Completion targeted for 2013
11BASF Performance Products Investor Day 2010
Growth. Value. Sustainability.
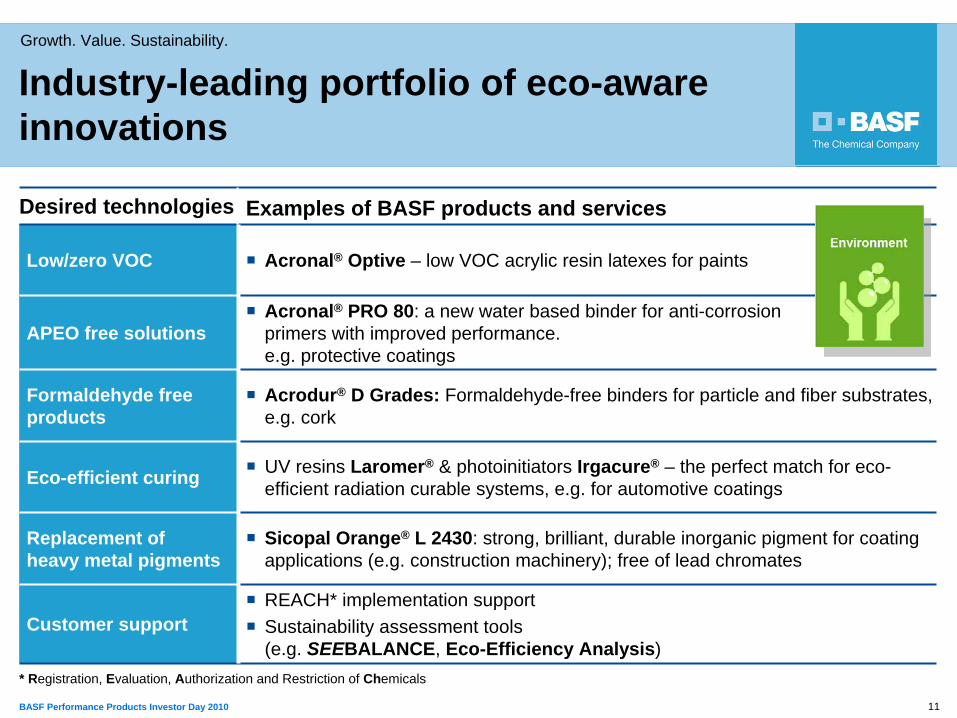
Industry-leading portfolio of eco-aware innovations
* Registration, Evaluation, Authorization and Restriction of Chemicals
Desired technologies Examples of BASF products and services
Low/zero VOC Acronal® Optive – low VOC acrylic resin latexes for paints
APEO free solutionsAcronal® PRO 80: a new water based binder for anti-corrosion primers with improved performance. e.g. protective coatings
Formaldehyde free products
Acrodur® D Grades: Formaldehyde-free binders for particle and fiber substrates, e.g. cork
Eco-efficient curing UV resins Laromer® & photoinitiators Irgacure® – the perfect match for eco-efficient radiation curable systems, e.g. for automotive coatings
Replacement of heavy metal pigments
Sicopal Orange® L 2430: strong, brilliant, durable inorganic pigment for coating applications (e.g. construction machinery); free of lead chromates
Customer supportREACH* implementation supportSustainability assessment tools(e.g. SEEBALANCE, Eco-Efficiency Analysis)
12BASF Performance Products Investor Day 2010
Growth. Value. Sustainability.
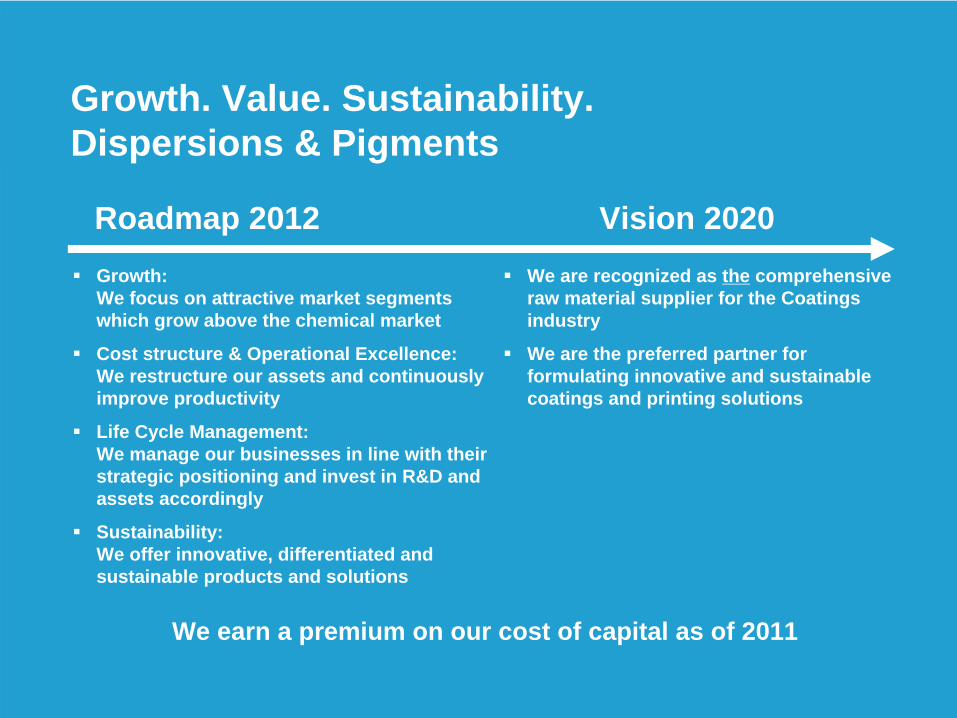
Growth. Value. Sustainability.Dispersions & Pigments
We are recognized as the comprehensive raw material supplier for the Coatings industry
We are the preferred partner for formulating innovative and sustainable coatings and printing solutions
Vision 2020Roadmap 2012Growth: We focus on attractive market segments which grow above the chemical market
Cost structure & Operational Excellence:We restructure our assets and continuously improve productivity
Life Cycle Management:We manage our businesses in line with their strategic positioning and invest in R&D and assets accordingly
Sustainability: We offer innovative, differentiated and sustainable products and solutions
We earn a premium on our cost of capital as of 2011
1BASF Performance Products Investor Day 2010
Growth. Value. Sustainability.
1 | Dispersions & Pigments Markus Kramer
2 | Paper Chemicals Fred Baumgartner
3 | Performance Chemicals Hans W. Reiners
4 | Care Chemicals Gabriel Tanbourgi
1
2BASF Performance Products Investor Day 2010
Growth. Value. Sustainability.
2
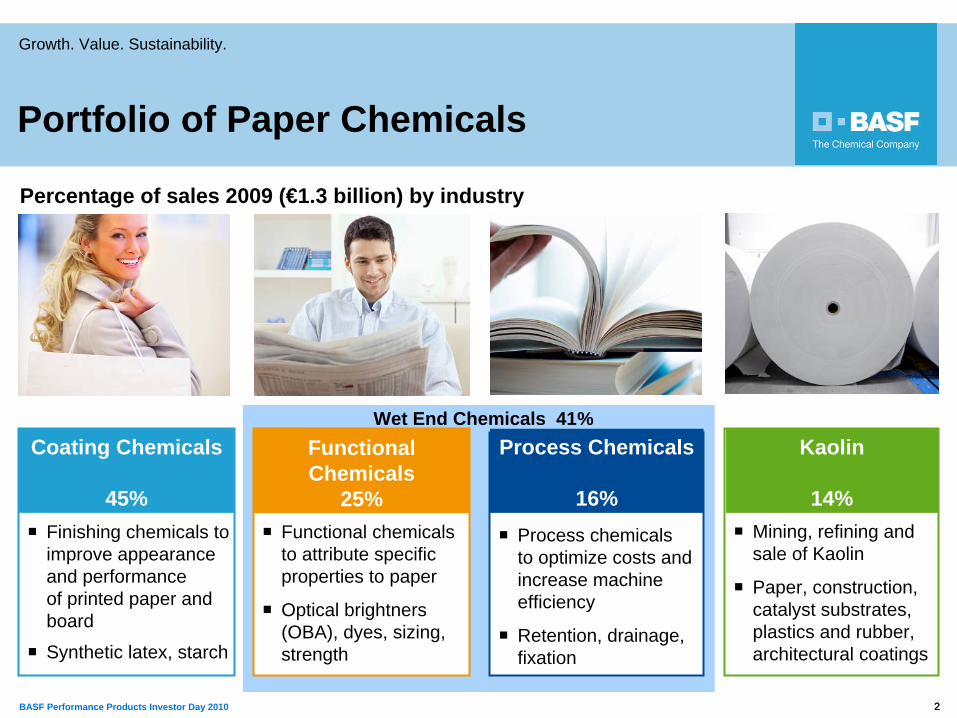
Finishing chemicals to improve appearance and performance of printed paper and board
Synthetic latex, starch
Coating Chemicals
45%Process chemicals to optimize costs and increase machine efficiency
Retention, drainage, fixation
Process Chemicals
16%Functional chemicals to attribute specific properties to paper
Optical brightners(OBA), dyes, sizing, strength
Functional Chemicals
25%
Wet End Chemicals 41%
Mining, refining and sale of Kaolin
Paper, construction, catalyst substrates, plastics and rubber, architectural coatings
Kaolin
14%
Percentage of sales 2009 (€1.3 billion) by industry
Portfolio of Paper Chemicals
3BASF Performance Products Investor Day 2010
Growth. Value. Sustainability.
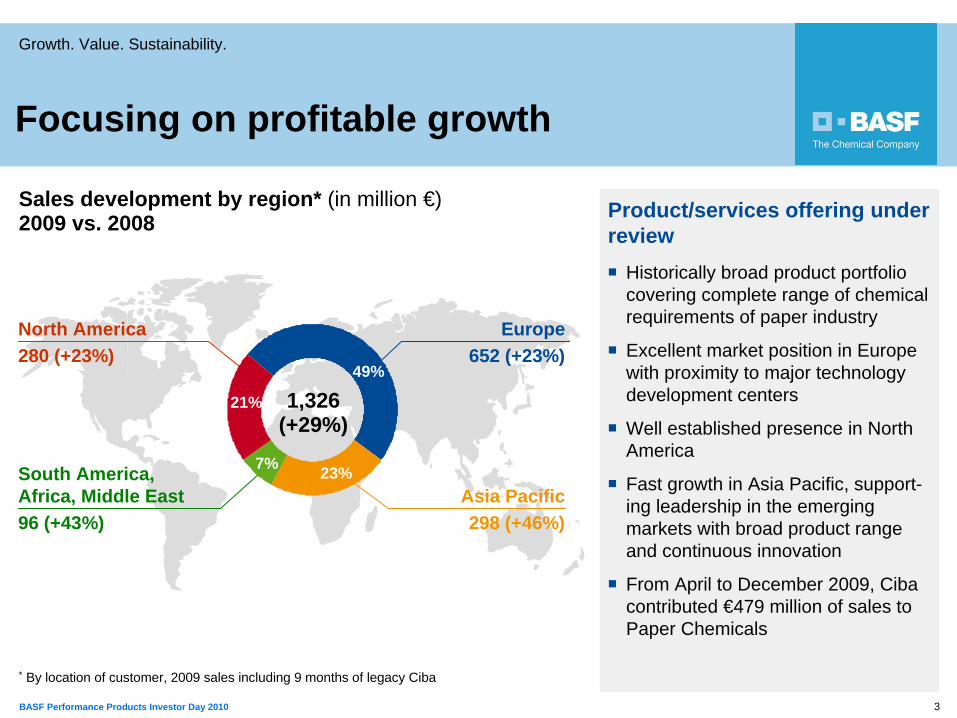
Sales development by region* (in million €) 2009 vs. 2008
25%
Focusing on profitable growth
North America280 (+23%)
Europe652 (+23%)
Asia Pacific298 (+46%)
South America, Africa, Middle East96 (+43%)
49%
23%7%
21% 1,326(+29%)
Historically broad product portfolio covering complete range of chemical requirements of paper industry
Excellent market position in Europe with proximity to major technology development centers
Well established presence in North America
Fast growth in Asia Pacific, support-ing leadership in the emerging markets with broad product range and continuous innovation
From April to December 2009, Ciba contributed €479 million of sales to Paper Chemicals
Product/services offering under review
* By location of customer, 2009 sales including 9 months of legacy Ciba
4BASF Performance Products Investor Day 2010
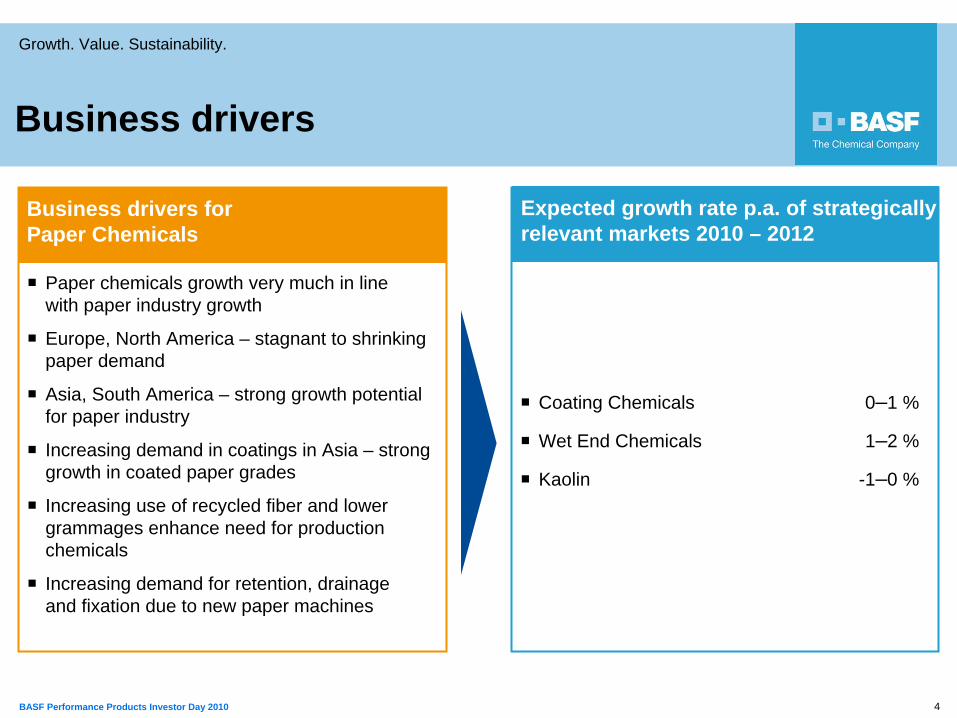
Growth. Value. Sustainability.
Paper chemicals growth very much in line with paper industry growth
Europe, North America – stagnant to shrinking paper demand
Asia, South America – strong growth potential for paper industry
Increasing demand in coatings in Asia – strong growth in coated paper grades
Increasing use of recycled fiber and lower grammages enhance need for production chemicals
Increasing demand for retention, drainage and fixation due to new paper machines
Coating Chemicals 0–1 %
Wet End Chemicals 1–2 %
Kaolin -1–0 %
Business drivers for Paper Chemicals
Business drivers
Expected growth rate p.a. of strategically relevant markets 2010 – 2012
5BASF Performance Products Investor Day 2010
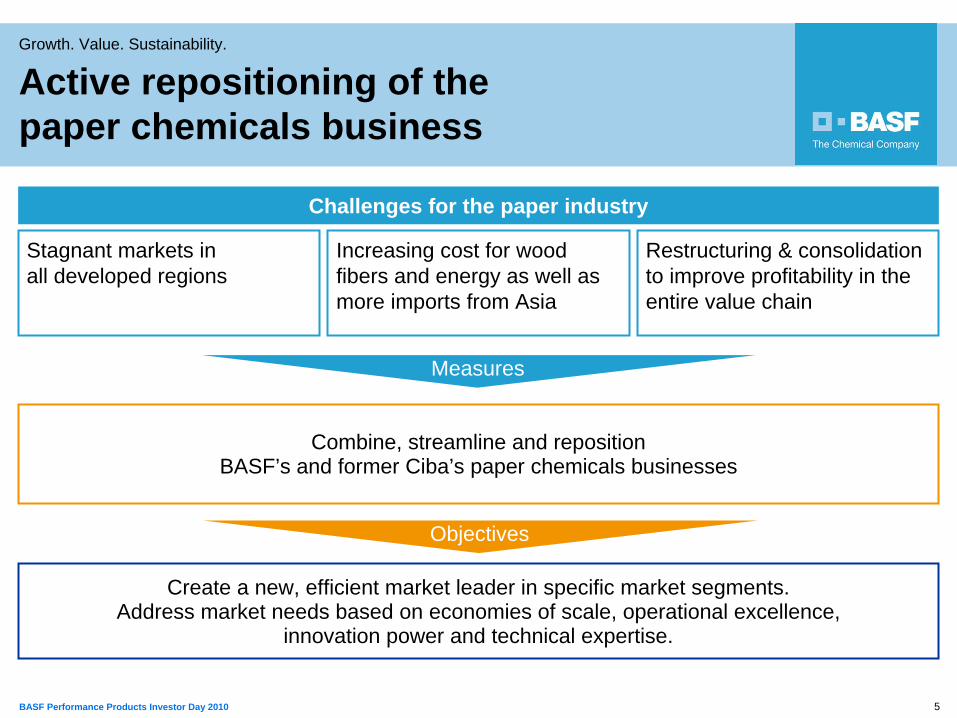
Growth. Value. Sustainability.
Combine, streamline and reposition BASF’s and former Ciba’s paper chemicals businesses
Challenges for the paper industry
Stagnant markets in all developed regions
Increasing cost for wood fibers and energy as well as more imports from Asia
Restructuring & consolidation to improve profitability in the entire value chain
Create a new, efficient market leader in specific market segments.Address market needs based on economies of scale, operational excellence,
innovation power and technical expertise.
Measures
Objectives
Active repositioning of the paper chemicals business
6BASF Performance Products Investor Day 2010
Growth. Value. Sustainability.
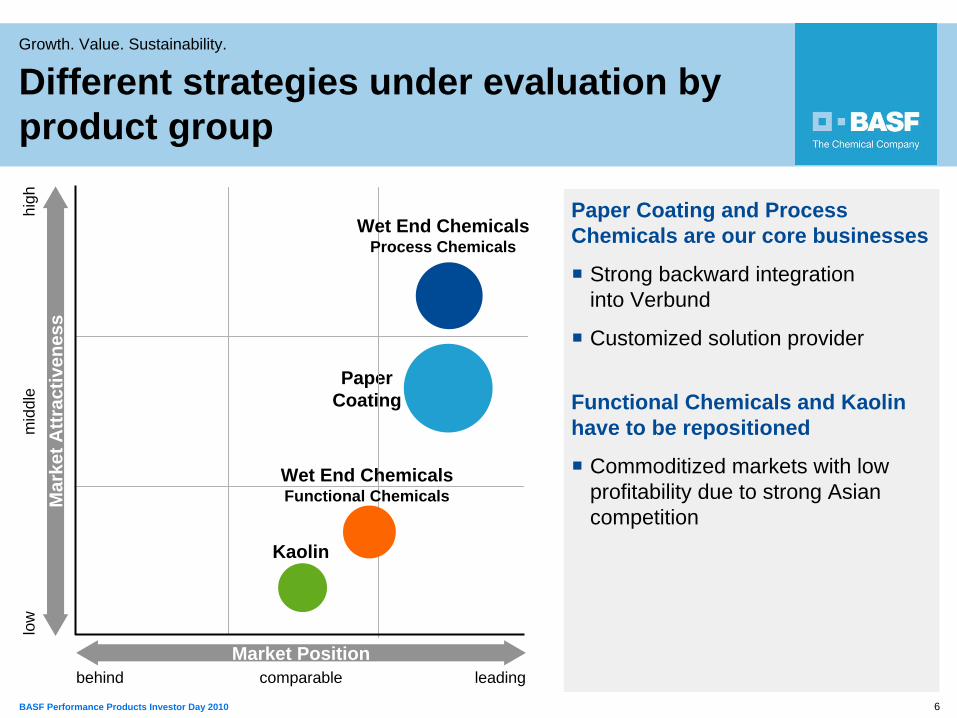
Paper Coating and Process Chemicals are our core businesses
Strong backward integration into Verbund
Customized solution provider
Functional Chemicals and Kaolin have to be repositioned
Commoditized markets with low profitability due to strong Asian competition
Paper Coating
Kaolin
low
mid
dle
high
leadingcomparablebehind
Mar
ket A
ttrac
tiven
ess
Market Position
Wet End Chemicals Process Chemicals
Wet End Chemicals Functional Chemicals
Different strategies under evaluation by product group
7BASF Performance Products Investor Day 2010
Growth. Value. Sustainability.
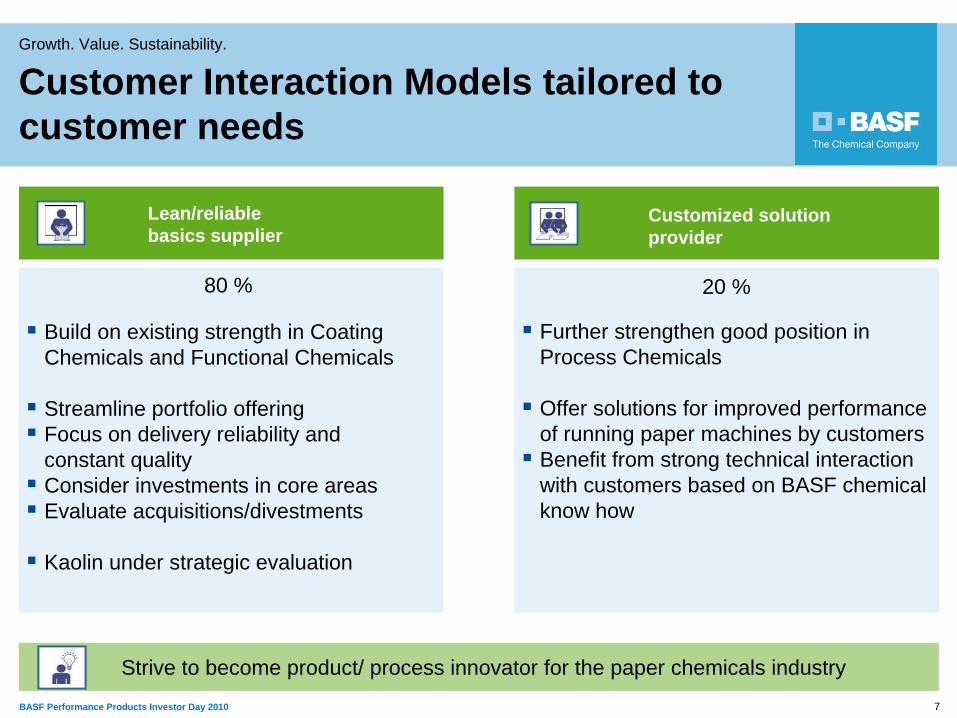
Customized solution provider
Lean/reliable basics supplier
80 % 20 %
Build on existing strength in Coating Chemicals and Functional Chemicals
Streamline portfolio offeringFocus on delivery reliability and constant qualityConsider investments in core areasEvaluate acquisitions/divestments
Kaolin under strategic evaluation
Further strengthen good position in Process Chemicals
Offer solutions for improved performance of running paper machines by customersBenefit from strong technical interaction with customers based on BASF chemical know how
Strive to become product/ process innovator for the paper chemicals industry
Customer Interaction Models tailored to customer needs
8BASF Performance Products Investor Day 2010
Growth. Value. Sustainability.
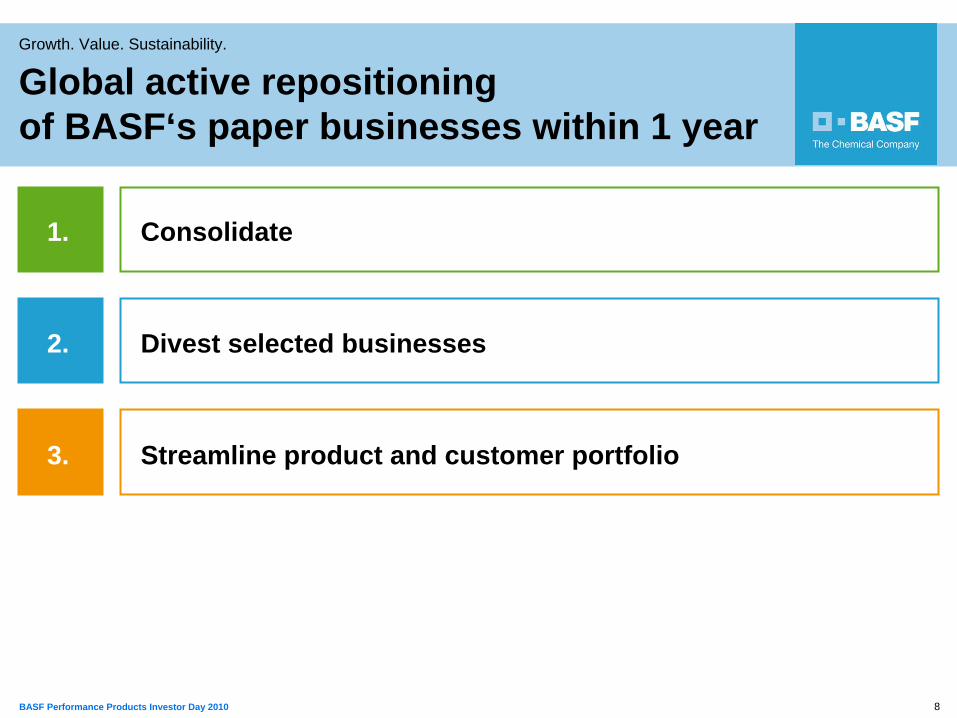
1. Consolidate
2. Divest selected businesses
3. Streamline product and customer portfolio
Global active repositioning of BASF‘s paper businesses within 1 year
9BASF Performance Products Investor Day 2010
Growth. Value. Sustainability.
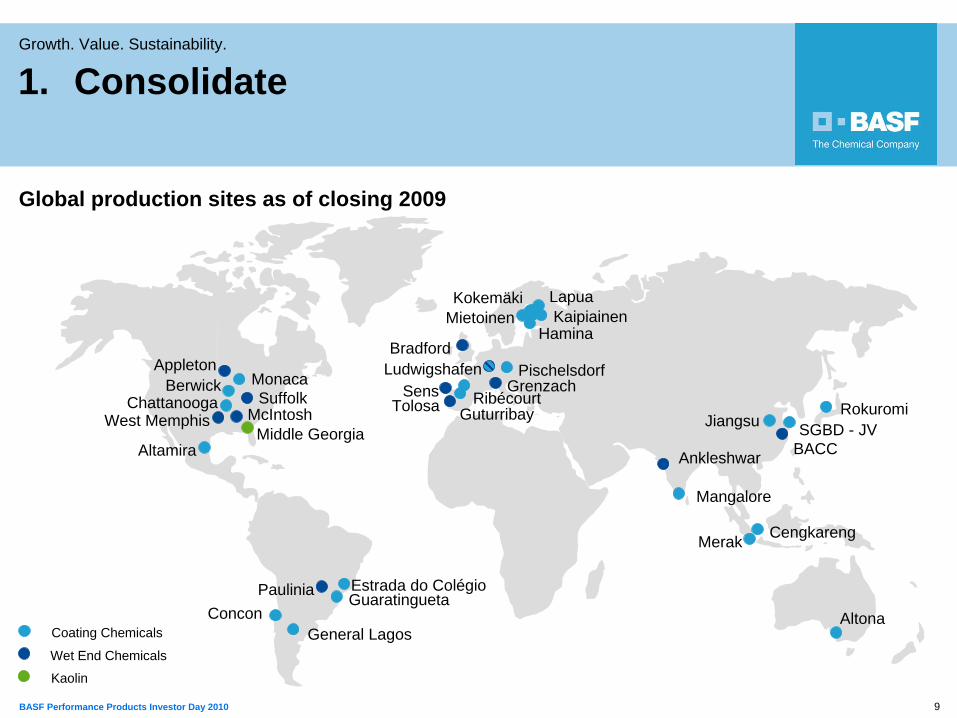
1. Consolidate
Ludwigshafen
Jiangsu
Ankleshwar
GrenzachPischelsdorf
Merak
Paulinia
Hamina
BACC
Guaratingueta
Mangalore
Bradford
General Lagos
Cengkareng
Coating Chemicals
Wet End Chemicals
Kaolin
McIntosh
Altamira
AppletonMonaca
Chattanooga SuffolkWest Memphis
Middle Georgia
LapuaKokemäkiMietoinen
Estrada do Colégio
SensTolosa
Kaipiainen
GuturribayRibécourt
Berwick
SGBD - JVRokuromi
AltonaConcon
Global production sites as of closing 2009
10BASF Performance Products Investor Day 2010
Growth. Value. Sustainability.
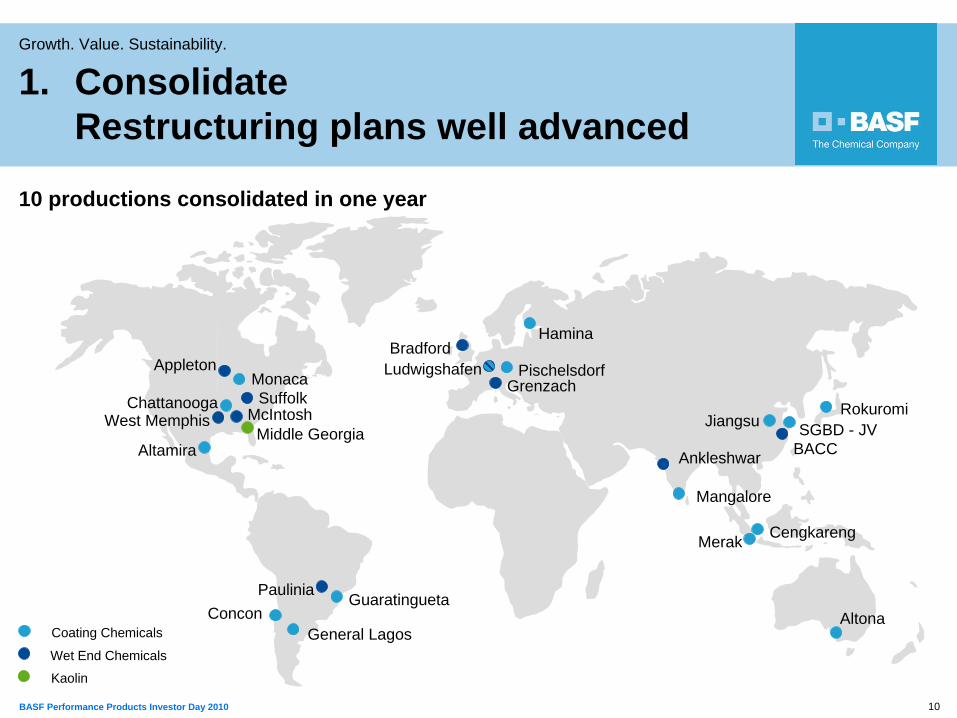
1. Consolidate Restructuring plans well advanced
Ludwigshafen
Jiangsu
Ankleshwar
GrenzachPischelsdorf
Merak
Paulinia
Hamina
BACC
Guaratingueta
Mangalore
Bradford
General Lagos
Cengkareng
Coating Chemicals
Wet End Chemicals
Kaolin
McIntosh
Altamira
AppletonMonaca
Chattanooga SuffolkWest Memphis
Middle Georgia SGBD - JVRokuromi
AltonaConcon
10 productions consolidated in one year
11BASF Performance Products Investor Day 2010
Growth. Value. Sustainability.
11
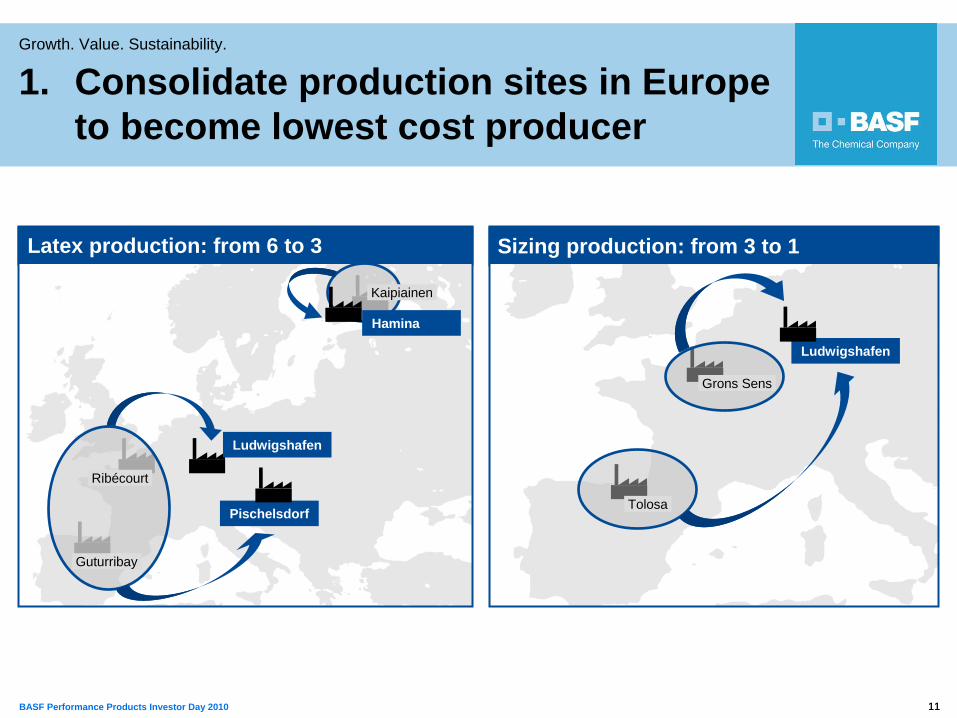
1. Consolidate production sites in Europe to become lowest cost producer
Latex production: from 6 to 3 Sizing production: from 3 to 1
Ludwigshafen
Grons Sens
Tolosa
Ludwigshafen
Ribécourt
Pischelsdorf
Kaipiainen
Hamina
Guturribay
12BASF Performance Products Investor Day 2010
Growth. Value. Sustainability.
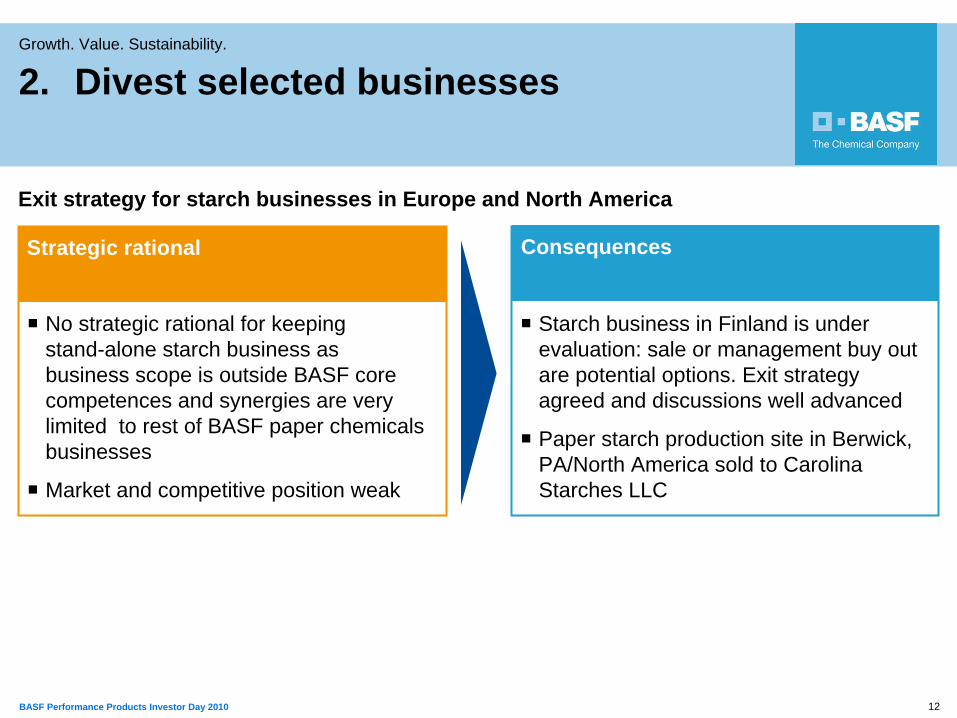
2. Divest selected businesses
No strategic rational for keeping stand-alone starch business as business scope is outside BASF core competences and synergies are very limited to rest of BASF paper chemicals businesses
Market and competitive position weak
Starch business in Finland is under evaluation: sale or management buy out are potential options. Exit strategy agreed and discussions well advanced
Paper starch production site in Berwick, PA/North America sold to Carolina Starches LLC
Strategic rational Consequences
Exit strategy for starch businesses in Europe and North America
13BASF Performance Products Investor Day 2010
Growth. Value. Sustainability.
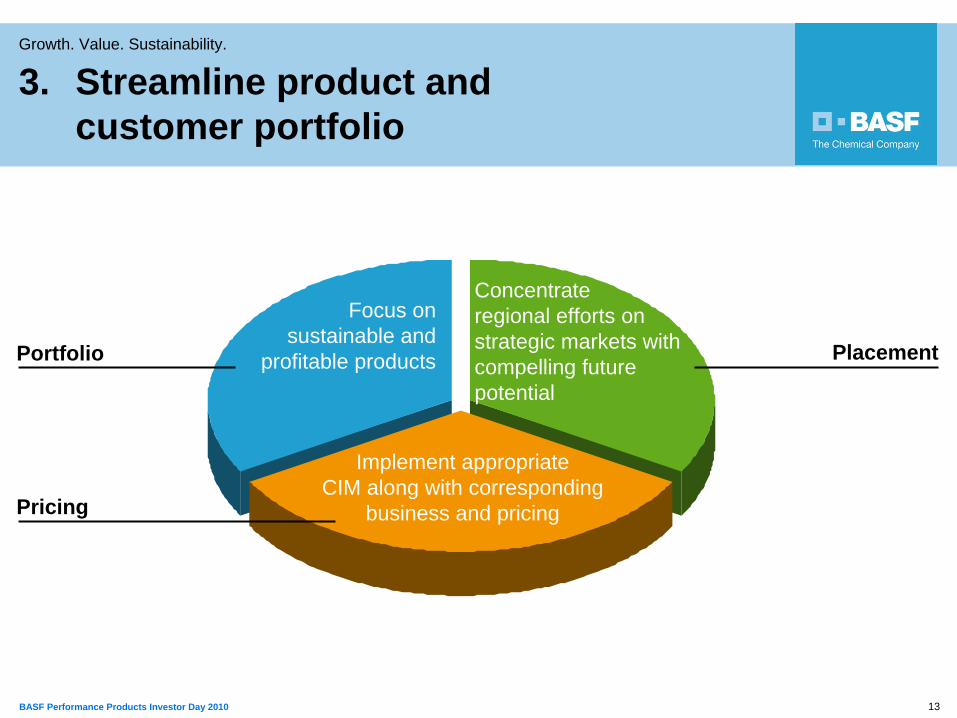
3. Streamline product and customer portfolio
Focus on sustainable and
profitable products
Concentrate regional efforts on strategic markets with compelling future potential
Implement appropriate CIM along with corresponding
business and pricing
Portfolio Placement
Pricing
14BASF Performance Products Investor Day 2010
Growth. Value. Sustainability.
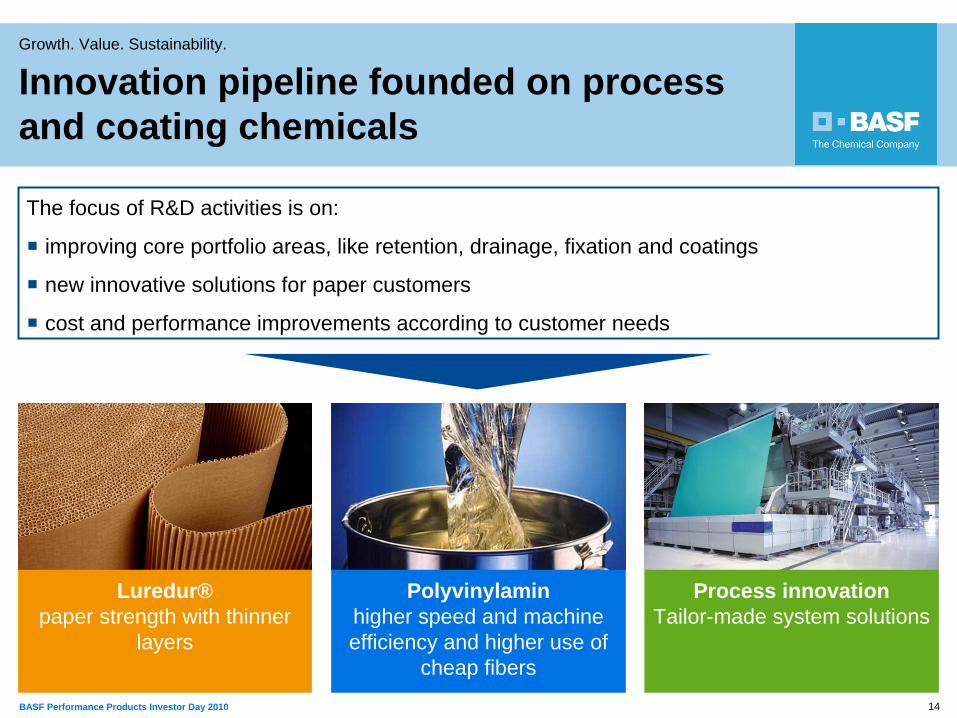
The focus of R&D activities is on:
improving core portfolio areas, like retention, drainage, fixation and coatings
new innovative solutions for paper customers
cost and performance improvements according to customer needs
Luredur® paper strength with thinner
layers
Polyvinylamin higher speed and machine efficiency and higher use of
cheap fibers
Process innovation Tailor-made system solutions
Innovation pipeline founded on process and coating chemicals
15BASF Performance Products Investor Day 2010
Growth. Value. Sustainability.
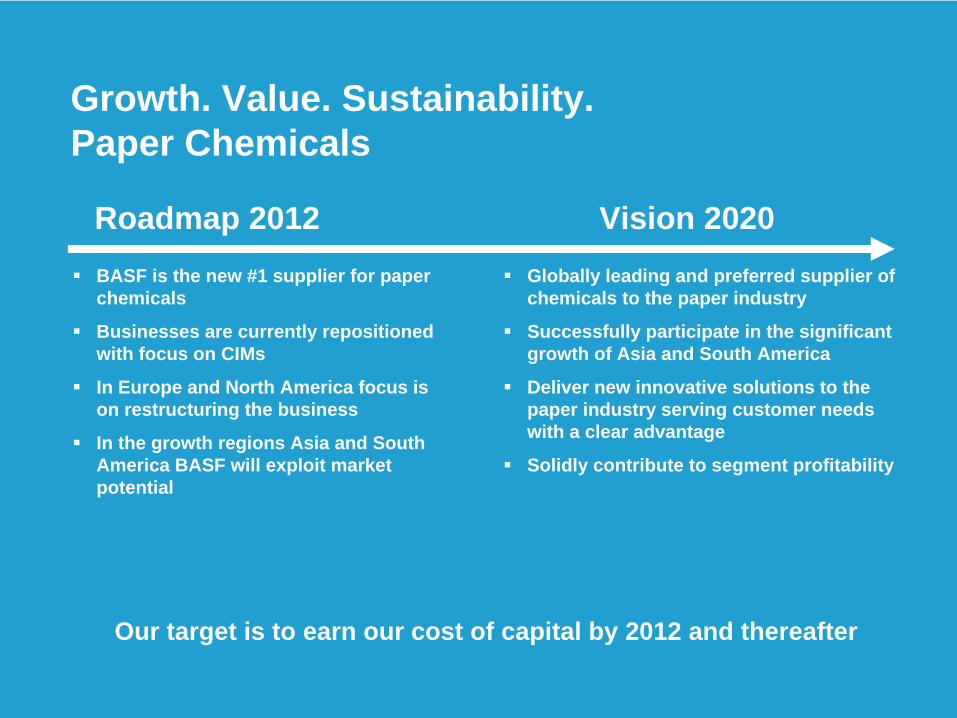
Growth. Value. Sustainability.Paper Chemicals
Globally leading and preferred supplier of chemicals to the paper industry
Successfully participate in the significant growth of Asia and South America
Deliver new innovative solutions to the paper industry serving customer needs with a clear advantage
Solidly contribute to segment profitability
Vision 2020Roadmap 2012BASF is the new #1 supplier for paper chemicals
Businesses are currently repositioned with focus on CIMs
In Europe and North America focus is on restructuring the business
In the growth regions Asia and South America BASF will exploit market potential
Our target is to earn our cost of capital by 2012 and thereafter
1BASF Performance Products Investor Day 2010
Growth. Value. Sustainability.
1 | Dispersions & Pigments Markus Kramer
2 | Paper Chemicals Fred Baumgartner
3 | Performance Chemicals Hans W. Reiners
4 | Care Chemicals Gabriel Tanbourgi
1
2BASF Performance Products Investor Day 2010
Growth. Value. Sustainability.
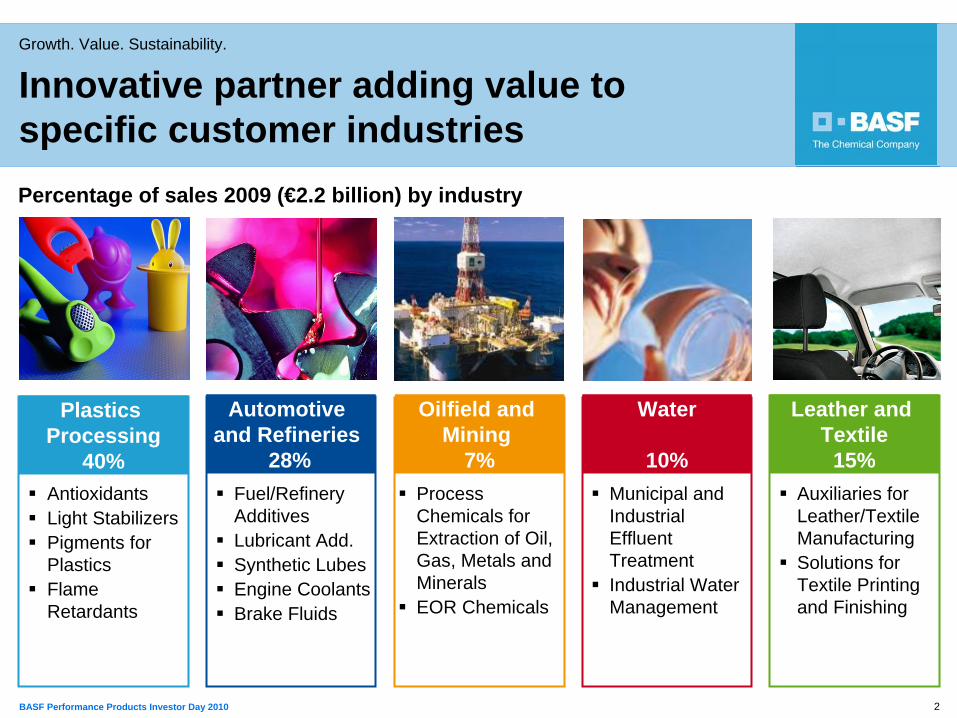
AntioxidantsLight StabilizersPigments for PlasticsFlame Retardants
Process Chemicals for Extraction of Oil, Gas, Metals and Minerals EOR Chemicals
Municipal and Industrial Effluent TreatmentIndustrial Water Management
Auxiliaries for Leather/Textile ManufacturingSolutions for Textile Printing and Finishing
Fuel/Refinery AdditivesLubricant Add.Synthetic LubesEngine CoolantsBrake Fluids
Plastics Processing
40%
Oilfield and Mining
7%
Water
10%
Leather and Textile
15%
Automotive and Refineries
28%
Percentage of sales 2009 (€2.2 billion) by industry
Innovative partner adding value to specific customer industries
3BASF Performance Products Investor Day 2010
Growth. Value. Sustainability.
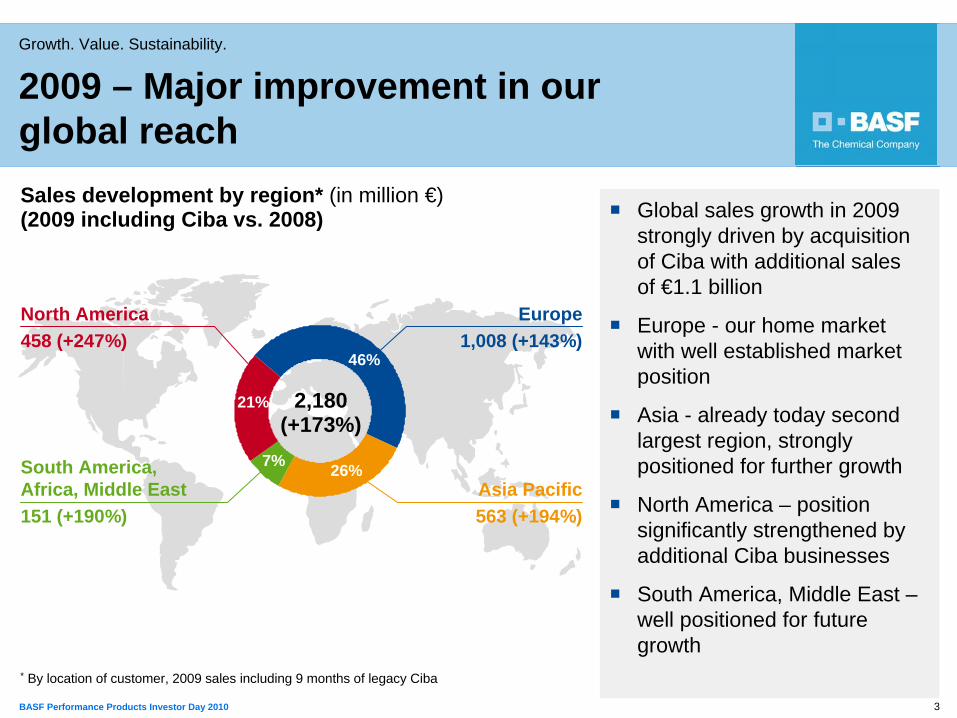
Sales development by region* (in million €) (2009 including Ciba vs. 2008)
* By location of customer, 2009 sales including 9 months of legacy Ciba
Global sales growth in 2009 strongly driven by acquisition of Ciba with additional sales of €1.1 billion
Europe - our home market with well established market position
Asia - already today second largest region, strongly positioned for further growth
North America – position significantly strengthened by additional Ciba businesses
South America, Middle East –well positioned for future growth
North America458 (+247%)
Europe1,008 (+143%)
Asia Pacific563 (+194%)
South America, Africa, Middle East151 (+190%)
2,180(+173%)
46%
26%7%
21%
2009 – Major improvement in our global reach
4BASF Performance Products Investor Day 2010
Growth. Value. Sustainability.
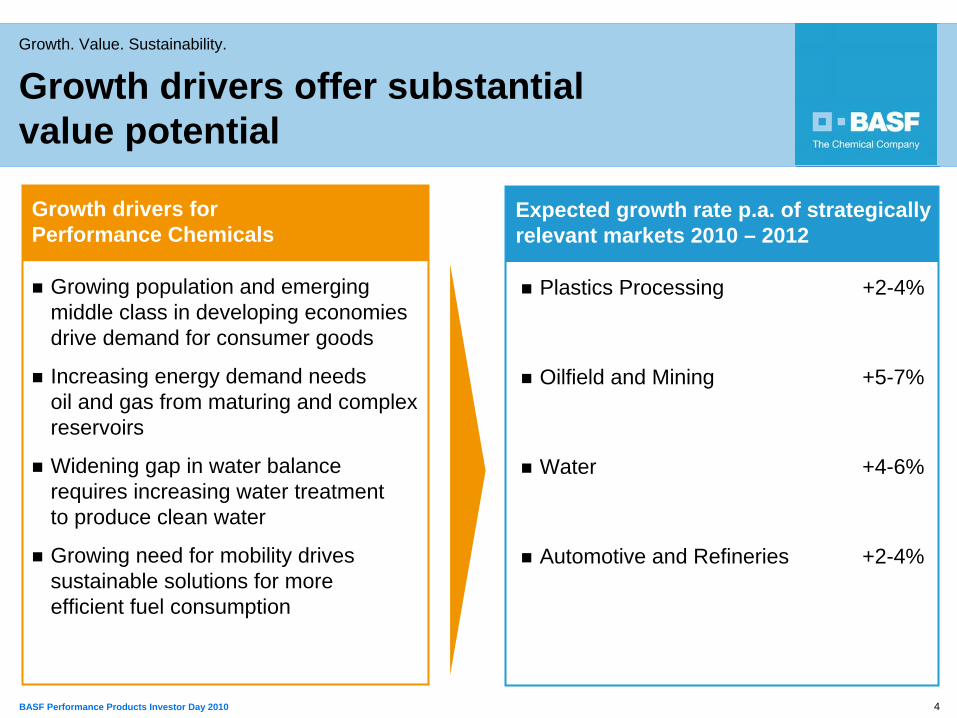
Growth drivers for Performance Chemicals
Growing population and emerging middle class in developing economies drive demand for consumer goods
Increasing energy demand needs oil and gas from maturing and complex reservoirs
Widening gap in water balance requires increasing water treatment to produce clean water
Growing need for mobility drives sustainable solutions for more efficient fuel consumption
Expected growth rate p.a. of strategically relevant markets 2010 – 2012
Plastics Processing +2-4%
Oilfield and Mining +5-7%
Water +4-6%
Automotive and Refineries +2-4%
Growth drivers offer substantial value potential
5BASF Performance Products Investor Day 2010
Growth. Value. Sustainability.
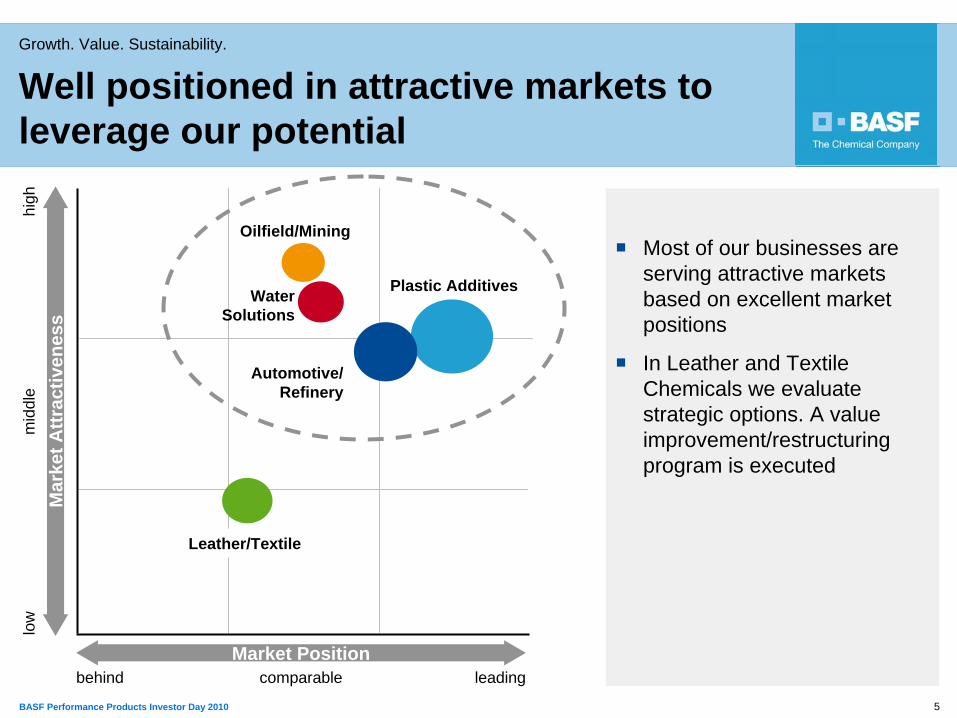
Automotive/ Refinery
Plastic Additives
Leather/Textile
Water Solutions
Oilfield/Mining
Well positioned in attractive markets to leverage our potential
Most of our businesses are serving attractive markets based on excellent market positions
In Leather and Textile Chemicals we evaluate strategic options. A value improvement/restructuring program is executed
low
mid
dle
high
Mar
ket A
ttrac
tiven
ess
leadingcomparablebehindMarket Position
6BASF Performance Products Investor Day 2010
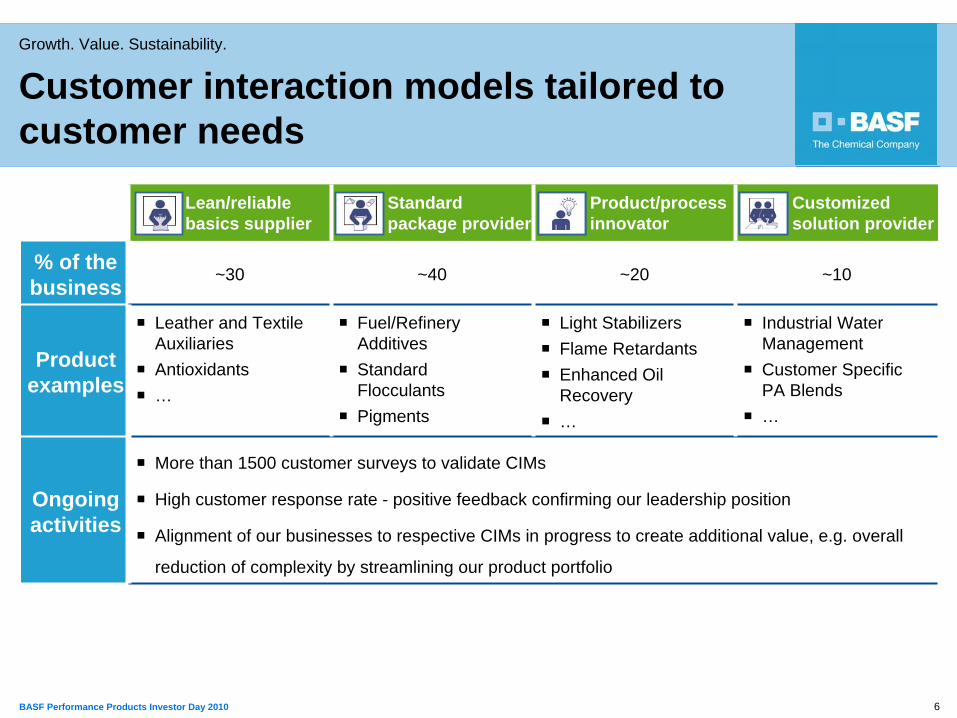
Growth. Value. Sustainability.
Lean/reliable basics supplier
Standard package provider
Product/process innovator
Customized solution provider
% of the business ~30 ~40 ~20 ~10
Product examples
Leather and Textile AuxiliariesAntioxidants…
Fuel/RefineryAdditivesStandard FlocculantsPigments
Light StabilizersFlame RetardantsEnhanced Oil Recovery…
Industrial Water ManagementCustomer SpecificPA Blends…
Ongoing activities
More than 1500 customer surveys to validate CIMs
High customer response rate - positive feedback confirming our leadership position
Alignment of our businesses to respective CIMs in progress to create additional value, e.g. overall
reduction of complexity by streamlining our product portfolio
Customer interaction models tailored to customer needs
7BASF Performance Products Investor Day 2010
Growth. Value. Sustainability.
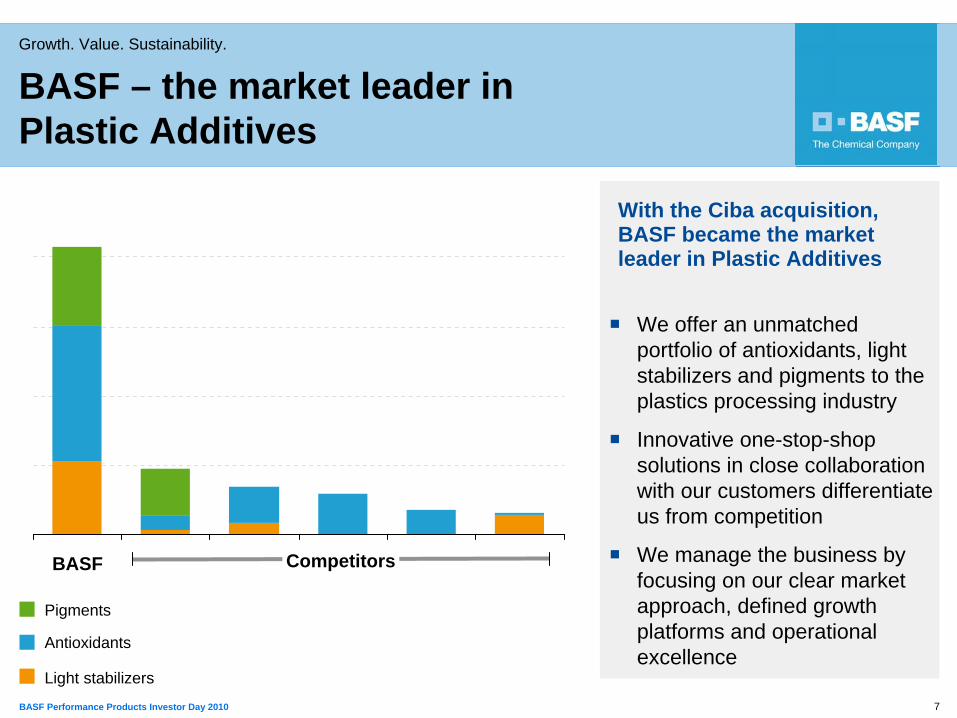
With the Ciba acquisition, BASF became the market leader in Plastic Additives
We offer an unmatched portfolio of antioxidants, light stabilizers and pigments to the plastics processing industry
Innovative one-stop-shop solutions in close collaboration with our customers differentiate us from competition
We manage the business by focusing on our clear market approach, defined growth platforms and operational excellence
BASF – the market leader in Plastic Additives
Pigments
Antioxidants
Light stabilizers
CompetitorsBASF
8BASF Performance Products Investor Day 2010
Growth. Value. Sustainability.
Differential Drive
Weir Plate Bowl Drive
Flocculant Sol.
Sludge Feed
CakeCentrate
Bowl
Scroll
Differential Drive
Weir Plate Bowl Drive
Flocculant Sol.
Sludge Feed
CakeCentrate
Bowl
Scroll
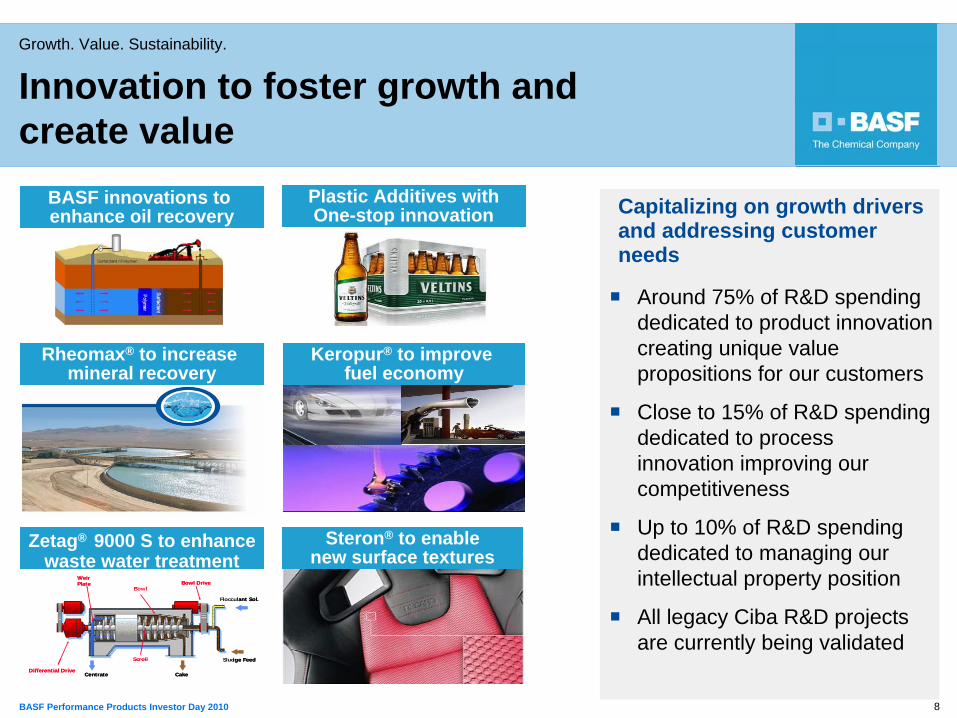
Around 75% of R&D spending dedicated to product innovation creating unique value propositions for our customers
Close to 15% of R&D spending dedicated to process innovation improving our competitiveness
Up to 10% of R&D spending dedicated to managing our intellectual property position
All legacy Ciba R&D projects are currently being validated
Capitalizing on growth drivers and addressing customer needs
Plastic Additives withOne-stop innovation
BASF innovations to enhance oil recovery
Rheomax® to increase mineral recovery
Keropur® to improve fuel economy
Zetag® 9000 S to enhancewaste water treatment
Steron® to enablenew surface textures
Innovation to foster growth and create value
9BASF Performance Products Investor Day 2010
Growth. Value. Sustainability.
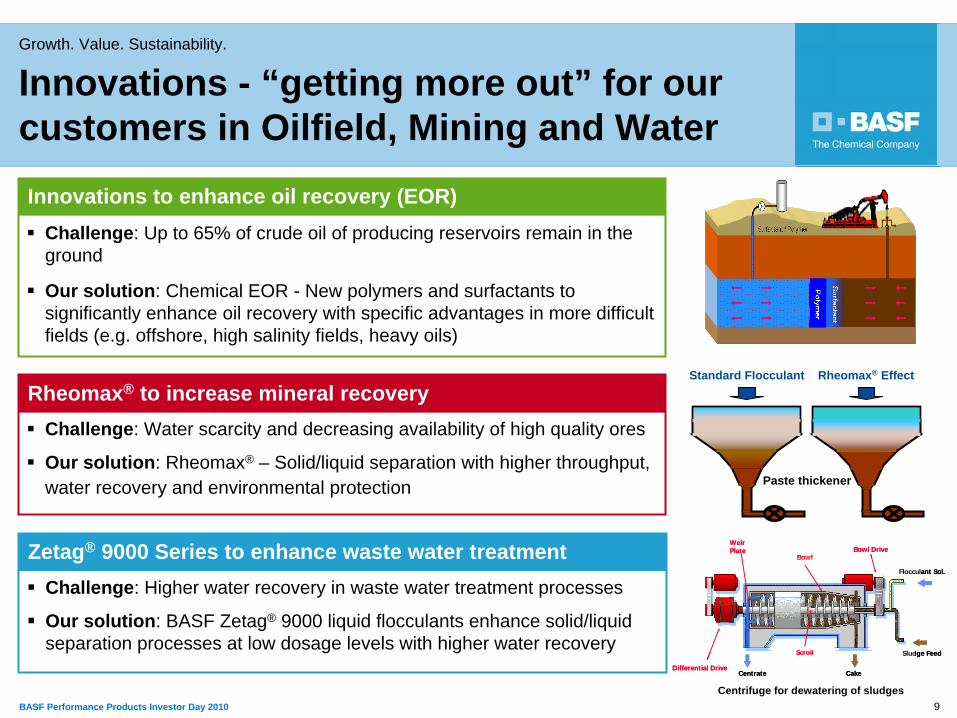
Challenge: Water scarcity and decreasing availability of high quality ores
Our solution: Rheomax® – Solid/liquid separation with higher throughput, water recovery and environmental protection
Challenge: Up to 65% of crude oil of producing reservoirs remain in the ground
Our solution: Chemical EOR - New polymers and surfactants to significantly enhance oil recovery with specific advantages in more difficult fields (e.g. offshore, high salinity fields, heavy oils)
Innovations to enhance oil recovery (EOR)
Rheomax® to increase mineral recovery
Innovations - “getting more out” for our customers in Oilfield, Mining and Water
Standard Flocculant Rheomax® Effect
Paste thickener
Differential Drive
Weir Plate Bowl Drive
Flocculant Sol.
Sludge Feed
CakeCentrate
Bowl
Scroll
Differential Drive
Weir Plate Bowl Drive
Flocculant Sol.
Sludge Feed
CakeCentrate
Bowl
Scroll
Centrifuge for dewatering of sludges
Challenge: Higher water recovery in waste water treatment processes
Our solution: BASF Zetag® 9000 liquid flocculants enhance solid/liquid separation processes at low dosage levels with higher water recovery
Zetag® 9000 Series to enhance waste water treatment
10BASF Performance Products Investor Day 2010
Growth. Value. Sustainability.
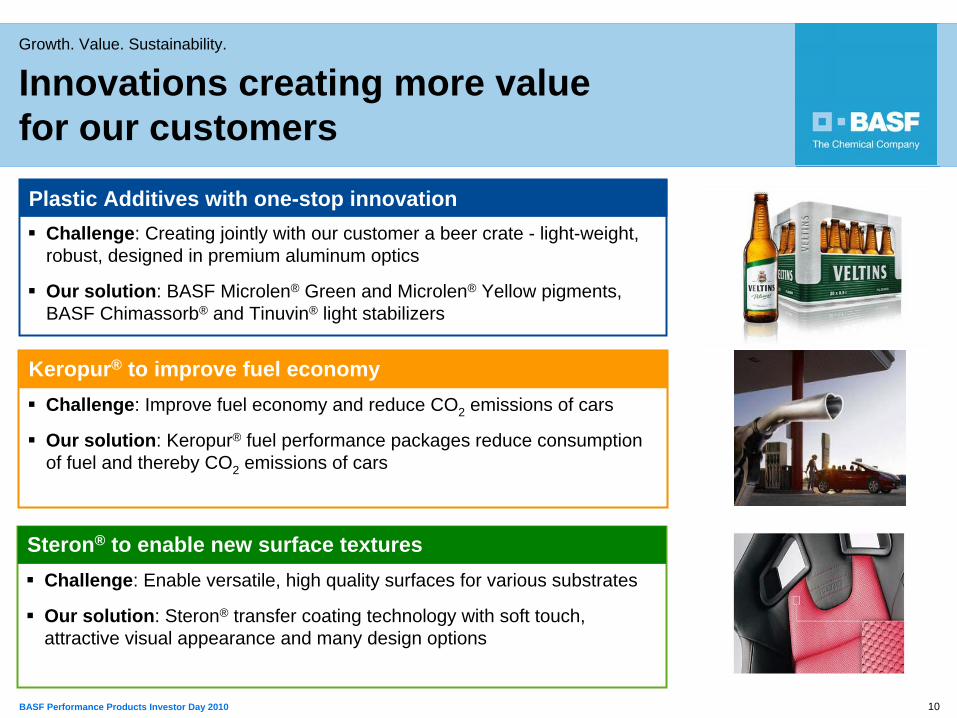
Challenge: Improve fuel economy and reduce CO2 emissions of cars
Our solution: Keropur® fuel performance packages reduce consumption of fuel and thereby CO2 emissions of cars
Keropur® to improve fuel economy
Plastic Additives with one-stop innovationChallenge: Creating jointly with our customer a beer crate - light-weight, robust, designed in premium aluminum optics
Our solution: BASF Microlen® Green and Microlen® Yellow pigments, BASF Chimassorb® and Tinuvin® light stabilizers
Innovations creating more value for our customers
Challenge: Enable versatile, high quality surfaces for various substrates
Our solution: Steron® transfer coating technology with soft touch, attractive visual appearance and many design options
Steron® to enable new surface textures
11BASF Performance Products Investor Day 2010
Growth. Value. Sustainability.
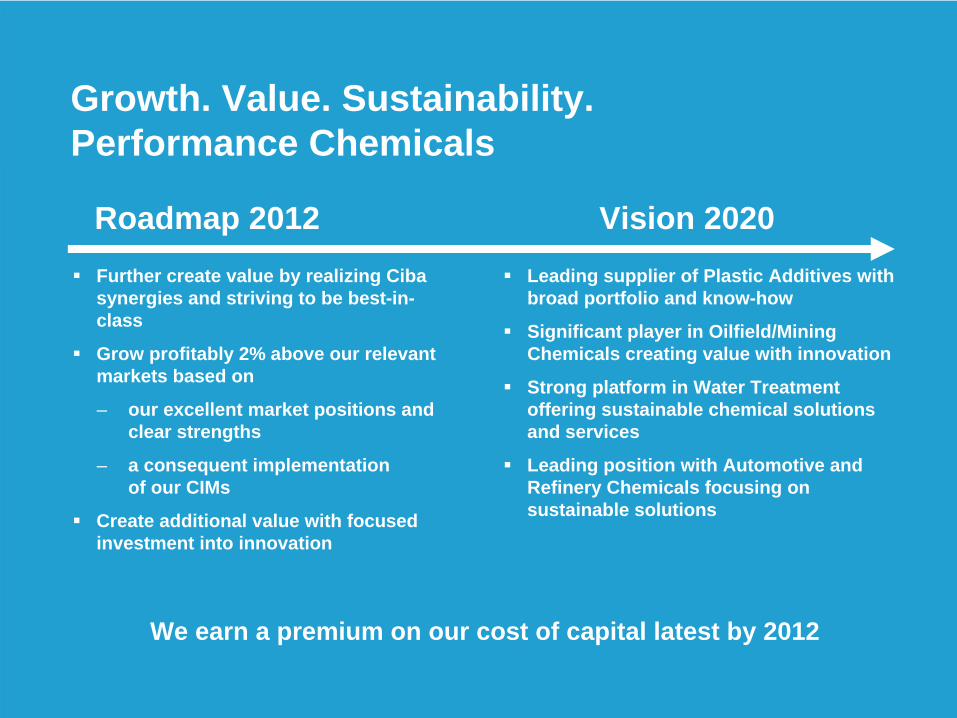
Growth. Value. Sustainability.Performance Chemicals
Leading supplier of Plastic Additives with broad portfolio and know-how
Significant player in Oilfield/Mining Chemicals creating value with innovation
Strong platform in Water Treatment offering sustainable chemical solutions and services
Leading position with Automotive and Refinery Chemicals focusing on sustainable solutions
Vision 2020Roadmap 2012Further create value by realizing Ciba synergies and striving to be best-in-class
Grow profitably 2% above our relevant markets based on
– our excellent market positions and clear strengths
– a consequent implementation of our CIMs
Create additional value with focused investment into innovation
We earn a premium on our cost of capital latest by 2012
1BASF Performance Products Investor Day 2010
Growth. Value. Sustainability.
1 | Dispersions & Pigments Markus Kramer
2 | Paper Chemicals Fred Baumgartner
3 | Performance Chemicals Hans W. Reiners
4 | Care Chemicals Gabriel Tanbourgi
1
2BASF Performance Products Investor Day 2010
Growth. Value. Sustainability.
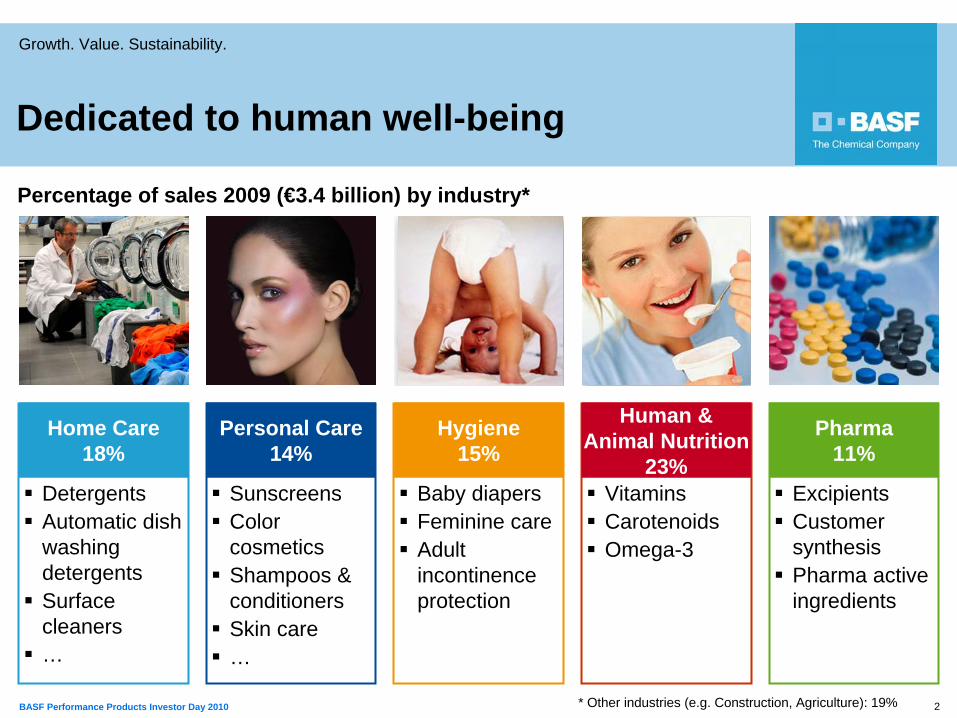
Percentage of sales 2009 (€3.4 billion) by industry*
VitaminsCarotenoidsOmega-3
Human & Animal Nutrition
23%Baby diapersFeminine careAdult incontinence protection
Hygiene15%
SunscreensColor cosmeticsShampoos & conditionersSkin care…
Personal Care14%
ExcipientsCustomer synthesisPharma active ingredients
Pharma11%
DetergentsAutomatic dish washing detergentsSurface cleaners…
Home Care18%
* Other industries (e.g. Construction, Agriculture): 19%
Dedicated to human well-being
3BASF Performance Products Investor Day 2010
Growth. Value. Sustainability.
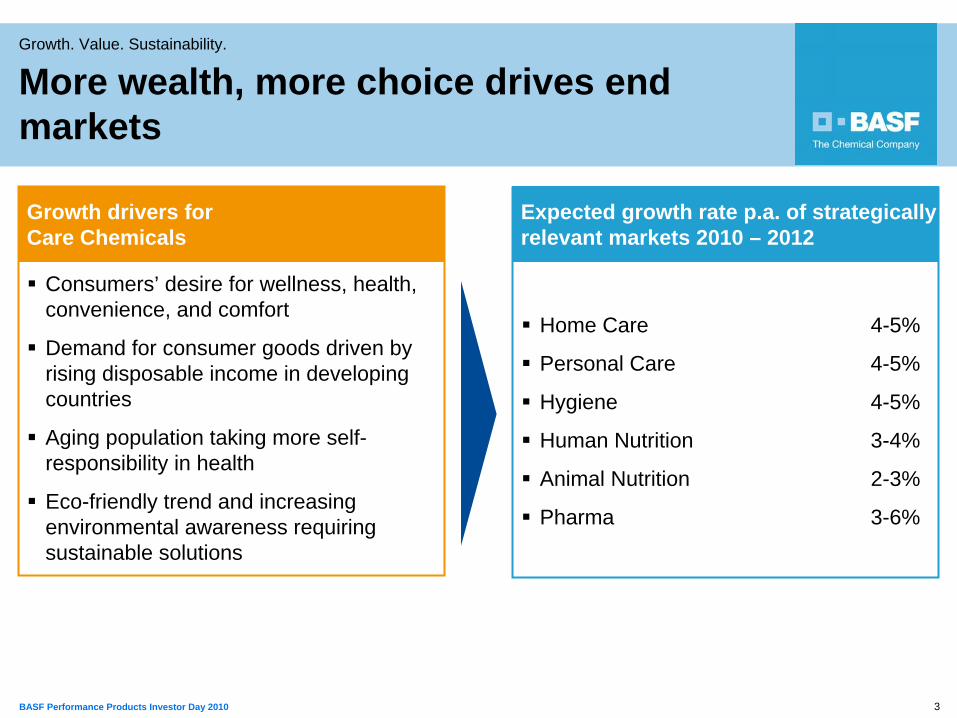
Growth drivers for Care Chemicals
Expected growth rate p.a. of strategically relevant markets 2010 – 2012
More wealth, more choice drives end markets
Consumers’ desire for wellness, health, convenience, and comfort
Demand for consumer goods driven by rising disposable income in developing countries
Aging population taking more self-responsibility in health
Eco-friendly trend and increasing environmental awareness requiring sustainable solutions
Home Care 4-5%
Personal Care 4-5%
Hygiene 4-5%
Human Nutrition 3-4%
Animal Nutrition 2-3%
Pharma 3-6%
4BASF Performance Products Investor Day 2010
Growth. Value. Sustainability.
Sales development by region* (in million €) 2009 vs. 2008
* By location of customer, 2009 sales including 9 months of legacy Ciba
25%
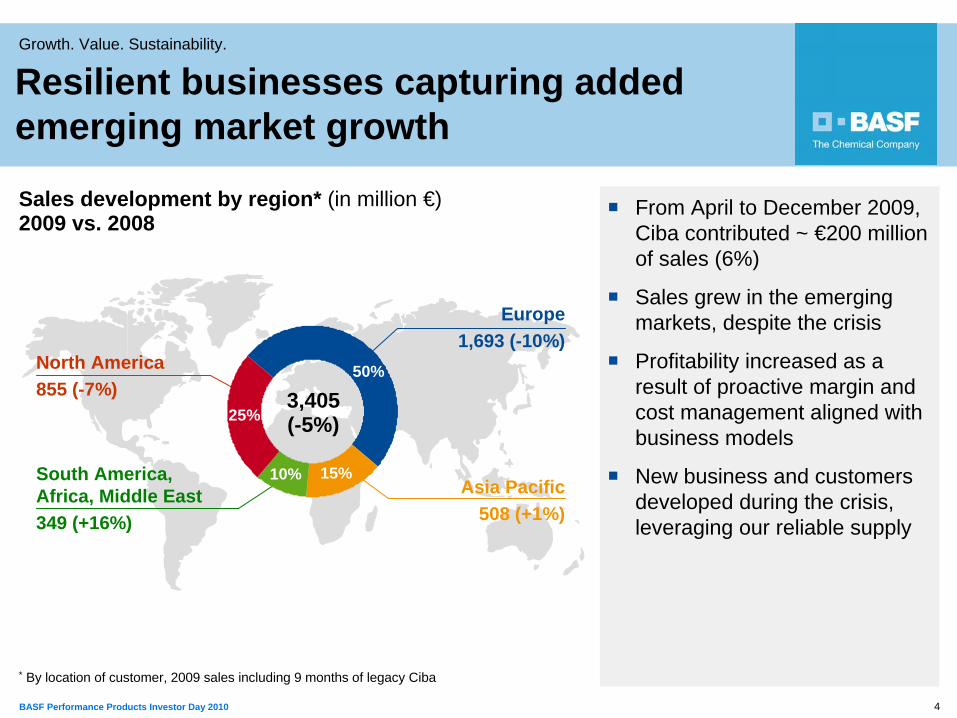
From April to December 2009, Ciba contributed ~ €200 million of sales (6%)
Sales grew in the emerging markets, despite the crisis
Profitability increased as a result of proactive margin and cost management aligned with business models
New business and customers developed during the crisis, leveraging our reliable supply
Resilient businesses capturing added emerging market growth
North America855 (-7%)
Europe1,693 (-10%)
Asia Pacific508 (+1%)
South America, Africa, Middle East349 (+16%)
50%
15%10%
25%3,405(-5%)
5BASF Performance Products Investor Day 2010
Growth. Value. Sustainability.
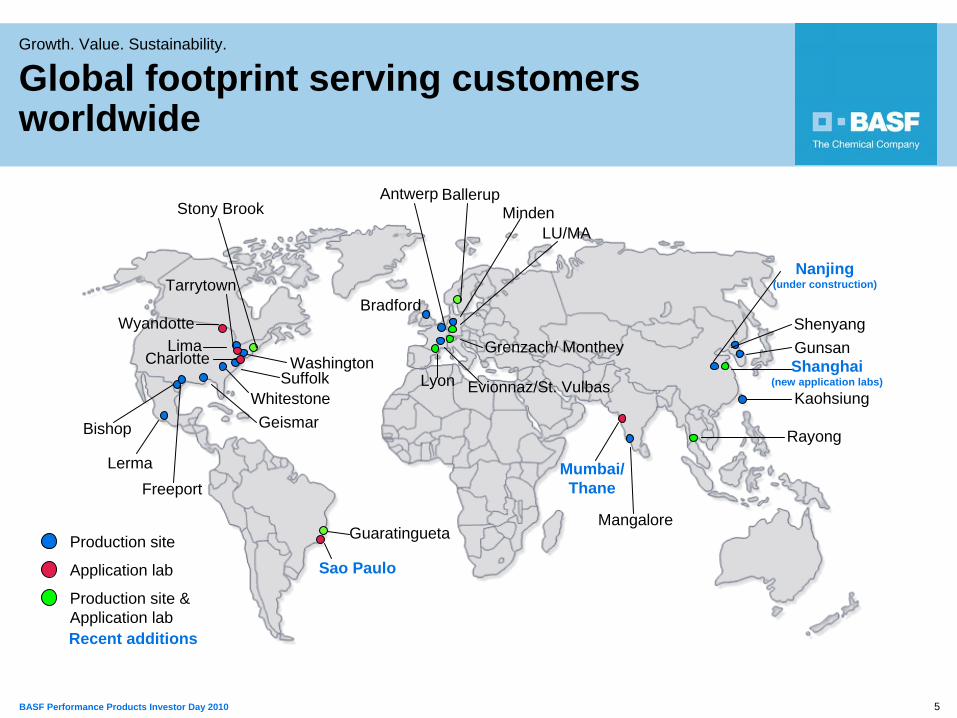
Global footprint serving customers worldwide
AntwerpMinden
Shenyang
Rayong
LU/MA
Ballerup
Lyon
Bradford
Grenzach/ Monthey
Evionnaz/St. Vulbas
Bishop Geismar
LimaWashington
SuffolkWhitestone
Stony Brook
Freeport
Production site
Application lab
Production site & Application lab
Mumbai/Thane
Tarrytown
Wyandotte
Sao Paulo
Nanjing(under construction)
GunsanShanghai
(new application labs)Kaohsiung
Guaratingueta
Lerma
Mangalore
Recent additions
Charlotte
6BASF Performance Products Investor Day 2010
Growth. Value. Sustainability.
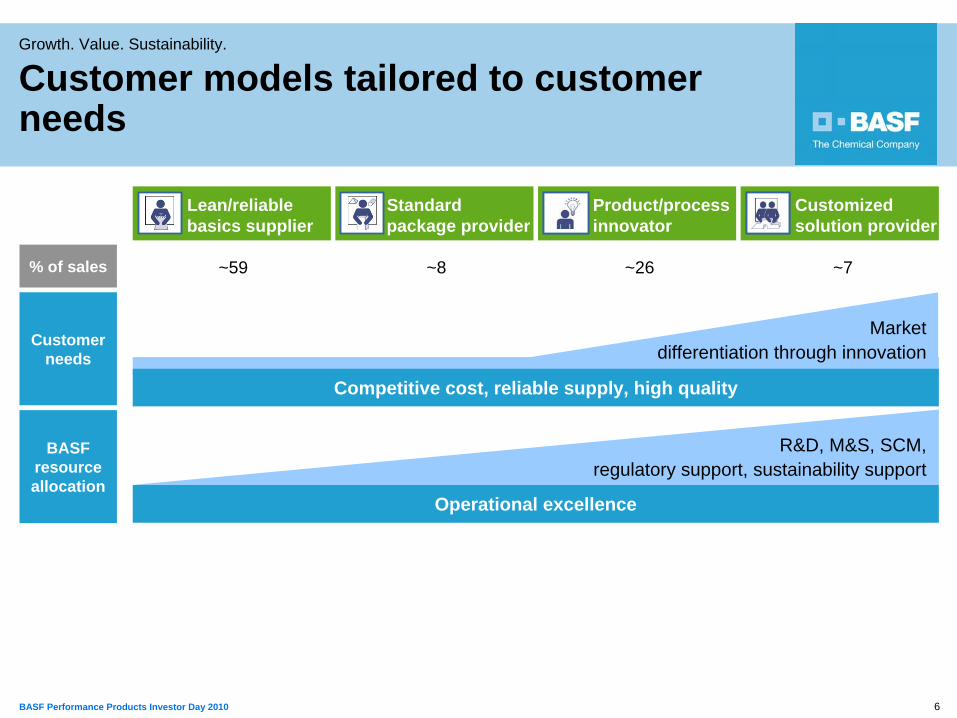
Customer models tailored to customer needs
Customized solution provider
Product/process innovator
Standard package provider
Lean/reliable basics supplier
% of sales ~59 ~8 ~26 ~7
R&D, M&S, SCM, regulatory support, sustainability support
Marketdifferentiation through innovation
Competitive cost, reliable supply, high quality
Operational excellence
Customer needs
BASF resource allocation
7BASF Performance Products Investor Day 2010
Growth. Value. Sustainability.
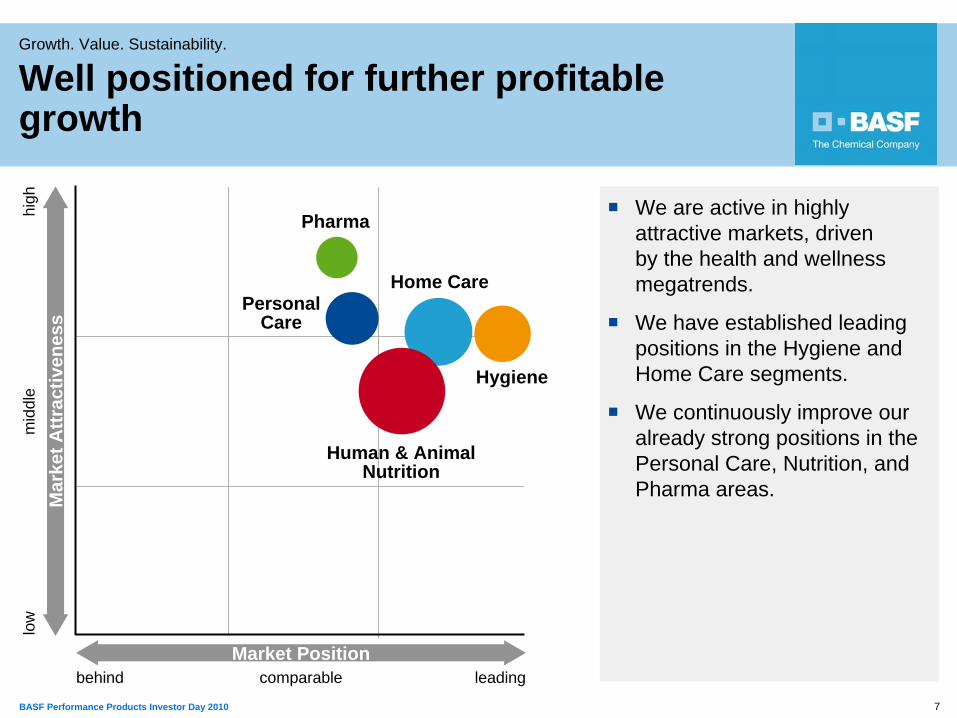
We are active in highly attractive markets, driven by the health and wellness megatrends.
We have established leading positions in the Hygiene and Home Care segments.
We continuously improve our already strong positions in the Personal Care, Nutrition, and Pharma areas.
Well positioned for further profitable growth
low
mid
dle
high
leadingcomparablebehind
Home CarePersonal
Care
Human & Animal Nutrition
Hygiene
Pharma
Mar
ket A
ttrac
tiven
ess
Market Position
8BASF Performance Products Investor Day 2010
Growth. Value. Sustainability.
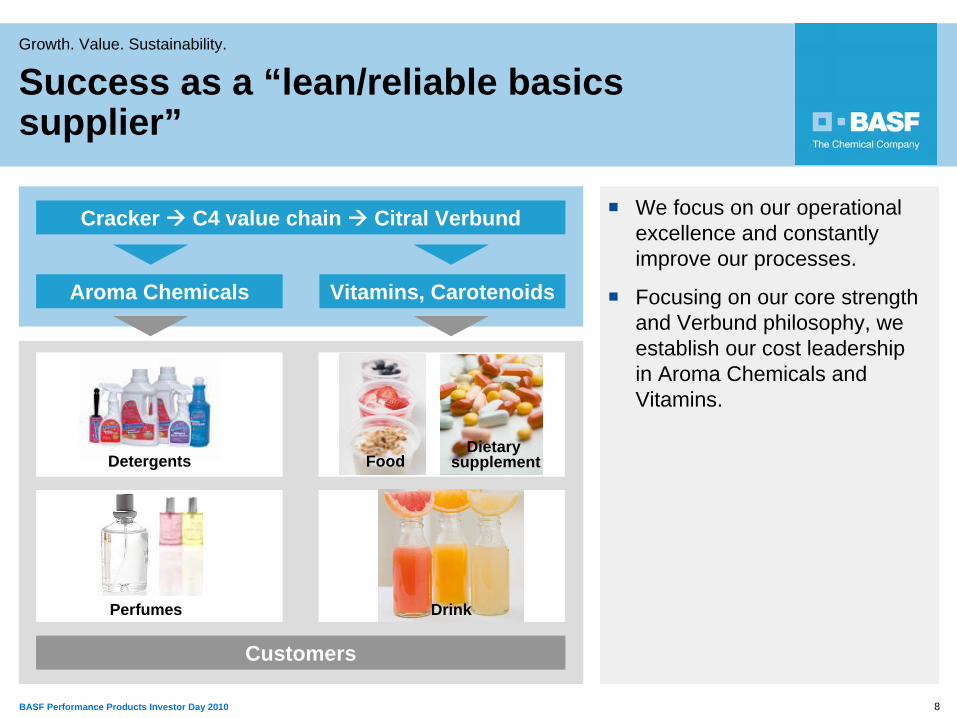
We focus on our operational excellence and constantly improve our processes.
Focusing on our core strength and Verbund philosophy, we establish our cost leadership in Aroma Chemicals and Vitamins.
Success as a “lean/reliable basics supplier”
Customers
Perfumes Drink
FoodDietary
supplement
Aroma Chemicals Vitamins, Carotenoids
Cracker C4 value chain Citral Verbund
Detergents
9BASF Performance Products Investor Day 2010
Growth. Value. Sustainability.
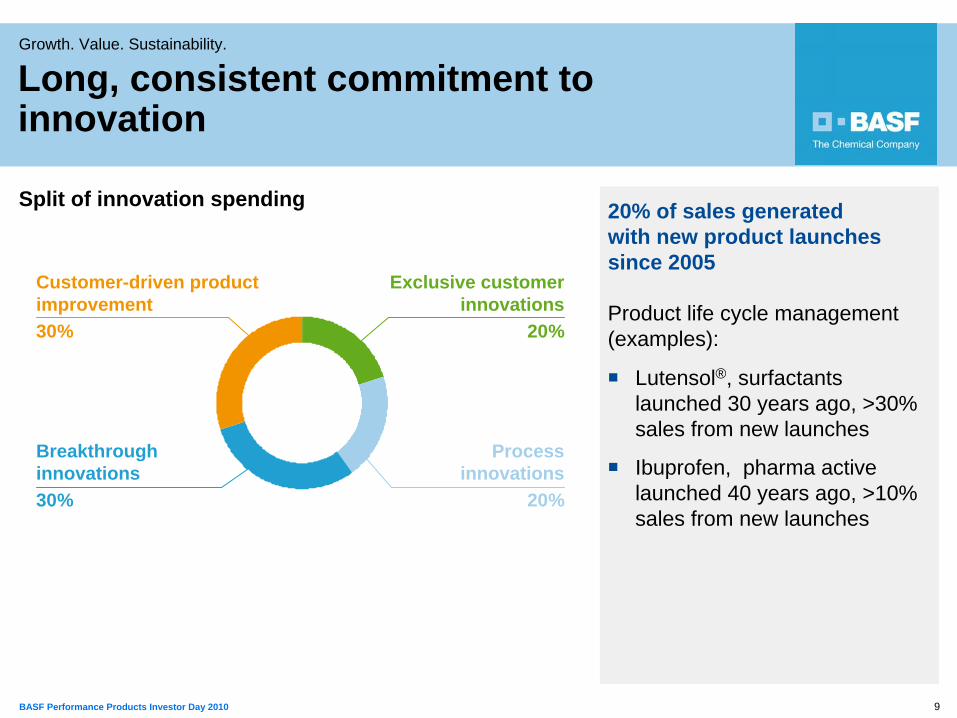
Long, consistent commitment to innovation
Lutensol®, surfactants launched 30 years ago, >30% sales from new launches
Ibuprofen, pharma active launched 40 years ago, >10% sales from new launches
Split of innovation spending
20%
30%
Customer-driven product improvement30%
Exclusive customer innovations
20%
Breakthrough innovations30%
Process innovations
20%
20% of sales generated with new product launches since 2005
Product life cycle management (examples):
10BASF Performance Products Investor Day 2010
Growth. Value. Sustainability.
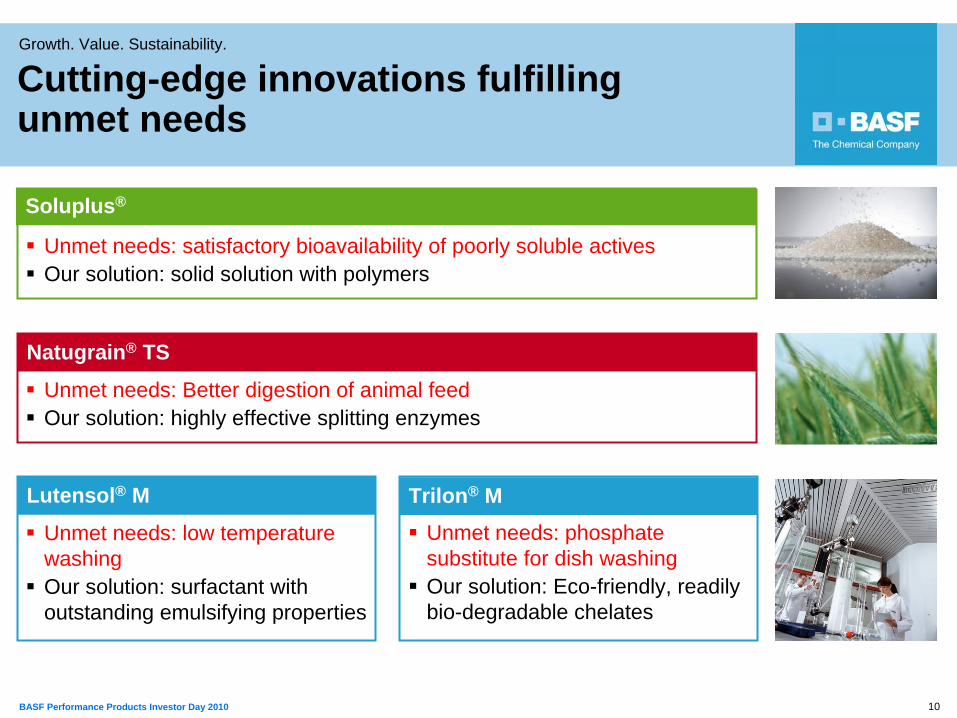
Unmet needs: satisfactory bioavailability of poorly soluble activesOur solution: solid solution with polymers
Soluplus®
Unmet needs: low temperature washingOur solution: surfactant with outstanding emulsifying properties
Lutensol® M
Cutting-edge innovations fulfilling unmet needs
Unmet needs: Better digestion of animal feedOur solution: highly effective splitting enzymes
Natugrain® TS
Unmet needs: phosphate substitute for dish washingOur solution: Eco-friendly, readily bio-degradable chelates
Trilon® M
11BASF Performance Products Investor Day 2010
Growth. Value. Sustainability.
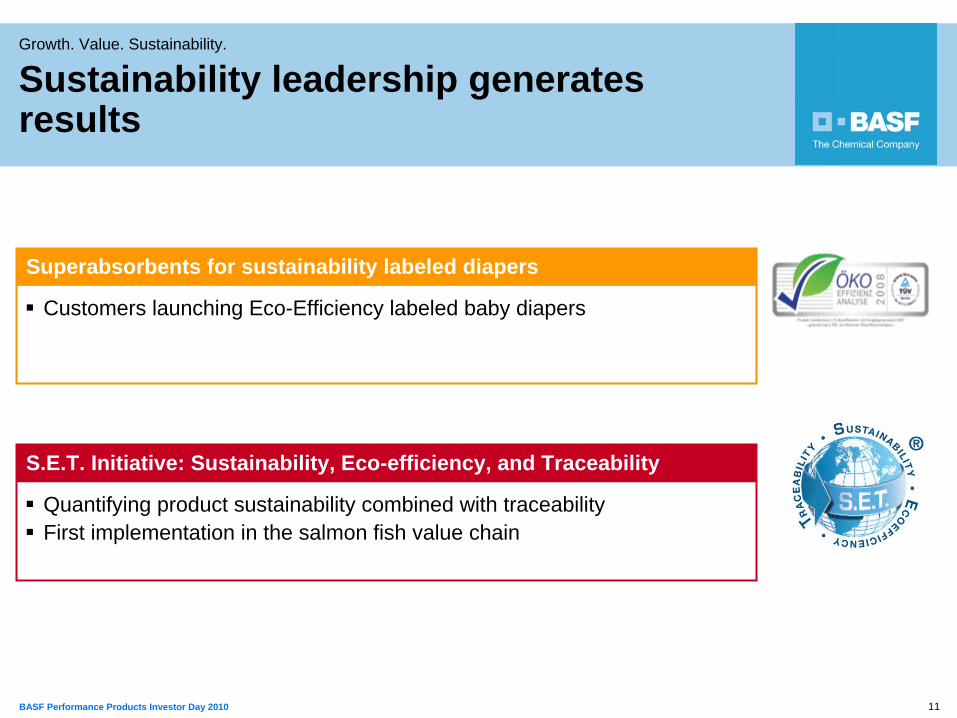
Sustainability leadership generates results
Quantifying product sustainability combined with traceabilityFirst implementation in the salmon fish value chain
S.E.T. Initiative: Sustainability, Eco-efficiency, and Traceability
Customers launching Eco-Efficiency labeled baby diapers
Superabsorbents for sustainability labeled diapers
12BASF Performance Products Investor Day 2010
Growth. Value. Sustainability.
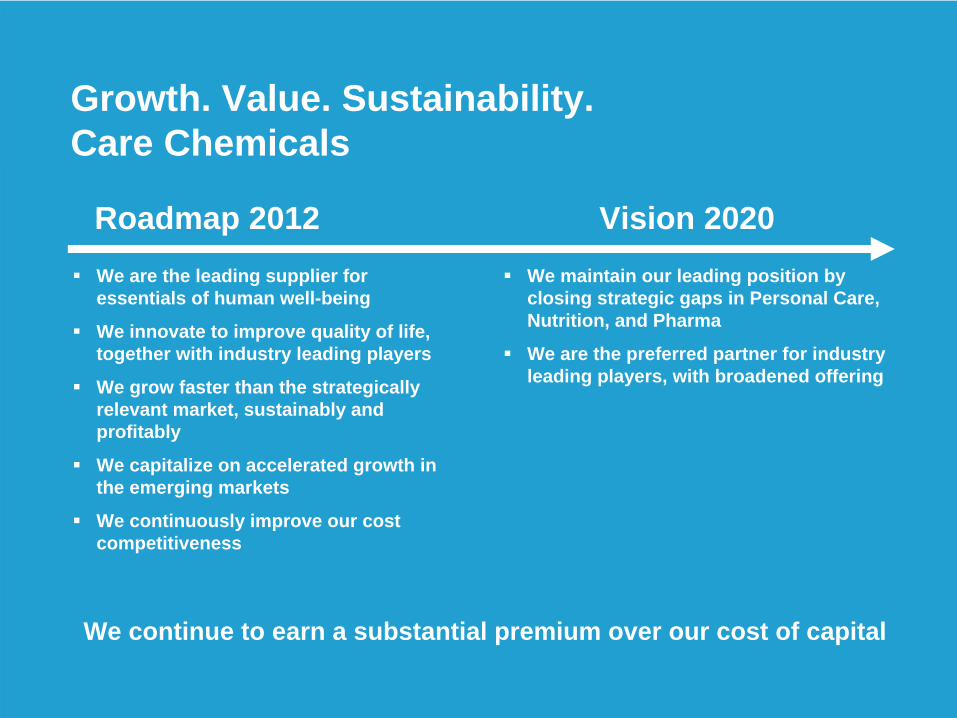
Growth. Value. Sustainability.Care Chemicals
We maintain our leading position by closing strategic gaps in Personal Care, Nutrition, and Pharma
We are the preferred partner for industry leading players, with broadened offering
Vision 2020Roadmap 2012We are the leading supplier for essentials of human well-being
We innovate to improve quality of life, together with industry leading players
We grow faster than the strategically relevant market, sustainably and profitably
We capitalize on accelerated growth in the emerging markets
We continuously improve our cost competitiveness
We continue to earn a substantial premium over our cost of capital