Embed Size (px)
Citation preview
Building Craft Beer Brands: A Talk With Award-Winning Distributors
Moderated By:Kathleen Joyce
National Beer Wholesalers Association@NBWABeer
Who NBWA Represents• 3,300 Independent Beer Distributors• 130,000 Beer Distribution Employees• Representing ALL Brands
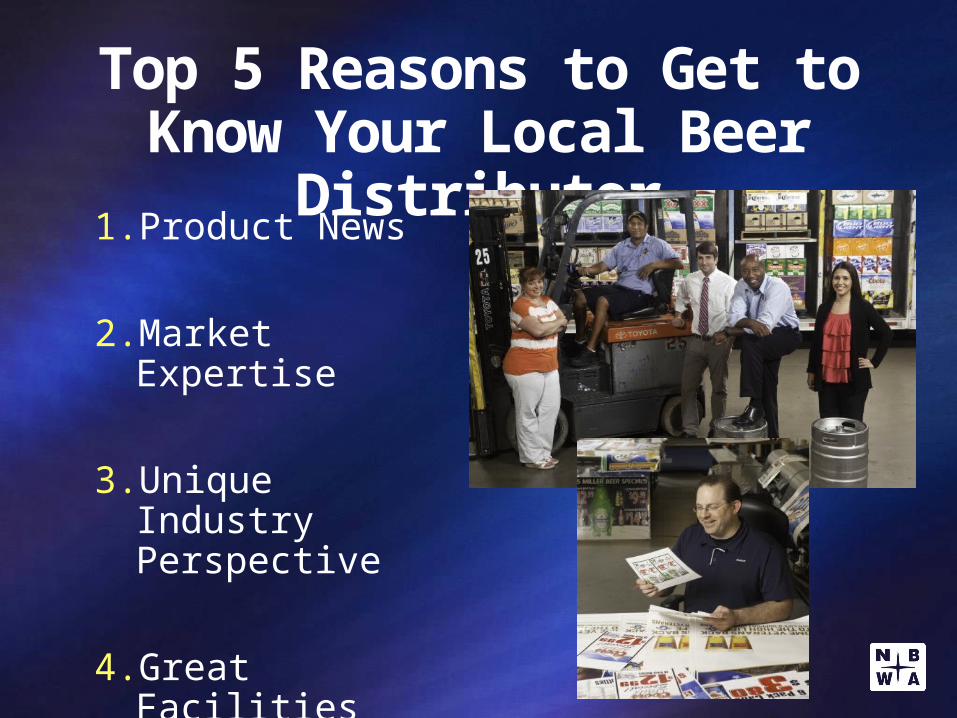
Top 5 Reasons to Get to Know Your Local Beer Distributor
1. Product News
2. Market Expertise
3. Unique Industry Perspective
4. Great Facilities
5. Event Support
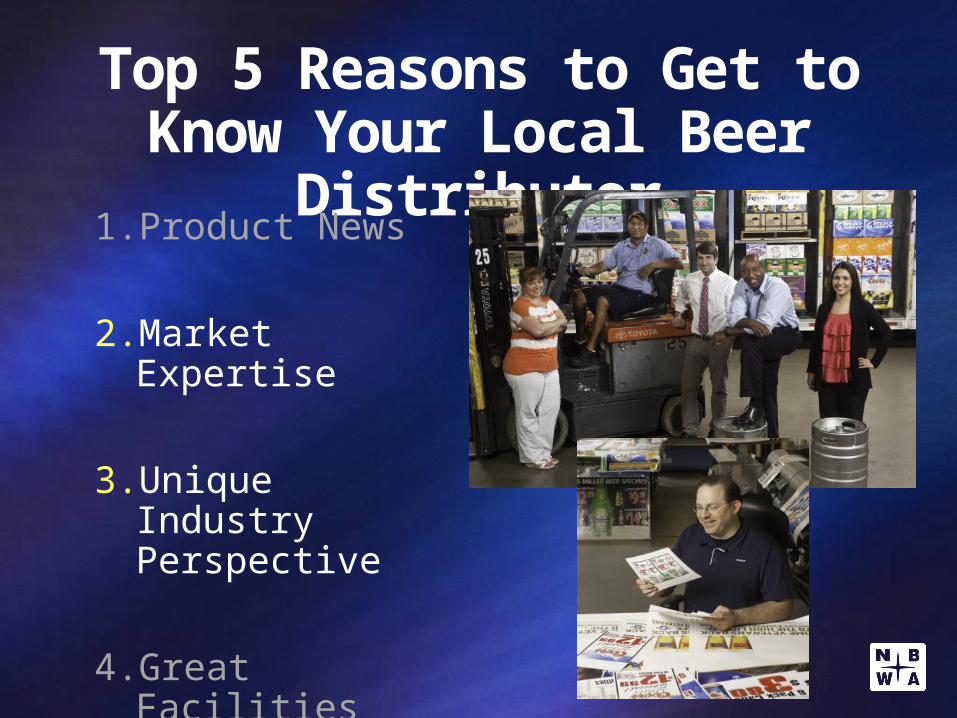
Top 5 Reasons to Get to Know Your Local Beer Distributor
1. Product News
2. Market Expertise
3. Unique Industry Perspective
4. Great Facilities
5. Event Support
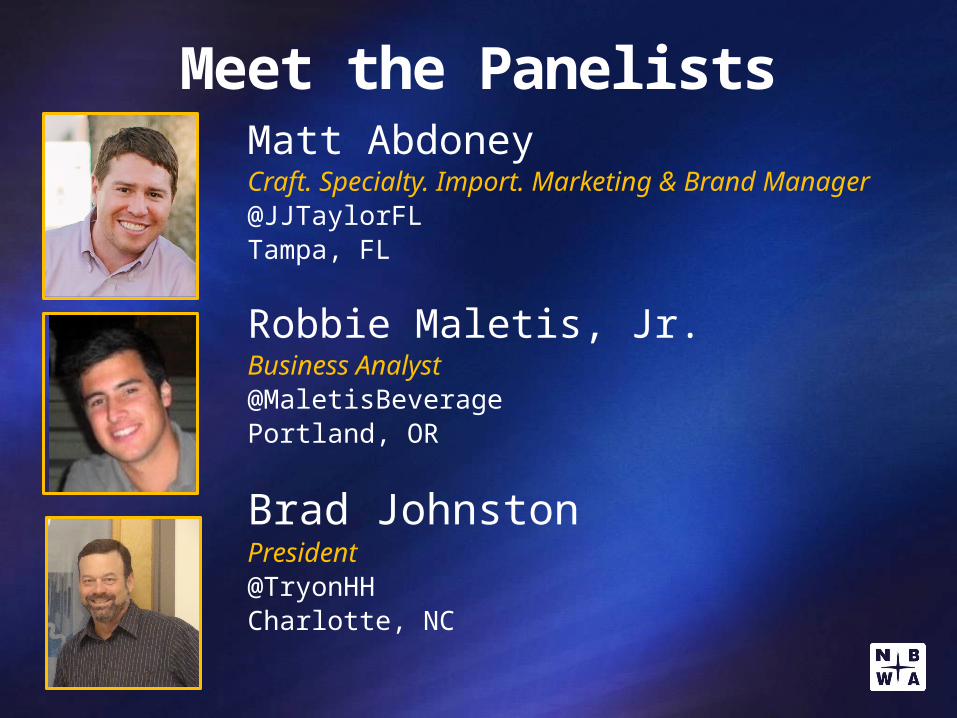
Meet the PanelistsMatt AbdoneyCraft. Specialty. Import. Marketing & Brand Manager@JJTaylorFL Tampa, FL
Robbie Maletis, Jr.Business Analyst@MaletisBeveragePortland, OR
Brad JohnstonPresident@TryonHHCharlotte, NC
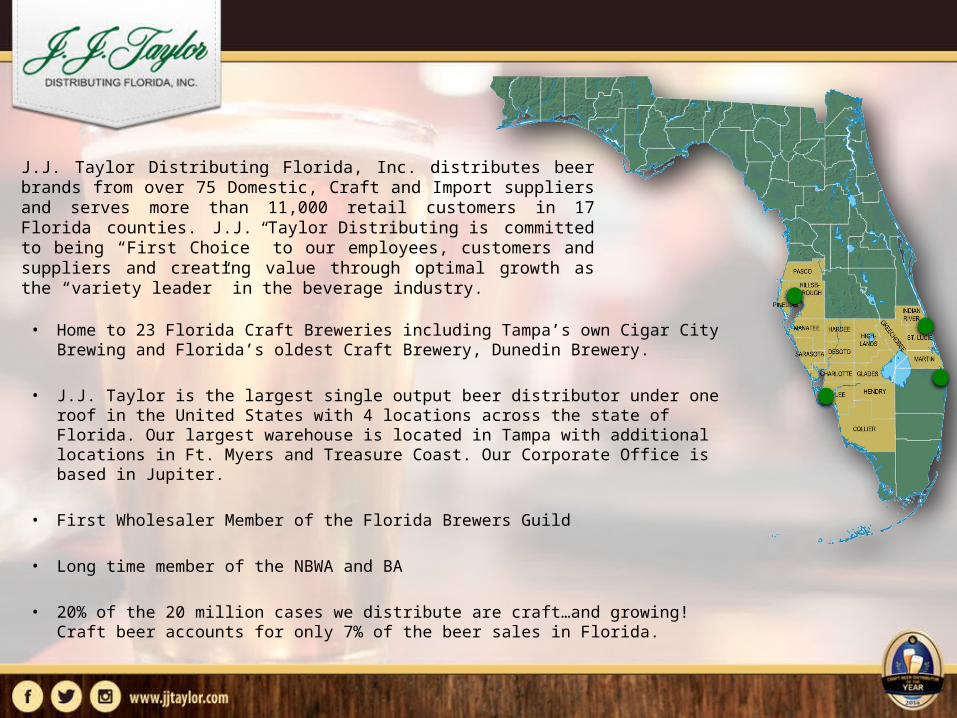
• Home to 23 Florida Craft Breweries including Tampa’s own Cigar City Brewing and Florida’s oldest Craft Brewery, Dunedin Brewery.
• J.J. Taylor is the largest single output beer distributor under one roof in the United States with 4 locations across the state of Florida. Our largest warehouse is located in Tampa with additional locations in Ft. Myers and Treasure Coast. Our Corporate Office is based in Jupiter.
• First Wholesaler Member of the Florida Brewers Guild
• Long time member of the NBWA and BA
• 20% of the 20 million cases we distribute are craft…and growing! Craft beer accounts for only 7% of the beer sales in Florida.
J.J. Taylor Distributing Florida, Inc. distributes beer brands from over 75 Domestic, Craft and Import suppliers and serves more than 11,000 retail customers in 17 Florida counties. J.J. Taylor Distributing is committed to being “First Choice” to our employees, customers and suppliers and creating value through optimal growth as the “variety leader” in the beverage industry.
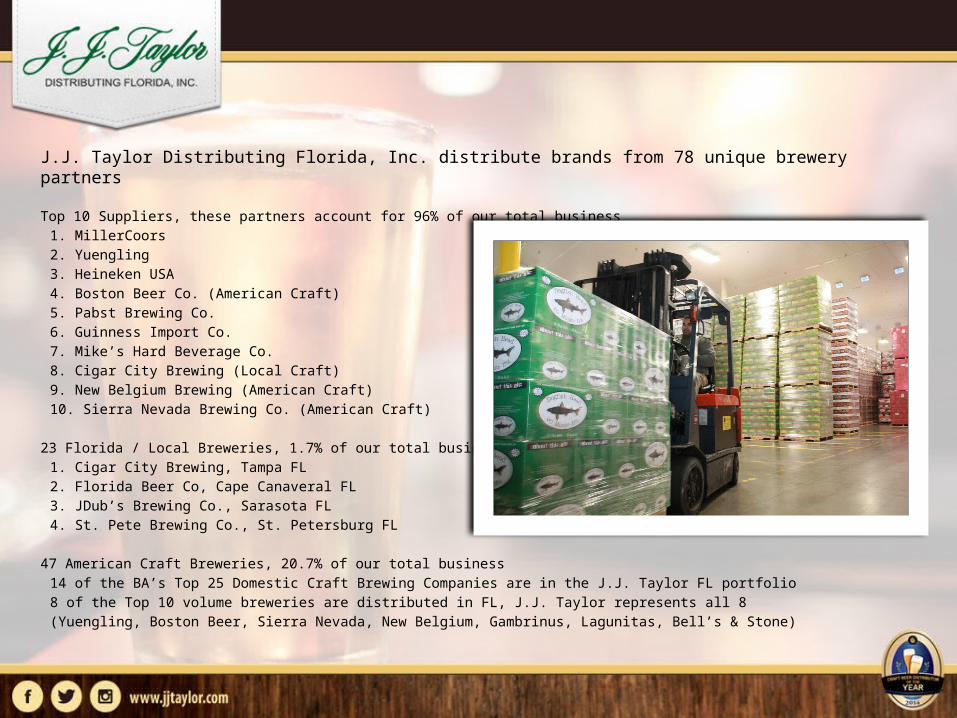
J.J. Taylor Distributing Florida, Inc. distribute brands from 78 unique brewery partners
Top 10 Suppliers, these partners account for 96% of our total business
1. MillerCoors
2. Yuengling
3. Heineken USA
4. Boston Beer Co. (American Craft)
5. Pabst Brewing Co.
6. Guinness Import Co.
7. Mike’s Hard Beverage Co.
8. Cigar City Brewing (Local Craft)
9. New Belgium Brewing (American Craft)
10. Sierra Nevada Brewing Co. (American Craft)
23 Florida / Local Breweries, 1.7% of our total business
1. Cigar City Brewing, Tampa FL
2. Florida Beer Co, Cape Canaveral FL
3. JDub’s Brewing Co., Sarasota FL
4. St. Pete Brewing Co., St. Petersburg FL
47 American Craft Breweries, 20.7% of our total business
14 of the BA’s Top 25 Domestic Craft Brewing Companies are in the J.J. Taylor FL portfolio
8 of the Top 10 volume breweries are distributed in FL, J.J. Taylor represents all 8
(Yuengling, Boston Beer, Sierra Nevada, New Belgium, Gambrinus, Lagunitas, Bell’s & Stone)
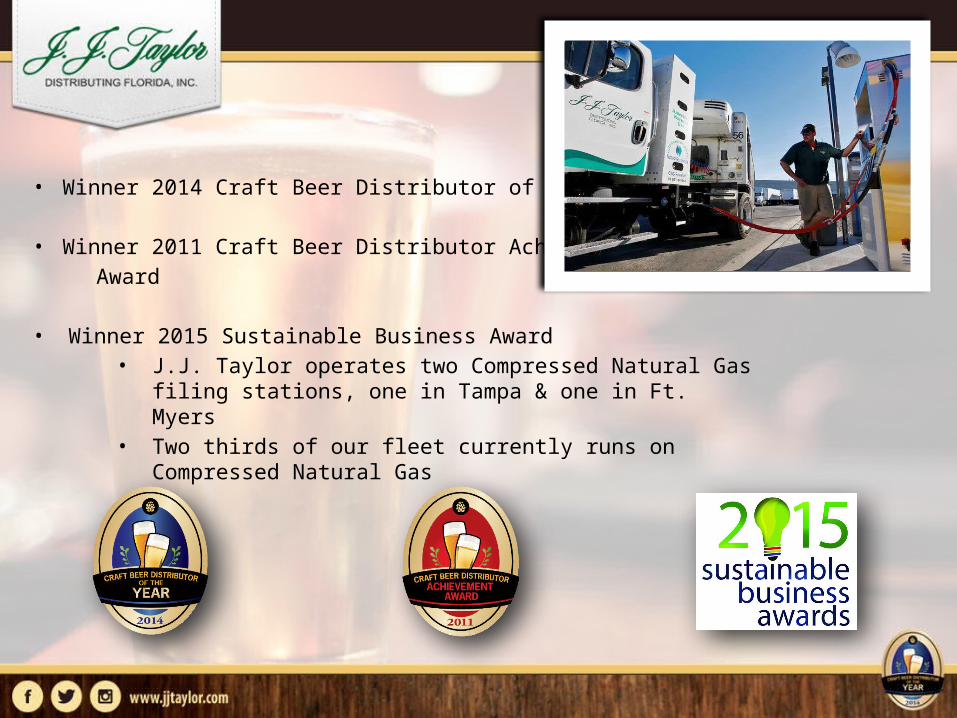
• Winner 2014 Craft Beer Distributor of the Year
• Winner 2011 Craft Beer Distributor Achievement
Award
• Winner 2015 Sustainable Business Award• J.J. Taylor operates two Compressed Natural Gas filing stations,
one in Tampa & one in Ft. Myers• Two thirds of our fleet currently runs on Compressed Natural
Gas
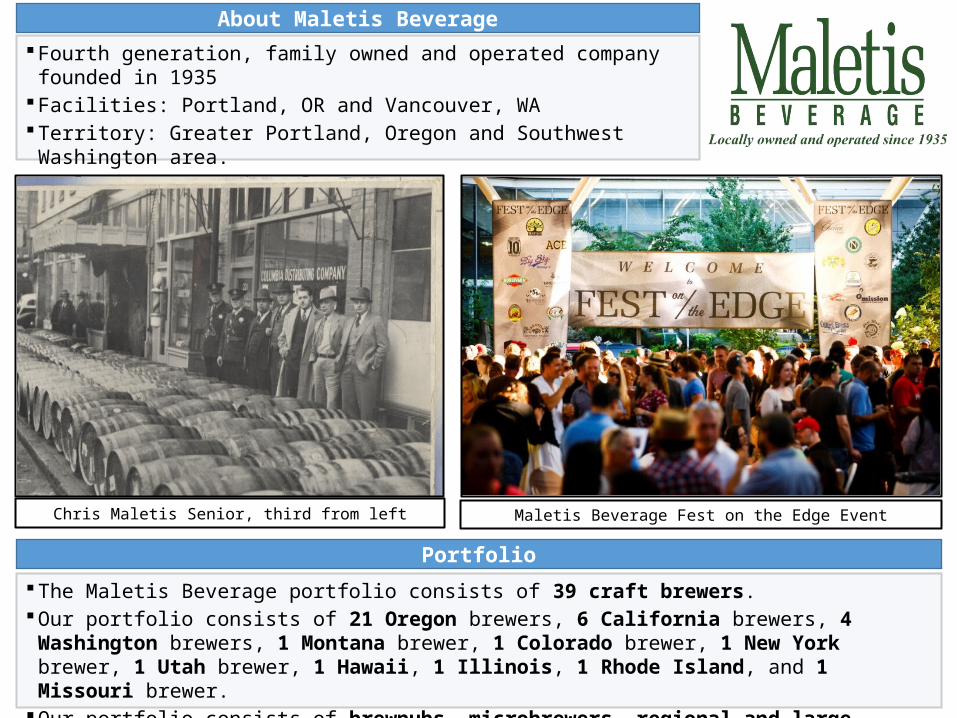
Fourth generation, family owned and operated company founded in 1935Facilities: Portland, OR and Vancouver, WATerritory: Greater Portland, Oregon and Southwest Washington area.Employees: Approximately 350
About Maletis Beverage
Chris Maletis Senior, third from left Maletis Beverage Fest on the Edge Event
Portfolio
The Maletis Beverage portfolio consists of 39 craft brewers.Our portfolio consists of 21 Oregon brewers, 6 California brewers, 4 Washington brewers, 1
Montana brewer, 1 Colorado brewer, 1 New York brewer, 1 Utah brewer, 1 Hawaii, 1 Illinois, 1 Rhode Island, and 1 Missouri brewer.
Our portfolio consists of brewpubs, microbrewers, regional and large brewers.

Craft, 42.6%
Cider, 6.3%Imports, 13.1%
FMB/PAB, 4.7%
Premium Domestic,
18.1%
Value, 10.8%
Premium Plus, 3.5%
Other, 0.8%
Value,-1.11 Shr
Premium,-1.08 Shr
Premium Plus,
-0.09 Shr
Other,+0.02 Shr
FMB/PAB,+0.26 Shr
Imports,+0.33 Shr
Craft, +0.76 Shr
Cider, +0.90 Shr
(1.25) (0.75) (0.25) 0.25 0.75 1.25
$Share Change of Beer Category42.6% of Beer category sourced from Craft
PDX $ Share by Segment PDX $ Share Chg. by Segment
Source: IRI data is Dollar Sales PDX: Food - Latest 13 Weeks Ending 07-05-15.
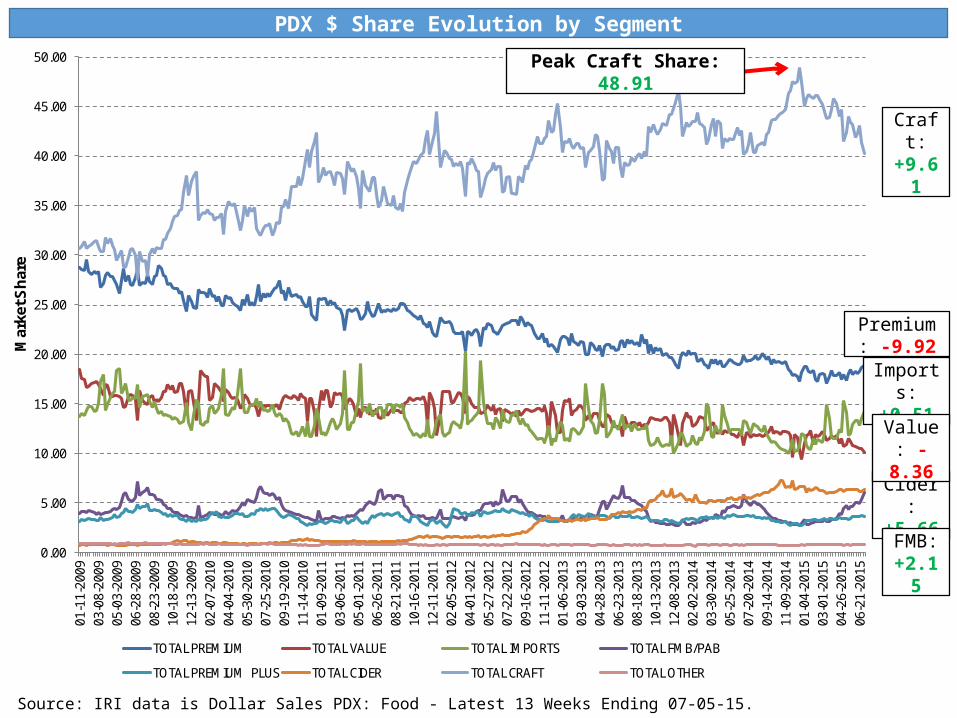
PDX $ Share Evolution by Segment
Source: IRI data is Dollar Sales PDX: Food - Latest 13 Weeks Ending 07-05-15.
0.00
5.00
10.00
15.00
20.00
25.00
30.00
35.00
40.00
45.00
50.00
01-1
1-20
0903
-08-
2009
05-0
3-20
0906
-28-
2009
08-2
3-20
0910
-18-
2009
12-1
3-20
0902
-07-
2010
04-0
4-20
1005
-30-
2010
07-2
5-20
1009
-19-
2010
11-1
4-20
1001
-09-
2011
03-0
6-20
1105
-01-
2011
06-2
6-20
1108
-21-
2011
10-1
6-20
1112
-11-
2011
02-0
5-20
1204
-01-
2012
05-2
7-20
1207
-22-
2012
09-1
6-20
1211
-11-
2012
01-0
6-20
1303
-03-
2013
04-2
8-20
1306
-23-
2013
08-1
8-20
1310
-13-
2013
12-0
8-20
1302
-02-
2014
03-3
0-20
1405
-25-
2014
07-2
0-20
1409
-14-
2014
11-0
9-20
1401
-04-
2015
03-0
1-20
1504
-26-
2015
06-2
1-20
15
Mar
ket S
har
e
TOTAL PREMIUM TOTAL VALUE TOTAL IMPORTS TOTAL FMB/PAB
TOTAL PREMIUM PLUS TOTAL CIDER TOTAL CRAFT TOTAL OTHER
Craft: +9.61
Cider: +5.66
Imports: +0.51
Premium: -9.92
FMB: +2.15
Value: -8.36
Peak Craft Share: 48.91
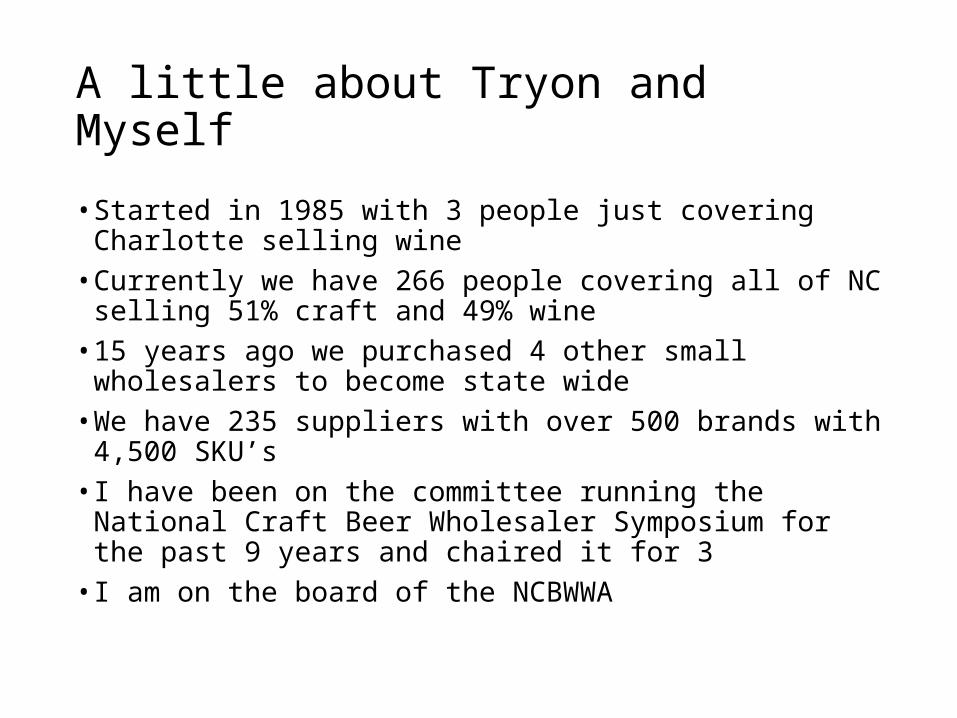
A little about Tryon and Myself
• Started in 1985 with 3 people just covering Charlotte selling wine• Currently we have 266 people covering all of NC selling 51% craft and
49% wine• 15 years ago we purchased 4 other small wholesalers to become
state wide• We have 235 suppliers with over 500 brands with 4,500 SKU’s• I have been on the committee running the National Craft Beer
Wholesaler Symposium for the past 9 years and chaired it for 3• I am on the board of the NCBWWA
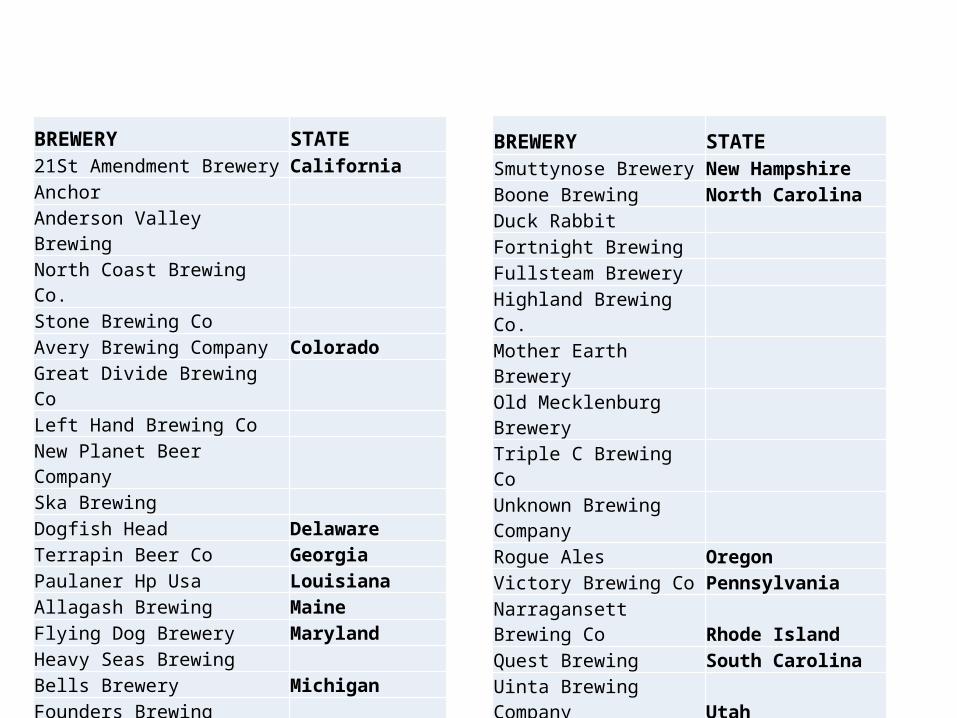
BREWERY STATESmuttynose Brewery New HampshireBoone Brewing North CarolinaDuck RabbitFortnight BrewingFullsteam BreweryHighland Brewing Co.Mother Earth BreweryOld Mecklenburg BreweryTriple C Brewing CoUnknown Brewing CompanyRogue Ales OregonVictory Brewing Co PennsylvaniaNarragansett Brewing Co Rhode IslandQuest Brewing South CarolinaUinta Brewing Company UtahBlue Mtn Barrel House VirginiaLakefront Brewery Wisconsin
BREWERY STATE21St Amendment Brewery CaliforniaAnchorAnderson Valley BrewingNorth Coast Brewing Co.Stone Brewing CoAvery Brewing Company ColoradoGreat Divide Brewing CoLeft Hand Brewing CoNew Planet Beer CompanySka BrewingDogfish Head DelawareTerrapin Beer Co GeorgiaPaulaner Hp Usa LouisianaAllagash Brewing MaineFlying Dog Brewery MarylandHeavy Seas BrewingBells Brewery MichiganFounders BrewingNew Holland Brewing
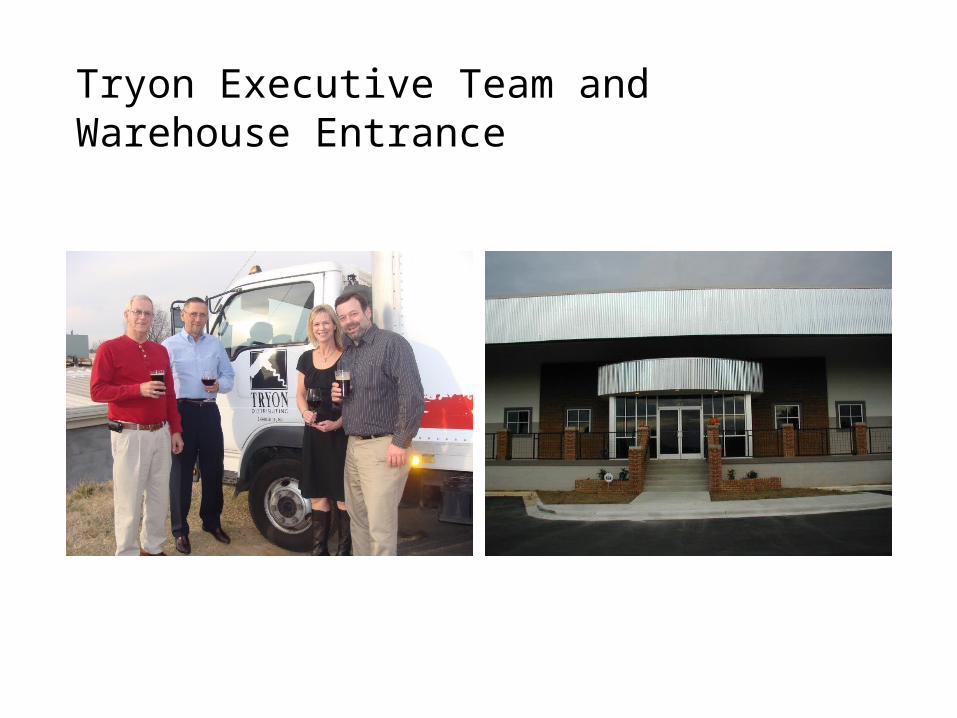
Tryon Executive Team and Warehouse Entrance
Building Craft Beer Brands: A Talk With Award-Winning Distributors
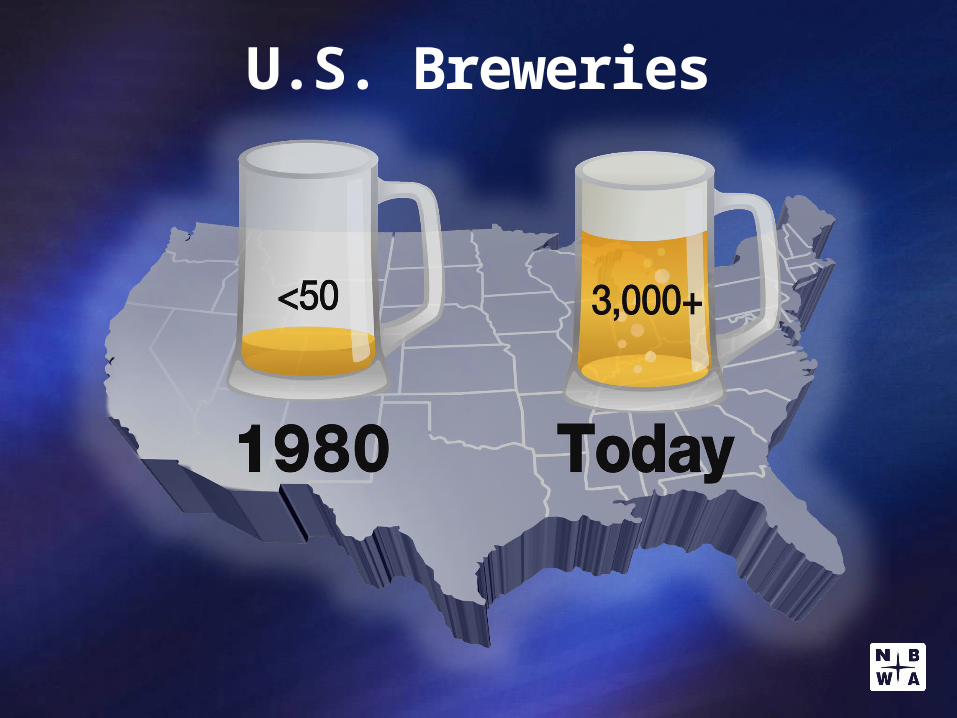
U.S. Breweries
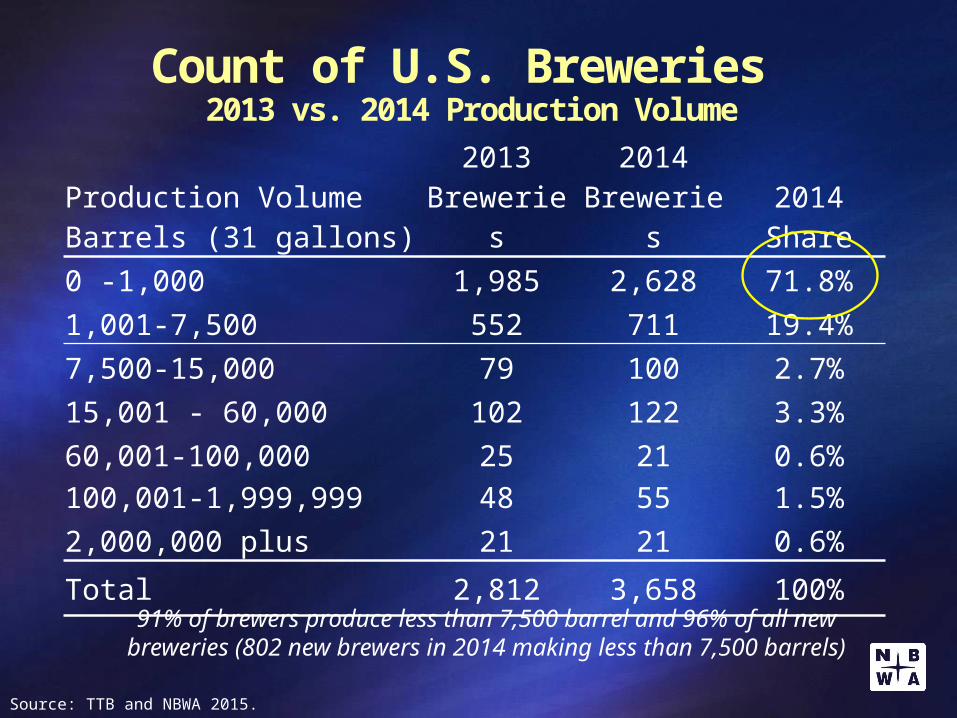
Count of U.S. Breweries 2013 vs. 2014 Production Volume
Production VolumeBarrels (31 gallons)
2013Breweries
2014Breweries
2014Share
0 -1,000 1,985 2,628 71.8%1,001-7,500 552 711 19.4%7,500-15,000 79 100 2.7%15,001 - 60,000 102 122 3.3%60,001-100,000 25 21 0.6%100,001-1,999,999 48 55 1.5%2,000,000 plus 21 21 0.6%Total 2,812 3,658 100%
91% of brewers produce less than 7,500 barrel and 96% of all new breweries (802 new brewers in 2014 making less than 7,500 barrels)
Source: TTB and NBWA 2015.

Average Barrels Per Brewery2011 to 2014
0
10,000
20,000
30,000
40,000
50,000
60,000
70,000
80,000
90,000
100,00091,335
81,026
68,216
52,418
2011 2012 2013 2014
Prod
uctio
n in
Bar
rels
Source: TTB and NBWA, 2015. (all brewery establishments)
Average craft brewer 7,000 barrels in 2014
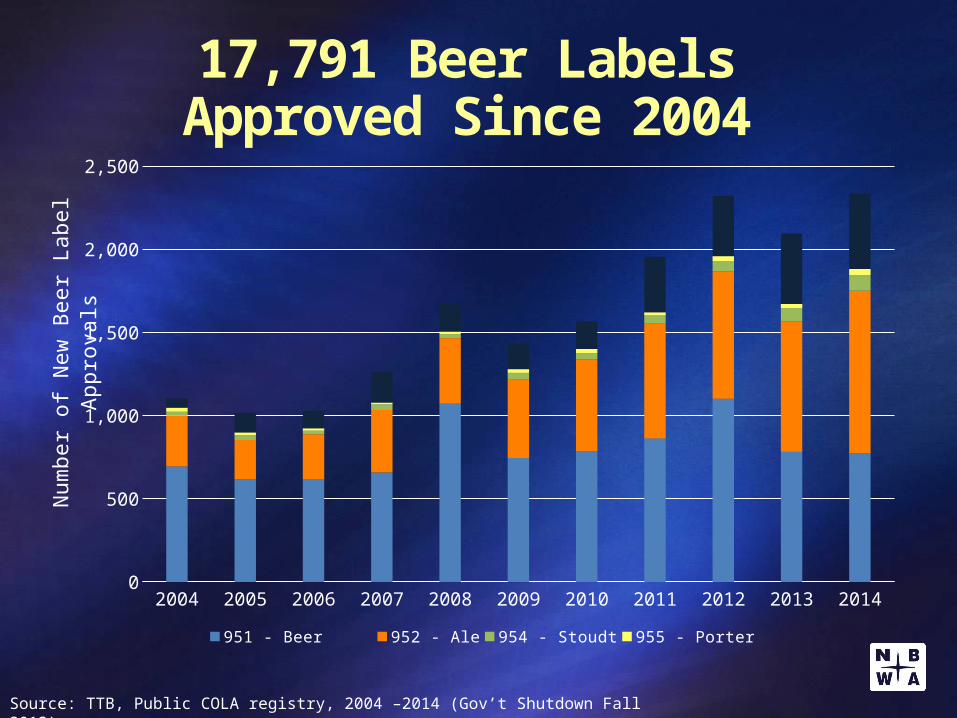
17,791 Beer Labels Approved Since 2004
2004 2005 2006 2007 2008 2009 2010 2011 2012 2013 20140
500
1,000
1,500
2,000
2,500
951 - Beer 952 - Ale 954 - Stoudt 955 - Porter 956 - Specialty
Num
ber o
f New
Bee
r Lab
el A
ppro
vals
Source: TTB, Public COLA registry, 2004 –2014 (Gov’t Shutdown Fall 2013).
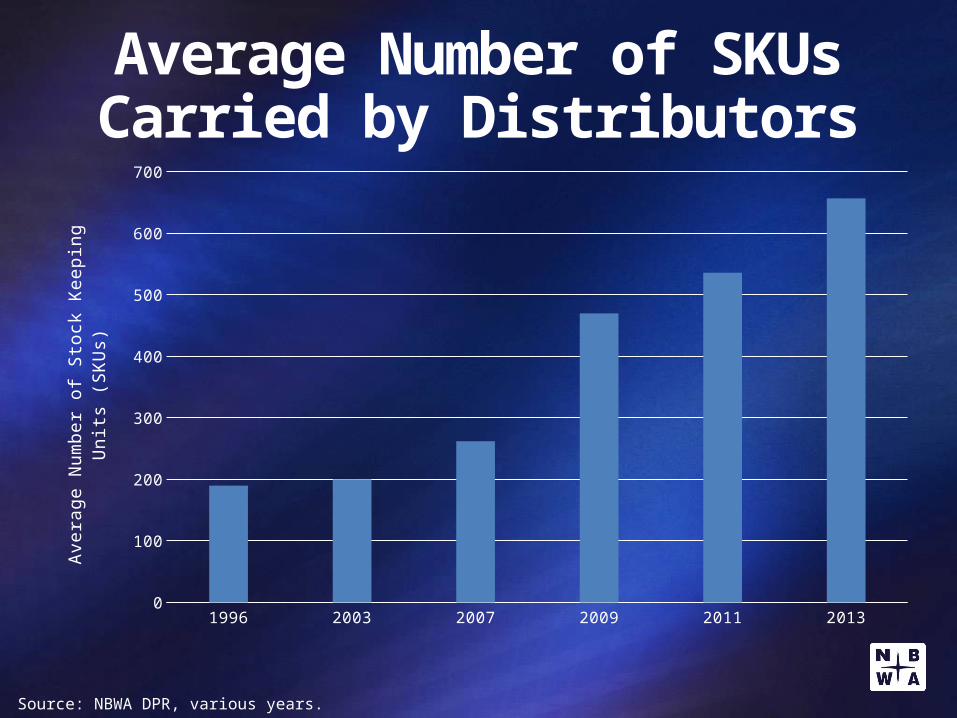
Average Number of SKUsCarried by Distributors
1996 2003 2007 2009 2011 20130
100
200
300
400
500
600
700
Aver
age
Num
ber o
f Sto
ck K
eepi
ng U
nits
(SKU
s)
Source: NBWA DPR, various years.
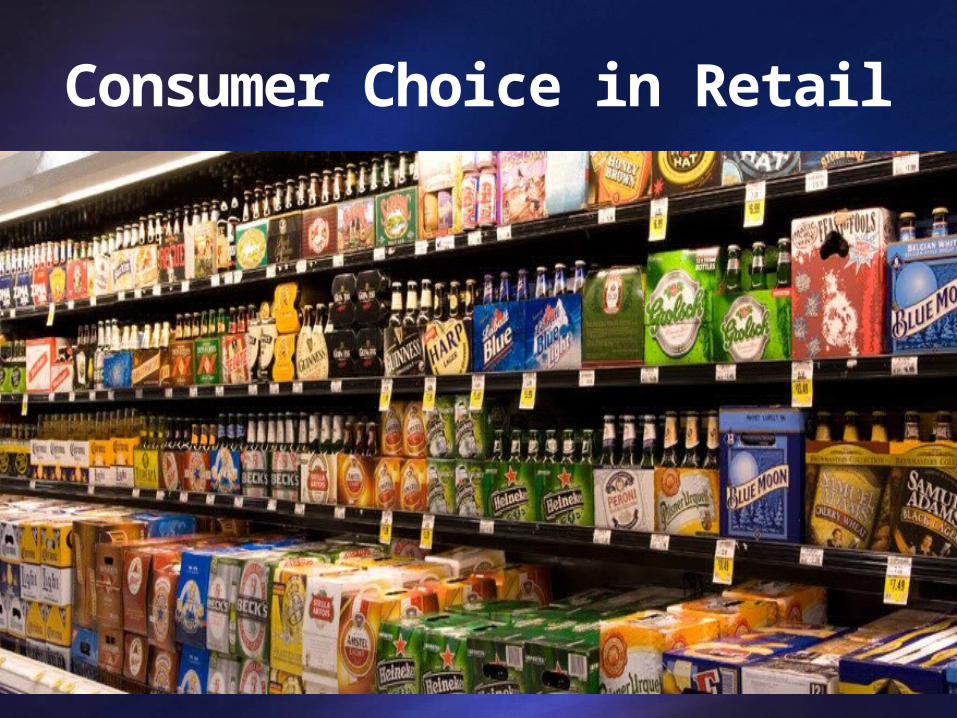
Consumer Choice in Retail

…and not so much
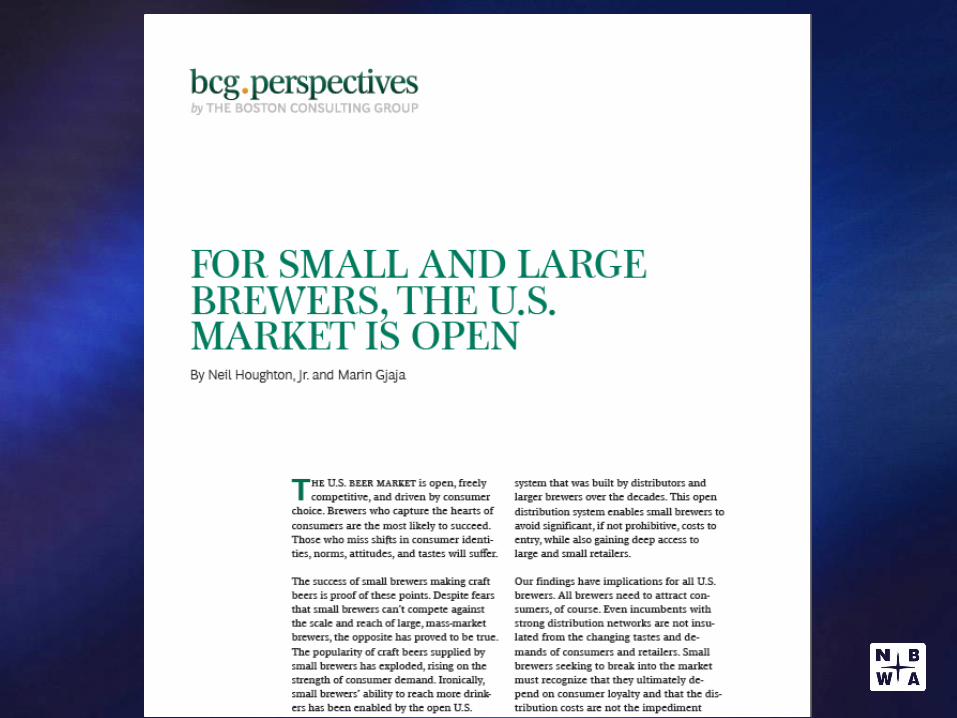
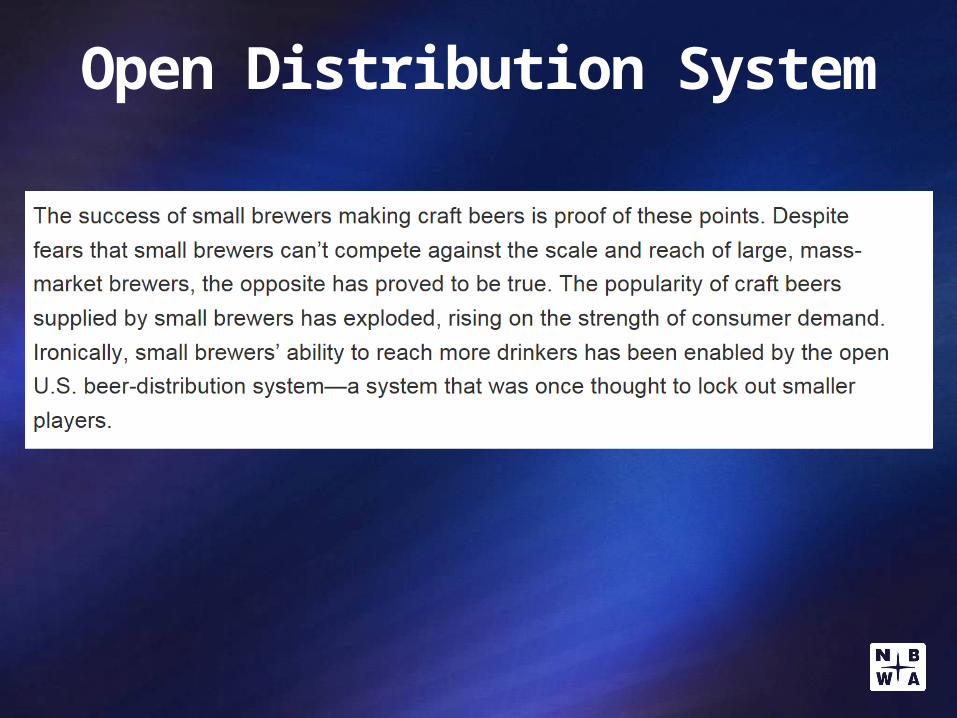
Open Distribution System
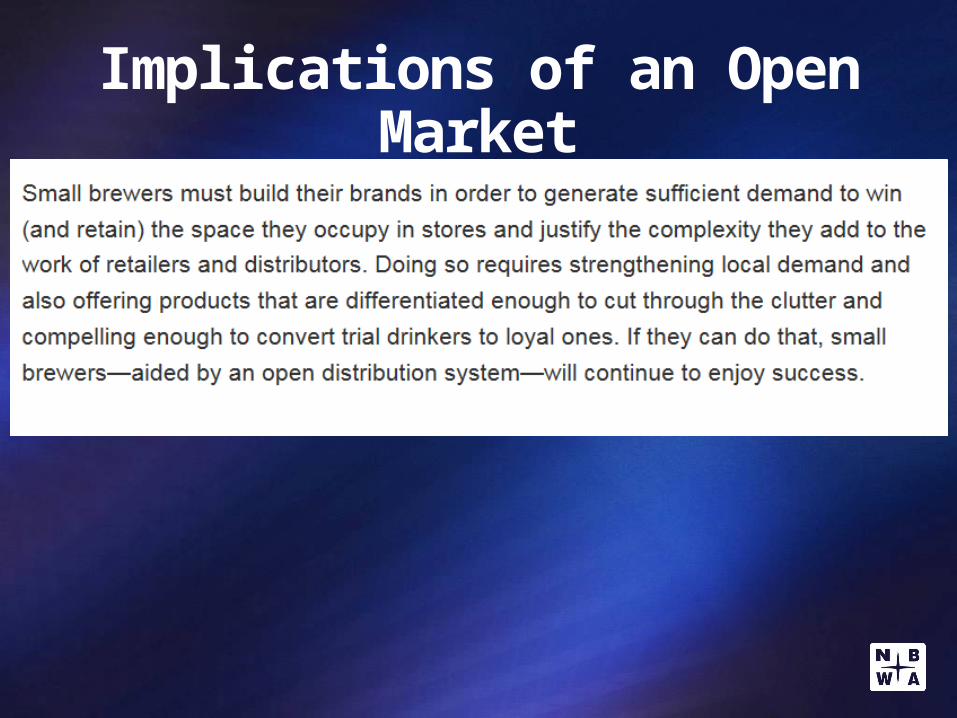
Implications of an Open Market
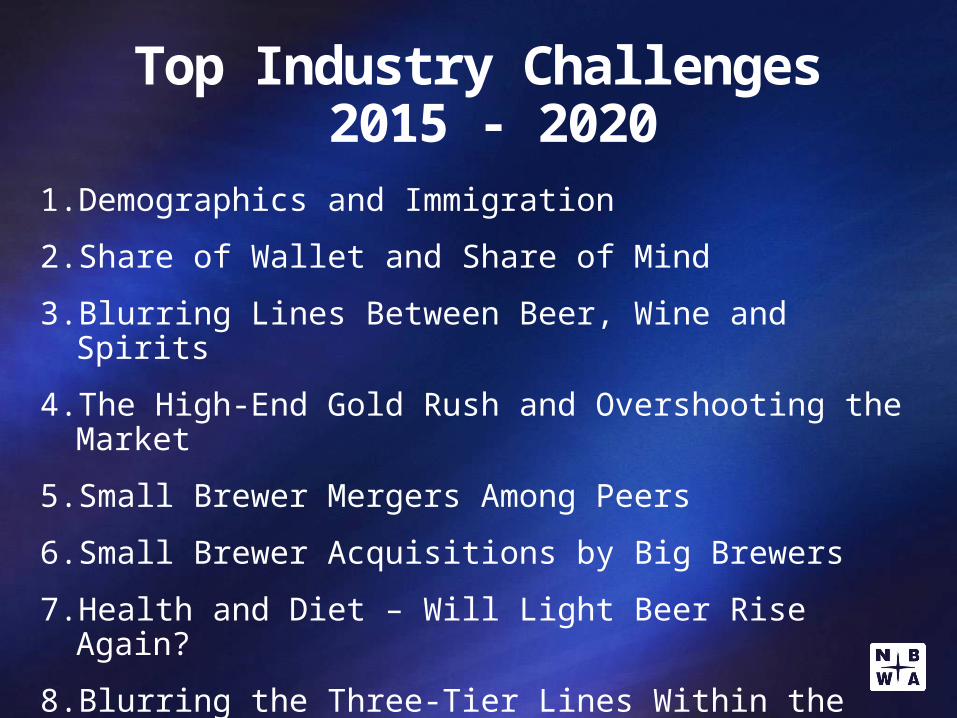
Top Industry Challenges 2015 - 2020
1. Demographics and Immigration
2. Share of Wallet and Share of Mind
3. Blurring Lines Between Beer, Wine and Spirits
4. The High-End Gold Rush and Overshooting the Market
5. Small Brewer Mergers Among Peers
6. Small Brewer Acquisitions by Big Brewers
7. Health and Diet – Will Light Beer Rise Again?
8. Blurring the Three-Tier Lines Within the Industry