Embed Size (px)
Citation preview

INVESTOR PRESENTATIONScott Thomson, President & CEOMauk Breukels, VP Investor Relations & Corporate Affairs
Bank of America Merrill Lynch - Global Industrials & EU Autos ConferenceMarch 19, 2015
Forward Looking Information
2
This report contains statements about the Company’s business outlook, objectives, plans, strategic priorities and other statements that are not historical facts. A statement Finning makes is forward-looking when it uses what the Company knows and expects today to make a statement about the future. Forward-looking statements may include words such as aim, anticipate, assumption, believe, could, expect, goal, guidance, intend, may, objective, outlook, plan, project, seek, should, strategy, strive, target, and will. Forward-looking statements in this report include, but are not limited to, statements with respect to: expectations with respect to the economy and associated impact on the Company’s financial results; expected revenue; EBIT margin; ROIC; market share growth; expected results from service excellence action plans; anticipated asset utilization; inventory turns and parts service levels; the expected target range of the Company’s net debt to invested capital ratio; and the expected target range of the Company’s dividend payout ratio. All such forward-looking statements are made pursuant to the ‘safe harbour’ provisions of applicable Canadian securities laws. Unless otherwise indicated by us, forward-looking statements in this report reflect Finning’s expectations at March 19, 2015. Except as may be required by Canadian securities laws, Finning does not undertake any obligation to update or revise any forward-looking statement, whether as a result of new information, future events, or otherwise. Forward-looking statements, by their very nature, are subject to numerous risks and uncertainties and are based on several assumptions which give rise to the possibility that actual results could differ materially from the expectations expressed in or implied by such forward-looking statements and that Finning’s business outlook, objectives, plans, strategic priorities and other statements that are not historical facts may not be achieved. As a result, Finning cannot guarantee that any forward-looking statement will materialize. Factors that could cause actual results or events to differ materially from those expressed in or implied by these forward-looking statements include: general economic and market conditions; foreign exchange rates; commodity prices; the level of customer confidence and spending, and the demand for, and prices of, Finning’s products and services; Finning’s dependence on the continued market acceptance of Caterpillar’s products and Caterpillar’s timely supply of parts and equipment; Finning’s ability to continue to improve productivity and operational efficiencies while continuing to maintain customer service; Finning’s ability to manage cost pressures as growth in revenues occur; Finning’s ability to reduce costs in response to slowing activity levels; Finning’s ability to attract sufficient skilled labour resources to meet growing product support demand; Finning’s ability to negotiate and renew collective bargaining agreements with satisfactory terms for Finning’s employees and the Company; the intensity of competitive activity; Finning’s ability to raise the capital needed to implement its business plan; regulatory initiatives or proceedings, litigation and changes in laws or regulations; stock market volatility; changes in political and economic environments for operations; the integrity, reliability, availability and benefits from information technology and the data processed by that technology. Forward-looking statements are provided in this report for the purpose of giving information about management’s current expectations and plans and allowing investors and others to get a better understanding of Finning’s operating environment. However, readers are cautioned that it may not be appropriate to use such forward-looking statements for any other purpose. Forward-looking statements made in this report are based on a number of assumptions that Finning believed were reasonable on the day the Company made the forward-looking statements. Refer in particular to the Outlook section of this MD&A. Some of the assumptions, risks, and other factors which could cause results to differ materially from those expressed in the forward-looking statements contained in this report are discussed in Section 4 of the Company’s current AIF. Finning cautions readers that the risks described in the AIF are not the only ones that could impact the Company. Additional risks and uncertainties not currently known to the Company or that are currently deemed to be immaterial may also have a material adverse effect on Finning’s business, financial condition, or results of operations. Except as otherwise indicated, forward-looking statements do not reflect the potential impact of any non-recurring or other unusual items or of any dispositions, mergers, acquisitions, other business combinations or other transactions that may be announced or that may occur after the date hereof. The financial impact of these transactions and non-recurring and other unusual items can be complex and depends on the facts particular to each of them. Finning therefore cannot describe the expected impact in a meaningful way or in the same way Finning presents known risks affecting its business.
Monetary amounts are in Canadian dollars and from continuing operations unless noted otherwise
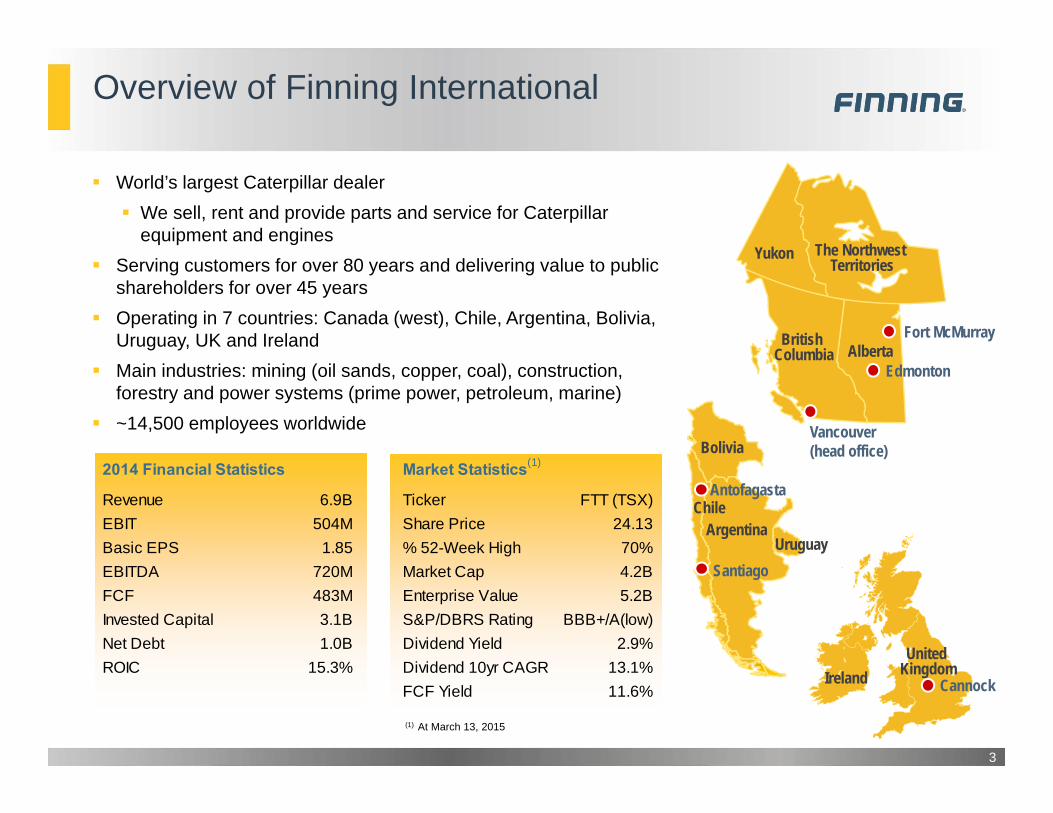
Overview of Finning International
World’s largest Caterpillar dealer We sell, rent and provide parts and service for Caterpillar
equipment and engines Serving customers for over 80 years and delivering value to public
shareholders for over 45 years Operating in 7 countries: Canada (west), Chile, Argentina, Bolivia,
Uruguay, UK and Ireland Main industries: mining (oil sands, copper, coal), construction,
forestry and power systems (prime power, petroleum, marine) ~14,500 employees worldwide
3
Vancouver(head office)
Edmonton
Fort McMurrayBritish Columbia
Yukon
Alberta
The Northwest Territories
Santiago
Antofagasta
Bolivia
ArgentinaChile
Uruguay
Cannock
United KingdomIreland
(1) At March 13, 2015
2014 Financial Statistics Market Statistics(1)
Revenue 6.9B Ticker FTT (TSX)EBIT 504M Share Price 24.13Basic EPS 1.85 % 52-Week High 70%EBITDA 720M Market Cap 4.2BFCF 483M Enterprise Value 5.2BInvested Capital 3.1B S&P/DBRS Rating BBB+/A(low)Net Debt 1.0B Dividend Yield 2.9%ROIC 15.3% Dividend 10yr CAGR 13.1%
FCF Yield 11.6%
Compelling Business Model, Strategy and Financial Position
World class heavy equipment company World’s largest Caterpillar dealer Best products and the best territories
Highly diversified business Geography: Three unique, high-quality OECD regions End markets: Serving a diversified spectrum of sectors and customers Revenue mix: Balance between new equipment sales and highly stable product support Product support provides a resilient and growing foundation
Remain focused on what we can control: costs, working capital and capital investment Full focus on the Five Priorities Safety and Talent Management Market Leadership Service Excellence Supply Chain Asset Utilization
Prepared for both volatility and opportunity in a very dynamic business environment Strong full-cycle growth supported by a diverse customer base, large in-region equipment population and resilient
product support business Decisive action taken to manage recent downturn in South America Accelerating Five Priority strategy in Canada to ensure our cost structure matches lower activity levels
Robust financial position Significant free cash flow generation Strong balance sheet Significant capital allocation flexibility
4
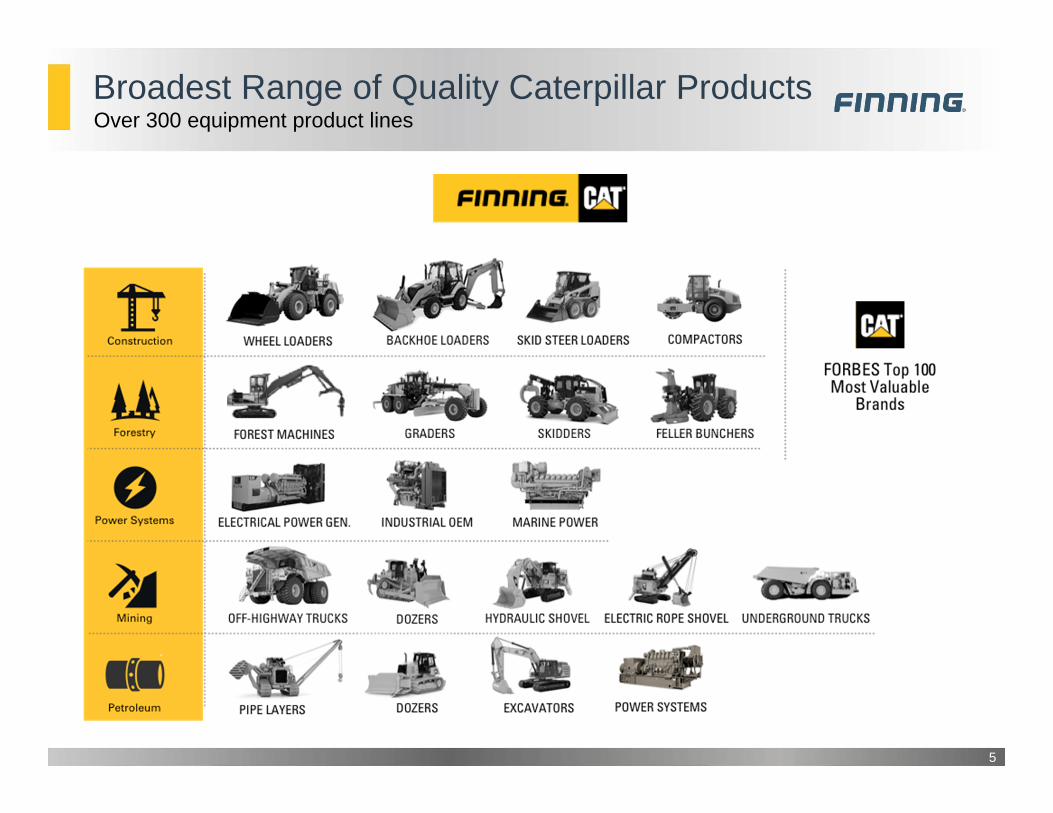
Broadest Range of Quality Caterpillar Products
5
Over 300 equipment product lines
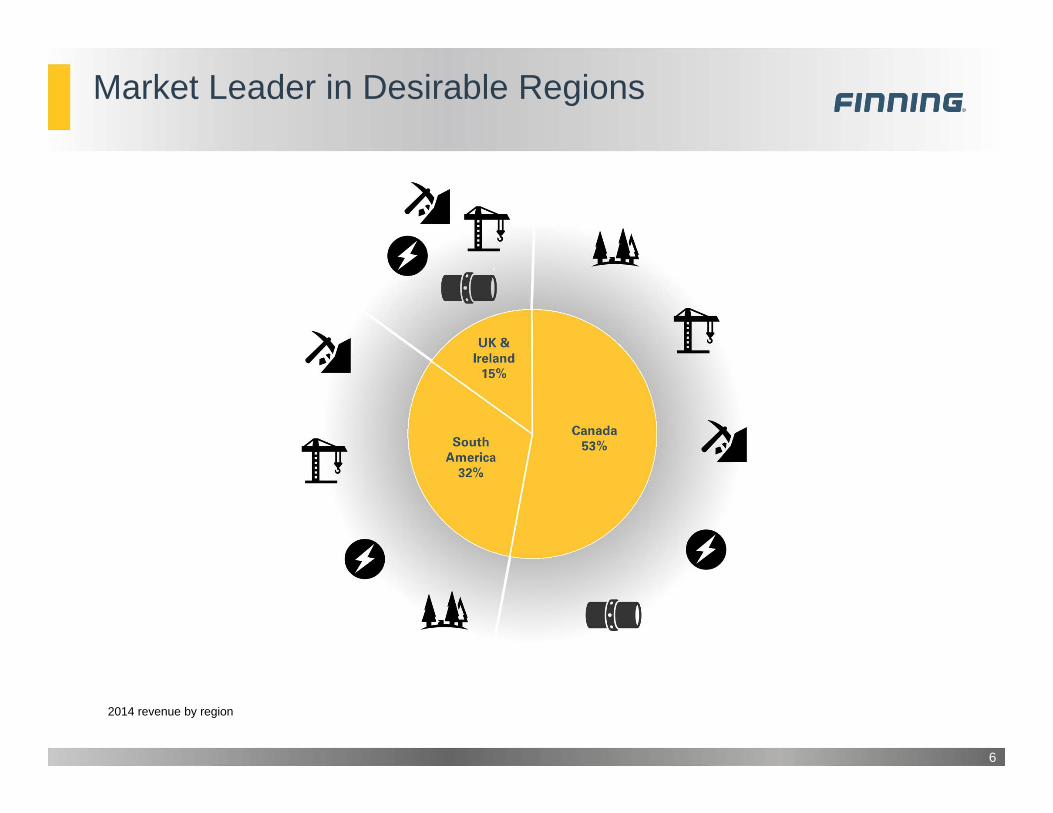
Market Leader in Desirable Regions
6
2014 revenue by region
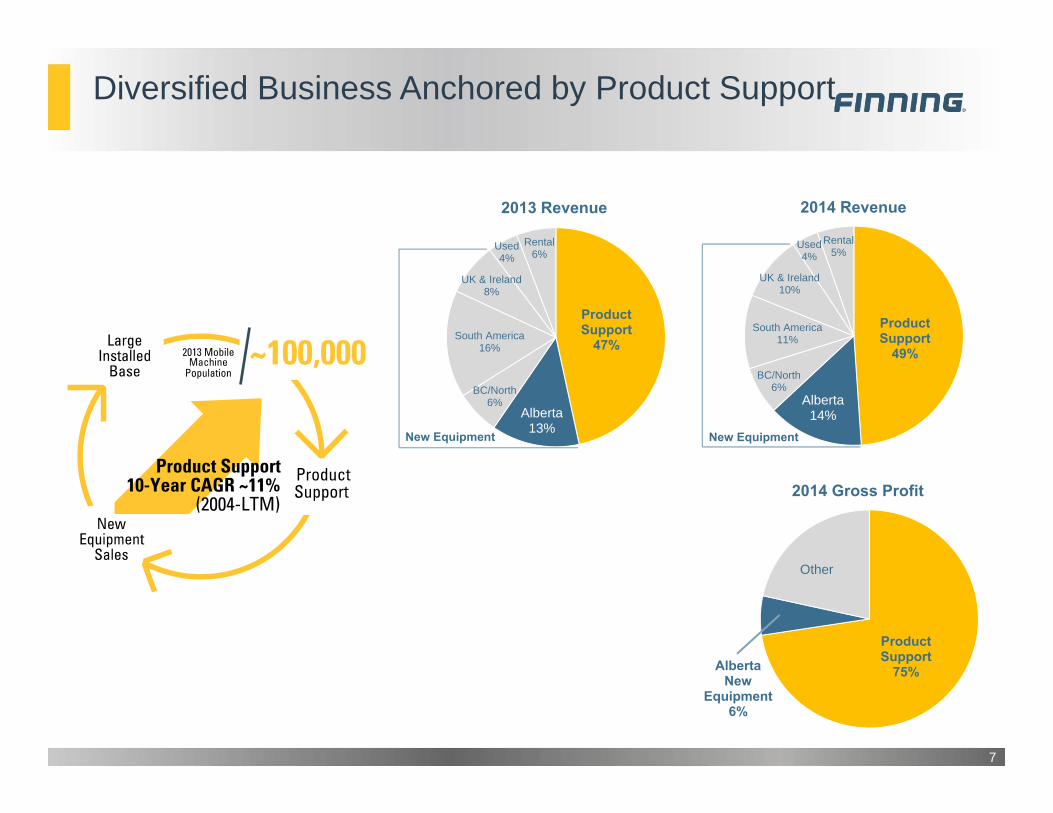
Diversified Business Anchored by Product Support
7
Product Support
49%
Alberta14%
BC/North 6%
South America11%
UK & Ireland10%
Used4%
Rental5%
Product Support
47%
Alberta13%
BC/North6%
South America16%
UK & Ireland8%
Used4%
Rental6%
Product Support
75%Alberta New
Equipment6%
Other
2013 Revenue 2014 Revenue
2014 Gross Profit
New Equipment New Equipment
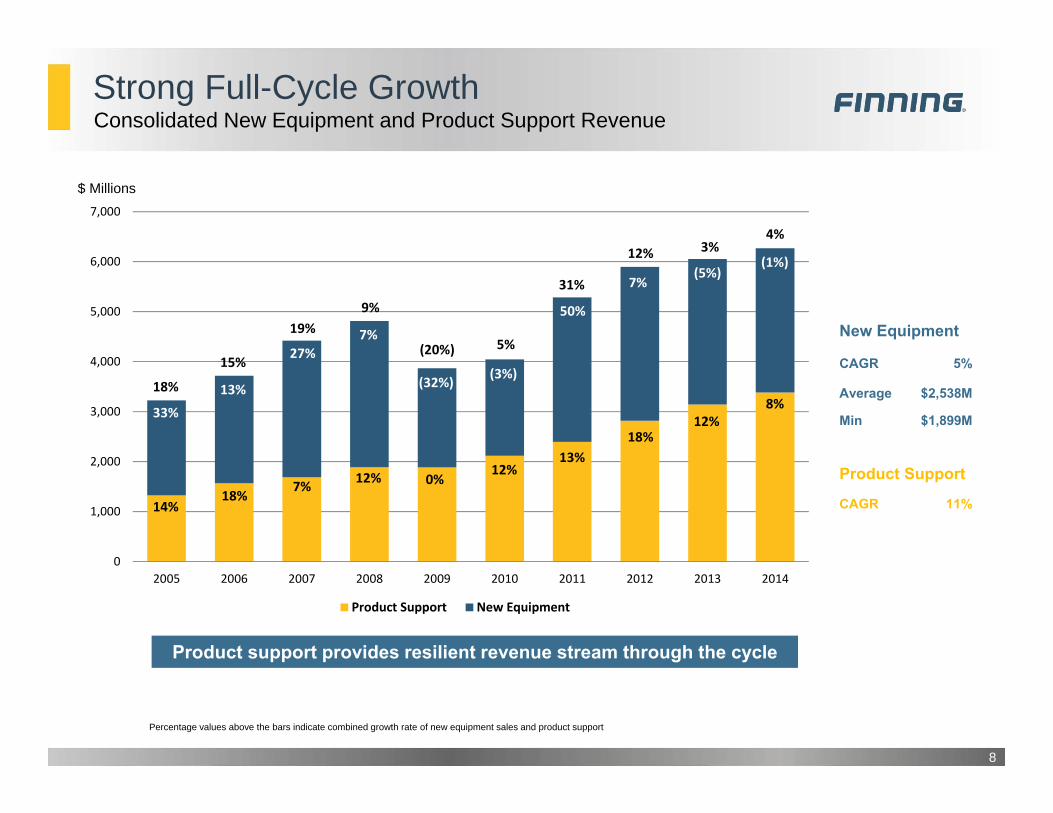
Strong Full-Cycle Growth
8
Consolidated New Equipment and Product Support Revenue
$ Millions
New Equipment
CAGR 5%
Average $2,538M
Min $1,899M
Product Support
CAGR 11%
Product support provides resilient revenue stream through the cycle
Percentage values above the bars indicate combined growth rate of new equipment sales and product support
0
1,000
2,000
3,000
4,000
5,000
6,000
7,000
2005 2006 2007 2008 2009 2010 2011 2012 2013 2014
Product Support New Equipment
7%18%
12% 0%12%
13%18%
12%8%
13%
27%7%
(32%) (3%)
50%
7%(5%)
(1%)
14%
33%
15%
19%(20%) 5%
31%
12% 3%4%
18%
9%
0
500
1,000
1,500
2,000
2,500
3,000
3,500
2005 2006 2007 2008 2009 2010 2011 2012 2013 2014
Product Support New Equipment
4%23%8% (5%)
17%13%
13%11%
10%
39%
18%
15%
(39%) (19%)
58%
10% (8%)
12%
26%
42%
32%
12%
13%
(26%) (2%)
33%
11% 2%
10%
34%
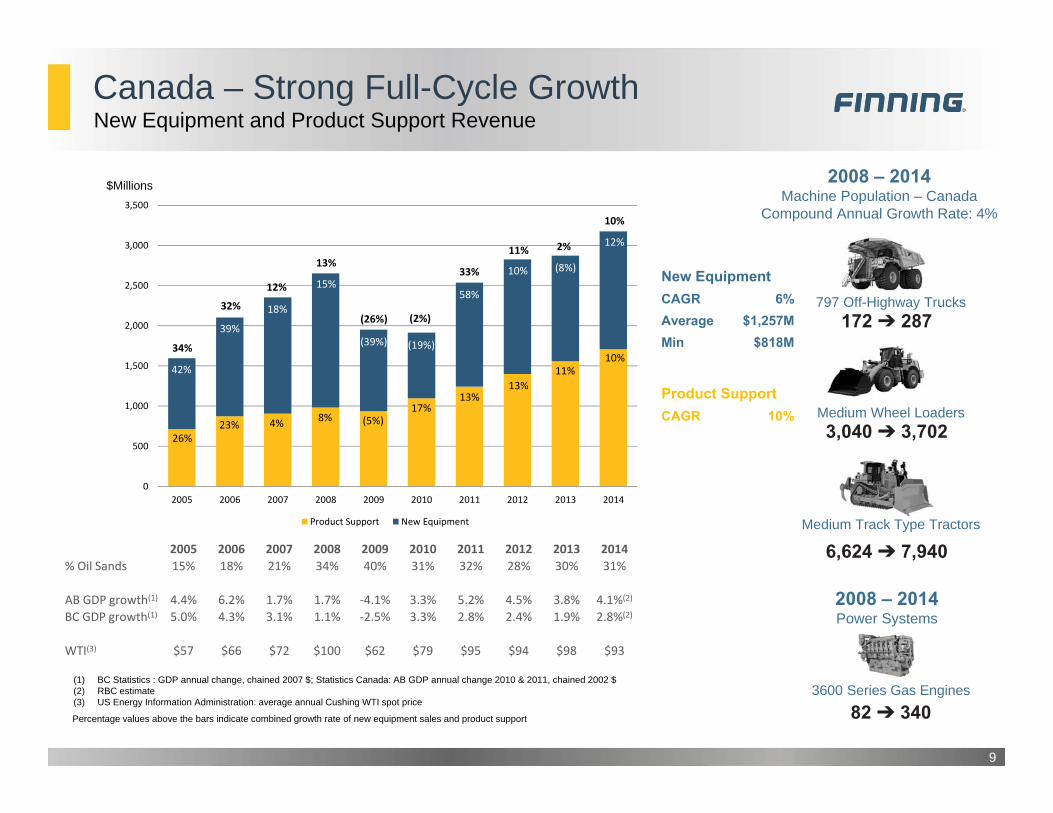
Canada – Strong Full-Cycle Growth
9
New Equipment and Product Support Revenue
$Millions
797 Off-Highway Trucks
2008 – 2014Machine Population – Canada
Compound Annual Growth Rate: 4%
New EquipmentCAGR 6%Average $1,257M Min $818M
Product SupportCAGR 10%
172 ➔ 287
3600 Series Gas Engines
82 ➔ 340
2005 2006 2007 2008 2009 2010 2011 2012 2013 2014% Oil Sands 15% 18% 21% 34% 40% 31% 32% 28% 30% 31%
AB GDP growth(1) 4.4% 6.2% 1.7% 1.7% ‐4.1% 3.3% 5.2% 4.5% 3.8% 4.1%(2)
BC GDP growth(1) 5.0% 4.3% 3.1% 1.1% ‐2.5% 3.3% 2.8% 2.4% 1.9% 2.8%(2)
WTI(3) $57 $66 $72 $100 $62 $79 $95 $94 $98 $93
(1) BC Statistics : GDP annual change, chained 2007 $; Statistics Canada: AB GDP annual change 2010 & 2011, chained 2002 $(2) RBC estimate(3) US Energy Information Administration: average annual Cushing WTI spot price
2008 – 2014Power Systems
Medium Wheel Loaders3,040 ➔ 3,702
Medium Track Type Tractors
6,624 ➔ 7,940
Percentage values above the bars indicate combined growth rate of new equipment sales and product support
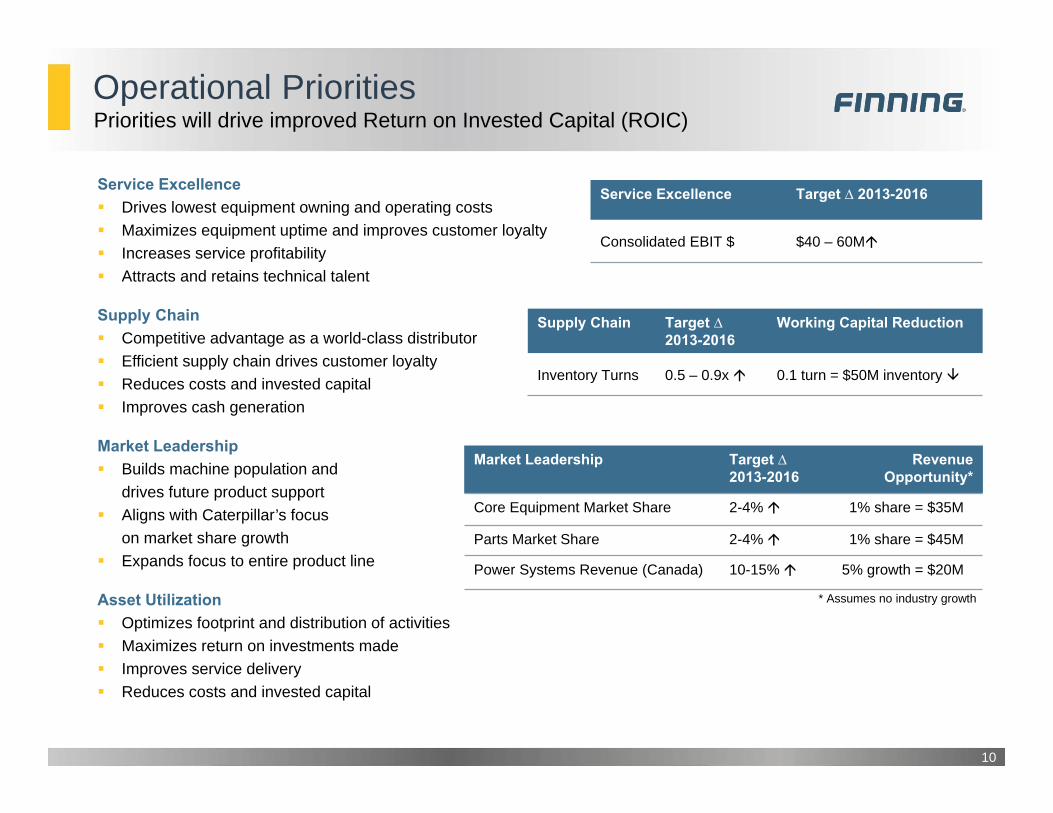
Operational Priorities
Service Excellence Drives lowest equipment owning and operating costs Maximizes equipment uptime and improves customer loyalty Increases service profitability Attracts and retains technical talent
Supply Chain Competitive advantage as a world-class distributor Efficient supply chain drives customer loyalty Reduces costs and invested capital Improves cash generation
Market Leadership Builds machine population and
drives future product support Aligns with Caterpillar’s focus
on market share growth Expands focus to entire product line
Asset Utilization Optimizes footprint and distribution of activities Maximizes return on investments made Improves service delivery Reduces costs and invested capital
10
Priorities will drive improved Return on Invested Capital (ROIC)
Market Leadership Target ∆ 2013-2016
RevenueOpportunity*
Core Equipment Market Share 2-4% 1% share = $35M
Parts Market Share 2-4% 1% share = $45M
Power Systems Revenue (Canada) 10-15% 5% growth = $20M
Service Excellence Target ∆ 2013-2016
Consolidated EBIT $ $40 – 60M
Supply Chain Target ∆ 2013-2016
Working Capital Reduction
Inventory Turns 0.5 – 0.9x 0.1 turn = $50M inventory
* Assumes no industry growth
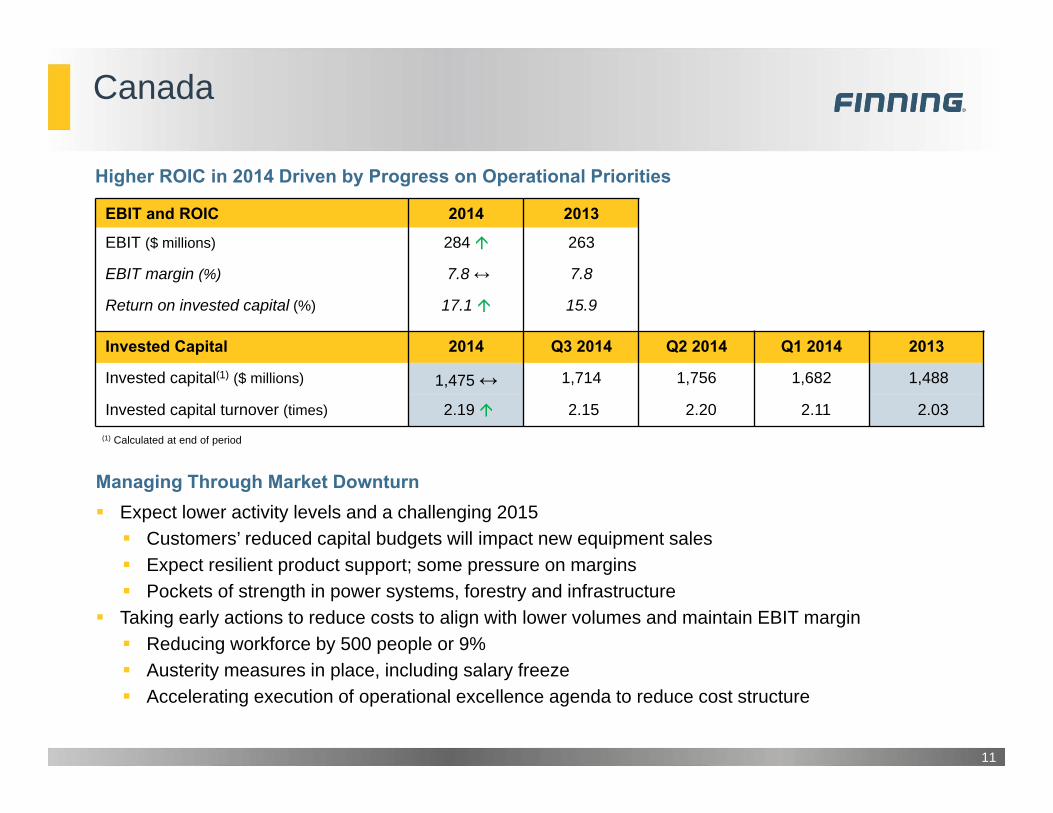
Canada
11
EBIT and ROIC 2014 2013
EBIT ($ millions) 284 263
EBIT margin (%) 7.8 ↔ 7.8
Return on invested capital (%) 17.1 15.9
Invested Capital 2014 Q3 2014 Q2 2014 Q1 2014 2013
Invested capital(1) ($ millions) 1,475 ↔ 1,714 1,756 1,682 1,488
Invested capital turnover (times) 2.19 2.15 2.20 2.11 2.03(1) Calculated at end of period
Higher ROIC in 2014 Driven by Progress on Operational Priorities
Managing Through Market Downturn Expect lower activity levels and a challenging 2015 Customers’ reduced capital budgets will impact new equipment sales Expect resilient product support; some pressure on margins Pockets of strength in power systems, forestry and infrastructure
Taking early actions to reduce costs to align with lower volumes and maintain EBIT margin Reducing workforce by 500 people or 9% Austerity measures in place, including salary freeze Accelerating execution of operational excellence agenda to reduce cost structure
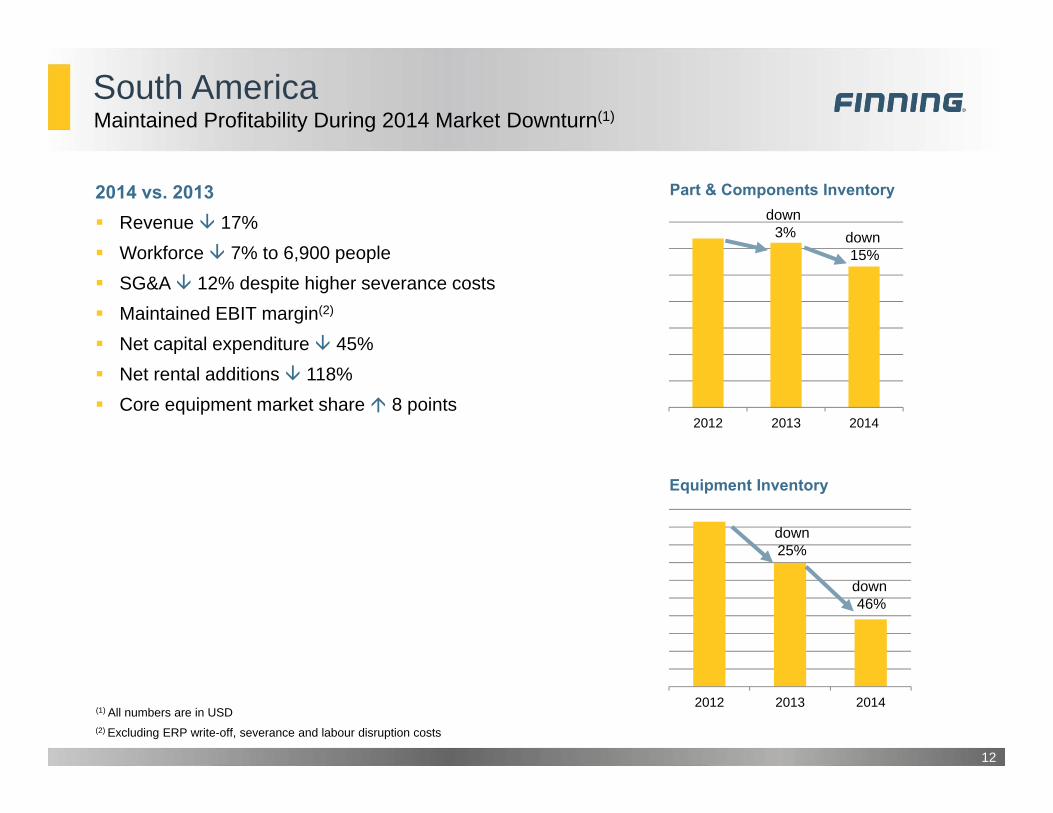
South America
12
Maintained Profitability During 2014 Market Downturn(1)
2014 vs. 2013 Revenue 17% Workforce 7% to 6,900 people SG&A 12% despite higher severance costs Maintained EBIT margin(2)
Net capital expenditure 45% Net rental additions 118% Core equipment market share 8 points
(1) All numbers are in USD
2012 2013 2014
2012 2013 2014
down 25%
Part & Components Inventory
Equipment Inventory
down 15%
down 46%
(2) Excluding ERP write-off, severance and labour disruption costs
down 3%
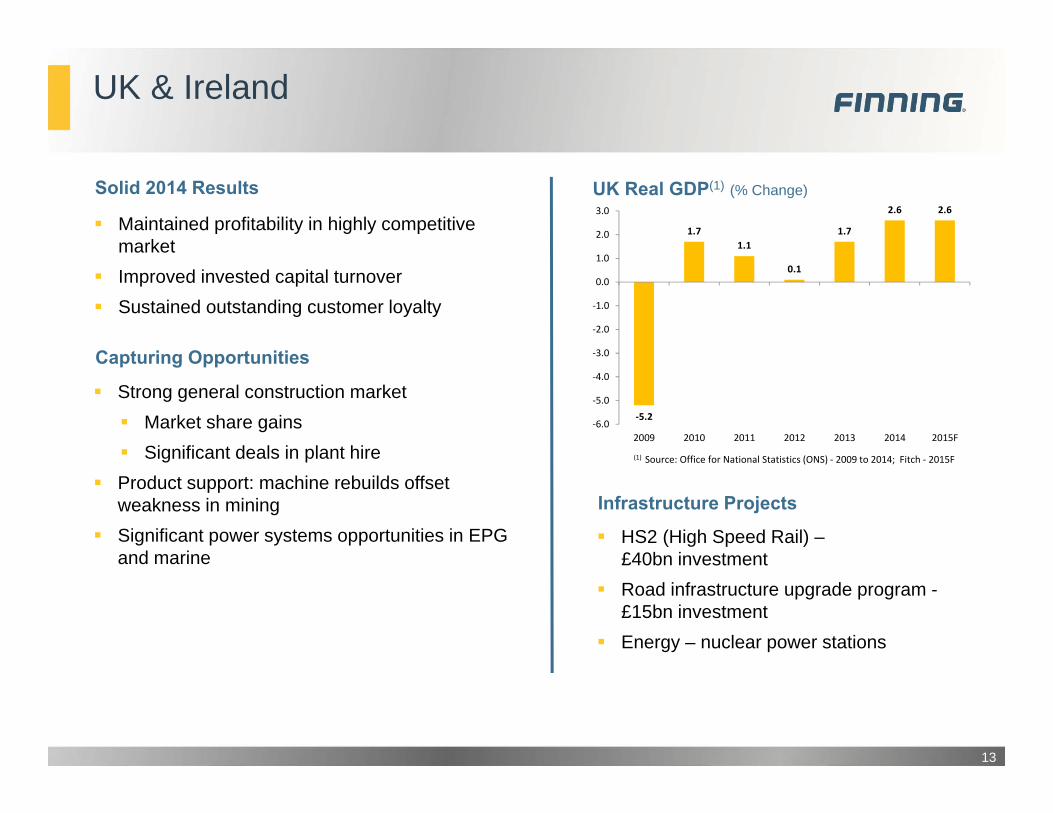
UK & Ireland
‐5.2
1.71.1
0.1
1.7
2.6 2.6
‐6.0
‐5.0
‐4.0
‐3.0
‐2.0
‐1.0
0.0
1.0
2.0
3.0
2009 2010 2011 2012 2013 2014 2015F
UK Real GDP(1) (% Change)
Infrastructure Projects
HS2 (High Speed Rail) –£40bn investment
Road infrastructure upgrade program -£15bn investment
Energy – nuclear power stations
(1) Source: Office for National Statistics (ONS) ‐ 2009 to 2014; Fitch ‐ 2015F
Capturing Opportunities
Maintained profitability in highly competitive market
Improved invested capital turnover Sustained outstanding customer loyalty
Solid 2014 Results
Strong general construction market Market share gains Significant deals in plant hire
Product support: machine rebuilds offset weakness in mining
Significant power systems opportunities in EPG and marine
13
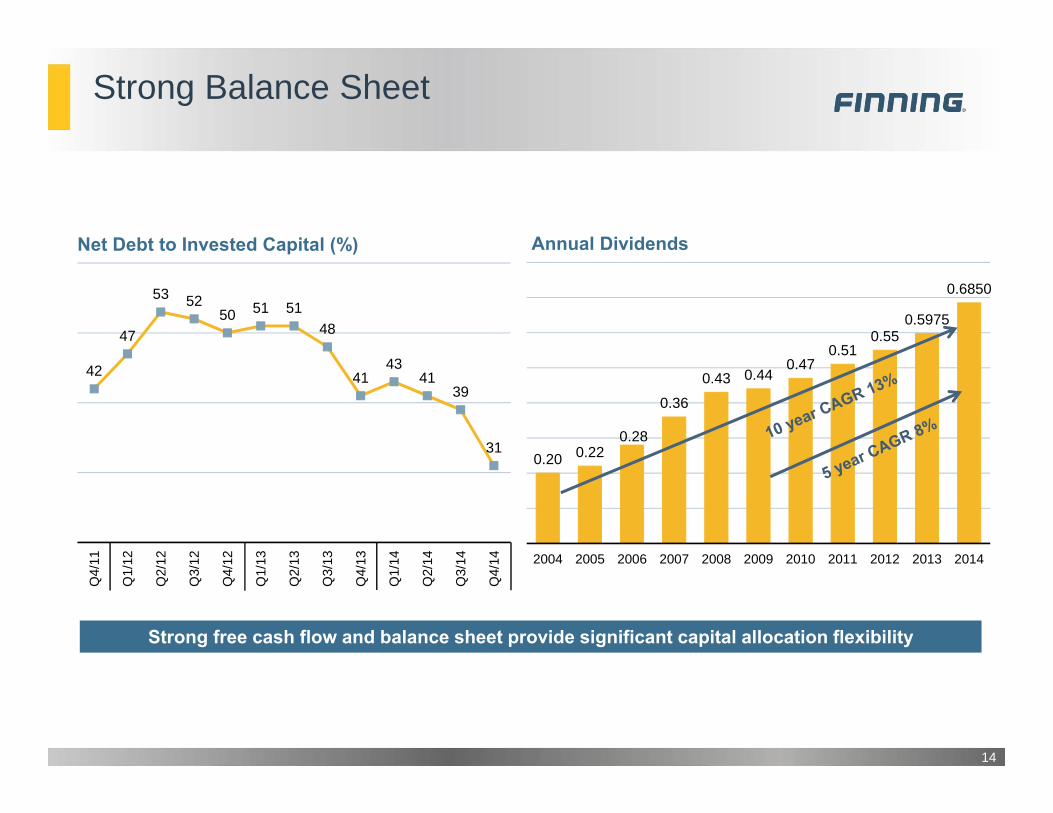
Strong Balance Sheet
14
0.20 0.220.28
0.36
0.43 0.440.47
0.510.55
0.5975
0.6850
2004 2005 2006 2007 2008 2009 2010 2011 2012 2013 2014
Annual Dividends
42
47
53 5250 51 51
48
4143
4139
31
Q4/
11
Q1/
12
Q2/
12
Q3/
12
Q4/
12
Q1/
13
Q2/
13
Q3/
13
Q4/
13
Q1/
14
Q2/
14
Q3/
14
Q4/
14
Net Debt to Invested Capital (%)
Strong free cash flow and balance sheet provide significant capital allocation flexibility
INVESTOR PRESENTATIONScott Thomson, President & CEOMauk Breukels, VP Investor Relations & Corporate Affairs
Bank of America Merrill Lynch - Global Industrials & EU Autos ConferenceMarch 19, 2015