Embed Size (px)
Citation preview

4th Quarter 2016 First Financial
Bankshares, Inc.

2
Forward Looking Statement
The numbers, as of and for the quarter and year ended December 31, 2016, contained within this presentation are unaudited. Certain statements contained herein may be considered “forward-looking statements” as defined in the Private Securities Litigation Reform Act of 1995. These statements are based upon the belief of the Company’s management, as well as assumptions made beyond information currently available to the Company’s management and, may be, but not necessarily are identified by such words as “expect”, “plan”, “anticipate”, “target”, “forecast” and “goal”. Because such “forward-looking statements” are subject to risks and uncertainties, actual results may differ materially from those expressed or implied by such forward-looking statements. Factors that could cause actual results to differ materially from the Company’s expectations include competition from other financial institutions and financial holding companies; the effects of and changes in trade, monetary and fiscal policies and laws, including interest rate policies of the Federal Reserve Board; changes in the demand for loans; fluctuations in value of collateral and loan reserves; inflation, interest rate, market and monetary fluctuations; changes in consumer spending, borrowing and savings habits; and acquisitions and integration of acquired businesses, and similar variables. Other key risks are described in the Company’s reports filed with the Securities and Exchange Commission, which may be obtained under “Investor Relations-Documents/Filings” on the Company’s web site or by writing or calling the Company at 325.627.7155. The Company does not undertake any obligation to update publicly or revise any forward-looking statements herein because of new information, future events or otherwise.

33
Who We Are
$6.8 billion financial holding company headquartered in Abilene, Texas
Group of 11 separate regions
126 year history
Growth markets include 50 mile radius of the larger cities of Texas

4

Recognitions – Financial Exploitation Prevention Program
ABA Foundation Community Commitment Award – November 2015
Texas Bankers Association 2016 Leaders in Financial Education Award – May 2016
White House Conference on Aging – July 2015
AARP Roundtable Discussion – November 2015
Texas Senate Committee on Business and Commerce – Jan. 2016
House Investments and Financial Services Committee – March 2016
5

66
Recognitions
SNL - #5 Best-Performing Regional Bank – April 2016
Raymond James Community Bankers Cup #3, One of thirty banks named– March 2016
2015 Proven Performers Award Winner – Bank Intelligence Solutions
American Banker - #15 – Based on three year average Return on Equity – May 2015
KBW Honor Roll – One of twenty five banks named – April 2015
77
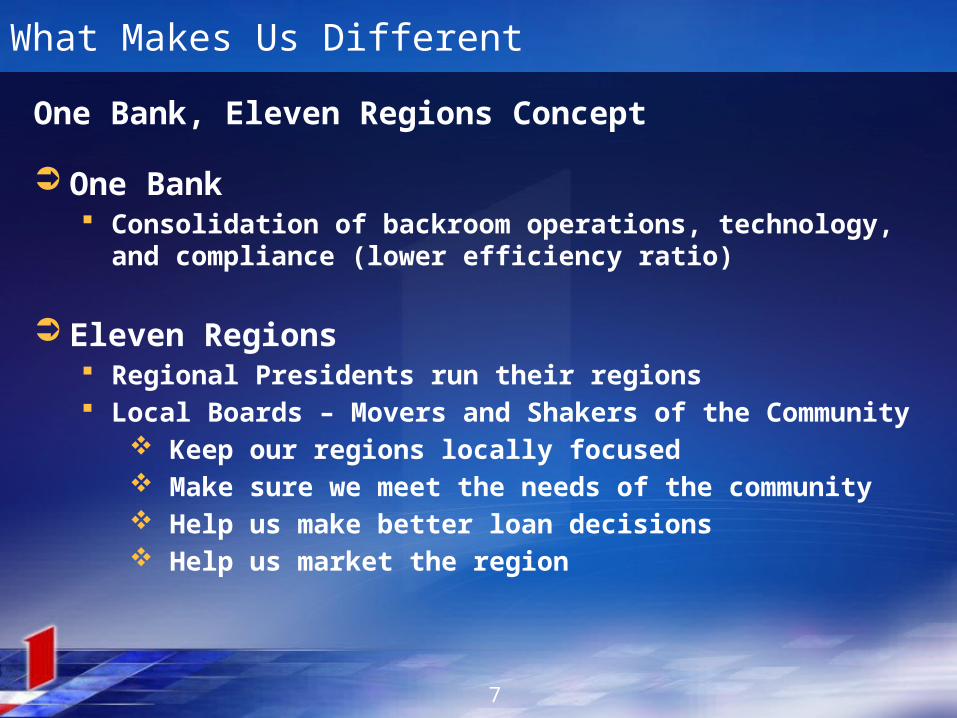
What Makes Us Different
One Bank, Eleven Regions Concept
One Bank Consolidation of backroom operations, technology, and
compliance (lower efficiency ratio)
Eleven Regions Regional Presidents run their regions Local Boards – Movers and Shakers of the Community
Keep our regions locally focused Make sure we meet the needs of the community Help us make better loan decisions Help us market the region

88
FFIN’s Unique Positioning in Texas
Bank Key MarketsComerica DFW, Austin, Houston, California, Michigan, Florida, Mexico
Green Houston, Austin, Dallas (New Public Company – August 2014)
Frost San Antonio, Austin, Corpus Christi, DFW, Rio Grande, West Texas
Independent North and Central Texas
International Bancshares Rio Grande, Houston, San Antonio, Oklahoma
Legacy Texas Dallas
Prosperity Houston, DFW, Austin, West Texas, South Central Texas, and Oklahoma
Southside East Texas
Texas Capital DFW, Austin, San Antonio, and Houston
Triumph Dallas (New Public Company – November 2014)
Veritex Dallas (New Public Company – October 2014)

99
First Bank, N.A. - Conroe Acquisition Consummated July 31, 2015 Montgomery, Walker, & Harris Counties (On I-45 North of Houston)
Exxon Mobil Headquarters in the Woodlands Montgomery County – Approximately 500,000 residents, 55% growth from 2000 to
2010, 24th fastest growing county in the United States #4 Market Share in Conroe – 10.6%
8 Branches in Conroe, Magnolia, Tomball, Cut and Shoot, Montgomery, and Huntsville; additional site on Grand Parkway in Spring, Texas to expand
$374 million in Assets at acquisition date $343 million in deposits $248 million in loans
1.06% Return on Assets in 2014 $61.0 million purchase price of our stock which represents 16x last twelve
months earnings Conroe acquisition is consistent with our acquisition model of high growth areas,
strong management and excellent earnings opportunity Provides diversification and fits well into our footprint Management and Board share same values to outstanding customer service

1010
4Trust Mortgage Acquisition Consummated – May 31, 2015
Originated $175 million in mortgage loans in 2014 – Compared to $225 million that First Financial Bank originated in 2014
15 year old Company with offices in Fort Worth, Dallas and North Richland Hills
$1.9 million purchase price
Troy Fore is now President of Mortgage Division of First Financial Bank; other owners joining First Financial as EVP’s – Tammie Harding, Kami Graves, and Ryan Craig
Considered one of the top mortgage companies in Fort Worth
Are now offering expanded mortgage products and services to customers
10

1212
Texas: Large and Growing
Five most populous states:* Growth (2005 – 2015)
California 39.2 million 8.3%
Texas 27.7 million 21.1%
Florida 20.3 million 14.0%
New York 19.8 million 2.8%
Illinois 12.9 million 0.8%
* U.S. Census Bureau
1313
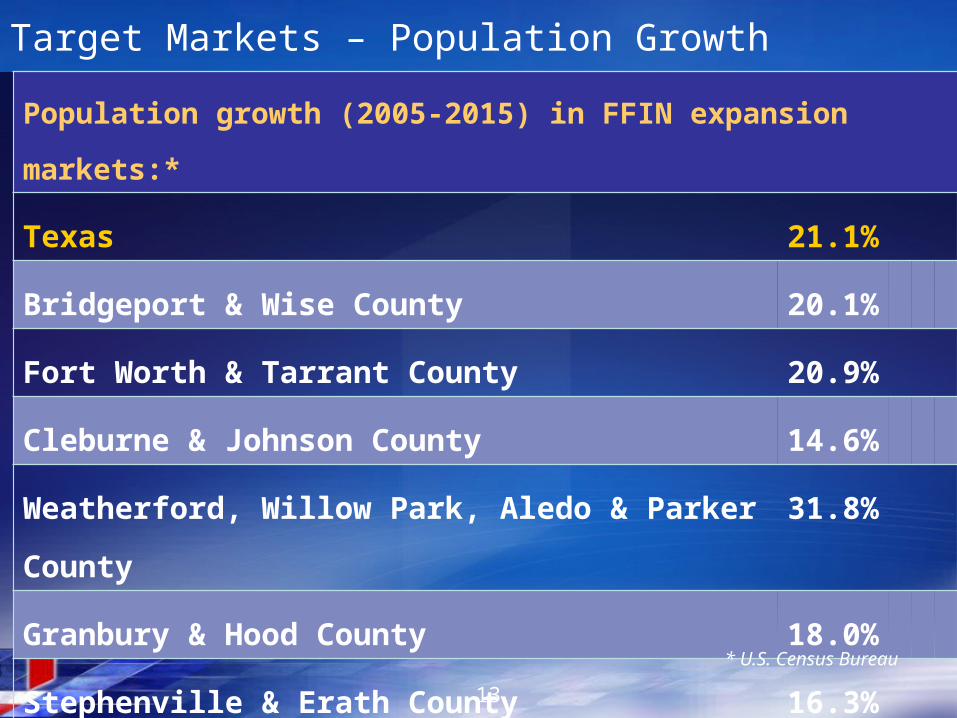
Target Markets – Population Growth
Population growth (2005-2015) in FFIN expansion markets:*
Texas 21.1%
Bridgeport & Wise County 20.1%
Fort Worth & Tarrant County 20.9%
Cleburne & Johnson County 14.6%
Weatherford, Willow Park, Aledo & Parker County 31.8%
Granbury & Hood County 18.0%
Stephenville & Erath County 16.3%
Conroe & Montgomery County 46.0%* U.S. Census Bureau

1414
Core Markets: West Central Texas Markets served benefiting from well-established, long- time customers
REGIONASSET SIZE*
LOCATIONSDEPOSIT
MARKET SHARE**MARKET
SHARE RANK**
First Financial Bank(Abilene, Clyde, Moran, Albany, Odessa
Eastland, Ranger, Rising Star, Cisco,
Sweetwater, Roby, Trent, Merkel)
$2,401M 23 46% 1
First Financial Bank(Hereford)
$186M 1 45% 1
First Financial Bank(San Angelo)
$710M 3 26% 1
TOTALS $3,297M 27
* Data as of 12-31-16** Data as of 06-30-16

1515
Expansion Markets REGION ASSET SIZE* LOCATIONS
DEPOSIT MARKET SHARE**
MARKET SHARE RANK**
First Financial Bank (Cleburne, Burleson, Alvarado)
(Midlothian, Waxahachie)
$524M 42
20%10%
24
First Financial Bank (Southlake, Trophy Club, Keller, Grapevine)
(Bridgeport, Decatur, Boyd)
$452M 43
4%20%
52
First Financial Bank (Stephenville, Granbury, Glen Rose, Acton)
$503M 6 24% 2
First Financial Bank(Weatherford, Aledo, Willow Park, Brock)
$494M 7 23% 1
First Financial Bank(Mineral Wells)
$261M 1 38% 1
First Financial Bank(Ft. Worth)
$64M 1 - -
First Financial Bank(Orange, Mauriceville, Vidor)
(Newton, Port Arthur, Beaumont)
$492M 33
37%3%
17
First Financial Bank (Conroe, Magnolia, Cut and Shoot, Montgomery, Huntsville, Willis, Tomball,
New Waverly)
(Market Share for Huntsville, Conroe, Magnolia, Cut and Shoot, Montgomery and Willis Only)
$587M 9 10% 5
TOTALS $3,377M 43 * Data as of 9-30-16** Data as of 06-30-16

1616
Recent De Novo Growth New Waverly: Branch of Huntsville – August 2014 Beaumont: Branch of Orange – August 2014 Weatherford: I-20 Branch – June 2013 San Angelo: HEB Branch – March 2013 Waxahachie: Branch of Cleburne – December 2012 Abilene: Antilley Road Branch – September 2012 Grapevine: Branch of Southlake – March 2012 Cisco: Branch of Eastland – September 2011 (New Building – Opened August 2016)
Lamesa: Office of Trust Company – April 2011 Odessa: Branch of Abilene – February 2010 (New Building – Opened September 2016)
Fort Worth: Branch of Weatherford – February 2010 Odessa: Office of Trust Company – April 2009 Merkel: Branch of Sweetwater – July 2008 Brock: Branch of Weatherford – March 2008 Acton: Branch of Stephenville – March 2008 Albany: Branch of Abilene – May 2007 Fort Worth: Office of Trust Company – April 2007 (New Building – Opened May 2016)

Fort Worth – Forest Park Blvd. and Rosedale (Opened May 2016)
1716

Fort Worth – Forest Park Blvd. and Rosedale (Opened May 2016)
1817

19
Years with Company Years in Industry
Scott Dueser Chairman of the Board, President & Chief Executive Officer
41 46
Ron Butler Executive Vice President Chief Administrative Officer
24 35
Troy Fore President First Financial Mortgage
1 35
Gary S. Gragg Executive Vice President Lending
26 38
J. Bruce Hildebrand, CPA Executive Vice President Chief Financial Officer
14 38
Monica Houston Executive Vice President Retail Banking & Training
21 21
Executive Management at First Financial
19
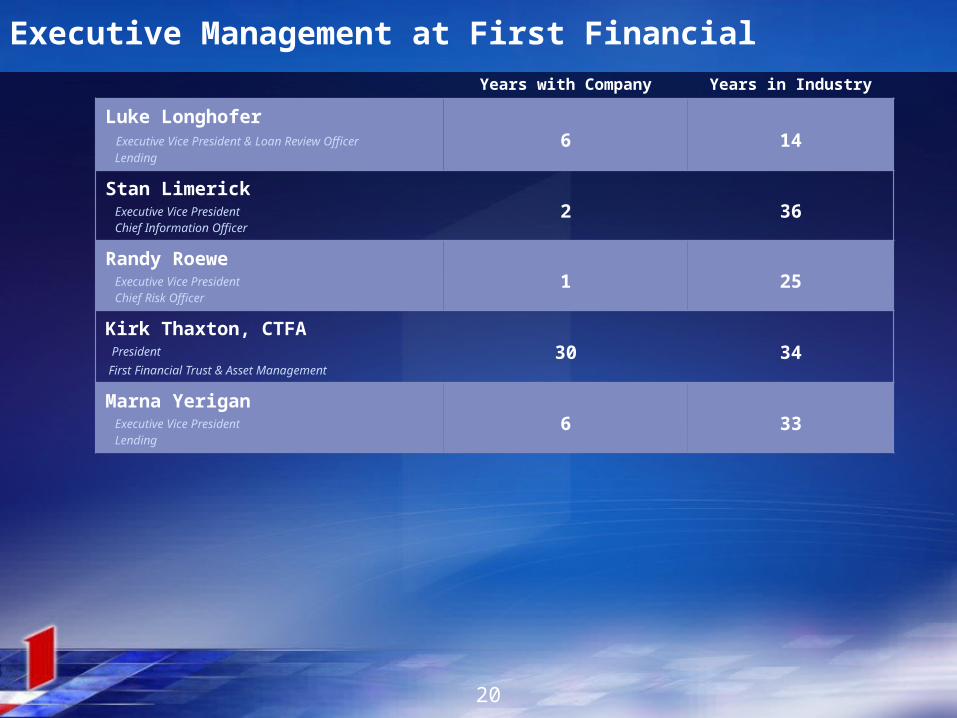
20
Years with Company Years in Industry
Luke Longhofer Executive Vice President & Loan Review Officer Lending
6 14
Stan Limerick Executive Vice President Chief Information Officer
2 36
Randy Roewe Executive Vice President Chief Risk Officer
1 25
Kirk Thaxton, CTFA President First Financial Trust & Asset Management
30 34
Marna Yerigan Executive Vice President Lending
6 33
Executive Management at First Financial
20

21
Years with Company Years in Industry
Brandon Harris Senior Vice President Appraisal Services
3 16
Larry Kentz Senior Vice President & Compliance Officer Compliance
3 36
Michele Stevens Senior Vice President Advertising and Marketing
17 32
Senior Management at First Financial
21

Experienced Regional CEOs & Presidents
22
Years with Company Years in Industry
Marelyn Shedd, Abilene 25 33
Mike Mauldin, Hereford 14 39
Mike Boyd, San Angelo 41 44
Tom O’Neil, Cleburne 18 37
Trent Swearengin, Stephenville 17 19
Jay Gibbs, Weatherford 15 42
Mark Jones, Southlake 16 39
Ken Williamson, Mineral Wells 15 45
Stephen Lee, Southeast Region 4 28
Sam Baker, Conroe 1 40
Martin Noto, Fort Worth 1 33

2323
2011 2012 2013 2014 2015 2016
$4,121$4,502
$5,222
$5,522
$6,665 $6,810Chart Title
Growth in Total Assets
Asset Performance
(in millions)

2424
2011 2012 2013 2014 2015 2016
$1,102 $1,312 $1,362 $1,570 $1,746 $1,718
$2,233$2,321
$2,773$3,180
$3,444 $3,761
Non Interest Bearing Interest Bearing
Deposit Growth
Growth in FFIN Total Deposits (in millions)
$5,479
$3,335$3,633
$4,135
$4,750$5,190

2525
Deposit Products
Time9.3%
Deman
d31.4%
Money
Market46.8%
Sav-ings12.5%

2626
Account Growth
Net Growth in 2012 – 1,219 Accounts
Net Growth in 2013 – 3,308 Accounts*
Net Growth in 2014 – 10,687 Accounts
Net Growth in 2015 – 5,886 Accounts**
Net Growth in 2016 – 3,015 Accounts
December 31, 2012
December 31, 2013
December 31, 2014
December 31, 2015
December 31,2016
Total Number of Accounts
205,282 208,590 234,614 251,699 254,714
*(Excluding Orange Acquisition)**(Excluding Conroe Acquisition)

2727
2011 2012 2013 2014 2015 2016$66 $68 $76 $106 $102 $84
$218 $273 $334 $361 $386 $409 $427
$510 $590 $640 $685 $674
$1,076 $1,238
$1,689 $1,831
$2,178 $2,217
Real Estate
Commercial
Consumer
Agricultural
Loan PerformanceGrowth in FFIN Total Loans (in millions)
$1,787
$2,089
$2,689
$3,384
$2,938
$3,351

2828
Overview of Loan Portfolio Commercial
19.8%Agriculture
2.5%
Consumer12.1%
Real Estate65.6%
Note: Oil & Gas Exposure 2.32%

2929
Residential Development & Construction 8.6%
1-4 Family 45.2%
Commercial Development and Construc-tion
5.3%
Commercial R/E 23.9%
Other R/E 17.0%
Chart Title
Breakdown of R/E Loan Portfolio

3030
Oil & Gas Portfolio Analysis
Oil & Gas Supplemental Information (dollars in thousands)
December 31, 2015 Dec. 31, 2016
Oil & Gas Loans 96,712 78,483
% of Total Loans 2.89% 2.32%
Classified Oil & Gas Loans 34,506 32,518
Non Accrual Oil & Gas Loans 5,404 4,093
Quarter Ended Net Charge-offs 1,370 105
ALLL of % of Oil & Gas 6.35% 6.28%

3131
2011 2012 2013 2014 2015 2016
End of Period 53.6 57.5 65.0 61.8 64.6 61.8
Average Balances
54.6 56.4 64.3 64.1 63.0 64.9
Loan to Deposit Ratio

3232
2011 2012 2013 2014 2015 2016
FirstFinancial 1.64% 1.22% 1.16% 0.74% 0.90% 0.86%
Peer Group 4.59% 3.67% 2.71% 1.92% 1.32% 1.09%**
Sound Lending Practices
Nonperforming assets as a percentage of loans + foreclosed assets (FFIN vs. Peers)
**As of Sept. 30, 2016
3333
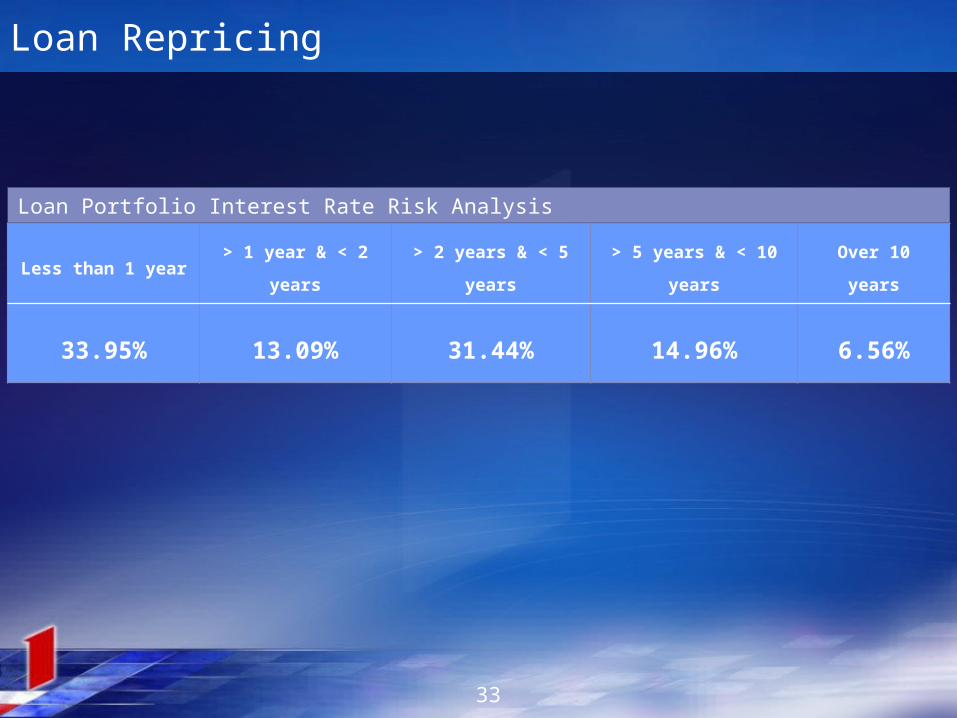
Less than 1 year > 1 year & < 2 years > 2 years & < 5 years > 5 years & < 10 years Over 10 years
33.95% 13.09% 31.44% 14.96% 6.56%
Loan Repricing
Loan Portfolio Interest Rate Risk Analysis

3434
2011 2012 2013 2014 2015 2016
$34,315 $34,839 $33,900$36,824
$41,877$45,779
$6,626$3,484 $3,753 $4,465
$9,685 $10,212
ALLL Provision
Allowance for Loan Losses and Provision for Loan Losses
(in thousands)

3535
Summary of Bond Portfolio
Agencies 4.22% Corporates 1.75%
Muni 53.80%
MBSs 19.42%
CMOs 20.42%
Treasuries 0.39%

3636
2011 2012 2013 2014 2015 2016
$1,912$2,233
$2,465$2,774
$3,060
$3,374Chart Title
Growth in Trust Assets
Total Trust Assets – Book Value (in millions)

3737
2011 2012 2013 2014 2015 2016
$12,671$14,464
$16,317
$18,766 $19,252 $19,636
Total Trust Fees
Growth in FFTAM Fees (in thousands)

3838
2011 2012 2013 2014 2015 2016
$4,176
$5,183
$6,142
$7,109$7,449 $7,190
Total Trust Net Income
Growth in FFTAM Net Income (in thousands)

39
2011 2012 2013 2014 2015 2016
$68.4$74.2
$78.9
$89.6$100.4
$104.8
30th Consecutive Year of Increased Earnings
FFIN Earnings (in millions)
39

40
2011 2012 2013 2014 2015 2016
$1.1$1.2 $1.2
$1.4$1.6 $1.59
Strong Shareholder Earnings
Basic Earnings Per Share
40

41
2012 2013 2014 2015 2016
1.75%1.64% 1.65% 1.61% 1.59%
0.98% 1.04% 0.95% 0.97% 1.00%*
FFIN Outperforms Peers
Percentage Return on Average Assets
Peer
Gro
up
Firs
t Fin
anci
al
41
*As of Sept. 30, 2016

42
2012 2013 2014 2015 2016
13.85% 13.75% 14.00%13.60%
12.36%
8.56% 8.69% 8.32% 8.59% 9.12%*
Strong Return on Capital Percentage Return on Average Equity
Peer
Gro
up
Firs
t Fin
anci
al
42
*As of Sept. 30, 2016

4343
2012 2013 2014 2015 2016
Shareholders’Equity 556,963 587,647 681,537 804,986 837,885
As a Percent of Total Assets
12.37 11.25 11.65 12.08 12.30
Tangible
Capital484,990 490,163 584,178 660,537 694,282
Tier 1
Leverage Ratio10.60 9.84 9.89 9.96 10.71
Common Equity
Tier 1 Capital Ratio17.43 15.82 16.05 15.90 17.40
Tier 1 Capital Ratio 17.43 15.82 16.05 15.90 17.40
Total
Capital Ratio18.68 16.97 17.16 16.97 18.45
Capital & Capital Ratios(dollars in thousands)

44
3rd Qtr. '13
4th Qtr. '13
1st Qtr. '14
2nd Qtr. '14
3rd Qtr. '14
4th Qtr. '14
1st Qtr. '15
2nd Qtr. '15
3rd Qtr. '15
4th Qtr. '15
1st Qtr. '16
2nd Qtr. '16
3rd Qtr. '16
4th Qtr. '16
3.00%
3.25%
3.50%
3.75%
4.00%
4.25%
4.50%
4.75%
5.00%
First Financial Peer Group
Net Interest Margin
Quarterly Interest Margin
44

4545
2011 2012 2013 2014 2015 2016
FirstFinancial 48.37% 48.14% 50.20% 49.24% 47.61% 49.22%
Peer Group 65.57% 65.77% 67.80% 66.94% 63.92% 62.77%**
Working Harder and Smarter
Efficiency Ratio (FFIN vs. Peers)
**As of Sept. 30, 2016

4646
Stock cost in January 2016 $30,170
Dividend declared ($0.70 x 1,000 shares) $ 700
Increase in stock price during 2016($30.17 to $45.20 X 1,000 shares) $15,030
2016 return on investment 52.14%
2015 return on investment 3.05%
2014 return on investment -7.96%
2013 return on investment 72.11%
2012 return on investment 19.65%
5 year compound average return 12.36%
Total Return on Investment
27.79%
Assume you owned 1,000 shares of FFIN stock on January 1, 2016…

4747
Dividends Per Share
2012 2013 2014 2015 2016
$0.50 $0.52 $0.55
$0.62
$0.70
Chart Title
Annual Dividends Declared Per Share
4848
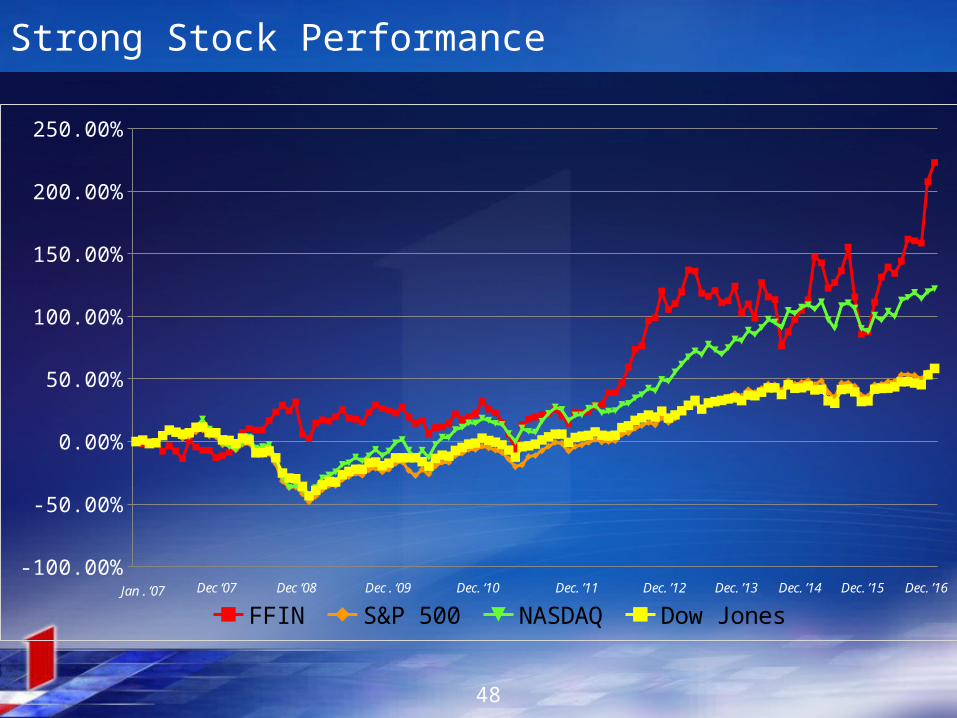
Strong Stock Performance
-100.00%
-50.00%
0.00%
50.00%
100.00%
150.00%
200.00%
250.00%
FFIN S&P 500 NASDAQ Dow JonesJan . ‘07 Dec. ’16Dec . ‘09Dec ‘07 Dec ‘08 Dec. ‘10 Dec. ’11 Dec. ’12 Dec. ’13 Dec. ’14 Dec. ’15

4949
Challenges
Regulatory reform from Washington
Stagnant national economy
Low oil & gas and commodity prices
Low interest rate environment
Maintaining net interest margin

5050
Opportunities
Loan Growth
Mortgage Lending
Trust Services
Treasury Management
Mobile Banking
Lower Efficiency Ratio
Potential Acquisitions