Embed Size (px)
Citation preview
http://itconfidence2014.wordpress.com
Why Can’t People Estimate
2°°°°International Conference on
IT Data collection, Analysis and Benchmarking
Tokyo (Japan) - October 22, 2014
Daniel D. Galorath
Founder & CEO
Estimation Bias and Strategic Mis-Estimation

3IT Confidence 2014 – October 22, 2014 http://itconfidence2014.wordpress.com
Key Points
Estimates can be better, squelching bias & strategic mis-estimation…Parametrics help.
Poor estimates are a root cause of project failure
Experts are likely
providing biased
estimates

4IT Confidence 2014 – October 22, 2014 http://itconfidence2014.wordpress.com
ESTIMATION & PLANNING: An Estimate Defined
An estimate is the most knowledgeable statement you can make at a particular point in time regarding:
Effort / Cost
Schedule
Staffing
Risk
Reliability
Estimates more precise with progress
A WELL FORMED ESTIMATE IS A DISTRIBUTION
4
5IT Confidence 2014 – October 22, 2014 http://itconfidence2014.wordpress.com
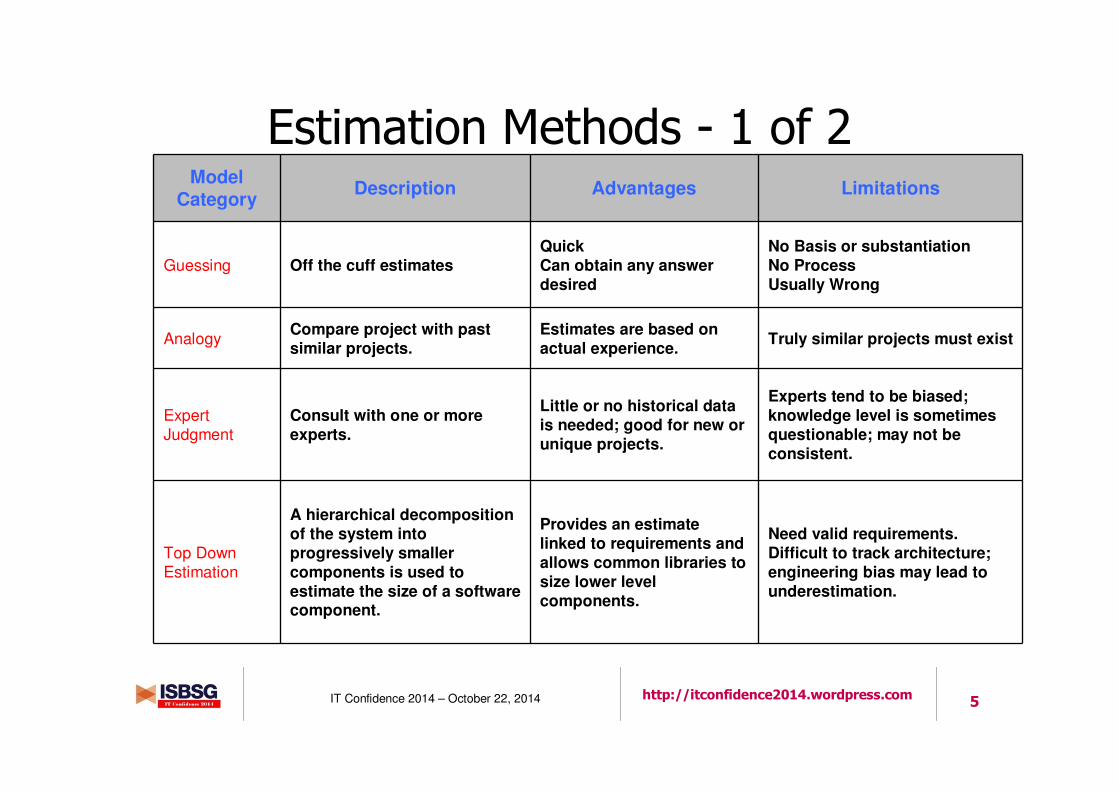
Estimation Methods - 1 of 2Model
CategoryDescription Advantages Limitations
Guessing Off the cuff estimatesQuickCan obtain any answer desired
No Basis or substantiationNo ProcessUsually Wrong
AnalogyCompare project with past similar projects.
Estimates are based on actual experience.
Truly similar projects must exist
Expert Judgment
Consult with one or more experts.
Little or no historical data is needed; good for new or unique projects.
Experts tend to be biased; knowledge level is sometimes questionable; may not be consistent.
Top Down Estimation
A hierarchical decomposition of the system into progressively smaller components is used to estimate the size of a software component.
Provides an estimate linked to requirements and allows common libraries to size lower level components.
Need valid requirements. Difficult to track architecture; engineering bias may lead to underestimation.
6IT Confidence 2014 – October 22, 2014 http://itconfidence2014.wordpress.com
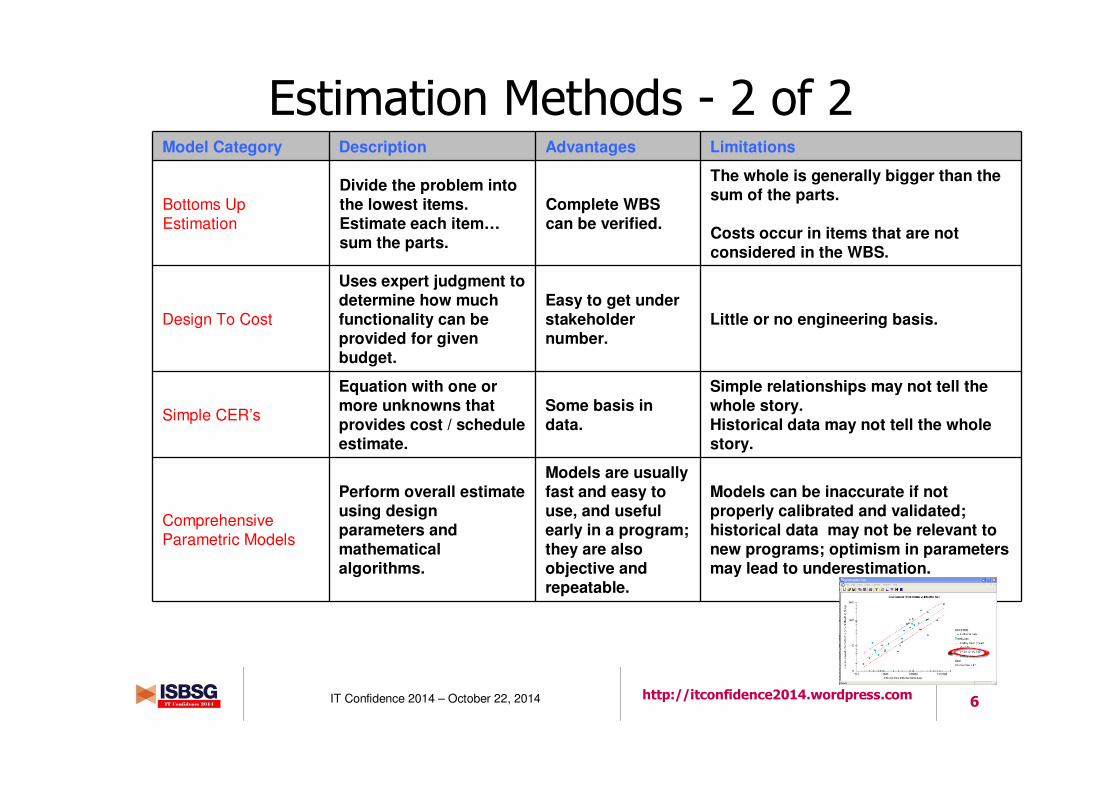
Estimation Methods - 2 of 2Model Category Description Advantages Limitations
Bottoms Up Estimation
Divide the problem into the lowest items. Estimate each item…sum the parts.
Complete WBS can be verified.
The whole is generally bigger than the sum of the parts.
Costs occur in items that are not considered in the WBS.
Design To Cost
Uses expert judgment to determine how much functionality can be provided for given budget.
Easy to get under stakeholder number.
Little or no engineering basis.
Simple CER’s
Equation with one or more unknowns that provides cost / schedule estimate.
Some basis in data.
Simple relationships may not tell the whole story.Historical data may not tell the whole story.
Comprehensive Parametric Models
Perform overall estimate using design parameters and mathematical algorithms.
Models are usually fast and easy to use, and useful early in a program; they are also objective and repeatable.
Models can be inaccurate if not properly calibrated and validated; historical data may not be relevant to new programs; optimism in parameters may lead to underestimation.
7IT Confidence 2014 – October 22, 2014 http://itconfidence2014.wordpress.com
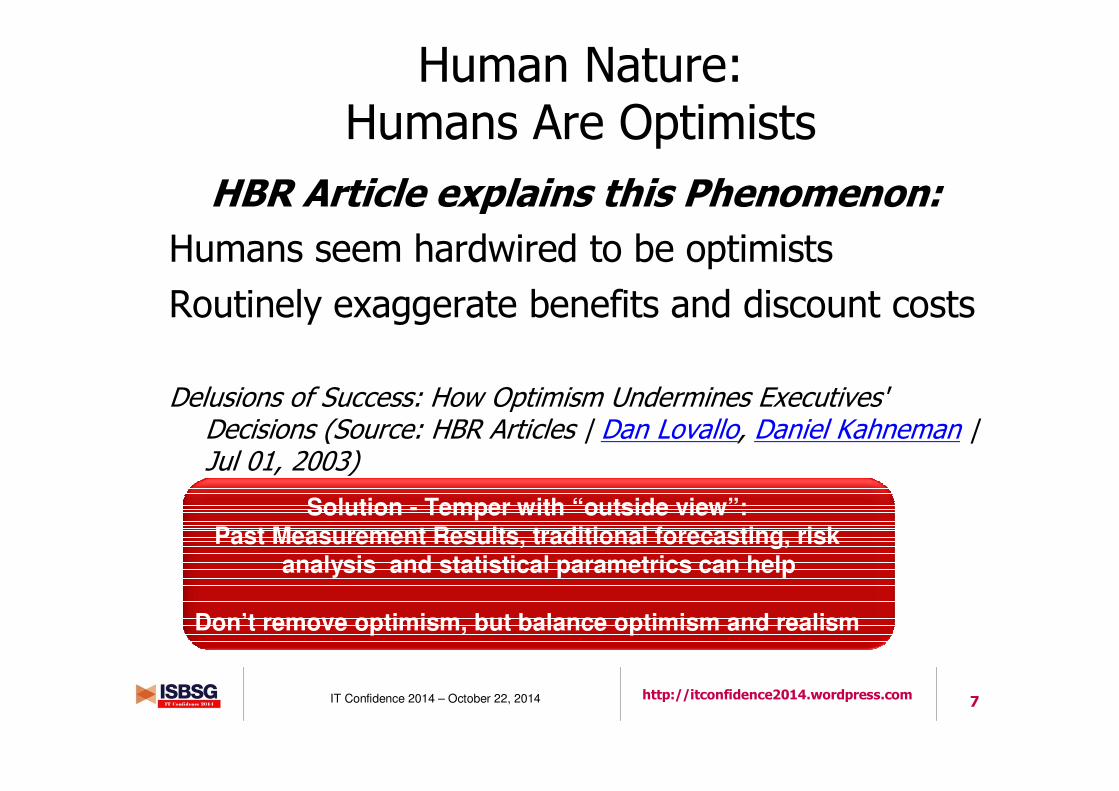
Human Nature: Humans Are Optimists
HBR Article explains this Phenomenon:
Humans seem hardwired to be optimists
Routinely exaggerate benefits and discount costs
Delusions of Success: How Optimism Undermines Executives' Decisions (Source: HBR Articles | Dan Lovallo, Daniel Kahneman | Jul 01, 2003)
Solution - Temper with “outside view”:Past Measurement Results, traditional forecasting, risk
analysis and statistical parametrics can help
Don’t remove optimism, but balance optimism and realism
8IT Confidence 2014 – October 22, 2014 http://itconfidence2014.wordpress.com
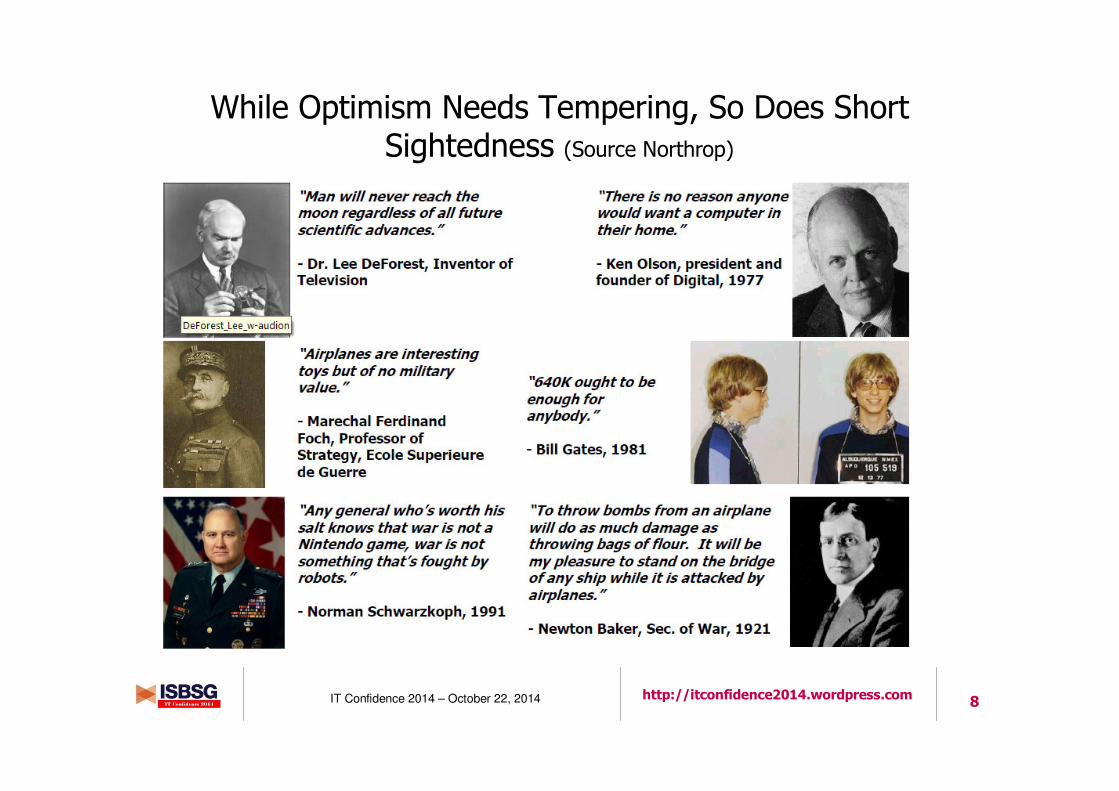
While Optimism Needs Tempering, So Does Short Sightedness (Source Northrop)

9IT Confidence 2014 – October 22, 2014 http://itconfidence2014.wordpress.com
Trouble Starts By Ignoring Iron Triangle Realities
Typical Trouble: Mandated features needed within specific time by given resources
At least one must vary otherwise quality suffers and system may enter impossible zone!
QualityResources Schedule
Scope (features, functionality)
Pick Two
10IT Confidence 2014 – October 22, 2014 http://itconfidence2014.wordpress.com
The Planning Fallacy (Kahneman & Tversky, 1979)
• Judgment errors are systematic & predictable, not random
• Manifesting bias rather than confusion
• Judgment errors made by experts and laypeople alike
• Errors continue when estimators aware of their nature
• Optimistic due to overconfidence ignoring uncertainty• Underestimate costs, schedule, risks
• Overestimate benefits of the same actions
• Root cause: Each new venture viewed as unique
• “inside view” focusing on components rather than outcomes of similar completed actions
• FACT: Typically past more similar assumed
• even ventures may appear entirely different
11IT Confidence 2014 – October 22, 2014 http://itconfidence2014.wordpress.com
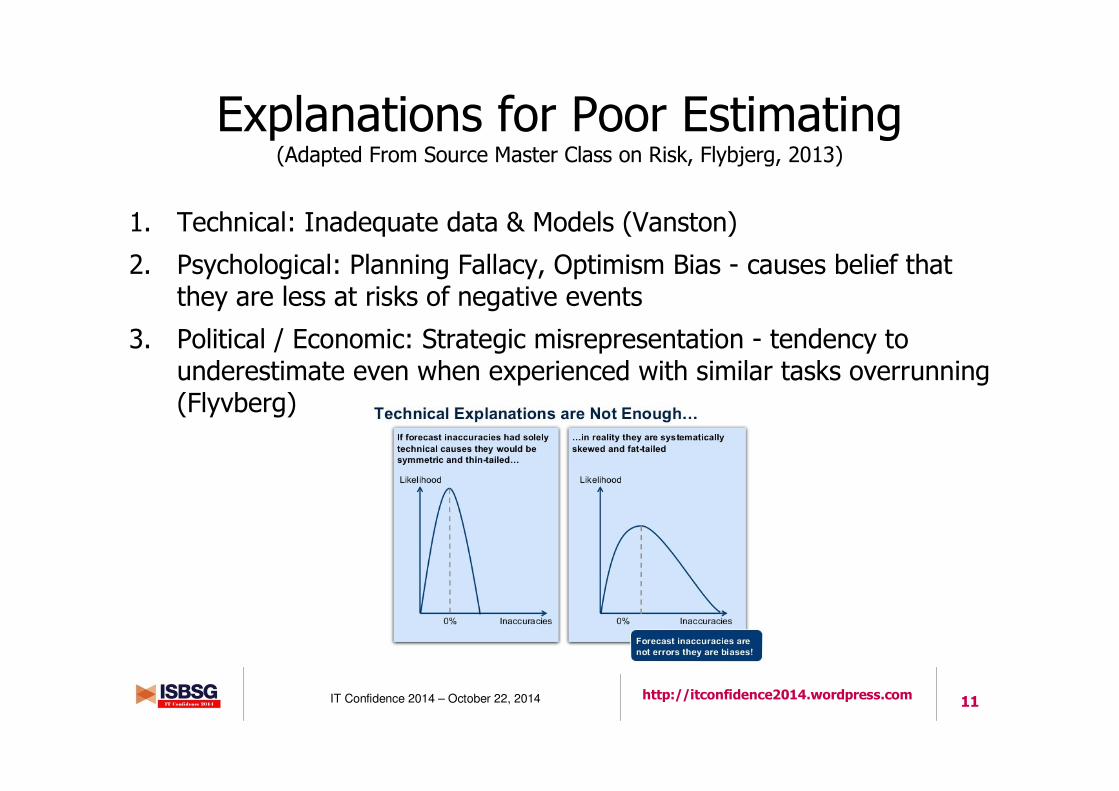
Explanations for Poor Estimating (Adapted From Source Master Class on Risk, Flybjerg, 2013)
1. Technical: Inadequate data & Models (Vanston)
2. Psychological: Planning Fallacy, Optimism Bias - causes belief that they are less at risks of negative events
3. Political / Economic: Strategic misrepresentation - tendency to underestimate even when experienced with similar tasks overrunning (Flyvberg)
12IT Confidence 2014 – October 22, 2014 http://itconfidence2014.wordpress.com
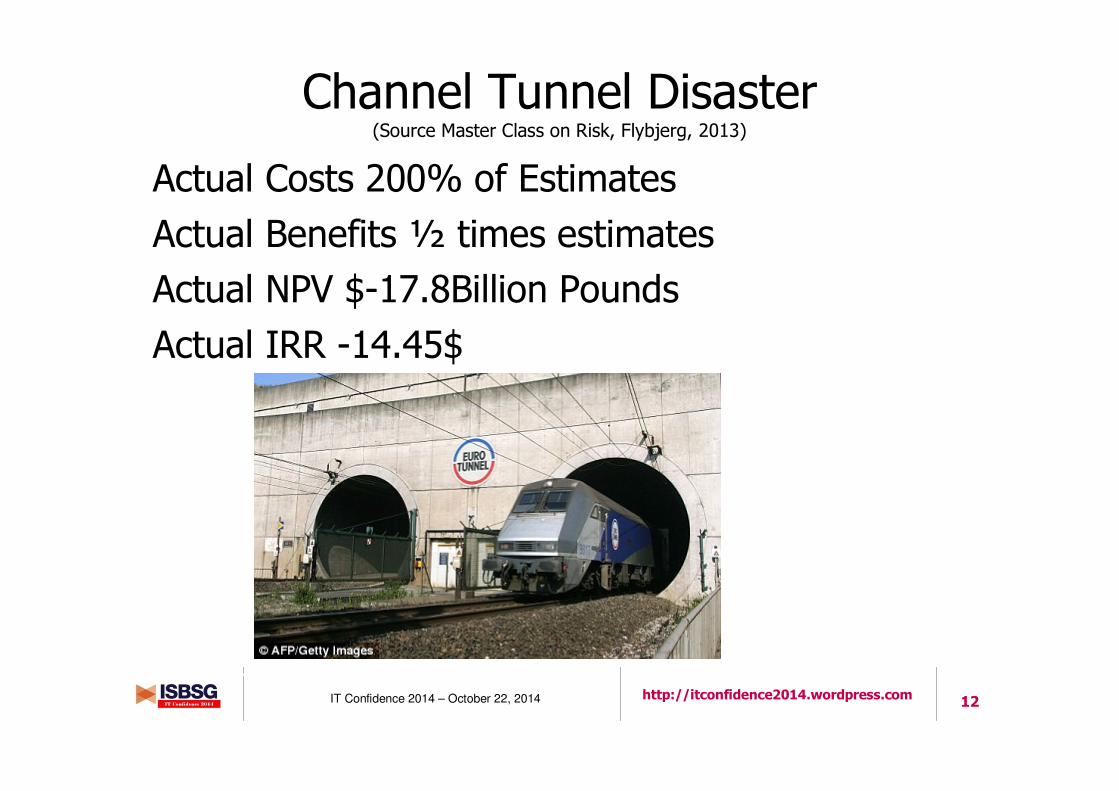
Channel Tunnel Disaster (Source Master Class on Risk, Flybjerg, 2013)
Actual Costs 200% of Estimates
Actual Benefits ½ times estimates
Actual NPV $-17.8Billion Pounds
Actual IRR -14.45$
Perform Business Case BUT Eliminate over-optimismin costs and over-optimism in benefit
13IT Confidence 2014 – October 22, 2014 http://itconfidence2014.wordpress.com
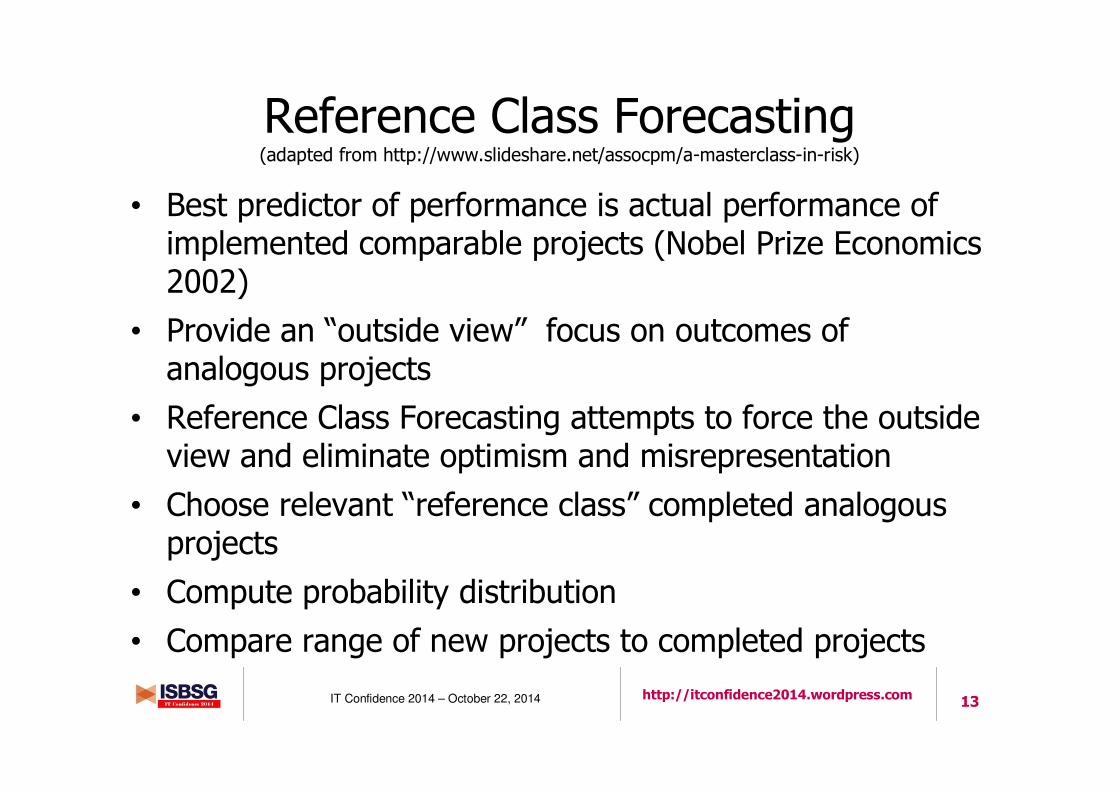
Reference Class Forecasting (adapted from http://www.slideshare.net/assocpm/a-masterclass-in-risk)
• Best predictor of performance is actual performance of implemented comparable projects (Nobel Prize Economics 2002)
• Provide an “outside view” focus on outcomes of analogous projects
• Reference Class Forecasting attempts to force the outside view and eliminate optimism and misrepresentation
• Choose relevant “reference class” completed analogous projects
• Compute probability distribution
• Compare range of new projects to completed projects
14IT Confidence 2014 – October 22, 2014 http://itconfidence2014.wordpress.com
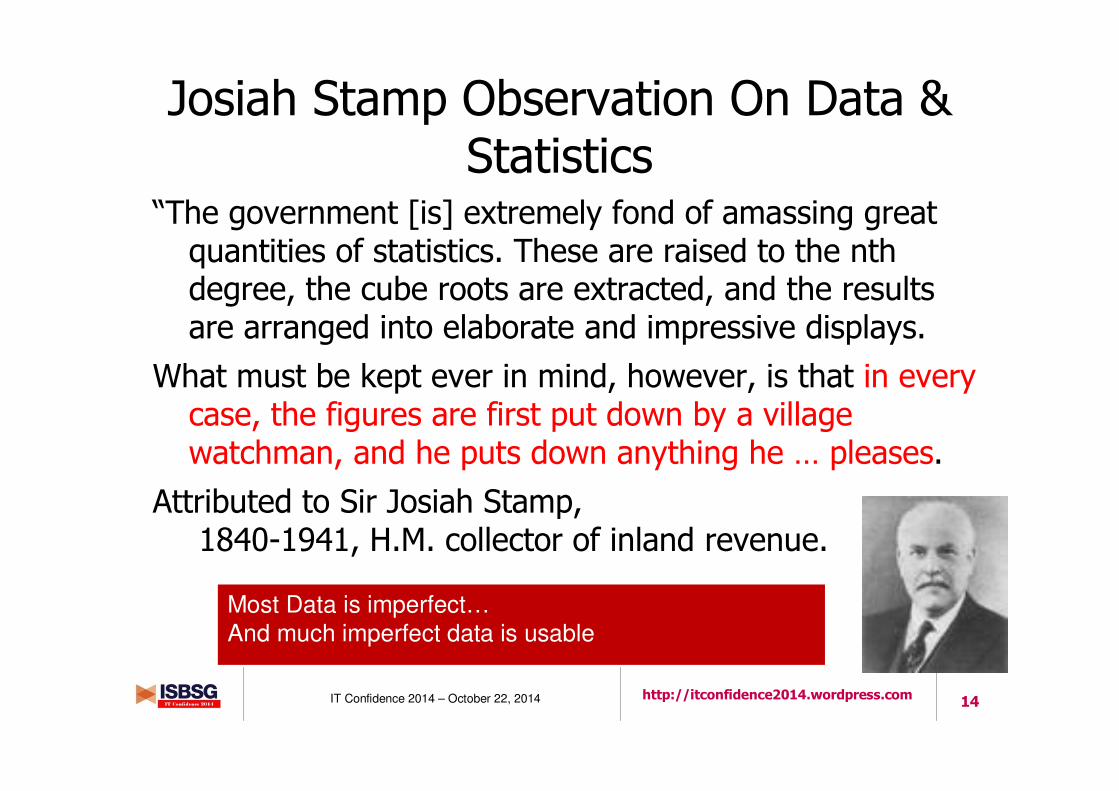
Josiah Stamp Observation On Data & Statistics
“The government [is] extremely fond of amassing great quantities of statistics. These are raised to the nth degree, the cube roots are extracted, and the results are arranged into elaborate and impressive displays.
What must be kept ever in mind, however, is that in every case, the figures are first put down by a village watchman, and he puts down anything he … pleases.
Attributed to Sir Josiah Stamp,1840-1941, H.M. collector of inland revenue.
Most Data is imperfect…And much imperfect data is usable
15IT Confidence 2014 – October 22, 2014 http://itconfidence2014.wordpress.com
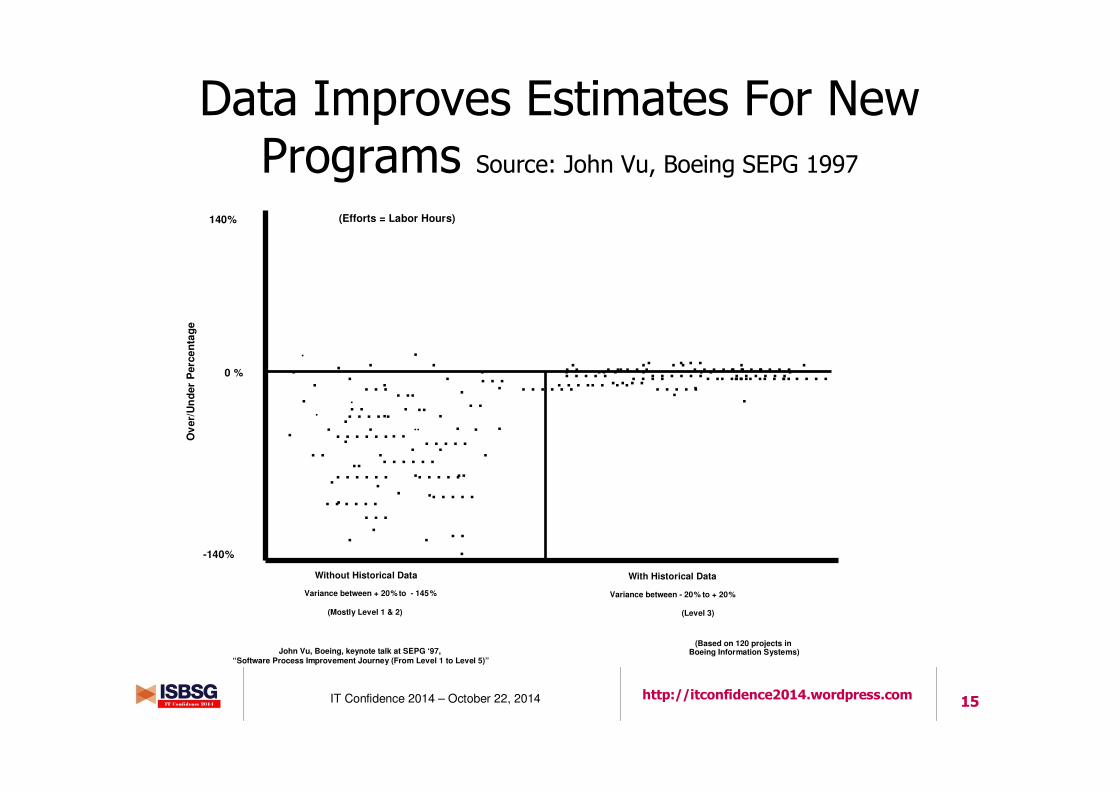
Data Improves Estimates For New Programs Source: John Vu, Boeing SEPG 1997
.
0 %
140%
-140%
..
..
.
..
..
.
..
.
. .
. . . .
.
. . .
. .
.
.
. . . .. . . . . . . ...
. . . .. .
.
. .
. ..
.
.
.
. .. .. ...... . .. . ... . ...
.. .
.
Without Historical Data With Historical Data
Variance between + 20% to - 145% Variance between - 20% to + 20%
(Efforts = Labor Hours)
(Mostly Level 1 & 2) (Level 3)
Ov
er/
Un
der
Perc
en
tag
e
.
(Based on 120 projects in Boeing Information Systems)
.
. . .
.
.
..
..
.
. .
..
.
.
. .
.
.
.. .
. . .. . . . . .. . . . . .. .
..
. . .. . .. . . .
. . . .. . . . .
. . . . .
. . . . .. . . . . .
. . . . .. . . . . .
. . . . . .. . . . . . . .
. . .. . . . .
. . . . .. . . .
. . . . . .
. . . . . .
. . . . . .
John Vu, Boeing, keynote talk at SEPG ‘97, “Software Process Improvement Journey (From Level 1 to Level 5)”

16IT Confidence 2014 – October 22, 2014 http://itconfidence2014.wordpress.com
SRDR Estimate New SLOC vs Actual (Note: HUGE outliers removed to make the graph more readable)

17IT Confidence 2014 – October 22, 2014 http://itconfidence2014.wordpress.com
Correlation Doesn’t Always Mean Causation (Source: www.memolition.com)
18IT Confidence 2014 – October 22, 2014 http://itconfidence2014.wordpress.com
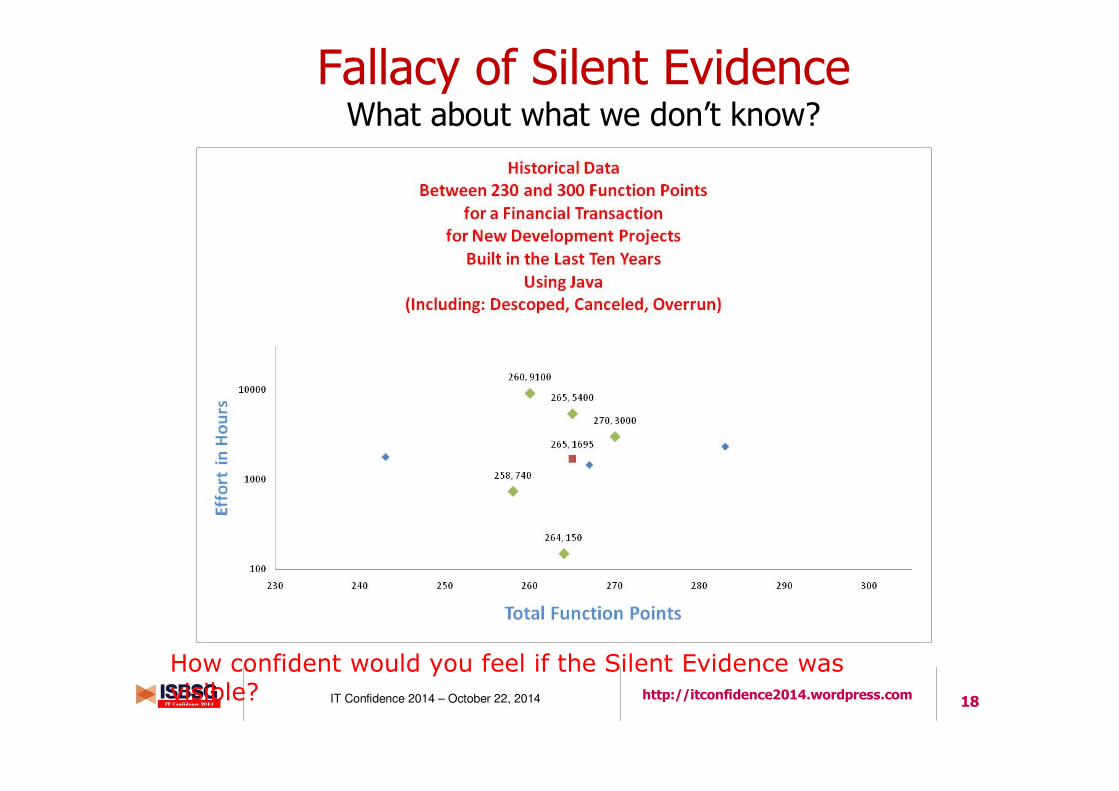
Fallacy of Silent EvidenceWhat about what we don’t know?
How confident would you feel if the Silent Evidence was visible?
19IT Confidence 2014 – October 22, 2014 http://itconfidence2014.wordpress.com
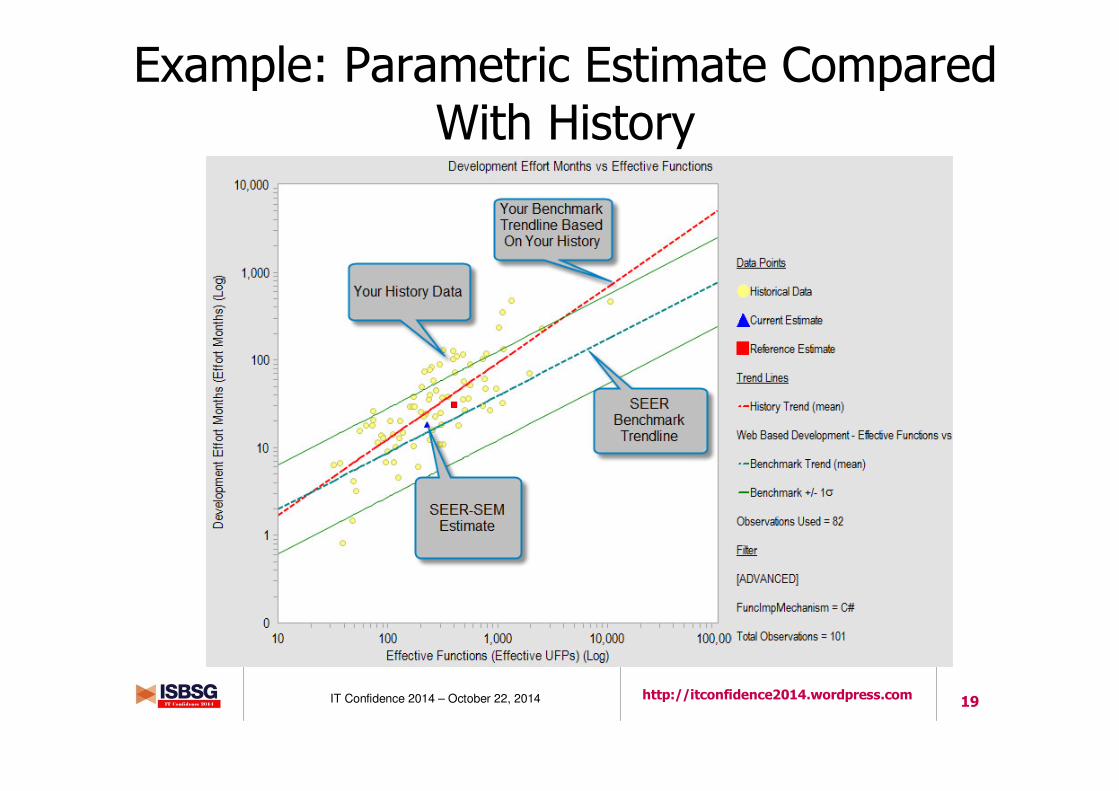
Example: Parametric Estimate Compared With History
20IT Confidence 2014 – October 22, 2014 http://itconfidence2014.wordpress.com
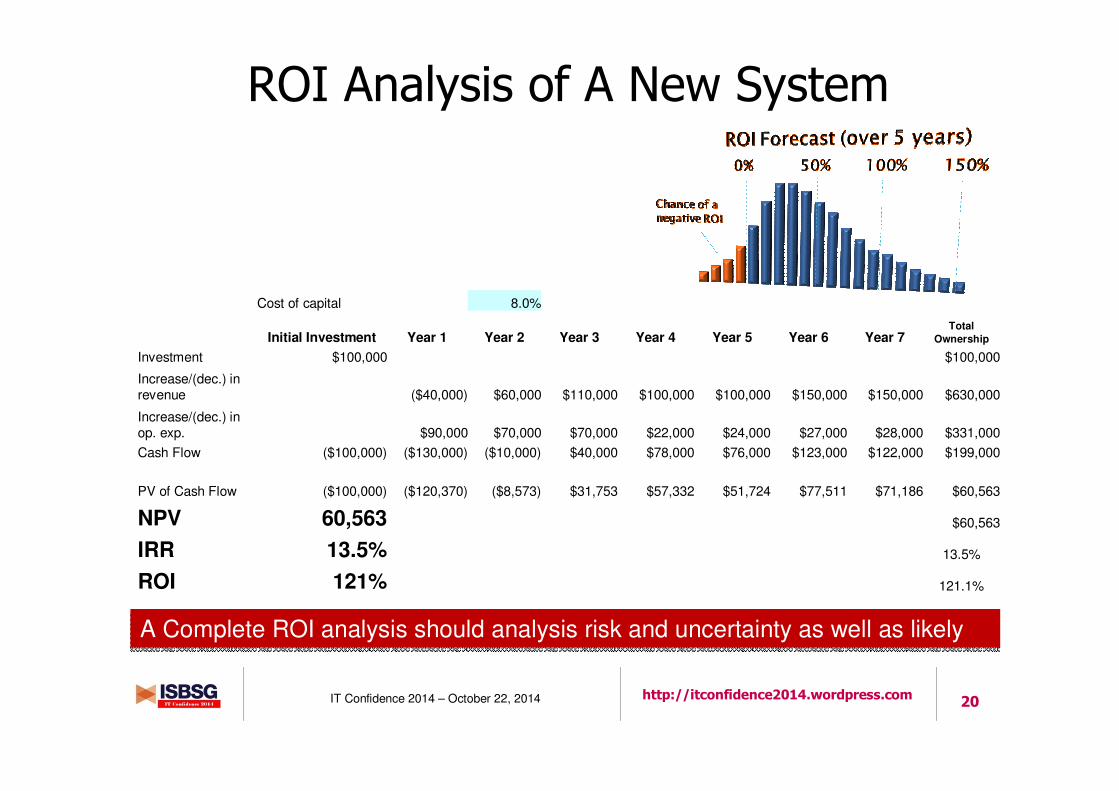
ROI Analysis of A New System
Cost of capital 8.0%
Initial Investment Year 1 Year 2 Year 3 Year 4 Year 5 Year 6 Year 7Total
Ownership
Investment $100,000 $100,000
Increase/(dec.) in revenue ($40,000) $60,000 $110,000 $100,000 $100,000 $150,000 $150,000 $630,000
Increase/(dec.) in op. exp. $90,000 $70,000 $70,000 $22,000 $24,000 $27,000 $28,000 $331,000
Cash Flow ($100,000) ($130,000) ($10,000) $40,000 $78,000 $76,000 $123,000 $122,000 $199,000
PV of Cash Flow ($100,000) ($120,370) ($8,573) $31,753 $57,332 $51,724 $77,511 $71,186 $60,563
NPV 60,563 $60,563
IRR 13.5% 13.5%
ROI 121% 121.1%
A Complete ROI analysis should analysis risk and uncertainty as well as likelyA Complete ROI analysis should analysis risk and uncertainty as well as likely
21IT Confidence 2014 – October 22, 2014 http://itconfidence2014.wordpress.com
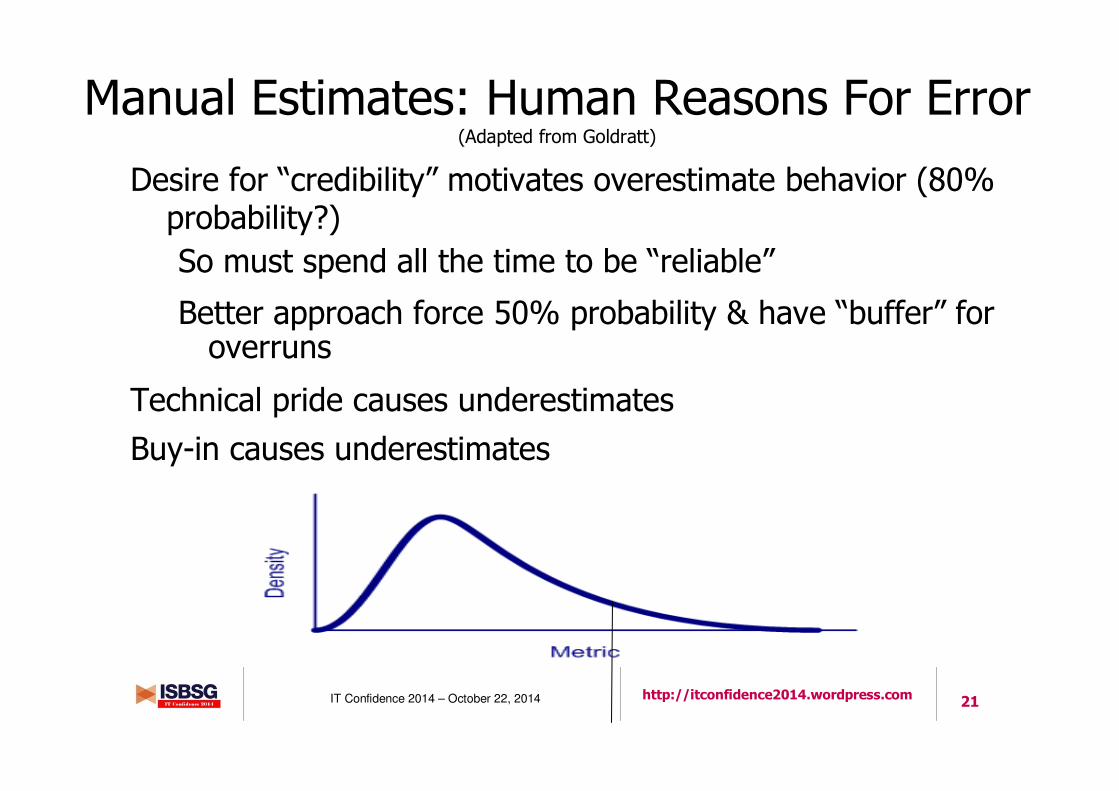
Manual Estimates: Human Reasons For Error (Adapted from Goldratt)
Desire for “credibility” motivates overestimate behavior (80% probability?)
So must spend all the time to be “reliable”
Better approach force 50% probability & have “buffer” for overruns
Technical pride causes underestimates
Buy-in causes underestimates
21
22IT Confidence 2014 – October 22, 2014 http://itconfidence2014.wordpress.com
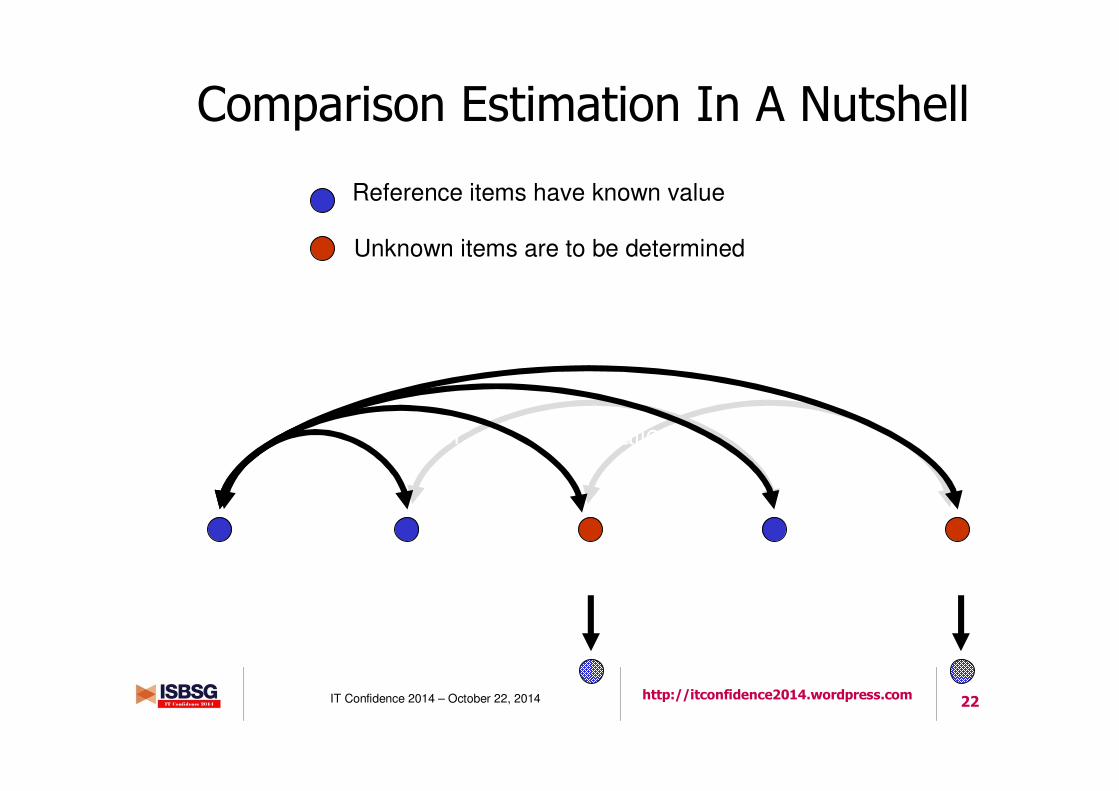
Comparison Estimation In A Nutshell
Reference item Reference item Reference itemUnknown item Unknown item
Reference items have known value
Unknown items are to be determined
Gross ratios between reference and unknown item pairings are made
“SlightlyBigger”
“MuchSmaller”
“Bigger” “Smaller”
23IT Confidence 2014 – October 22, 2014 http://itconfidence2014.wordpress.com
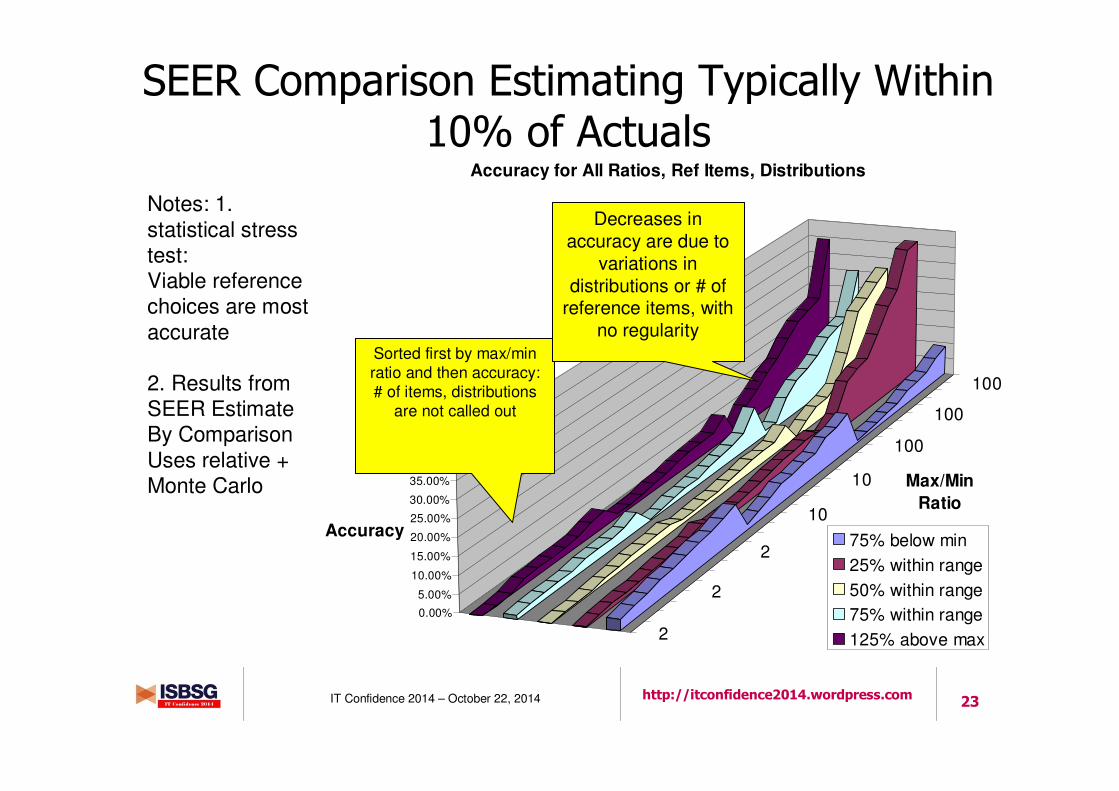
SEER Comparison Estimating Typically Within 10% of Actuals
2
2
2
10
10
100
100
100
0.00%
5.00%
10.00%
15.00%
20.00%
25.00%
30.00%
35.00%
40.00%
45.00%
Accuracy
Max/Min
Ratio
Accuracy for All Ratios, Ref Items, Distributions
75% below min
25% within range
50% within range
75% within range
125% above max
Sorted first by max/min ratio and then accuracy: # of items, distributions
are not called out
Decreases in accuracy are due to
variations in distributions or # of
reference items, with no regularity
Notes: 1. statistical stress test: Viable reference choices are most accurate
2. Results from SEER Estimate By ComparisonUses relative + Monte Carlo
24IT Confidence 2014 – October 22, 2014 http://itconfidence2014.wordpress.com
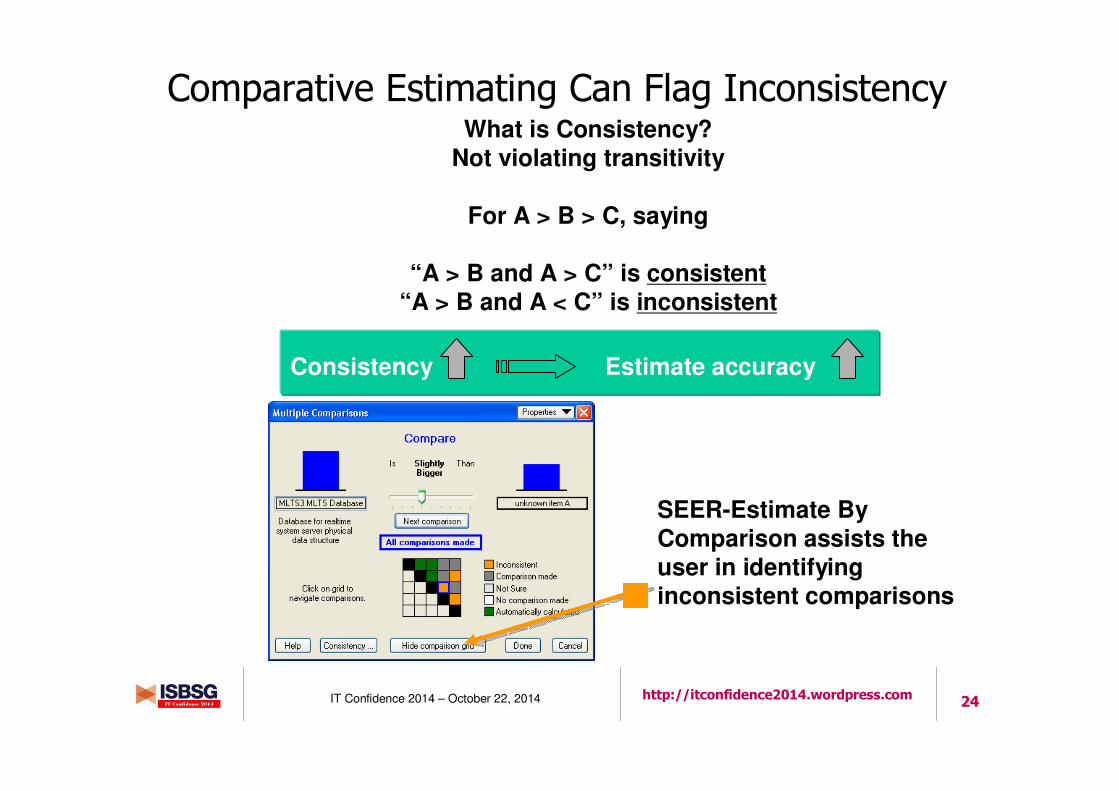
Comparative Estimating Can Flag InconsistencyWhat is Consistency?
Not violating transitivity
For A > B > C, saying
“A > B and A > C” is consistent“A > B and A < C” is inconsistent
Consistency Estimate accuracy
SEER-Estimate By Comparison assists the user in identifying inconsistent comparisons
25IT Confidence 2014 – October 22, 2014 http://itconfidence2014.wordpress.com
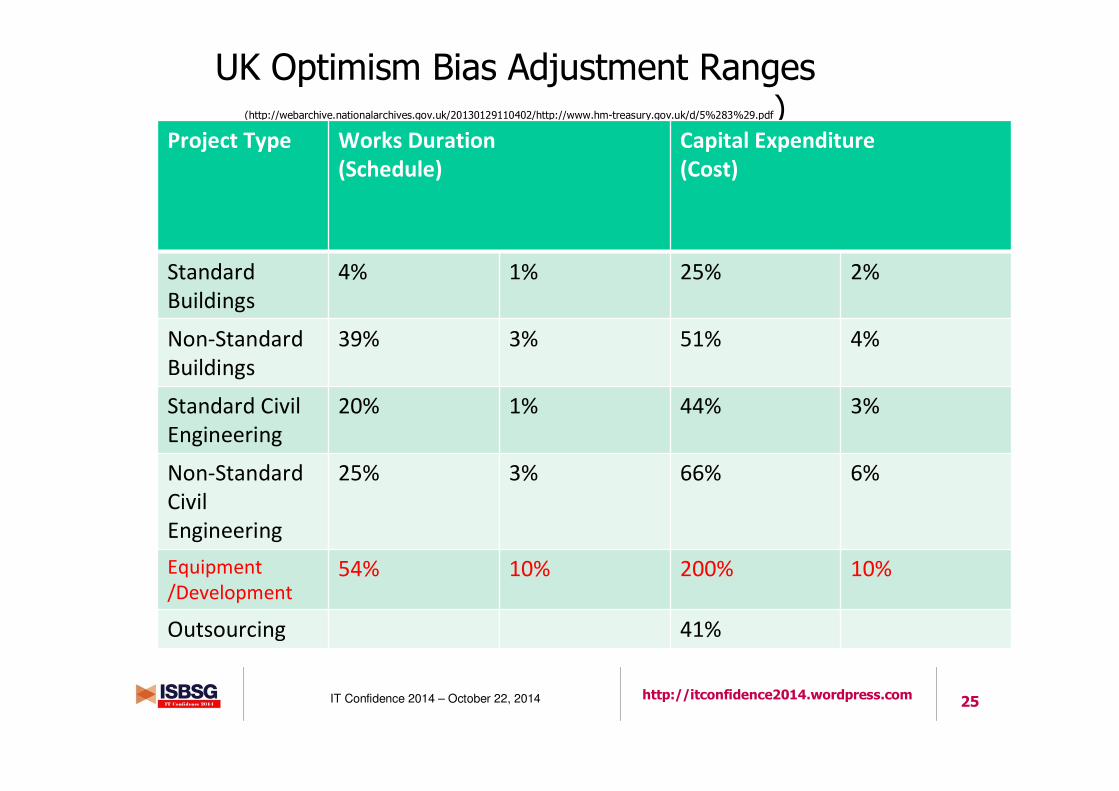
UK Optimism Bias Adjustment Ranges (http://webarchive.nationalarchives.gov.uk/20130129110402/http://www.hm-treasury.gov.uk/d/5%283%29.pdf)
Project Type Works Duration
(Schedule)
Capital Expenditure
(Cost)
Standard
Buildings
4% 1% 25% 2%
Non-Standard
Buildings
39% 3% 51% 4%
Standard Civil
Engineering
20% 1% 44% 3%
Non-Standard
Civil
Engineering
25% 3% 66% 6%
Equipment
/Development54% 10% 200% 10%
Outsourcing 41%
26IT Confidence 2014 – October 22, 2014 http://itconfidence2014.wordpress.com
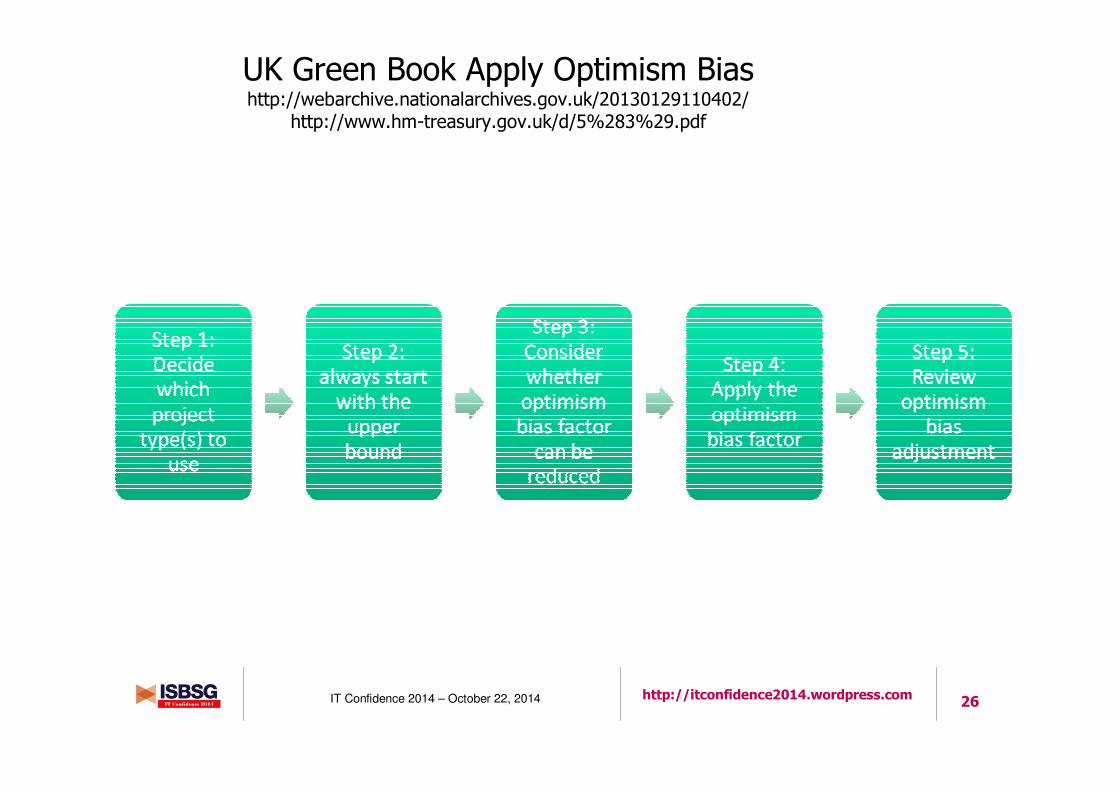
UK Green Book Apply Optimism Bias http://webarchive.nationalarchives.gov.uk/20130129110402/
http://www.hm-treasury.gov.uk/d/5%283%29.pdf
27IT Confidence 2014 – October 22, 2014 http://itconfidence2014.wordpress.com
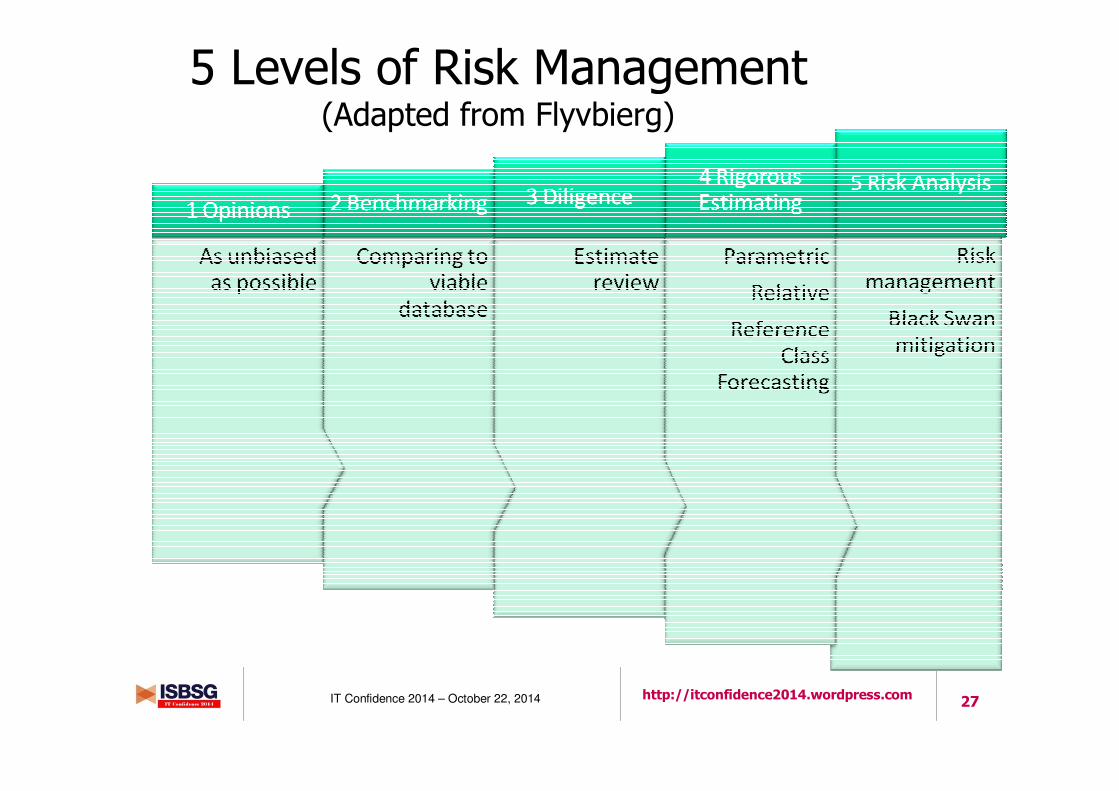
5 Levels of Risk Management (Adapted from Flyvbierg)
28IT Confidence 2014 – October 22, 2014 http://itconfidence2014.wordpress.com
Myth and Reality (Source Hamaker)
Myth: The more details, the better the estimate!If a 100 WBS element is good…
Then 1000 elements if better still…
And 10 elements is to be sneered at…
And if it is “parametric” it is worse yet
But on the contrary, if one simply wants to know what a project might cost, details are counterproductive!
And parametric estimating is the preferred choice
See next charts for
substantiating arguments

29IT Confidence 2014 – October 22, 2014 http://itconfidence2014.wordpress.com
10/10/2014
Comparison of Parametric & Bottoms Up Methods
(Source Hamaker)Parametric Estimates
� Top down� Less detail� Based on performance metrics
� Less labor intensive� Quicker� Ease of trade-offs analyses� Parametric database� Not always accepted
� “Black Magic” aura� Generally more disciplined
• Standard methodology• Independent• Done by trained analysts• Captures totality of past
programs
Detailed Build-Up Estimates*
� Bottoms up
� More detail � Based on time and material� Labor intensive� Time consuming� Trade offs need details
� Performance standards� Accepted method� Generally understood� More susceptible to distortions
• Optimism/Pessimism• Special interest/buy-in• Done by managers/engineers• Missing
- “I forgots”- Unknowns
*AKA “labor-material build up”, “grass roots”, “bottoms up” “engineering estimates”
30IT Confidence 2014 – October 22, 2014 http://itconfidence2014.wordpress.com
30
31IT Confidence 2014 – October 22, 2014 http://itconfidence2014.wordpress.com
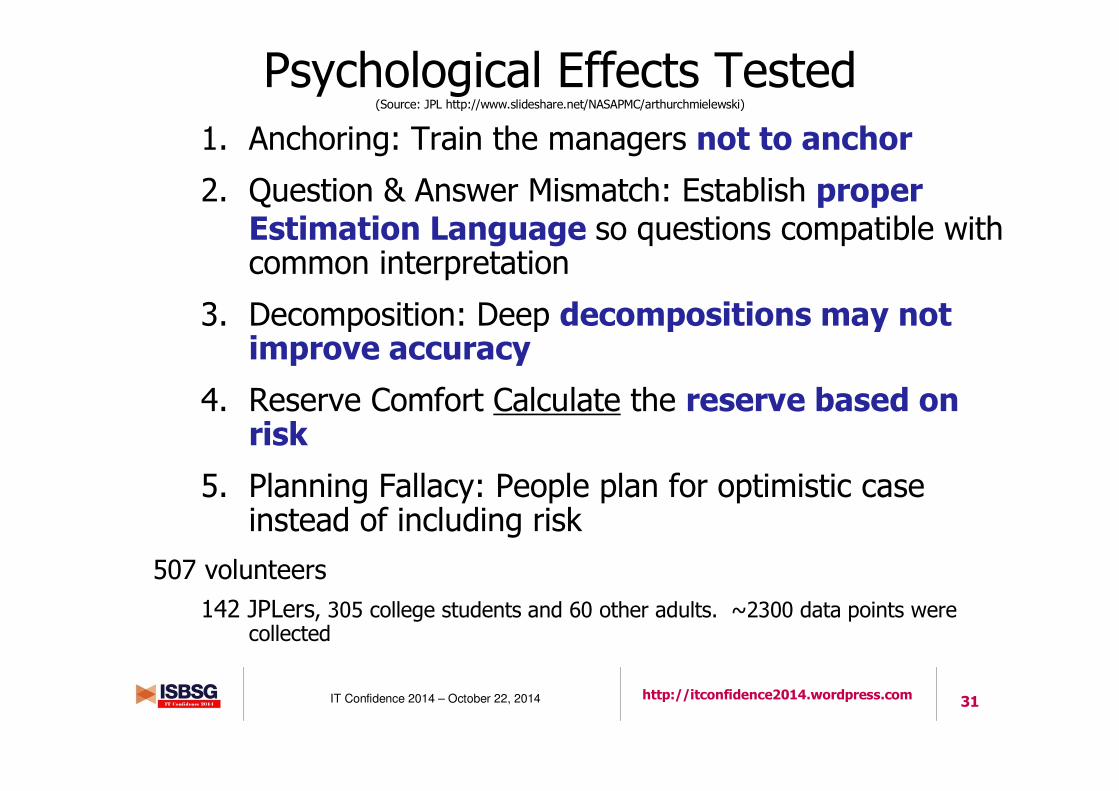
Psychological Effects Tested (Source: JPL http://www.slideshare.net/NASAPMC/arthurchmielewski)
1. Anchoring: Train the managers not to anchor
2. Question & Answer Mismatch: Establish proper Estimation Language so questions compatible with common interpretation
3. Decomposition: Deep decompositions may not improve accuracy
4. Reserve Comfort Calculate the reserve based on risk
5. Planning Fallacy: People plan for optimistic case instead of including risk
507 volunteers
142 JPLers, 305 college students and 60 other adults. ~2300 data points were collected
32IT Confidence 2014 – October 22, 2014 http://itconfidence2014.wordpress.com
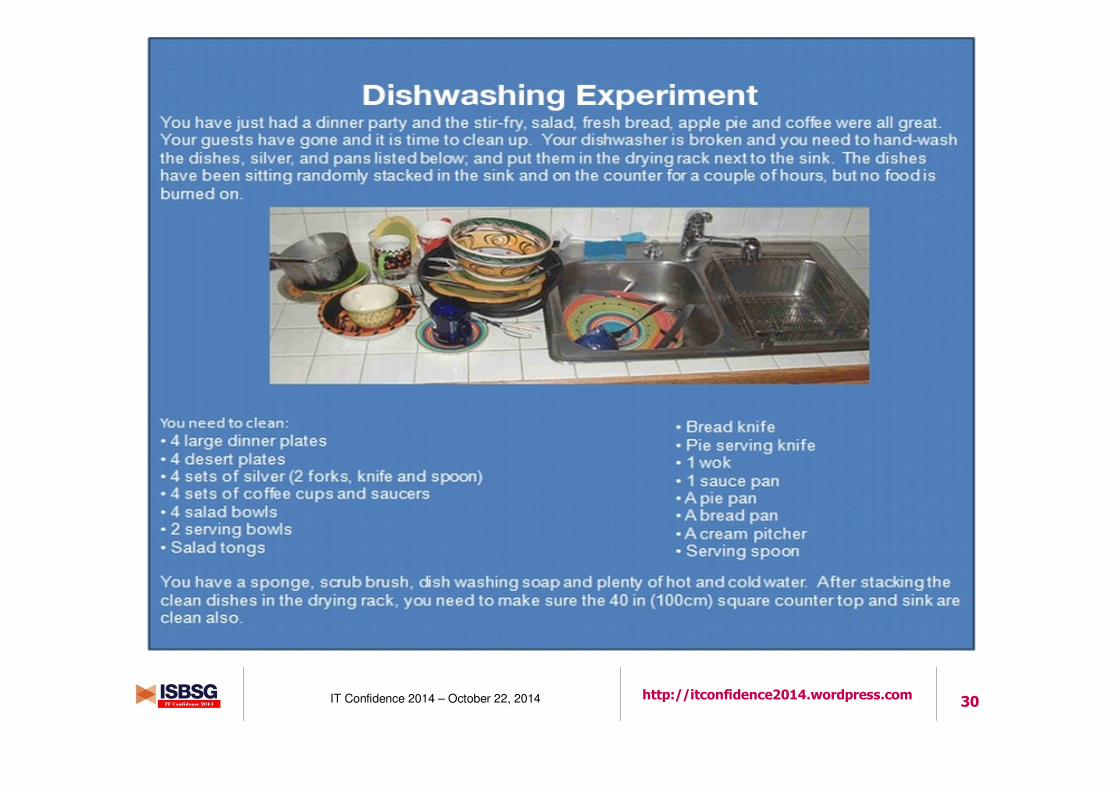
Anchoring Causes Flawed EstimatesObjective: Test how easily influenced people may be by wrong answer – “the anchor.”
The anchor set asked:
“Estimate how many minutes it will take you to clean the kitchen. One respondent estimated that it will take about 10 minutes to finish cleaning
up. He may be wrong of course.”
Nominal 30 min, anchored case 25 min
Best case estimate was 27 min
2 min LONGER than the anchored result
Conclusion: easy to dramatically skew estimates by asking anchored questions, such as:
“We would like you to come in around $6M”
“I have a target of $400k for you”
“the last robot arm we built cost $7M”…
33IT Confidence 2014 – October 22, 2014 http://itconfidence2014.wordpress.com
Question & Answer Mismatch (Source: JPL http://www.slideshare.net/NASAPMC/arthurchmielewski)
Test for mismatch between expected and provided
Different participants were asked:
“Estimate how many minutes it will take you to clean the whole kitchen”
There is a 50% chance you will finish within __ min
There is a 75% chance you will finish within __ min
There is a 99% chance you will finish within __ min
50% confidence estimate 31 min
nominal estimate 30 min
People interpret nominal 50% case (Meaning you will exceed estimate in half the cases)
But manager probably more reliable result, probably in the 70%-90% confidence range…
This is why we say a complete estimate must include a probability
34IT Confidence 2014 – October 22, 2014 http://itconfidence2014.wordpress.com
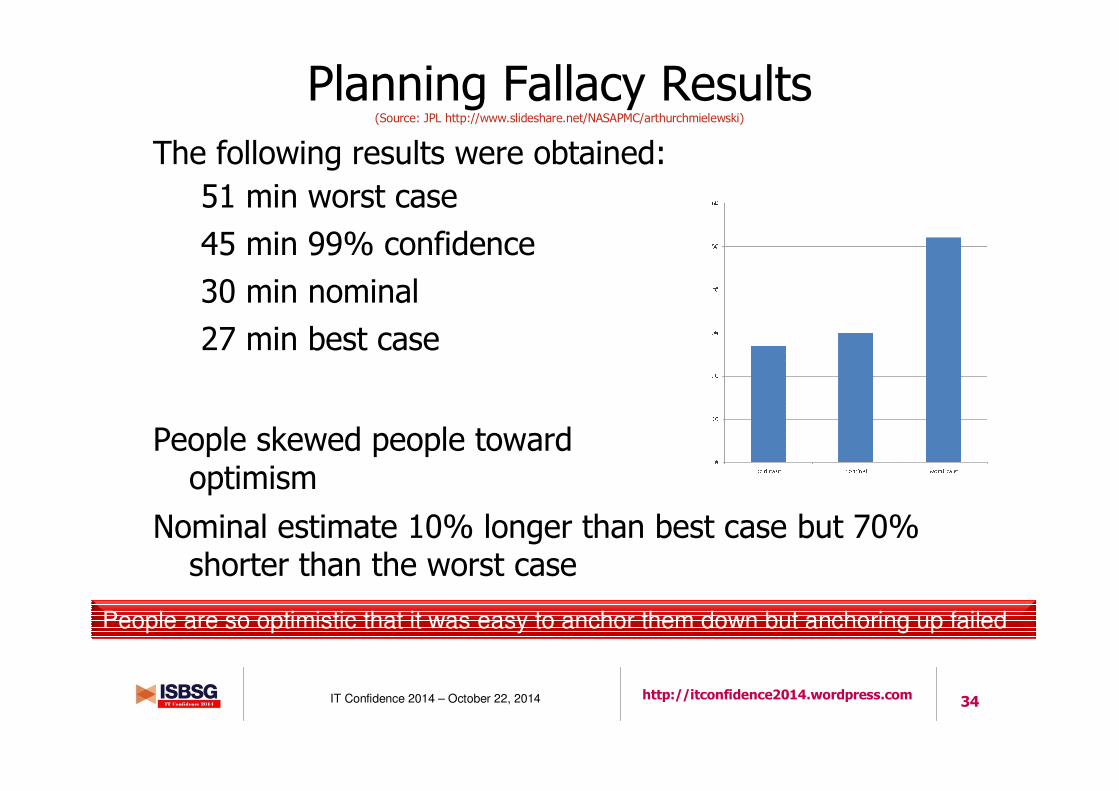
Planning Fallacy Results (Source: JPL http://www.slideshare.net/NASAPMC/arthurchmielewski)
The following results were obtained:
51 min worst case
45 min 99% confidence
30 min nominal
27 min best case
People skewed people towardoptimism
Nominal estimate 10% longer than best case but 70% shorter than the worst case
People are so optimistic that it was easy to anchor them down but anchoring up failed

35IT Confidence 2014 – October 22, 2014 http://itconfidence2014.wordpress.com
Answers Analysis (Source: JPL http://www.slideshare.net/NASAPMC/arthurchmielewski)
36IT Confidence 2014 – October 22, 2014 http://itconfidence2014.wordpress.com
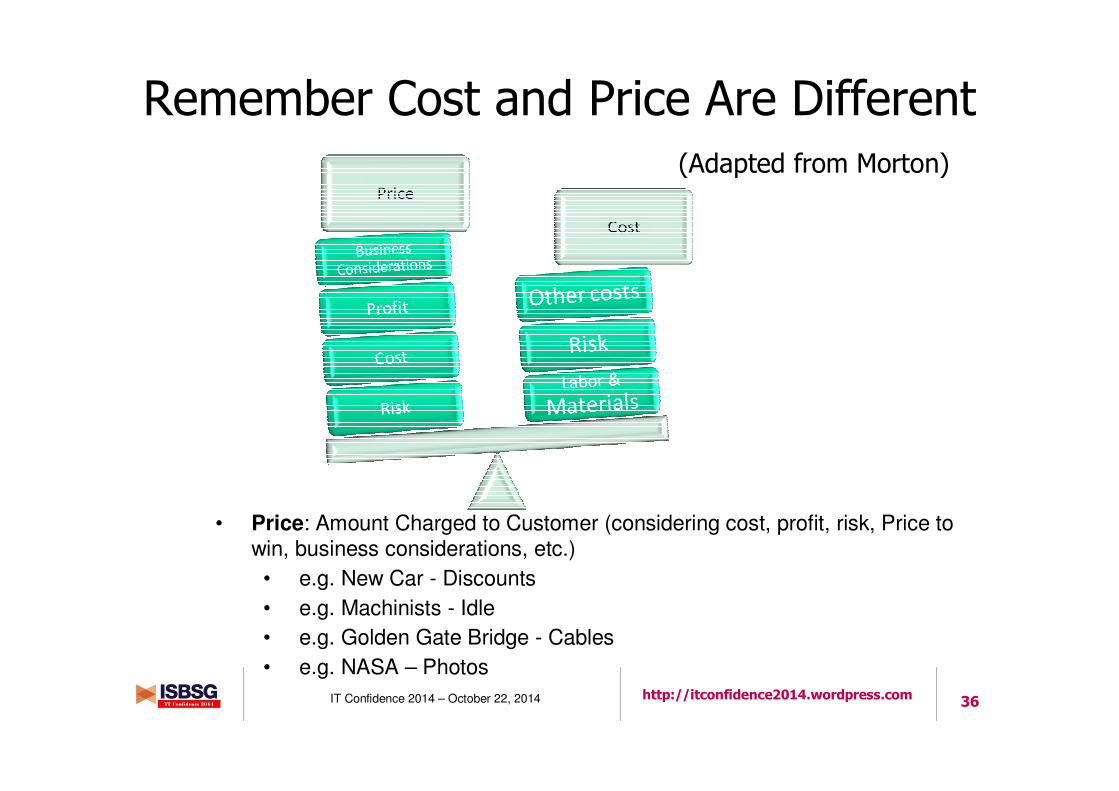
Remember Cost and Price Are Different (Adapted from Morton)
• Price: Amount Charged to Customer (considering cost, profit, risk, Price to win, business considerations, etc.)
• e.g. New Car - Discounts
• e.g. Machinists - Idle
• e.g. Golden Gate Bridge - Cables
• e.g. NASA – Photos
37IT Confidence 2014 – October 22, 2014 http://itconfidence2014.wordpress.com
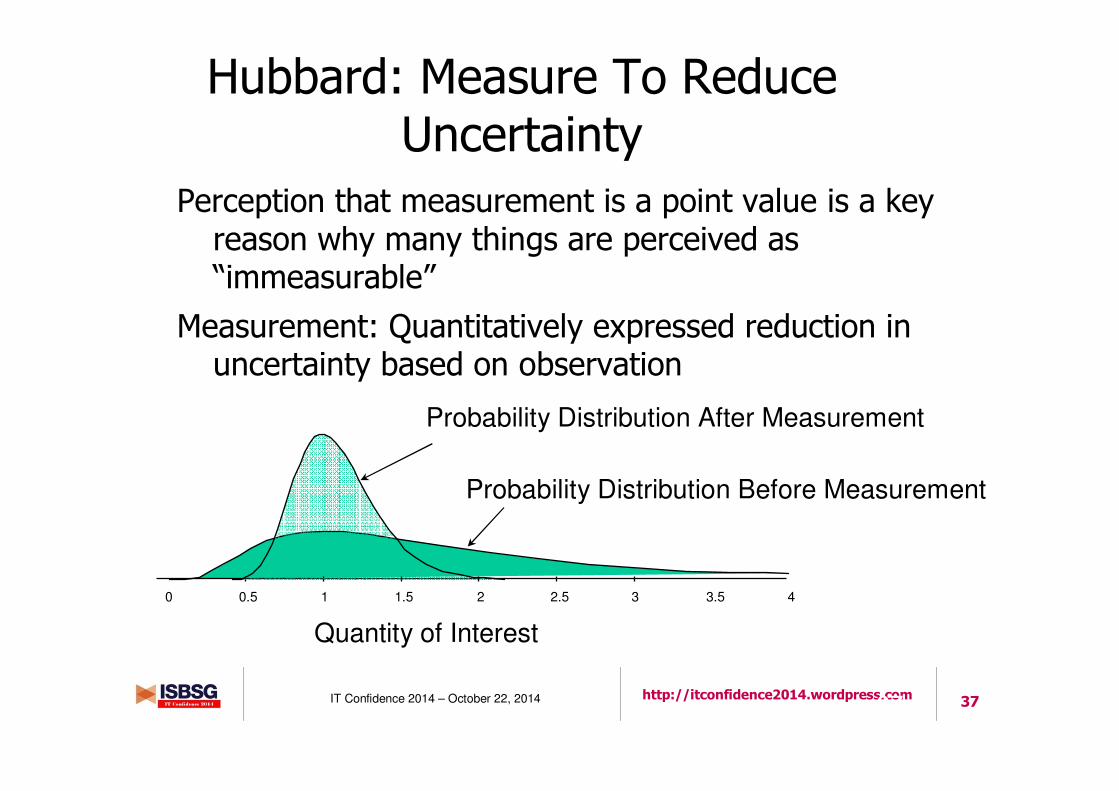
Hubbard: Measure To Reduce Uncertainty
Perception that measurement is a point value is a key reason why many things are perceived as “immeasurable”
Measurement: Quantitatively expressed reduction in uncertainty based on observation
Copyright HDR 2010 [email protected]
37
Quantity of Interest
0 0.5 1 1.5 2 2.5 3 3.5 4
Probability Distribution Before Measurement
Probability Distribution After Measurement
38IT Confidence 2014 – October 22, 2014 http://itconfidence2014.wordpress.com
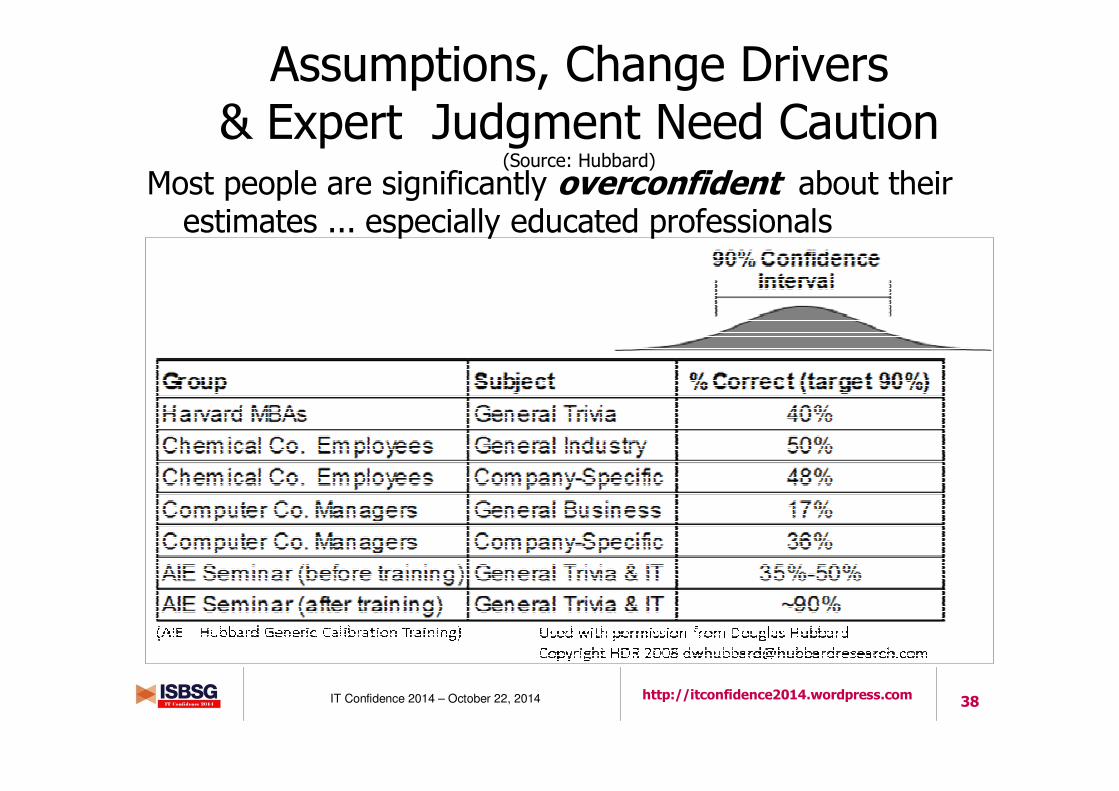
Most people are significantly overconfident about their estimates ... especially educated professionals
Assumptions, Change Drivers & Expert Judgment Need Caution
(Source: Hubbard)
39IT Confidence 2014 – October 22, 2014 http://itconfidence2014.wordpress.com
Gunning for Models (Adapted from Hubbard)
Be careful of red herring arguments against models
“We cannot model that…it is too complex.”
“Models will have error and therefore we should not attempt it.”
“We don’t have sufficient data to use for a model.”
“It works but we cant see all data so we should not use it”
Build on George E. P. Box: “Essentially, all models are wrong, but some are useful.”
Some models are more useful than others
Everyone uses a model – even if it is intuition or “common sense”
So the question is not whether a model is “right” or whether to use a model at all
Question is whether one model measurably outperforms another
A proposed model (quantitative or otherwise) should be preferred if the error reduction compared to the current model (expert judgment, perhaps) is enough to justify the cost of the new model
40IT Confidence 2014 – October 22, 2014 http://itconfidence2014.wordpress.com
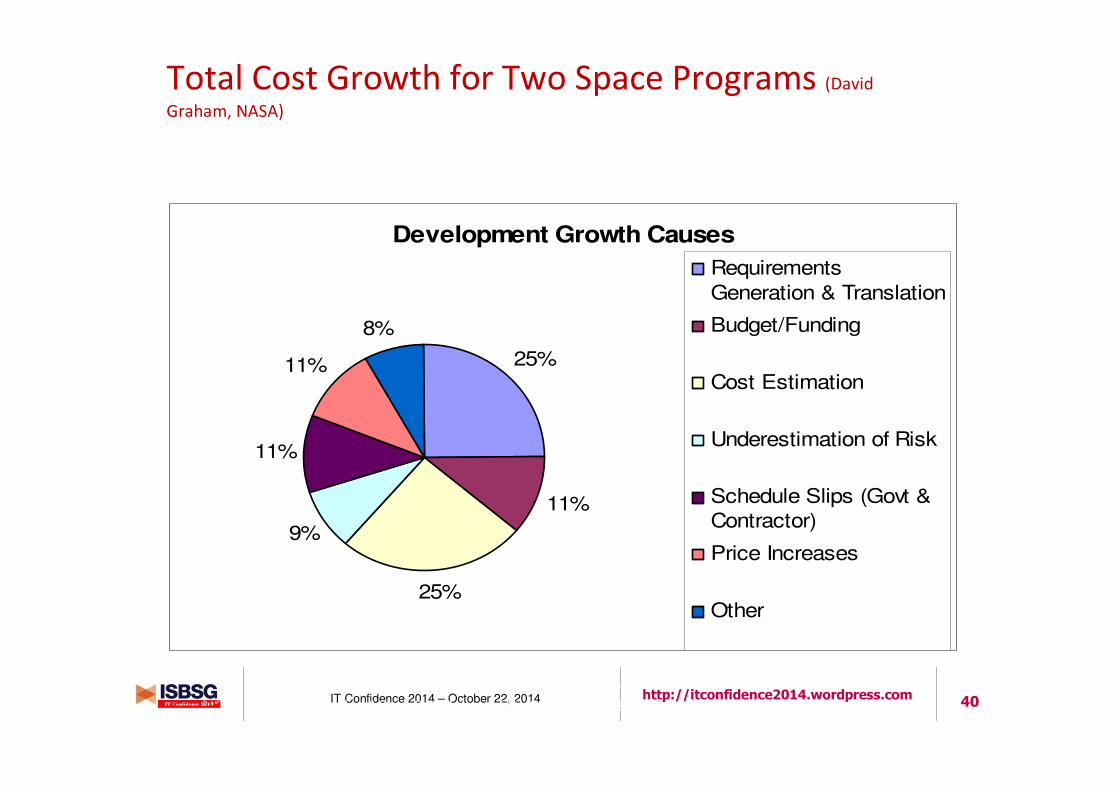
Total Cost Growth for Two Space Programs (David
Graham, NASA)
5 “The Success Triangle of Cost, Schedule, and Performance: A Blueprint for Development of Large-Scale
Systems in an Increasingly Complex Environment” - (Booz|Allen|Hamilton, 2003)
Development Growth Causes
25%
11%
25%
9%
11%
11%
8%
Requirements
Generation & Translation
Budget/Funding
Cost Estimation
Underestimation of Risk
Schedule Slips (Govt &Contractor)
Price Increases
Other
Quantitative Framework
43IT Confidence 2014 – October 22, 2014 http://itconfidence2014.wordpress.com
Key PointsEstimates can be better, squelching bias & strategic mis-estimation…Parametrics help.
Poor estimates are a root cause of project failure
Experts are likely
providing biased
estimates