Embed Size (px)
Citation preview
May 6, 2015
2
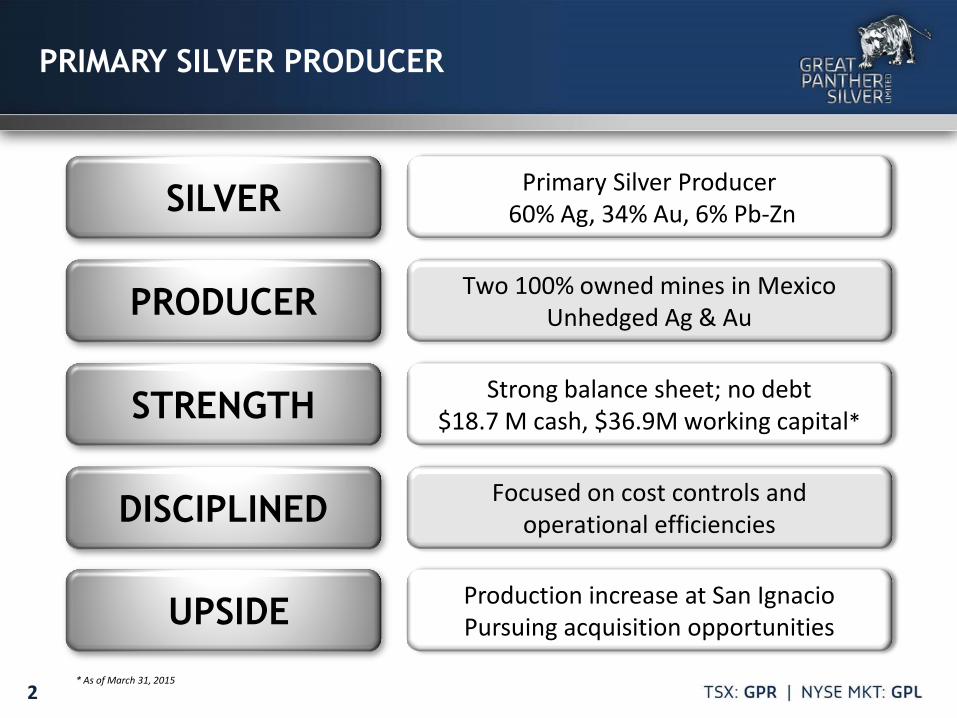
PRIMARY SILVER PRODUCER
* As of March 31, 2015
SILVER Primary Silver Producer 60% Ag, 34% Au, 6% Pb-Zn
PRODUCER Two 100% owned mines in Mexico Unhedged Ag & Au
UPSIDE
Focused on cost controls and operational efficiencies
STRENGTH Strong balance sheet; no debt $18.7 M cash, $36.9M working capital*
DISCIPLINED
Production increase at San Ignacio Pursuing acquisition opportunities
3
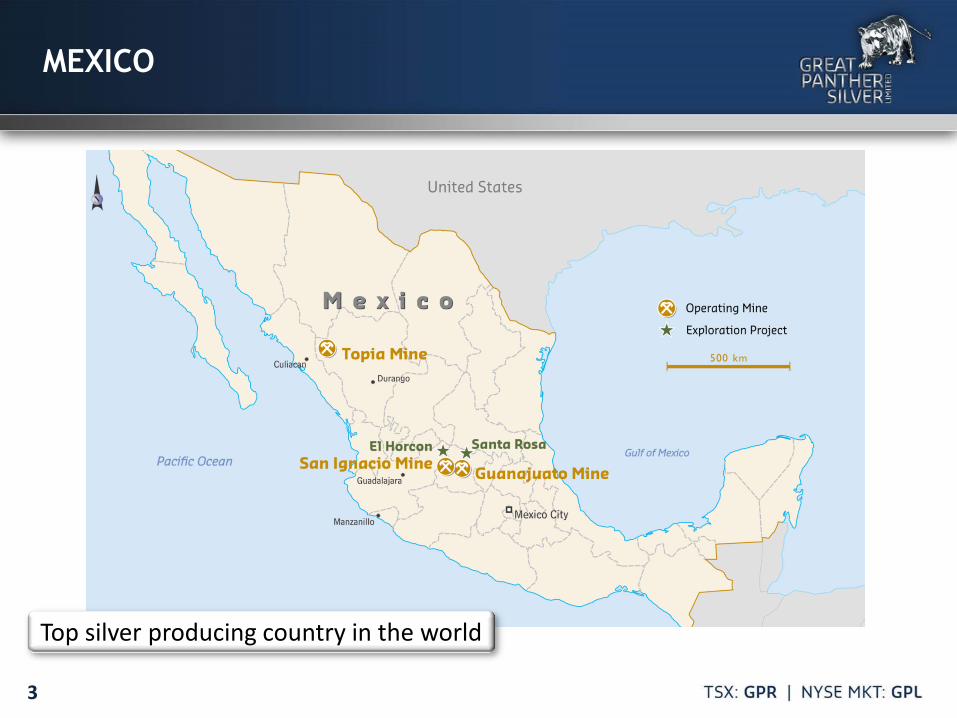
MEXICO
Top silver producing country in the world
4
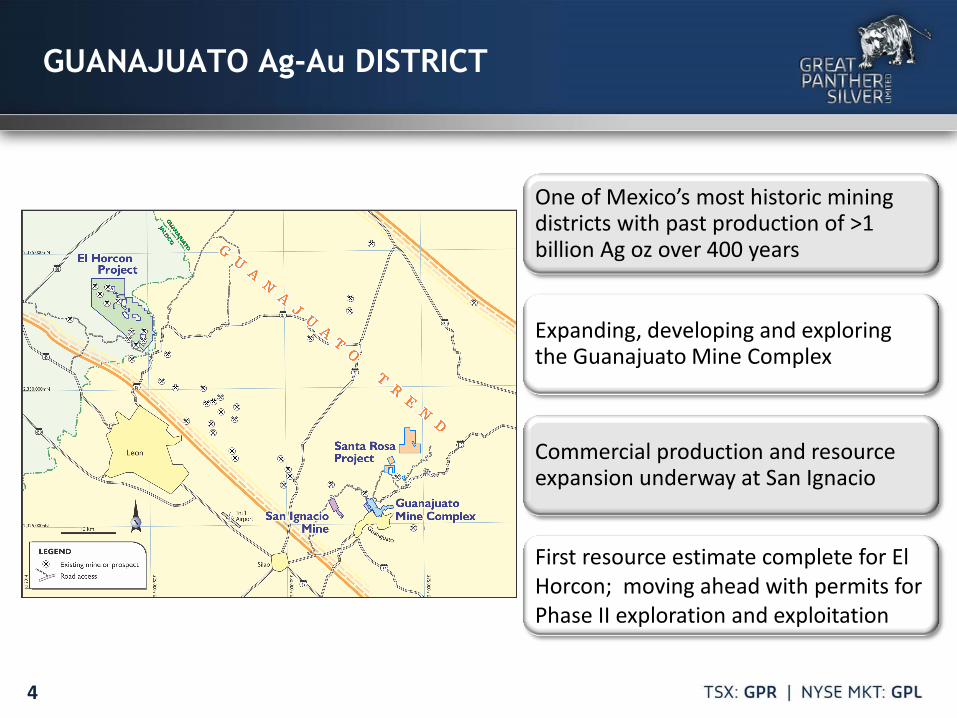
One of Mexico’s most historic mining districts with past production of >1 billion Ag oz over 400 years
Expanding, developing and exploring the Guanajuato Mine Complex
Commercial production and resource expansion underway at San Ignacio
First resource estimate complete for El Horcon; moving ahead with permits for Phase II exploration and exploitation
GUANAJUATO Ag-Au DISTRICT
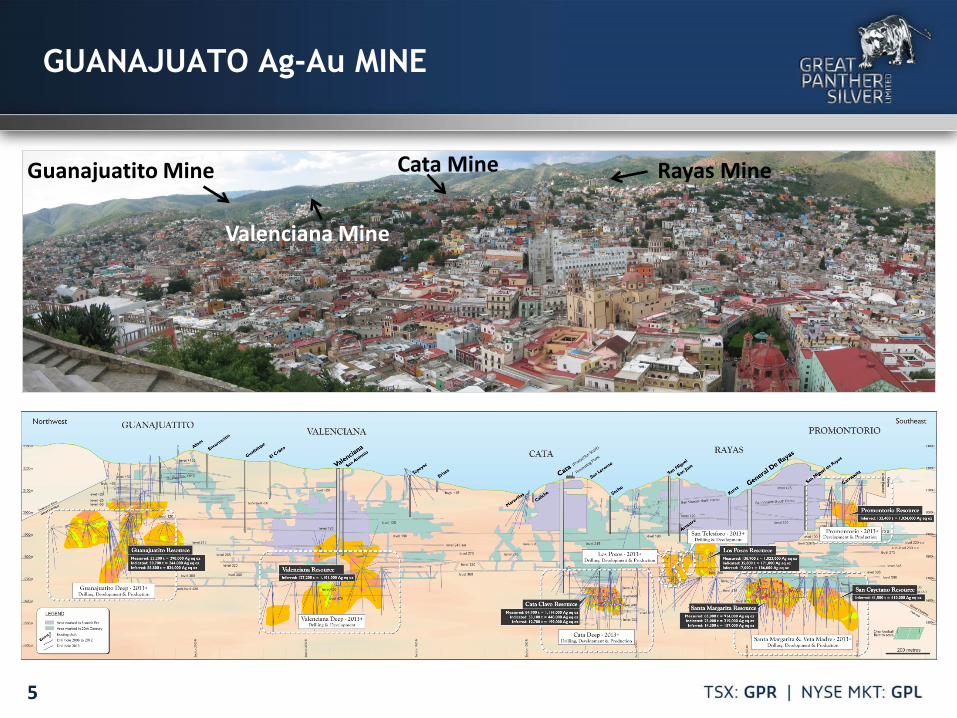
Guanajuatito Mine Cata Mine Rayas Mine
Valenciana Mine
5
GUANAJUATO Ag-Au MINE
6
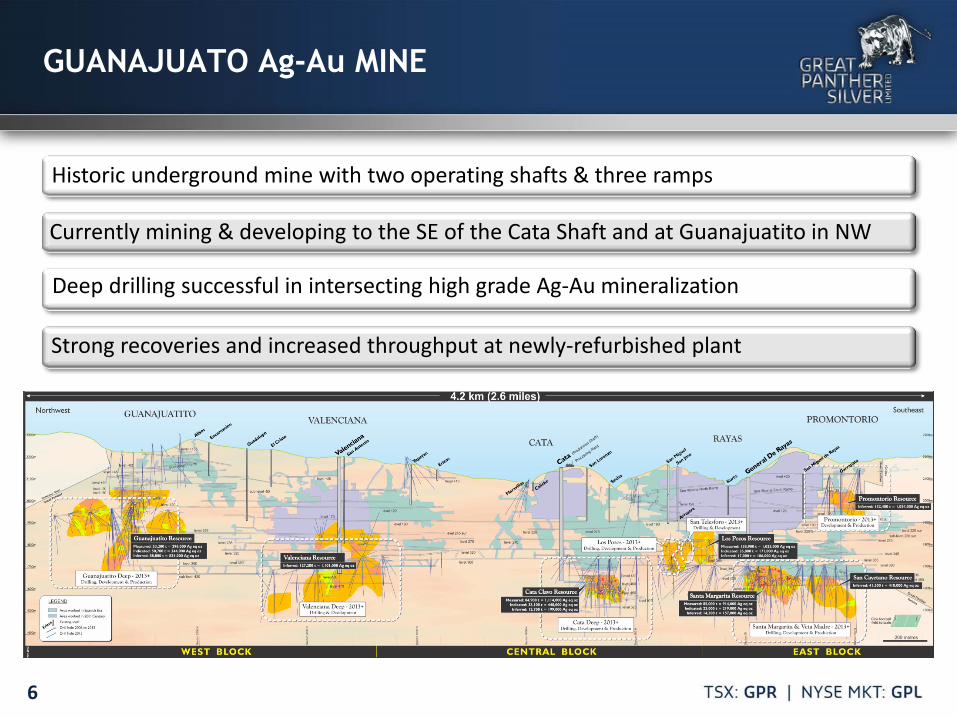
GUANAJUATO Ag-Au MINE
Historic underground mine with two operating shafts & three ramps
Currently mining & developing to the SE of the Cata Shaft and at Guanajuatito in NW
Deep drilling successful in intersecting high grade Ag-Au mineralization
Strong recoveries and increased throughput at newly-refurbished plant
7
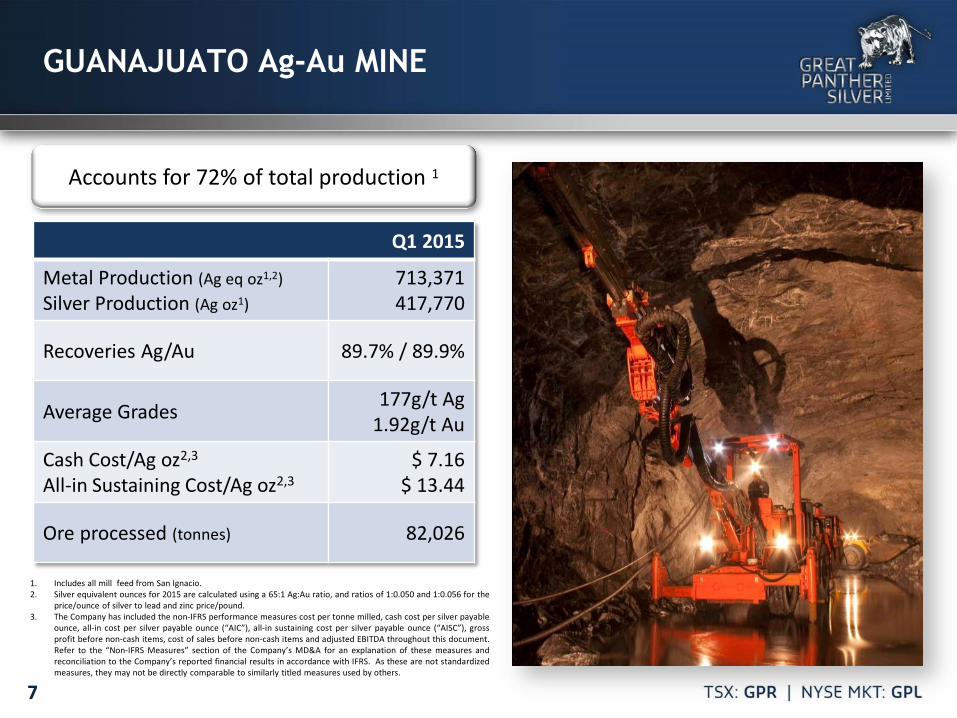
GUANAJUATO Ag-Au MINE
Accounts for 72% of total production 1
Q1 2015
Metal Production (Ag eq oz1,2) Silver Production (Ag oz1)
713,371 417,770
Recoveries Ag/Au 89.7% / 89.9%
Average Grades 177g/t Ag 1.92g/t Au
Cash Cost/Ag oz2,3 All-in Sustaining Cost/Ag oz2,3
$ 7.16 $ 13.44
Ore processed (tonnes) 82,026
1. Includes all mill feed from San Ignacio. 2. Silver equivalent ounces for 2015 are calculated using a 65:1 Ag:Au ratio, and ratios of 1:0.050 and 1:0.056 for the
price/ounce of silver to lead and zinc price/pound. 3. The Company has included the non-IFRS performance measures cost per tonne milled, cash cost per silver payable
ounce, all-in cost per silver payable ounce (“AIC”), all-in sustaining cost per silver payable ounce (“AISC”), gross profit before non-cash items, cost of sales before non-cash items and adjusted EBITDA throughout this document. Refer to the “Non-IFRS Measures” section of the Company’s MD&A for an explanation of these measures and reconciliation to the Company’s reported financial results in accordance with IFRS. As these are not standardized measures, they may not be directly comparable to similarly titled measures used by others.
8
SAN IGNACIO Ag-Au MINE
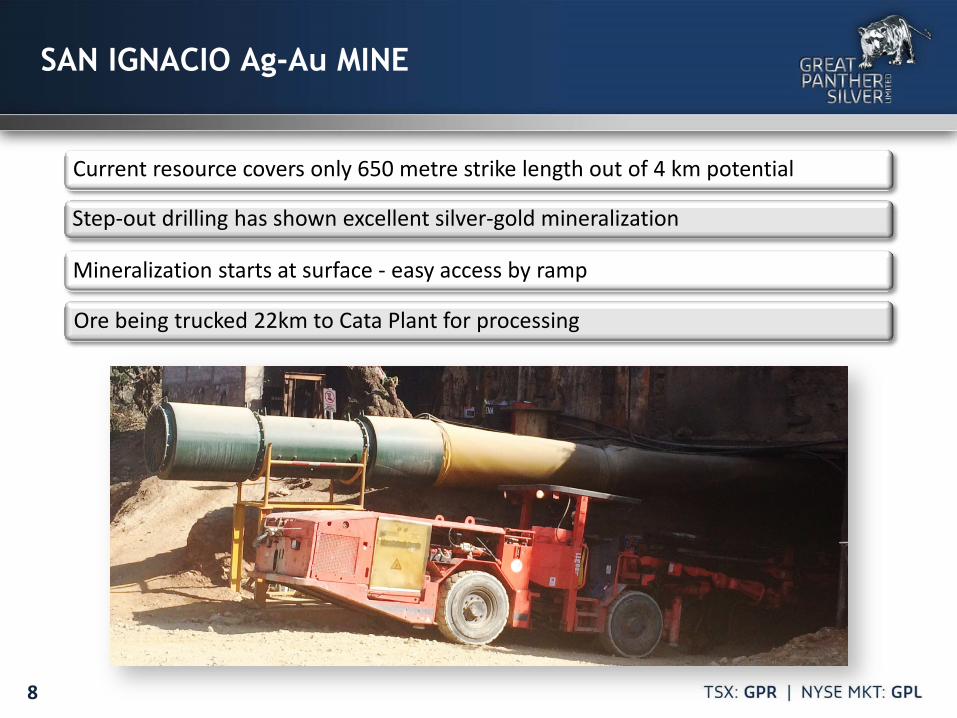
Current resource covers only 650 metre strike length out of 4 km potential
Step-out drilling has shown excellent silver-gold mineralization
Mineralization starts at surface - easy access by ramp
Ore being trucked 22km to Cata Plant for processing
9
SAN IGNACIO Ag-Au MINE
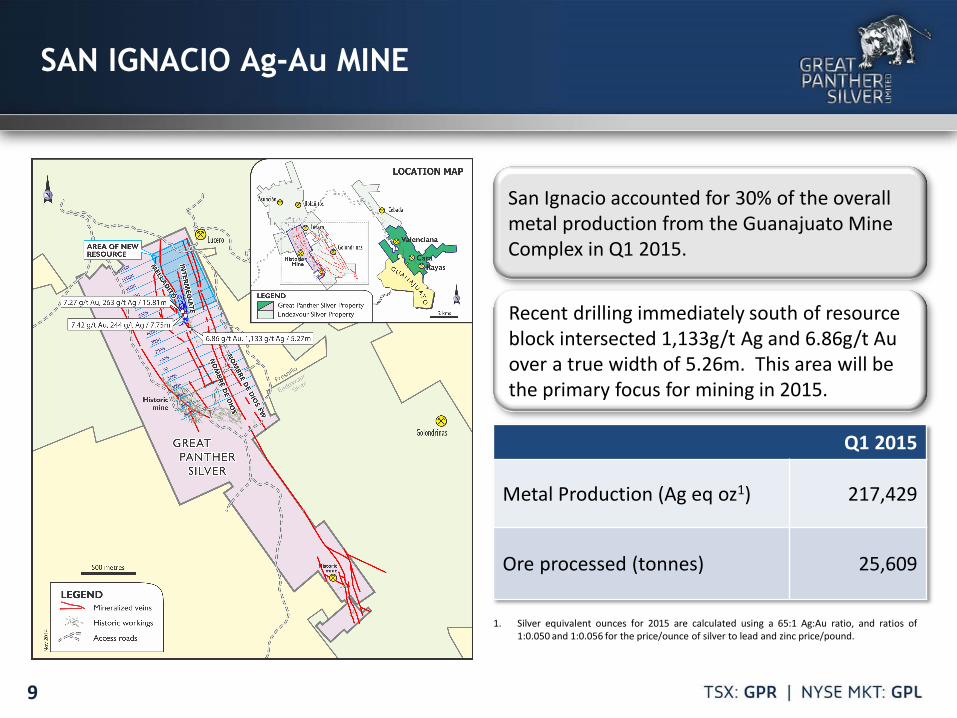
Q1 2015
Metal Production (Ag eq oz1) 217,429
Ore processed (tonnes) 25,609
1. Silver equivalent ounces for 2015 are calculated using a 65:1 Ag:Au ratio, and ratios of 1:0.050 and 1:0.056 for the price/ounce of silver to lead and zinc price/pound.
Recent drilling immediately south of resource block intersected 1,133g/t Ag and 6.86g/t Au over a true width of 5.26m. This area will be the primary focus for mining in 2015.
San Ignacio accounted for 30% of the overall metal production from the Guanajuato Mine Complex in Q1 2015.
10
SAN IGNACIO Ag-Au MINE
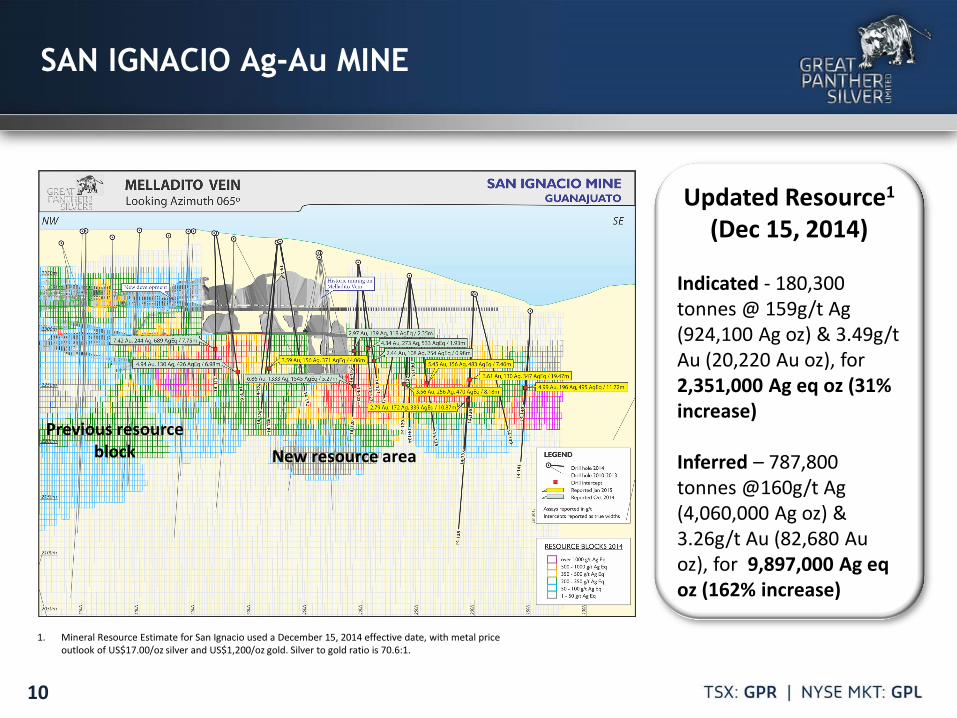
1. Mineral Resource Estimate for San Ignacio used a December 15, 2014 effective date, with metal price outlook of US$17.00/oz silver and US$1,200/oz gold. Silver to gold ratio is 70.6:1.
Updated Resource1
(Dec 15, 2014) Indicated - 180,300 tonnes @ 159g/t Ag (924,100 Ag oz) & 3.49g/t Au (20,220 Au oz), for 2,351,000 Ag eq oz (31% increase) Inferred – 787,800 tonnes @160g/t Ag (4,060,000 Ag oz) & 3.26g/t Au (82,680 Au oz), for 9,897,000 Ag eq oz (162% increase)
New resource area Previous resource
block
11
TOPIA Ag-Pb-Zn-Au MINE
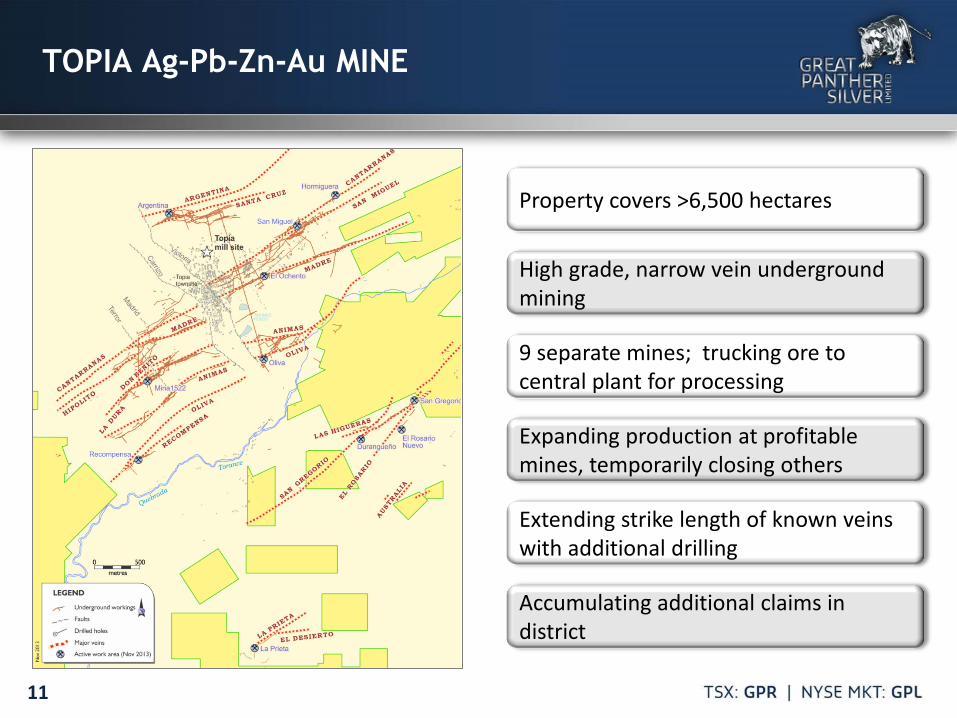
Property covers >6,500 hectares
9 separate mines; trucking ore to central plant for processing
High grade, narrow vein underground mining
Expanding production at profitable mines, temporarily closing others
Extending strike length of known veins with additional drilling
Accumulating additional claims in district
12
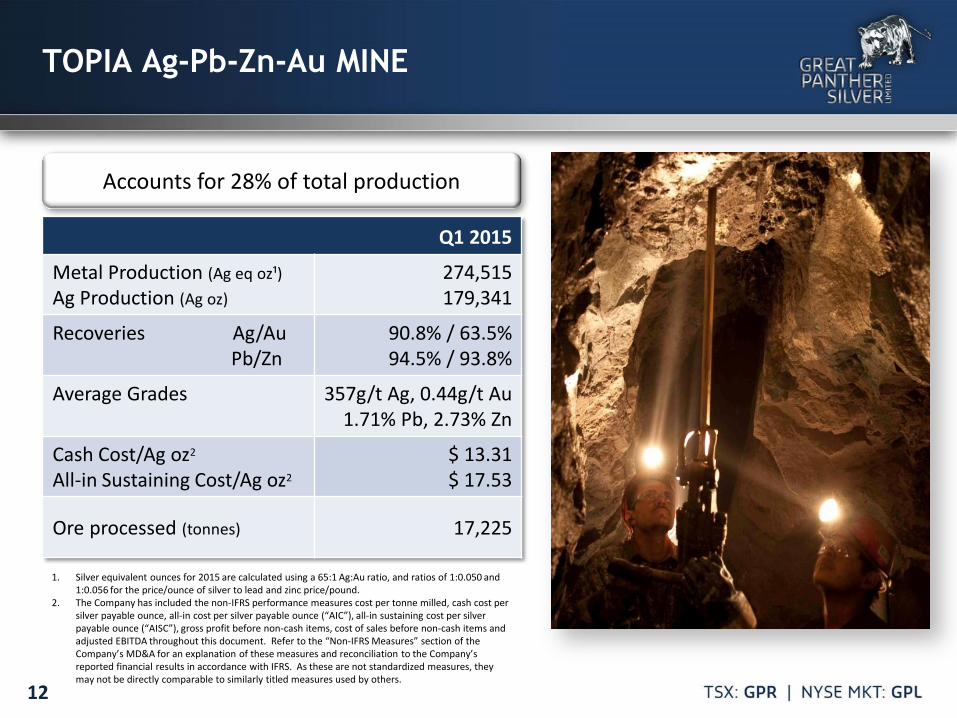
Accounts for 28% of total production
TOPIA Ag-Pb-Zn-Au MINE
Q1 2015
Metal Production (Ag eq oz¹) Ag Production (Ag oz)
274,515 179,341
Recoveries Ag/Au Pb/Zn
90.8% / 63.5% 94.5% / 93.8%
Average Grades
357g/t Ag, 0.44g/t Au 1.71% Pb, 2.73% Zn
Cash Cost/Ag oz2 All-in Sustaining Cost/Ag oz2
$ 13.31 $ 17.53
Ore processed (tonnes) 17,225
1. Silver equivalent ounces for 2015 are calculated using a 65:1 Ag:Au ratio, and ratios of 1:0.050 and 1:0.056 for the price/ounce of silver to lead and zinc price/pound.
2. The Company has included the non-IFRS performance measures cost per tonne milled, cash cost per silver payable ounce, all-in cost per silver payable ounce (“AIC”), all-in sustaining cost per silver payable ounce (“AISC”), gross profit before non-cash items, cost of sales before non-cash items and adjusted EBITDA throughout this document. Refer to the “Non-IFRS Measures” section of the Company’s MD&A for an explanation of these measures and reconciliation to the Company’s reported financial results in accordance with IFRS. As these are not standardized measures, they may not be directly comparable to similarly titled measures used by others.
13
EL HORCON Ag-Au PROJECT
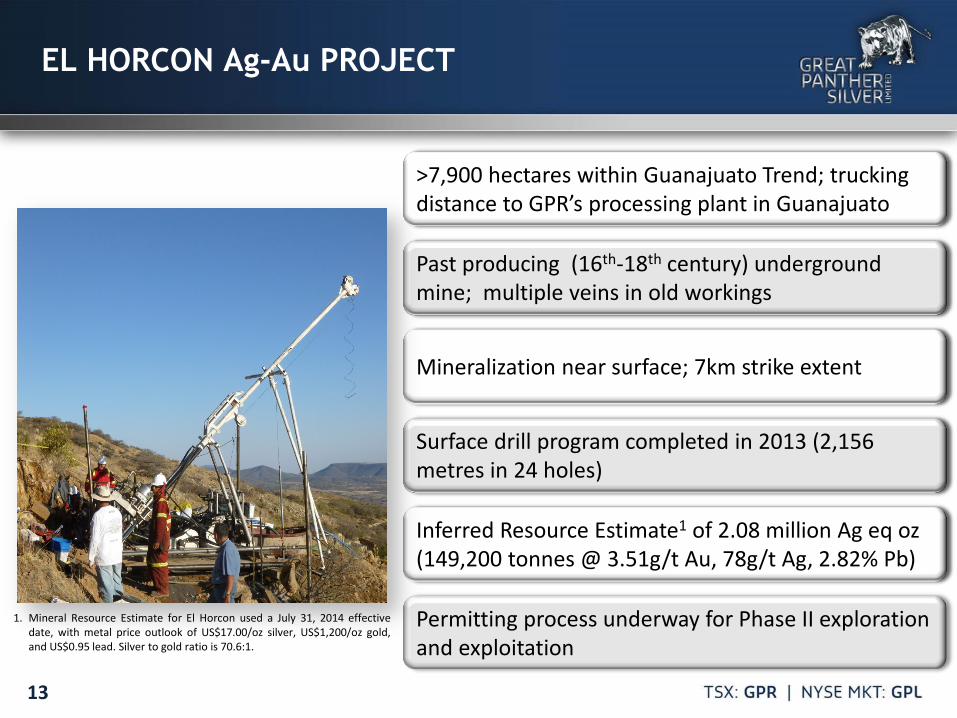
>7,900 hectares within Guanajuato Trend; trucking distance to GPR’s processing plant in Guanajuato
Mineralization near surface; 7km strike extent
Past producing (16th-18th century) underground mine; multiple veins in old workings
Surface drill program completed in 2013 (2,156 metres in 24 holes)
Inferred Resource Estimate1 of 2.08 million Ag eq oz (149,200 tonnes @ 3.51g/t Au, 78g/t Ag, 2.82% Pb)
Permitting process underway for Phase II exploration and exploitation
>7,900 hectares within Guanajuato Trend; trucking distance to GPR’s processing plant in Guanajuato
Mineralization near surface; 7km strike extent
Past producing (16th-18th century) underground mine; multiple veins in old workings
Surface drill program completed in 2013 (2,156 metres in 24 holes)
Inferred Resource Estimate1 of 2.08 million Ag eq oz (149,200 tonnes @ 3.51g/t Au, 78g/t Ag, 2.82% Pb)
1. Mineral Resource Estimate for El Horcon used a July 31, 2014 effective date, with metal price outlook of US$17.00/oz silver, US$1,200/oz gold, and US$0.95 lead. Silver to gold ratio is 70.6:1.
14
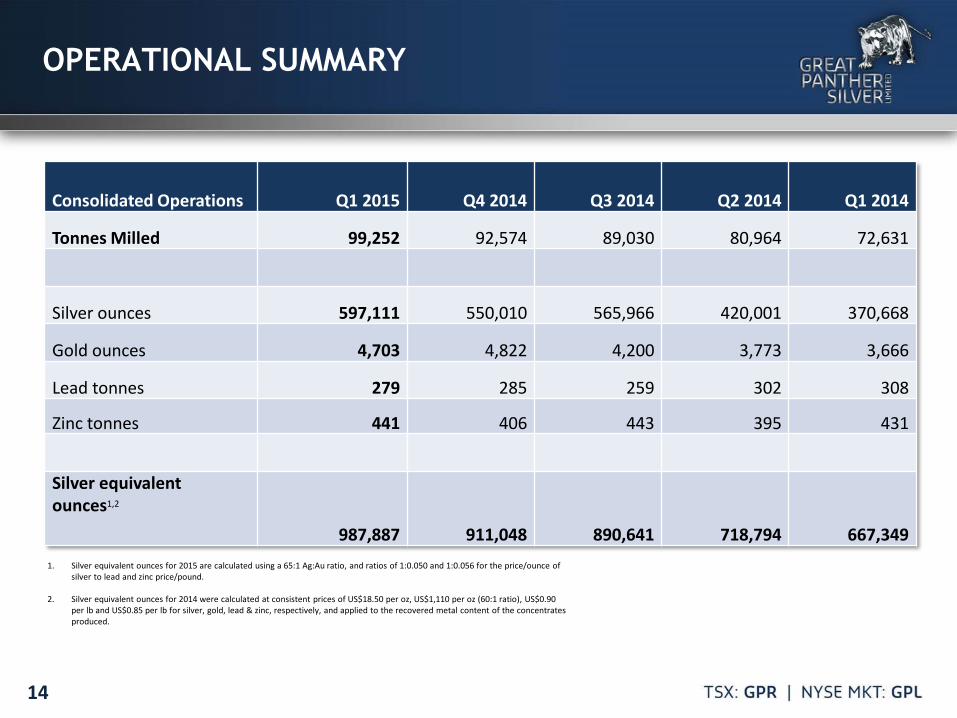
OPERATIONAL SUMMARY
Consolidated Operations Q1 2015 Q4 2014 Q3 2014 Q2 2014 Q1 2014
Tonnes Milled 99,252 92,574 89,030 80,964 72,631
Silver ounces 597,111 550,010 565,966 420,001 370,668
Gold ounces 4,703 4,822 4,200 3,773 3,666
Lead tonnes 279 285 259 302 308
Zinc tonnes 441 406 443 395 431
Silver equivalent ounces1,2
987,887 911,048 890,641 718,794 667,349 1. Silver equivalent ounces for 2015 are calculated using a 65:1 Ag:Au ratio, and ratios of 1:0.050 and 1:0.056 for the price/ounce of
silver to lead and zinc price/pound.
2. Silver equivalent ounces for 2014 were calculated at consistent prices of US$18.50 per oz, US$1,110 per oz (60:1 ratio), US$0.90 per lb and US$0.85 per lb for silver, gold, lead & zinc, respectively, and applied to the recovered metal content of the concentrates produced.
0.0
0.5
1.0
1.5
2.0
2.5
3.0
3.5
4.0
2011 2012 2013 2014 2015
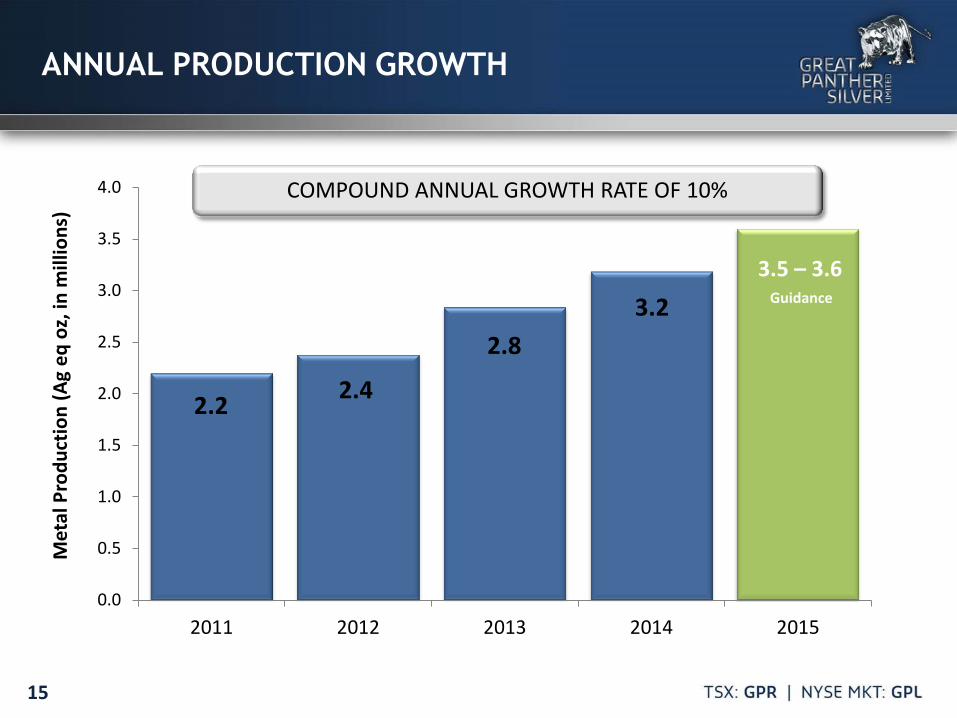
ANNUAL PRODUCTION GROWTH
15
COMPOUND ANNUAL GROWTH RATE OF 10%
2.2
2.8
2.4
3.2 3.5 – 3.6
Guidance
Met
al P
rodu
ctio
n (A
g eq
oz,
in m
illio
ns)
16
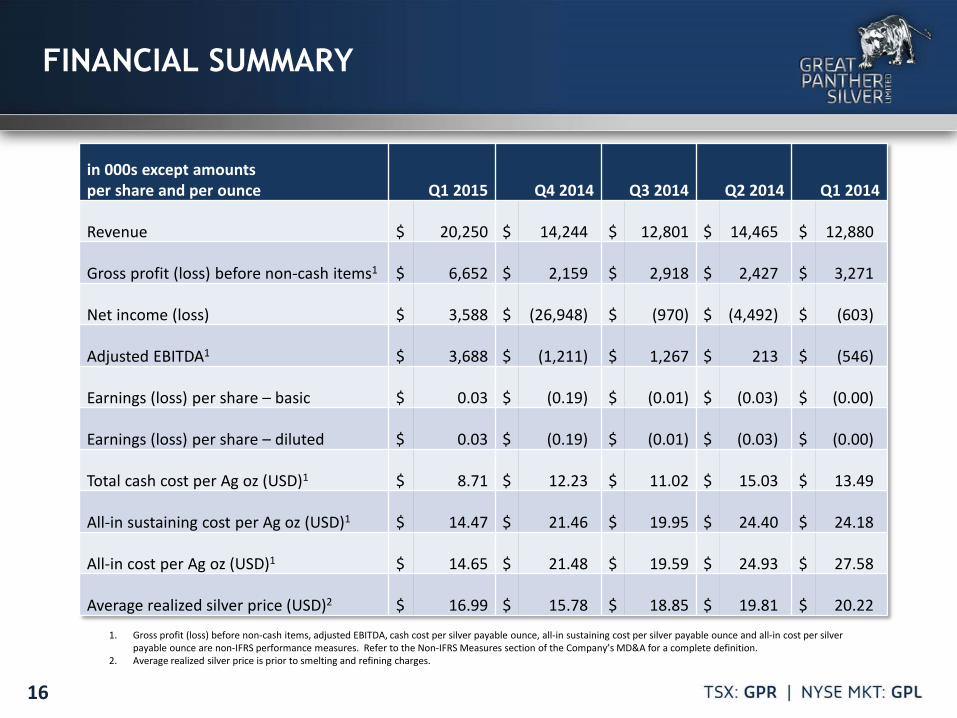
FINANCIAL SUMMARY
1. Gross profit (loss) before non-cash items, adjusted EBITDA, cash cost per silver payable ounce, all-in sustaining cost per silver payable ounce and all-in cost per silver
payable ounce are non-IFRS performance measures. Refer to the Non-IFRS Measures section of the Company’s MD&A for a complete definition. 2. Average realized silver price is prior to smelting and refining charges.
in 000s except amounts per share and per ounce Q1 2015 Q4 2014 Q3 2014 Q2 2014 Q1 2014
Revenue $ 20,250 $ 14,244 $ 12,801 $ 14,465 $ 12,880
Gross profit (loss) before non-cash items1 $ 6,652 $ 2,159 $ 2,918 $ 2,427 $ 3,271
Net income (loss) $ 3,588 $ (26,948) $ (970) $ (4,492) $ (603)
Adjusted EBITDA1 $ 3,688 $ (1,211) $ 1,267 $ 213 $ (546)
Earnings (loss) per share – basic $ 0.03 $ (0.19) $ (0.01) $ (0.03) $ (0.00)
Earnings (loss) per share – diluted $ 0.03 $ (0.19) $ (0.01) $ (0.03) $ (0.00)
Total cash cost per Ag oz (USD)1 $ 8.71 $ 12.23 $ 11.02 $ 15.03 $ 13.49
All-in sustaining cost per Ag oz (USD)1 $ 14.47 $ 21.46 $ 19.95 $ 24.40 $ 24.18
All-in cost per Ag oz (USD)1 $ 14.65 $ 21.48 $ 19.59 $ 24.93 $ 27.58
Average realized silver price (USD)2 $ 16.99 $ 15.78 $ 18.85 $ 19.81 $ 20.22
17
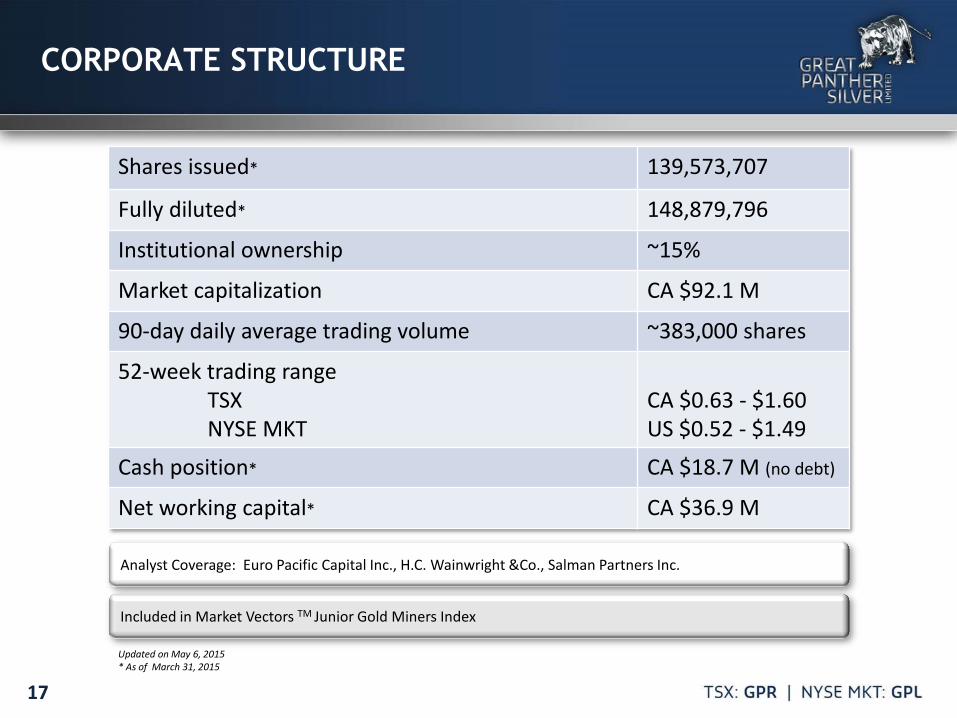
CORPORATE STRUCTURE
Shares issued* 139,573,707
Fully diluted* 148,879,796
Institutional ownership ~15%
Market capitalization CA $92.1 M
90-day daily average trading volume ~383,000 shares
52-week trading range TSX NYSE MKT
CA $0.63 - $1.60 US $0.52 - $1.49
Cash position* CA $18.7 M (no debt)
Net working capital* CA $36.9 M
Updated on May 6, 2015 * As of March 31, 2015
Analyst Coverage: Euro Pacific Capital Inc., H.C. Wainwright &Co., Salman Partners Inc.
Included in Market Vectors TM Junior Gold Miners Index
18
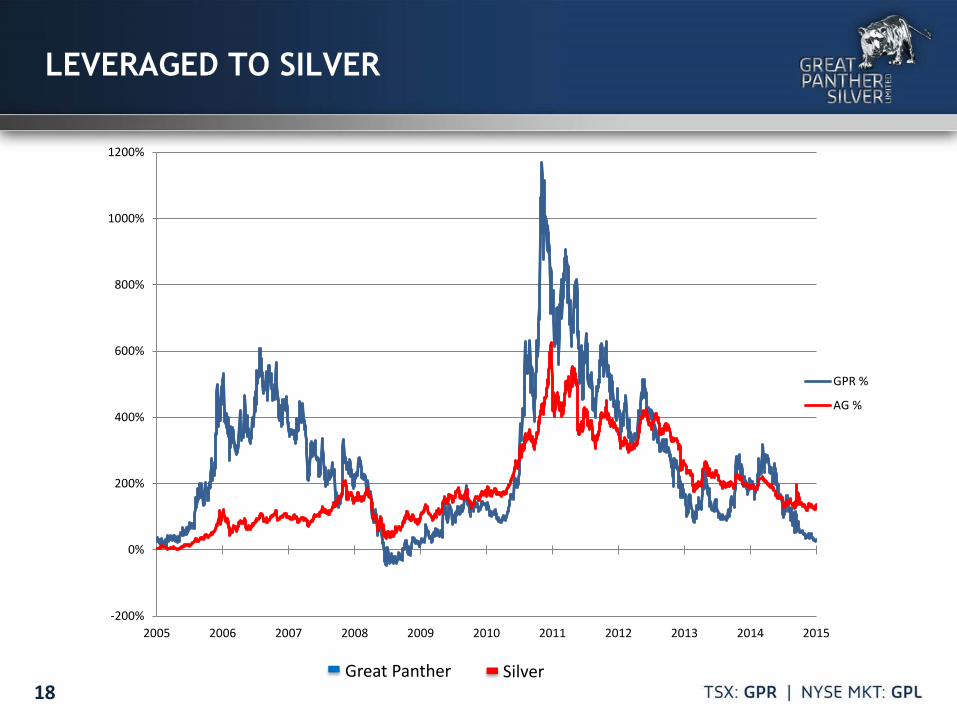
LEVERAGED TO SILVER
Great Panther Silver
-200%
0%
200%
400%
600%
800%
1000%
1200%
2005 2006 2007 2008 2009 2010 2011 2012 2013 2014 2015
GPR %
AG %
19
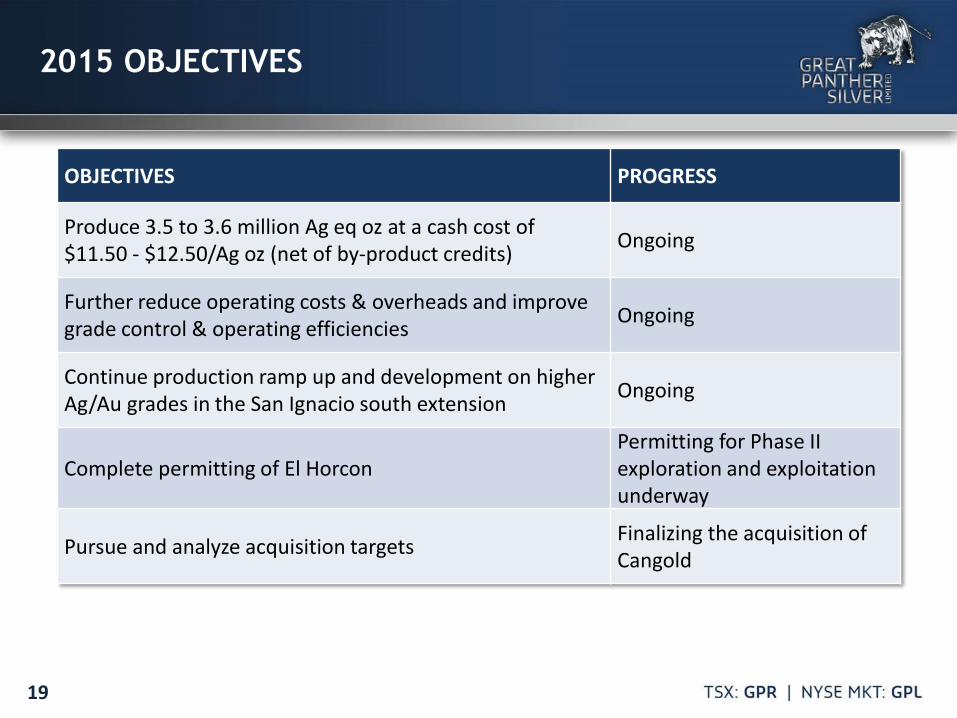
2015 OBJECTIVES
OBJECTIVES PROGRESS
Produce 3.5 to 3.6 million Ag eq oz at a cash cost of $11.50 - $12.50/Ag oz (net of by-product credits) Ongoing
Further reduce operating costs & overheads and improve grade control & operating efficiencies Ongoing
Continue production ramp up and development on higher Ag/Au grades in the San Ignacio south extension Ongoing
Complete permitting of El Horcon Permitting for Phase II exploration and exploitation underway
Pursue and analyze acquisition targets Finalizing the acquisition of Cangold
20
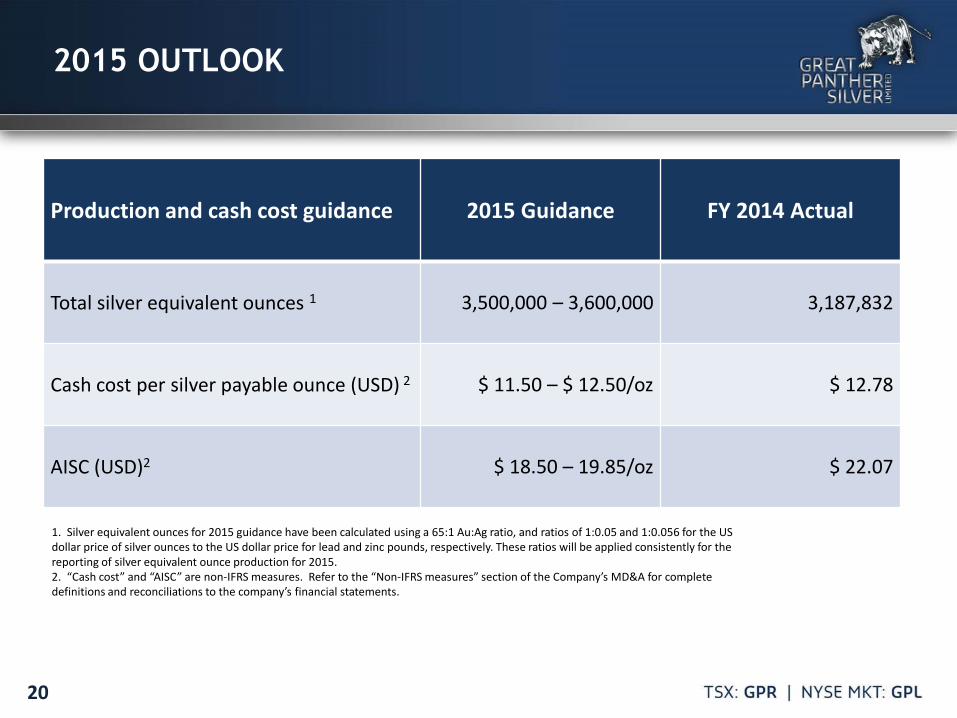
2015 OUTLOOK
Production and cash cost guidance 2015 Guidance FY 2014 Actual
Total silver equivalent ounces 1 3,500,000 – 3,600,000 3,187,832
Cash cost per silver payable ounce (USD) 2 $ 11.50 – $ 12.50/oz $ 12.78
AISC (USD)2 $ 18.50 – 19.85/oz $ 22.07
1. Silver equivalent ounces for 2015 guidance have been calculated using a 65:1 Au:Ag ratio, and ratios of 1:0.05 and 1:0.056 for the US dollar price of silver ounces to the US dollar price for lead and zinc pounds, respectively. These ratios will be applied consistently for the reporting of silver equivalent ounce production for 2015. 2. “Cash cost” and “AISC” are non-IFRS measures. Refer to the “Non-IFRS measures” section of the Company’s MD&A for complete definitions and reconciliations to the company’s financial statements.
21
VALUE ADVANTAGE
Great Panther is a primary silver producer
100% unhedged with strong leverage to silver price
Good liquidity on NYSE MKT and TSX
Strong working capital & no debt
Potential for production growth through satellite projects
Pursuing acquisition opportunities in the Americas
This presentation contains forward-looking statements within the meaning of the United States Private Securities Litigation Reform Act of 1995 and forward-looking information within the meaning of the Securities Act (Ontario) (together, "forward-looking statements"). Such forward-looking statements may include but are not limited to the Company's plans for production at its Guanajuato and Topia Mines in Mexico, exploring its other properties in Mexico, the overall economic potential of its properties, the availability of adequate financing and involve known and unknown risks, uncertainties and other factors which may cause the actual results, performance or achievements expressed or implied by such forward-looking statements to be materially different. Such factors include, among others, risks and uncertainties relating to potential political risks involving the Company's operations in a foreign jurisdiction, uncertainty of production and cost estimates and the potential for unexpected costs and expenses, physical risks inherent in mining operations, currency fluctuations, fluctuations in the price of silver, gold and base metals, completion of economic evaluations, changes in project parameters as plans continue to be refined, the inability or failure to obtain adequate financing on a timely basis, and other risks and uncertainties, including those described in the Company's Annual Information Form for the year ended December 31, 2014 and Material Change Reports filed with the Canadian Securities Administrators available at www.sedar.com, and reports on Form 40-F and Form 6-K filed with the Securities and Exchange Commission and available at www.sec.gov. Statements concerning mineral reserve and resource estimates may also be deemed to constitute forward-looking statements to the extent that they involve estimates of the mineralization that will be encountered if the property is developed. Any statements that express or involve discussions with respect to predictions, expectations, beliefs, plans, projections, objectives, assumptions or future events or performance (often, but not always, using words or phrases such as “expects”, “anticipates”, “plans”, “projects”, “estimates”, “assumes”, “intends”, “strategy”, “goals”, “objectives”, “potential” or variations thereof, or stating that certain actions, events or results “may”, “could”, “would”, “might” or “will” be taken, occur or be achieved, or the negative of any of these terms and similar expressions) are not statements of historical fact and may be forward-looking statements. Robert Brown, P. Eng. is the Qualified Person under NI 43-101 for the projects discussed in this presentation.
DISCLAIMER
22
CAUTIONARY NOTE TO U.S. INVESTORS
23
The terms "Measured resource", "Indicated resource" and "Inferred resource" used in this document are Canadian mining terms as defined in National Instrument 43-101 Standards of Disclosure for Mineral Projects (“NI 43-101”) and CIM Standards on Mineral Resources and Mineral Reserves. Mineral resources that are not mineral reserves have not been demonstrated to be economically and legally extractable. Mineral resource estimates do not account for mineability, selectivity, mining loss and dilution. It should not be assumed that all or any part of a resource will ever be converted to a reserve. The mineral resource estimates presented herein include Inferred mineral resources that are normally considered too speculative geologically to have economic considerations applied to them that would enable them to be categorized as mineral reserves. There is also no certainty that these Inferred resources will be converted to Measured and Indicated resource categories through further drilling, or into mineral reserves once economic considerations are applied. We advise U.S. Investors that while the terms "Measured resource", "Indicated resource" and "Inferred resource" are recognized and required to be reported by Canadian regulations, the U.S. Securities and Exchange Commission ("SEC") does not recognize these terms and does not normally permit such terms to be used in reports and registration statements filed with the SEC. As such, information contained in this document concerning descriptions of mineralization and resources under Canadian standards may not be comparable to similar information made public by U.S. companies subject to the reporting and disclosure requirements of the SEC. Inferred resources have a great amount of uncertainty as to their existence and a great uncertainty as to their economic and legal feasibility. It cannot be assumed that all or any part of a Measured, Indicated or Inferred resource will ever be upgraded to a higher category. U.S. investors are cautioned not to assume that any part or all of an Inferred mineral resource exists, or is economically or legally mineable. U.S. investors are also cautioned not to assume that any part or all of the mineral deposits in the Measured resource or Indicated resource categories will ever be converted into reserves.
24
APPENDIX
25
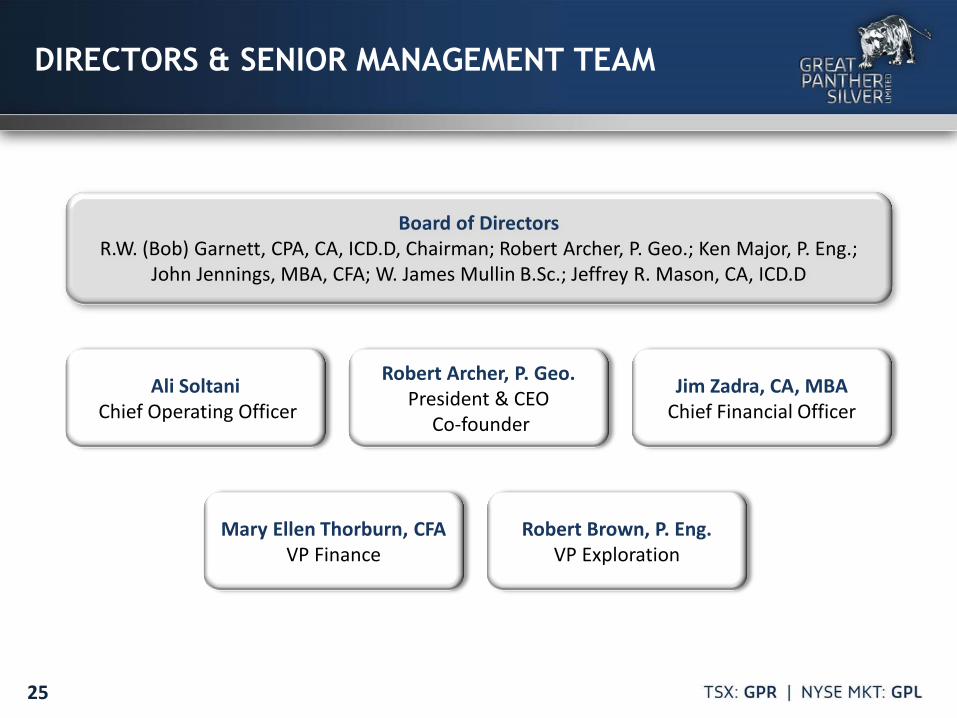
DIRECTORS & SENIOR MANAGEMENT TEAM
Board of Directors
R.W. (Bob) Garnett, CPA, CA, ICD.D, Chairman; Robert Archer, P. Geo.; Ken Major, P. Eng.; John Jennings, MBA, CFA; W. James Mullin B.Sc.; Jeffrey R. Mason, CA, ICD.D
Robert Archer, P. Geo. President & CEO
Co-founder
Jim Zadra, CA, MBA Chief Financial Officer
Ali Soltani Chief Operating Officer
Robert Brown, P. Eng. VP Exploration
Mary Ellen Thorburn, CFA VP Finance
26
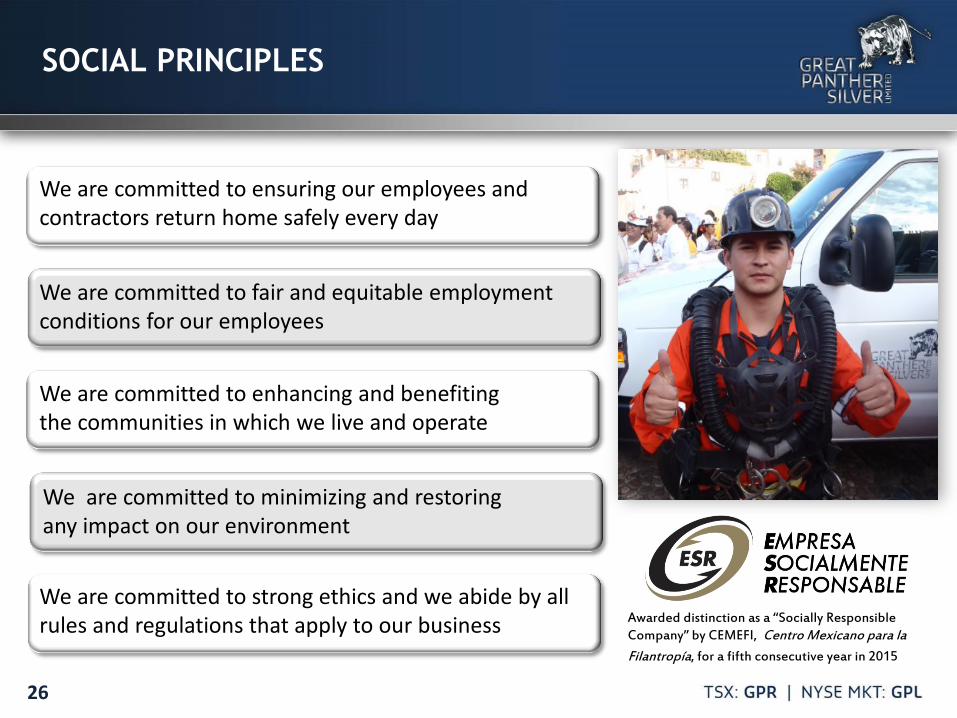
SOCIAL PRINCIPLES
We are committed to fair and equitable employment conditions for our employees
We are committed to ensuring our employees and contractors return home safely every day
We are committed to enhancing and benefiting the communities in which we live and operate
We are committed to minimizing and restoring any impact on our environment
We are committed to strong ethics and we abide by all rules and regulations that apply to our business Awarded distinction as a “Socially Responsible
Company” by CEMEFI, Centro Mexicano para la Filantropía, for a fifth consecutive year in 2015
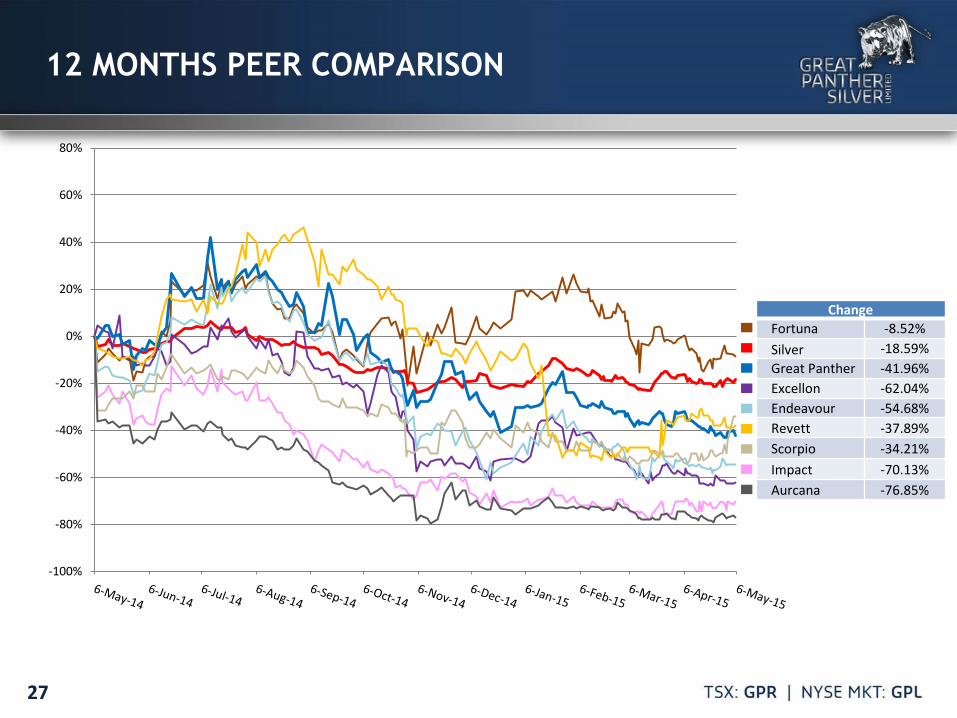
12 MONTHS PEER COMPARISON
27
Change Fortuna -8.52% Silver -18.59% Great Panther -41.96% Excellon -62.04% Endeavour -54.68% Revett -37.89% Scorpio -34.21% Impact -70.13% Aurcana -76.85%
-100%
-80%
-60%
-40%
-20%
0%
20%
40%
60%
80%
28
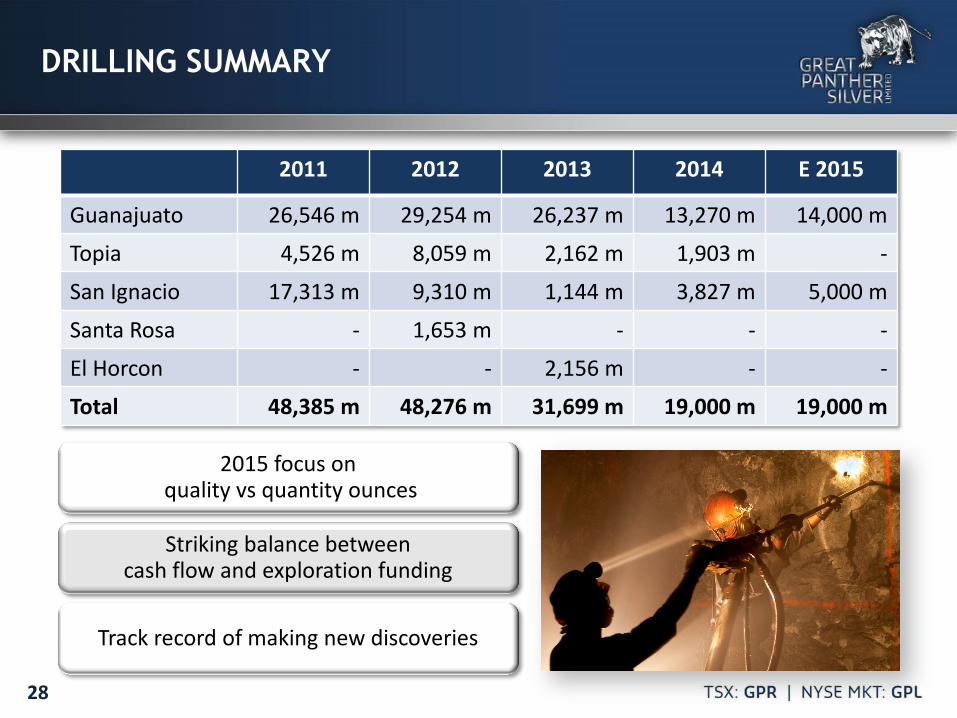
DRILLING SUMMARY
2015 focus on quality vs quantity ounces
Striking balance between cash flow and exploration funding
Track record of making new discoveries
2011 2012 2013 2014 E 2015
Guanajuato 26,546 m 29,254 m 26,237 m 13,270 m 14,000 m
Topia 4,526 m 8,059 m 2,162 m 1,903 m -
San Ignacio 17,313 m 9,310 m 1,144 m 3,827 m 5,000 m
Santa Rosa - 1,653 m - - -
El Horcon - - 2,156 m - -
Total 48,385 m 48,276 m 31,699 m 19,000 m 19,000 m
29
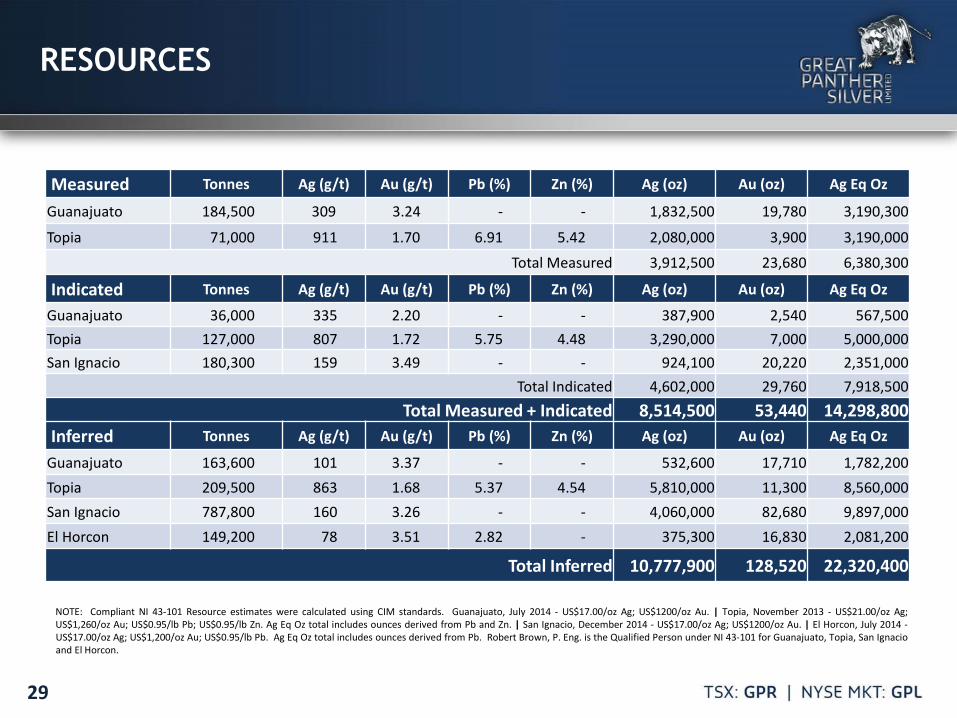
RESOURCES
NOTE: Compliant NI 43-101 Resource estimates were calculated using CIM standards. Guanajuato, July 2014 - US$17.00/oz Ag; US$1200/oz Au. | Topia, November 2013 - US$21.00/oz Ag; US$1,260/oz Au; US$0.95/lb Pb; US$0.95/lb Zn. Ag Eq Oz total includes ounces derived from Pb and Zn. | San Ignacio, December 2014 - US$17.00/oz Ag; US$1200/oz Au. | El Horcon, July 2014 - US$17.00/oz Ag; US$1,200/oz Au; US$0.95/lb Pb. Ag Eq Oz total includes ounces derived from Pb. Robert Brown, P. Eng. is the Qualified Person under NI 43-101 for Guanajuato, Topia, San Ignacio and El Horcon.
Measured Tonnes Ag (g/t) Au (g/t) Pb (%) Zn (%) Ag (oz) Au (oz) Ag Eq Oz
Guanajuato 184,500 309 3.24 - - 1,832,500 19,780 3,190,300
Topia 71,000 911 1.70 6.91 5.42 2,080,000 3,900 3,190,000
Total Measured 3,912,500 23,680 6,380,300
Indicated Tonnes Ag (g/t) Au (g/t) Pb (%) Zn (%) Ag (oz) Au (oz) Ag Eq Oz
Guanajuato 36,000 335 2.20 - - 387,900 2,540 567,500 Topia 127,000 807 1.72 5.75 4.48 3,290,000 7,000 5,000,000 San Ignacio 180,300 159 3.49 - - 924,100 20,220 2,351,000
Total Indicated 4,602,000 29,760 7,918,500 Total Measured + Indicated 8,514,500 53,440 14,298,800
Inferred Tonnes Ag (g/t) Au (g/t) Pb (%) Zn (%) Ag (oz) Au (oz) Ag Eq Oz
Guanajuato 163,600 101 3.37 - - 532,600 17,710 1,782,200 Topia 209,500 863 1.68 5.37 4.54 5,810,000 11,300 8,560,000 San Ignacio 787,800 160 3.26 - - 4,060,000 82,680 9,897,000 El Horcon 149,200 78 3.51 2.82 - 375,300 16,830 2,081,200
Total Inferred 10,777,900 128,520 22,320,400

30
Gr8_Panther
GreatPantherSilver
Gr8_Panther
Great Panther Silver
Great Panther Silver Limited
SOCIAL SCENE Spiros Cacos, MA Director, Investor Relations D: +1 604 638 8955 TF: 1 888 355 1766 [email protected]