Embed Size (px)
Citation preview

Corporate Presentation November 10, 2016

This presentation contains forward-looking statements within the meaning of the United States Private Securities Litigation Reform Act of 1995 and forward-looking information within the meaning of the Securities Act (Ontario) (together, "forward-looking statements"). Such forward-looking statements may include but are not limited to the Company's plans for production at its Guanajuato and Topia Mines in Mexico, exploring its other properties in Mexico, the overall economic potential of its properties, the availability of adequate financing and involve known and unknown risks, uncertainties and other factors which may cause the actual results, performance or achievements expressed or implied by such forward-looking statements to be materially different. Such factors include, among others, risks and uncertainties relating to potential political risks involving the Company's operations in a foreign jurisdiction, uncertainty of production and cost estimates and the potential for unexpected costs and expenses, physical risks inherent in mining operations, currency fluctuations, fluctuations in the price of silver, gold and base metals, completion of economic evaluations, changes in project parameters as plans continue to be refined, the inability or failure to obtain adequate financing on a timely basis, and other risks and uncertainties, including those described in the Company's Annual Information Form for the year ended December 31, 2015 and Material Change Reports filed with the Canadian Securities Administrators available at www.sedar.com, and reports on Form 40-F and Form 6-K filed with the Securities and Exchange Commission and available at www.sec.gov. Statements concerning mineral reserve and resource estimates may also be deemed to constitute forward-looking statements to the extent that they involve estimates of the mineralization that will be encountered if the property is developed. Any statements that express or involve discussions with respect to predictions, expectations, beliefs, plans, projections, objectives, assumptions or future events or performance (often, but not always, using words or phrases such as “expects”, “anticipates”, “plans”, “projects”, “estimates”, “assumes”, “intends”, “strategy”, “goals”, “objectives”, “potential” or variations thereof, or stating that certain actions, events or results “may”, “could”, “would”, “might” or “will” be taken, occur or be achieved, or the negative of any of these terms and similar expressions) are not statements of historical fact and may be forward-looking statements. Robert Brown, P. Eng. is the Qualified Person under NI 43-101 for the projects discussed in this presentation.
2
DISCLAIMER

3
The terms "Measured resource", "Indicated resource" and "Inferred resource" used in this document are Canadian mining terms as defined in National Instrument 43-101 Standards of Disclosure for Mineral Projects (“NI 43-101”) and CIM Standards on Mineral Resources and Mineral Reserves. Mineral resources that are not mineral reserves have not been demonstrated to be economically and legally extractable. Mineral resource estimates do not account for mineability, selectivity, mining loss and dilution. It should not be assumed that all or any part of a resource will ever be converted to a reserve. The mineral resource estimates presented herein include Inferred mineral resources that are normally considered too speculative geologically to have economic considerations applied to them that would enable them to be categorized as mineral reserves. There is also no certainty that these Inferred resources will be converted to Measured and Indicated resource categories through further drilling, or into mineral reserves once economic considerations are applied. We advise U.S. Investors that while the terms "Measured resource", "Indicated resource" and "Inferred resource" are recognized and required to be reported by Canadian regulations, the U.S. Securities and Exchange Commission ("SEC") does not recognize these terms and does not normally permit such terms to be used in reports and registration statements filed with the SEC. As such, information contained in this document concerning descriptions of mineralization and resources under Canadian standards may not be comparable to similar information made public by U.S. companies subject to the reporting and disclosure requirements of the SEC. Inferred resources have a great amount of uncertainty as to their existence and a great uncertainty as to their economic and legal feasibility. It cannot be assumed that all or any part of a Measured, Indicated or Inferred resource will ever be upgraded to a higher category. U.S. investors are cautioned not to assume that any part or all of an Inferred mineral resource exists, or is economically or legally mineable. U.S. investors are also cautioned not to assume that any part or all of the mineral deposits in the Measured resource or Indicated resource categories will ever be converted into reserves.
CAUTIONARY NOTE TO U.S. INVESTORS

4 4
BUILDING A FOUNDATION FOR GROWTH
1. US Dollars; As at September 30, 2016
SILVER-GOLD 90% precious metals Unhedged - No Royalties - No Streams
PRODUCER Two 100% owned mining operations in Mexico; potential for production in Peru
GROWTH
Significantly lowered cost/oz through higher grades and operational efficiencies
STRENGTH Strong balance sheet; no debt; $52.9M cash, $68.2M working capital1
DISCIPLINED
Organic growth potential and seeking acquisitions

5
MAINTAINING LOW COSTS
5
3.8 – 3.9 Guidance
Cost per ounce has improved due to stronger USD and higher by-product credits
$6.50
$8.14
$4.20
$1.72 $3.30
$-
$5.00
$10.00
$15.00
$20.00
$25.00
Q3 2015 Q4 2015 Q1 2016 Q2 2016 Q3 2016
Total cash cost per Ag oz Average realized silver price
$13.08 $15.10
$10.49 $7.19
$11.97
$-
$5.00
$10.00
$15.00
$20.00
$25.00
Q3 2015 Q4 2015 Q1 2016 Q2 2016 Q3 2016
All-in sustaining cost per Ag oz Average realized silver price

6
RECENT FINANCIAL PERFORMANCE
3.8 – 3.9 Guidance
Maintained strong balance sheet, no debt
Solid revenue and gross profit achieved through increased production and significant reduction in cash cost
$13.98
$13.57
$16.19 $17.82
$19.65
$-
$5.00
$10.00
$15.00
$20.00
$25.00
$-
$2,000
$4,000
$6,000
$8,000
$10,000
$12,000
Q3 2015 Q4 2015 Q1 2016 Q2 2016 Q3 2016
Mine operating earnings before non-cash items
Average realized silver price
$13.98
$13.57
$16.19 $17.82
$19.65
$-
$5.00
$10.00
$15.00
$20.00
$25.00
$-
$5,000
$10,000
$15,000
$20,000
$25,000
Q3 2015 Q4 2015 Q1 2016 Q2 2016 Q3 2016
RevenueAverage realized silver price

7
AISC AMONGST OUR PEERS
GPR’s operations are outperforming many of our peers on AISC
Average Ag Spot
Price
$-
$5.00
$10.00
$15.00
$20.00
$25.00
San
Jose
Cayl
lom
a
Cons
olid
ated
Gua
nace
vi
Bola
nito
s
El C
ubo
Cons
olid
ated
La E
ncan
tada
La P
arill
a
Del T
oro
San
Mar
tin
La G
uita
rra
Sant
a El
ena
Cons
olid
ated
Plat
osa
Cosa
la
Gal
ena
Cons
olid
ated
Avin
o
GM
C
Topi
a
Cons
olid
ated
Fortuna Endeavour First Majestic Excellon Americas Silver AvinoSilver
GreatPanther
. FY 2015 AISC
8
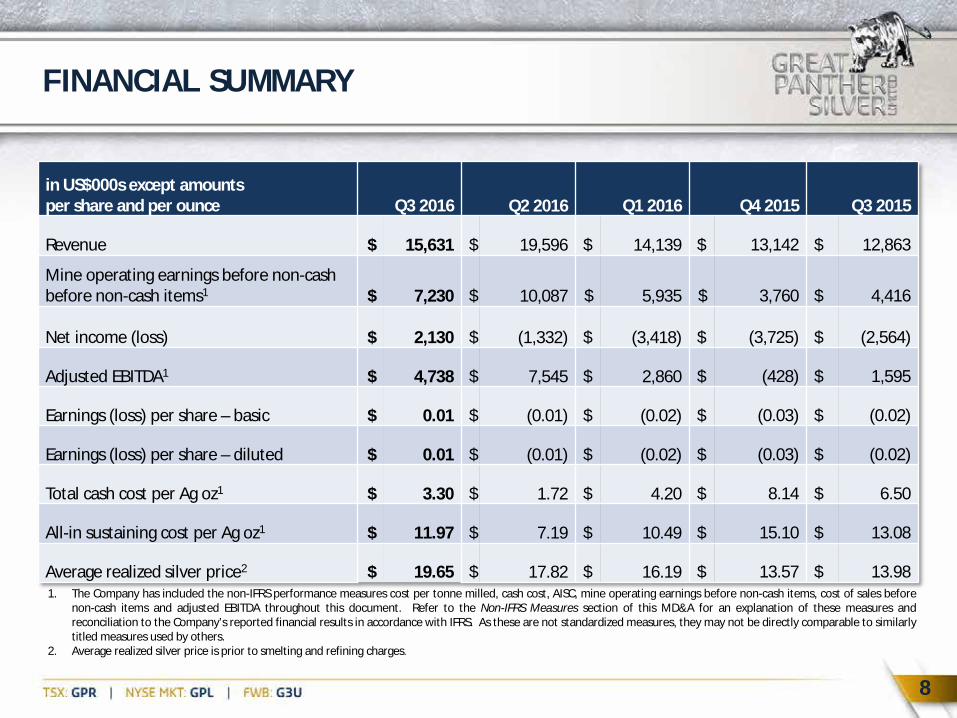
FINANCIAL SUMMARY
1. The Company has included the non-IFRS performance measures cost per tonne milled, cash cost, AISC, mine operating earnings before non-cash items, cost of sales before non-cash items and adjusted EBITDA throughout this document. Refer to the Non-IFRS Measures section of this MD&A for an explanation of these measures and reconciliation to the Company’s reported financial results in accordance with IFRS. As these are not standardized measures, they may not be directly comparable to similarly titled measures used by others.
2. Average realized silver price is prior to smelting and refining charges.
in US$000s except amounts per share and per ounce Q3 2016 Q2 2016 Q1 2016 Q4 2015 Q3 2015
Revenue $ 15,631 $ 19,596 $ 14,139 $ 13,142 $ 12,863
Mine operating earnings before non-cash before non-cash items1 $ 7,230 $ 10,087 $ 5,935 $ 3,760 $ 4,416
Net income (loss) $ 2,130 $
(1,332) $
(3,418) $ (3,725) $ (2,564)
Adjusted EBITDA1 $ 4,738 $ 7,545 $ 2,860 $ (428) $ 1,595
Earnings (loss) per share – basic $ 0.01 $ (0.01) $ (0.02) $ (0.03) $ (0.02)
Earnings (loss) per share – diluted $ 0.01 $ (0.01) $ (0.02) $ (0.03) $ (0.02)
Total cash cost per Ag oz1 $ 3.30 $ 1.72 $ 4.20 $ 8.14 $ 6.50
All-in sustaining cost per Ag oz1 $ 11.97 $ 7.19 $ 10.49 $ 15.10 $ 13.08
Average realized silver price2 $ 19.65 $ 17.82 $ 16.19 $ 13.57 $ 13.98

9
MEXICO
Top silver producing country in the world

10
One of Mexico’s most historic mining districts with past production of more than one billion Ag oz over 400 years
Expanding production at Guanajuato Mine Complex (GMC), developing new mines and exploring the district
Commercial production at San Ignacio commenced June 2014, lifting GMC throughput to 1,050 t/day
Excellent infrastructure means that other projects in the district have potential to be satellite operations
GUANAJUATO DISTRICT (Ag-Au)

11
GUANAJUATO MINE (Ag-Au)
Historic underground mine with two operating shafts & three ramps
Currently mining & developing to 600m depth on several zones over 4km strike length
Higher cut-off grades & improvements in grade control have lowered costs
Ag-Au concentrate shipped to smelters in Japan & Germany
* For details on Mineral Resource Estimates, refer to slide 28

12
GUANAJUATO MINE COMPLEX (Ag-Au)1
Accounted for 79% of total production in
Q3 2016
Q3 2016
Metal Production (Ag eq oz2) Silver Production (Ag oz1)
755,008 383,598
Recoveries Ag/Au 88.9% / 85.8%
Average Grades 164g/t Ag 2.36g/t Au
Cash Cost/Ag oz2,3,4 All-in Sustaining Cost/Ag oz2,3,4
$0.15 $5.58
Ore processed (tonnes) 81,602
1. Includes all mill feed from San Ignacio. 2. Silver equivalent ounces for 2016 are calculated using a 70:1 Ag:Au ratio. 3. Cash cost per silver payable ounce and all-in sustaining cost per silver payable ounce (“AISC”) are non-IFRS
performance measures. Refer to the “Non-IFRS Measures” section of the Company’s MD&A for an explanation of these measures and reconciliation to the Company’s reported financial results in accordance with IFRS. As these are not standardized measures, they may not be directly comparable to similarly titled measures used by others.
4. As at September 30, 2016.

13
SAN IGNACIO MINE (Ag-Au)
1. Silver equivalent ounces for 2016 are calculated using a 70:1 Ag:Au ratio.
Significant potential for resource expansion over 4km strike length
Accounted for 56% of the overall tonnes mined from the GMC in Q3 2016
Currently producing at 550 tpd, expanding to approximately 700 tpd by year end
Ramp access from surface. Ore trucked 22km to Cata Plant in Guanajuato

14
TOPIA MINE (Ag-Pb-Zn-Au)
Property covers most of district – more than 6,500 hectares
Operating 9 separate mines provides flexibility
High grade, narrow vein underground mining with central plant
Expanding production at profitable mines; Can temporarily close others as needed
Lead and zinc concentrates sold to metal trader in Mexico
Increased M&I Resources by 41%, Inferred Resources by 29%

15
TOPIA MINE (Ag-Pb-Zn-Au)
Q3 2016
Metal Production (Ag eq oz¹) Ag Production (Ag oz)
198,624 126,892
Recoveries Ag/Au Pb/Zn
89.7% / 54.3% 94.6% / 96.0%
Average Grades
322g/t Ag, 0.49g/t Au 1.92% Pb, 2.46% Zn
Cash Cost/Ag oz2,3 All-in Sustaining Cost/Ag oz2,3
$13.25 $19.52
Ore processed (tonnes) 13,680
1. Silver equivalent ounces for 2016 are calculated using a 70:1 Ag:Au ratio, and ratios of 1:0.0504 and 1:0.054 for the price/ounce of silver to lead and zinc respectively.
2. Cash cost per silver payable ounce and all-in sustaining cost per silver payable ounce (“AISC”) are non-IFRS performance measures. Refer to the “Non-IFRS Measures” section of the Company’s MD&A for an explanation of these measures and reconciliation to the Company’s reported financial results in accordance with IFRS. As these are not standardized measures, they may not be directly comparable to similarly titled measures used by others.
3. As at September 30, 2016.
Accounted for 21% of total production in Q3 2016

16
ANNUAL PRODUCTION GROWTH
3.8 – 3.9 Guidance
0
500,000
1,000,000
1,500,000
2,000,000
2,500,000
3,000,000
3,500,000
4,000,000
4,500,000
2011 2012 2013 2014 2015 2016E
2,200,013 2,378,603
2,840,846
3,187,832
4,159,121
Guidance 4,000,000 - 4,200,000

17
2016 OUTLOOK
1. Silver equivalent ounces for 2016 guidance have been calculated using a 70:1 Au:Ag ratio, and ratios of 1:0.0504 for the US dollar price of silver ounces to the US dollar price for lead and zinc pounds, respectively. These ratios will be applied consistently for the reporting of silver equivalent ounce production for 2016. 2. “Cash cost” and “AISC” are non-IFRS measures. Refer to the “Non-IFRS measures” section of the Company’s MD&A for complete definitions and reconciliations to the company’s financial statements.
Production and Cash Cost Guidance
FY 2015 Actual
2016 Original Guidance
2016 Revised Guidance
Total silver equivalent ounces 1 4,159,121 4,000,000 – 4,200,000 No Change
Cash Cost per silver payable ounce (USD) 2 $7.50 $5.00 – $7.00 $4.00 – $6.00
AISC (USD)2, 13.64 $13.00 – $15.00 $12.00 – $14.00

18
CAPITAL STRUCTURE
Shares issued 166,435,918
Fully diluted 186,210,684
Institutional ownership ~22%
Market capitalization CA $298M
90-day daily average trading volume ~2.0M shares
52-week trading range: TSX NYSE MKT
CA $0.54 - $2.82 US $0.41 - $2.25
Cash position1 US $52.9M (no debt)
Net working capital1 US $68.2 M
Updated on November 10, 2016 1. As at September 30, 2016.
Analyst Coverage: Euro Pacific Capital Inc., Rodman & Renshaw, Hallgarten & Company

19
ONE YEAR STOCK PERFORMANCE

20
12 MONTH PEER COMPARISON
CHANGE Excellon 470.97% Impact 396.55% Great Panther 198.33% Endeavour 193.97% Fortuna 176.79% Avino 131.34% Americas Silver 128.69% Sierra Metals 62.50% Silver 20.85%
-100%
-50%
0%
50%
100%
150%
200%
250%
300%
350%
400%
450%
500%
550%
600%
650%
700%
750%

21
Great Panther Silver
LEVERAGED TO SILVER
-100%
100%
300%
500%
700%
900%
1100%
1300%
1500%
2008 2009 2010 2011 2012 2013 2014 2015 2016

22
WHY GREAT PANTHER SILVER?
Low cost producer with strong leverage to silver price
Strong balance sheet, no debt – seeking acquisitions
Successfully grown production while reducing unit costs
Demonstrated ability to acquire and develop assets
Excellent liquidity on NYSE MKT and TSX

23
APPENDIX

24
DIRECTORS & SENIOR MANAGEMENT TEAM
Board of Directors
R.W. (Bob) Garnett, CPA, CA, ICD.D, Chairman; Robert Archer, P. Geo.; Ken Major, P. Eng.; John Jennings, MBA, CFA; W. James Mullin B.Sc.; Jeffrey R. Mason, CA, ICD.D
Robert Archer, P. Geo. President & CEO
Co-founder
Jim Zadra, CPA, CA, MBA Chief Financial Officer
Ali Soltani Chief Operating Officer
Robert Brown, P. Eng. VP Exploration & QP

25
SOCIAL PRINCIPLES
We are committed to fair and equitable employment conditions for our employees
We are committed to ensuring our employees and contractors return home safely every day
We are committed to enhancing and benefiting the communities in which we live and operate
We are committed to minimizing and restoring any impact on our environment
We are committed to strong ethics and we abide by all rules and regulations that apply to our business Awarded distinction as a “Socially Responsible
Company” by CEMEFI, Centro Mexicano para la Filantropía, for a fifth consecutive year in 2015

26
OPERATIONAL SUMMARY
Consolidated Operations Q3 2016 Q2 2016 Q1 2016 Q4 2015 Q3 2015
Tonnes Milled 95,282 99,905 88,683 94,874 93,730
Silver ounces 510,491 536,726 539,472 553,189 586,918
Gold ounces 5,423 6,010 5,599 5,637 6,079
Lead tonnes 248 290 282 278 341
Zinc tonnes 324 433 424 425 493
Silver equivalent ounces12 953,632 1,037,728 1,009,828 1,002,584 1,080,296
1. Silver equivalent ounces for 2016 are calculated using a 70:1 Ag:Au ratio, and a ratio of 1:0.0504 for the price/ounce of silver to lead and zinc price/pound respectively. 2. Silver equivalent ounces for 2015 are calculated using a 65:1 Ag:Au ratio, and ratios of 1:0.050 and 1:0.056 for the price/ounce of silver to lead and zinc price/pound,
respectively.

27
DRILLING SUMMARY
2016 Drilling focused on increasing resources and exploring new zones
2012 2013 2014 2015 2016
Guanajuato 29,254 m 26,237 m 13,270 m 13,025 m 9,670 m
Topia 8,059 m 2,162 m 1,903 m - 2,500 m
San Ignacio 9,310 m 1,144 m 3,827 m 4,657 m 6,015 m
Coricancha - - - 2,323 m 3,551 m
Santa Rosa 1,653 m - - - 1,000 m
El Horcon - 2,156 m - - 1,500 m
Total 48,276 m 31,699 m 19,000 m 20,005 m 24,236 m

28
RESOURCES
NOTE: Mineral Resource Estimates for Guanajuato and El Horcon use an effective date of July 31, 2015 while San Ignacio uses an effective date of December 31, 2015; and all used a metal price outlook of US$15.00/oz silver and US$1,100/oz gold.| Topia, November 2014 - US$1,200/oz Au, US$17.00/oz Ag, US$0.90/lb Pb, and US$0.95/lb Zn. Silver equivalent calculations used the same metal pricing. | San Ignacio, December 2015 - US$15.00/oz Ag; US$1100/oz Au. | Silver equivalent calculations for El Horcon include lead content but not zinc, as the zinc would not be recovered in the Guanajuato plant. Robert Brown, P. Eng. is the Qualified Person under NI 43-101 for Guanajuato, Topia, San Ignacio and El Horcon.
Measured Tonnes Ag (g/t) Au (g/t) Pb (%) Zn (%) Ag (oz) Au (oz) Ag Eq Oz
San Ignacio 249,800 151 3.39 1,210,100 27,200 3,130,400
Guanajuato 90,400 285 1.81 - - 829,000 5,300 1,200,600
Topia 180,400 606 1.44 4.26 4.52 3,515,000 8,300 6,000,200
Total Measured 5,554,100 40,800 10,331,200
Indicated Tonnes Ag (g/t) Au (g/t) Pb (%) Zn (%) Ag (oz) Au (oz) Ag Eq Oz
San Ignacio 110,500 133 2.79 - - 471,900 9,900 1,170,800 Guanajuato 59,400 245 1.04 - - 467,700 2,000 607,400 Topia 165,800 644 1.17 4.75 3.82 3,433,000 6,200 5,570,000
Total Indicated 4,372,600 18,100 7,348,200 Total Measured + Indicated 9,926,700 58,900 17,679,400
Inferred Tonnes Ag (g/t) Au (g/t) Pb (%) Zn (%) Ag (oz) Au (oz) Ag Eq Oz
San Ignacio 771,000 138 2.76 - - 3,428,500 68,500 8,266,200 Guanajuato 135,600 151 2.30 - - 656,400 10,000 1,363,300 Topia 357,400 592 1.31 3.44 3.96 6,807,500 15,060 11,050,000 El Horcon 128,700 82 3.64 2.97 4.11 339,400 15,000 1,906,000
Total Inferred 11,231,800 108,560 22,585,500

29
Spiros Cacos Director, Investor Relations D: +1 604 638 8955 TF: 1 888 355 1766 [email protected]
Gr8_Panther
GreatPantherSilver
Great Panther Silver
Great Panther Silver Limited
SOCIAL SCENE
Corporate Presentation November 10, 2016
![Untitled-2 [] · Romance Pink Avadable in Ramco PRODUCTS . An Clin Angelina Available in 5 ml ... PANTHER PANTHER PANTHER PANTHER Black Panther Available in 100 Ramco](https://img.pdfslide.net/doc/110x75/5b5319867f8b9a0d398b631e/untitled-2-romance-pink-avadable-in-ramco-products-an-clin-angelina-available.jpg)

![16.XXX R&R-LOOKBOOK 2-2016 148 x 148 4-4 · more balls than most – 6 mm beads available sizes 15 –16,5 17,5 and 19 cm black panther silver [ rr-60001–s] €42,50 black panther](https://img.pdfslide.net/doc/110x75/5fce24d7d1ea570ed87a7358/16xxx-rr-lookbook-2-2016-148-x-148-4-4-more-balls-than-most-a-6-mm-beads.jpg)