Embed Size (px)
DESCRIPTION
Citation preview
Global Equity Research 04 January 2010
Nothing But Net
2010 Internet Investment Guide
Internet
Imran KhanAC
(1-212) 622-6693 [email protected]
J.P. Morgan Securities Inc.
Bridget WeishaarAC
(1-212) 622-5032 [email protected]
J.P. Morgan Securities Inc.
Lev Polinsky, CFA (1-212) 622-8343 [email protected]
J.P. Morgan Securities Inc.
Vasily KarasyovAC
(1-212) 622-5401 [email protected]
J.P. Morgan Securities Inc.
Shelby Taffer (212) 622-6518 [email protected]
J.P. Morgan Securities Inc.
China Internet
Dick WeiAC
(852) 2800-8535 [email protected]
J.P. Morgan Securities (Asia Pacific) Limited
See page 326 for analyst certification and important disclosures, including non-US analyst disclosures. J.P. Morgan does and seeks to do business with companies covered in its research reports. As a result, investors should be aware that the firm may have a conflict of interest that could affect the objectivity of this report. Investors should consider this report as only a single factor in making their investment decision.
Please also see two separate notes out today changing our rating for MercadoLibre and introducing 2011 estimates for our internet coverage. All data and valuation priced as of 30 December 2009.
2
Global Equity Research 04 January 2010
Imran Khan (1-212) 622-6693 [email protected]
Table of Contents Key Investment Themes ..........................................................5 Dot.Khan’s Top Ten Things to Watch for in 2010 ................15
U.S. Sector Outlooks.................................... 17
State of Advertising Overview...............................................19 Online Advertising Primers ...................................................23 Search Advertising.................................................................28 Display Advertising................................................................32 Mobile Advertising .................................................................41 2010 eCommerce Outlook .....................................................50 2010 Online Payment Outlook...............................................60 Online Travel Agencies..........................................................69 Social Networks Primer .........................................................75 2010 Cloud Computing Outlook............................................82 eReader Market Outlook ........................................................89
International Sector Outlooks ..................... 97
China Internet Market Overview............................................99 Online Advertising................................................................105 Branded Advertising ............................................................112 Online Search........................................................................114 Online Gaming......................................................................121 eCommerce...........................................................................132
3
Global Equity Research 04 January 2010
Imran Khan (1-212) 622-6693 [email protected]
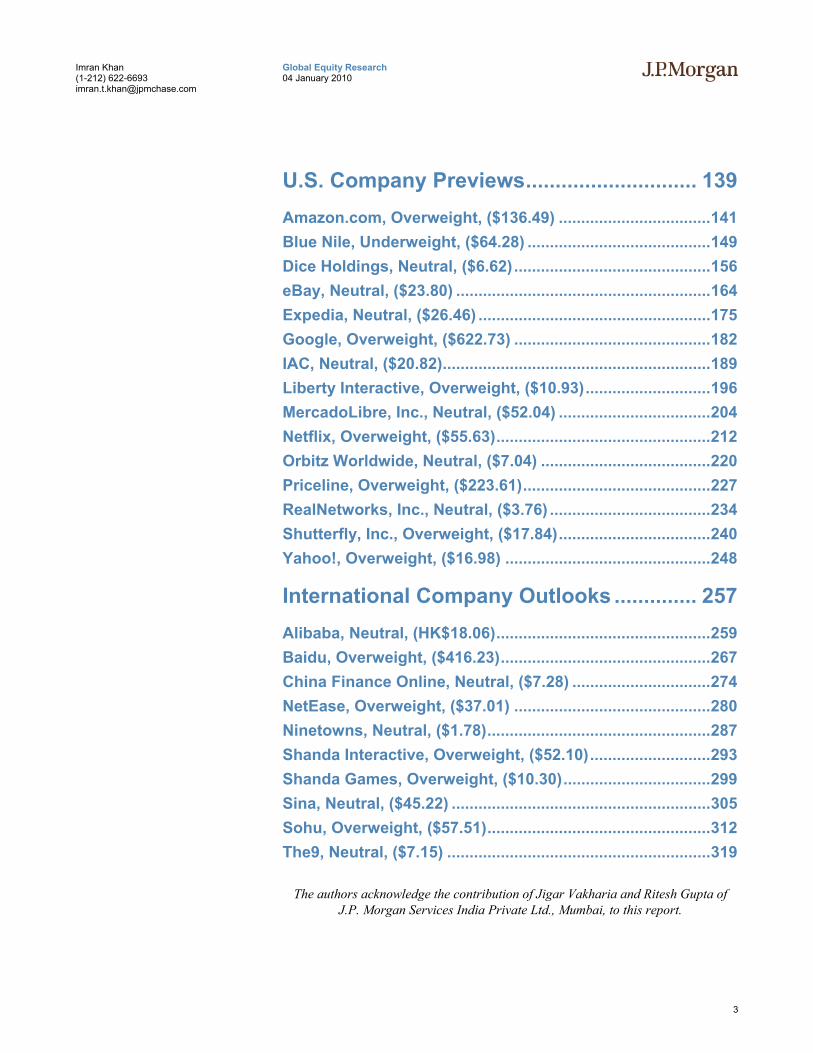
U.S. Company Previews............................. 139
Amazon.com, Overweight, ($136.49) ..................................141 Blue Nile, Underweight, ($64.28) .........................................149 Dice Holdings, Neutral, ($6.62)............................................156 eBay, Neutral, ($23.80) .........................................................164 Expedia, Neutral, ($26.46) ....................................................175 Google, Overweight, ($622.73) ............................................182 IAC, Neutral, ($20.82)............................................................189 Liberty Interactive, Overweight, ($10.93)............................196 MercadoLibre, Inc., Neutral, ($52.04) ..................................204 Netflix, Overweight, ($55.63)................................................212 Orbitz Worldwide, Neutral, ($7.04) ......................................220 Priceline, Overweight, ($223.61)..........................................227 RealNetworks, Inc., Neutral, ($3.76) ....................................234 Shutterfly, Inc., Overweight, ($17.84)..................................240 Yahoo!, Overweight, ($16.98) ..............................................248
International Company Outlooks .............. 257
Alibaba, Neutral, (HK$18.06)................................................259 Baidu, Overweight, ($416.23)...............................................267 China Finance Online, Neutral, ($7.28) ...............................274 NetEase, Overweight, ($37.01) ............................................280 Ninetowns, Neutral, ($1.78)..................................................287 Shanda Interactive, Overweight, ($52.10)...........................293 Shanda Games, Overweight, ($10.30).................................299 Sina, Neutral, ($45.22) ..........................................................305 Sohu, Overweight, ($57.51)..................................................312 The9, Neutral, ($7.15) ...........................................................319
The authors acknowledge the contribution of Jigar Vakharia and Ritesh Gupta of J.P. Morgan Services India Private Ltd., Mumbai, to this report.
4
Global Equity Research 04 January 2010
Imran Khan (1-212) 622-6693 [email protected]
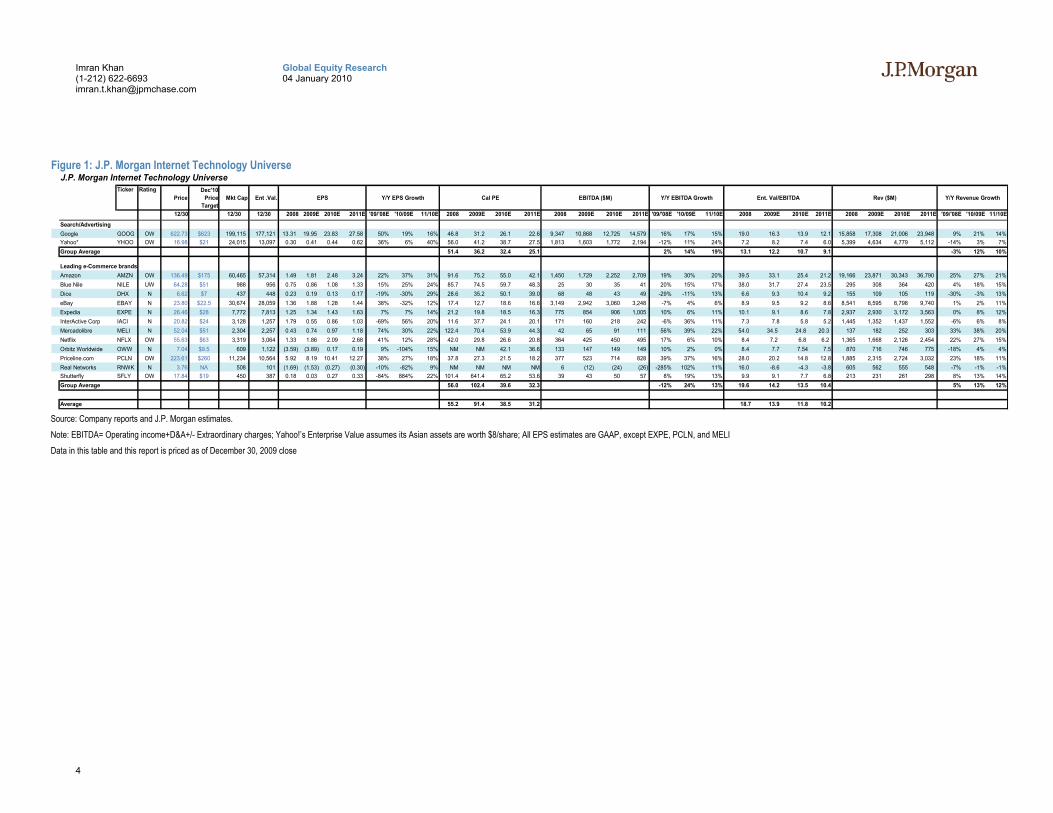
Figure 1: J.P. Morgan Internet Technology Universe
Ticker RatingPrice
Dec'10 Price
TargetMkt Cap Ent .Val. EPS Y/Y EPS Growth Cal PE EBITDA ($M) Y/Y EBITDA Growth Ent. Val/EBITDA Rev ($M) Y/Y Revenue Growth
12/30 12/30 12/30 2008 2009E 2010E 2011E '09/'08E '10/09E 11/10E 2008 2009E 2010E 2011E 2008 2009E 2010E 2011E '09/'08E '10/09E 11/10E 2008 2009E 2010E 2011E 2008 2009E 2010E 2011E '09/'08E '10/09E 11/10E
Search/AdvertisingGoogle GOOG OW 622.73 $623 199,115 177,121 13.31 19.95 23.83 27.58 50% 19% 16% 46.8 31.2 26.1 22.6 9,347 10,868 12,725 14,579 16% 17% 15% 19.0 16.3 13.9 12.1 15,858 17,308 21,006 23,948 9% 21% 14%Yahoo* YHOO OW 16.98 $21 24,015 13,097 0.30 0.41 0.44 0.62 36% 6% 40% 56.0 41.2 38.7 27.5 1,813 1,603 1,772 2,194 -12% 11% 24% 7.2 8.2 7.4 6.0 5,399 4,634 4,779 5,112 -14% 3% 7%Group Average 51.4 36.2 32.4 25.1 2% 14% 19% 13.1 12.2 10.7 9.1 -3% 12% 10%
Leading e-Commerce brandsAmazon AMZN OW 136.49 $175 60,465 57,314 1.49 1.81 2.48 3.24 22% 37% 31% 91.6 75.2 55.0 42.1 1,450 1,729 2,252 2,709 19% 30% 20% 39.5 33.1 25.4 21.2 19,166 23,871 30,343 36,790 25% 27% 21%Blue Nile NILE UW 64.28 $51 988 956 0.75 0.86 1.08 1.33 15% 25% 24% 85.7 74.5 59.7 48.3 25 30 35 41 20% 15% 17% 38.0 31.7 27.4 23.5 295 308 364 420 4% 18% 15%Dice DHX N 6.62 $7 437 448 0.23 0.19 0.13 0.17 -19% -30% 29% 28.6 35.2 50.1 39.0 68 48 43 49 -29% -11% 13% 6.6 9.3 10.4 9.2 155 109 105 119 -30% -3% 13%eBay EBAY N 23.80 $22.5 30,674 28,059 1.36 1.88 1.28 1.44 38% -32% 12% 17.4 12.7 18.6 16.6 3,149 2,942 3,060 3,248 -7% 4% 6% 8.9 9.5 9.2 8.6 8,541 8,595 8,798 9,740 1% 2% 11%Expedia EXPE N 26.46 $28 7,772 7,813 1.25 1.34 1.43 1.63 7% 7% 14% 21.2 19.8 18.5 16.3 775 854 906 1,005 10% 6% 11% 10.1 9.1 8.6 7.8 2,937 2,930 3,172 3,563 0% 8% 12%InterActive Corp IACI N 20.82 $24 3,128 1,257 1.79 0.55 0.86 1.03 -69% 56% 20% 11.6 37.7 24.1 20.1 171 160 218 242 -6% 36% 11% 7.3 7.8 5.8 5.2 1,445 1,352 1,437 1,552 -6% 6% 8%Mercadolibre MELI N 52.04 $51 2,304 2,257 0.43 0.74 0.97 1.18 74% 30% 22% 122.4 70.4 53.9 44.3 42 65 91 111 56% 39% 22% 54.0 34.5 24.8 20.3 137 182 252 303 33% 38% 20%Netflix NFLX OW 55.63 $63 3,319 3,064 1.33 1.86 2.09 2.68 41% 12% 28% 42.0 29.8 26.6 20.8 364 425 450 495 17% 6% 10% 8.4 7.2 6.8 6.2 1,365 1,668 2,126 2,454 22% 27% 15%Orbitz Worldwide OWW N 7.04 $9.5 609 1,122 (3.59) (3.89) 0.17 0.19 9% -104% 15% NM NM 42.1 36.6 133 147 149 149 10% 2% 0% 8.4 7.7 7.54 7.5 870 716 746 775 -18% 4% 4%Priceline.com PCLN OW 223.61 $260 11,234 10,564 5.92 8.19 10.41 12.27 38% 27% 18% 37.8 27.3 21.5 18.2 377 523 714 828 39% 37% 16% 28.0 20.2 14.8 12.8 1,885 2,315 2,724 3,032 23% 18% 11%Real Networks RNWK N 3.76 NA 508 101 (1.69) (1.53) (0.27) (0.30) -10% -82% 9% NM NM NM NM 6 (12) (24) (26) -285% 102% 11% 16.0 -8.6 -4.3 -3.8 605 562 555 548 -7% -1% -1%Shutterfly SFLY OW 17.84 $19 450 387 0.18 0.03 0.27 0.33 -84% 884% 22% 101.4 641.4 65.2 53.6 39 43 50 57 8% 19% 13% 9.9 9.1 7.7 6.8 213 231 261 298 8% 13% 14%Group Average 56.0 102.4 39.6 32.3 -12% 24% 13% 19.6 14.2 13.5 10.4 5% 13% 12%
Average 55.2 91.4 38.5 31.2 18.7 13.9 11.8 10.2
J.P. Morgan Internet Technology Universe
Source: Company reports and J.P. Morgan estimates. Note: EBITDA= Operating income+D&A+/- Extraordinary charges; Yahoo!’s Enterprise Value assumes its Asian assets are worth $8/share; All EPS estimates are GAAP, except EXPE, PCLN, and MELI Data in this table and this report is priced as of December 30, 2009 close
5
Global Equity Research 04 January 2010
Imran Khan (1-212) 622-6693 [email protected]
Key Investment Themes Display Advertising to Recover 2009 was a particularly difficult year for the display ad market (down approximately 5% in the US, vs. a low-single-digit decline for cable nets and flat for search), as CPMs were pressured from lower ad budgets reflective of macroeconomic weakness as well as an influx of non-premium inventory. We believe display advertising will still face challenges in attracting large brand advertisers and will likely underperform search market growth. However, we think an improvement in the display ad market will likely be driven by:
• a macroeconomic rebound
• premium publisher moves to focus on price integrity
• better formats of display advertising (e.g., Apple ad campaign)
• more rich media advertising
• better integration with ad content and sponsor base
Overall, we estimate display advertising should grow ~13% in 2010.
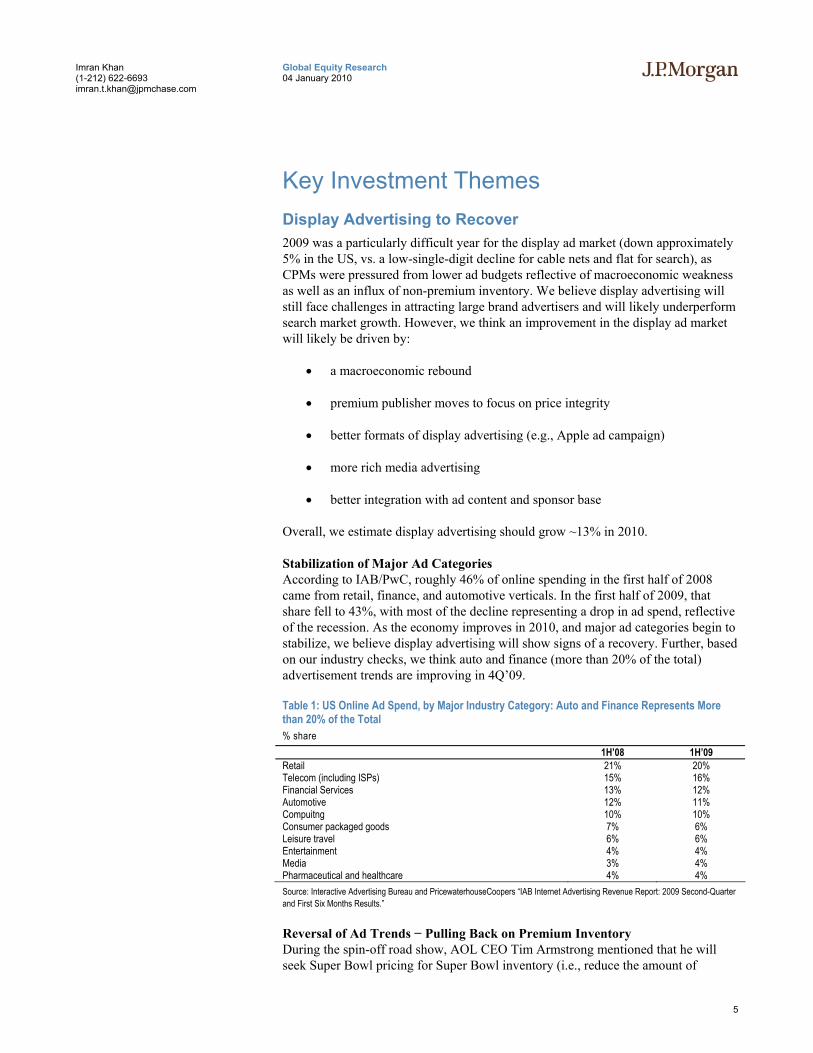
Stabilization of Major Ad Categories According to IAB/PwC, roughly 46% of online spending in the first half of 2008 came from retail, finance, and automotive verticals. In the first half of 2009, that share fell to 43%, with most of the decline representing a drop in ad spend, reflective of the recession. As the economy improves in 2010, and major ad categories begin to stabilize, we believe display advertising will show signs of a recovery. Further, based on our industry checks, we think auto and finance (more than 20% of the total) advertisement trends are improving in 4Q’09.
Table 1: US Online Ad Spend, by Major Industry Category: Auto and Finance Represents More than 20% of the Total % share
1H’08 1H’09 Retail 21% 20% Telecom (including ISPs) 15% 16% Financial Services 13% 12% Automotive 12% 11% Compuitng 10% 10% Consumer packaged goods 7% 6% Leisure travel 6% 6% Entertainment 4% 4% Media 3% 4% Pharmaceutical and healthcare 4% 4% Source: Interactive Advertising Bureau and PricewaterhouseCoopers “IAB Internet Advertising Revenue Report: 2009 Second-Quarter and First Six Months Results.”
Reversal of Ad Trends − Pulling Back on Premium Inventory During the spin-off road show, AOL CEO Tim Armstrong mentioned that he will seek Super Bowl pricing for Super Bowl inventory (i.e., reduce the amount of
6
Global Equity Research 04 January 2010
Imran Khan (1-212) 622-6693 [email protected]
inventory sold via ad.com). Considering AOL has a high-single-digit market share, we think AOL’s decision to do so will have a positive impact on the market. Additionally, according to press reports, CBS will stop selling premium inventory via third-party ad networks. We believe these moves by larger publishers will improve price integrity for the display advertising market as a whole.
New Forms of Display Advertising Should Increase the Attractiveness to Large Advertisers We have had several discussions with large advertisers who have indicated that display advertising is often ineffective because consumers do not pay attention to banners (banner blindness). We think many publishers are making a great strive to introduce ad formats beyond traditional ad banners, which we believe will increase effectiveness. As such, we expect the following new formats to emerge in 2010:
• Sponsorships
• Time-based
• Purchase data integration
• Better formatting, like Apple
Search Advertising Growth Should Accelerate We think the search advertising market is poised to have a solid year in 2010. In addition to having more favorable ad budgets as a whole, we think this industry will benefit from an increased share of advertising dollars and a recovery in CPCs. Within the US, we expect the market to start to enter the maturation phase. Specifically, we think internet population and query growth will slow and market share shifts will stabilize. However, we think international markets will continue to benefit from increased search usage and broadband subscriber growth.
US Market Share Shifts to Stabilize 2009 saw the introduction of Microsoft’s new search engine, Bing. As such, we conducted a survey in July to ascertain people’s perception of search engines. We surveyed over 750 people above 18 years of age nationwide to assess the impact of Bing on their search habits. We think the biggest impediment to Bing’s attempt to gain market share was that the majority of people are perfectly happy with their current search experience. 62.6% of participants claimed that there were no factors that they would improve on their current search experience.
However, our conversation with SEOs indicate that Microsoft’s Bing is gaining market share from other players, primarily Yahoo!. While we think cash back and Yahoo!’s discontinuation of toolbars and affiliate deals are helping Microsoft, we believe Bing is in fact gaining some share organically.
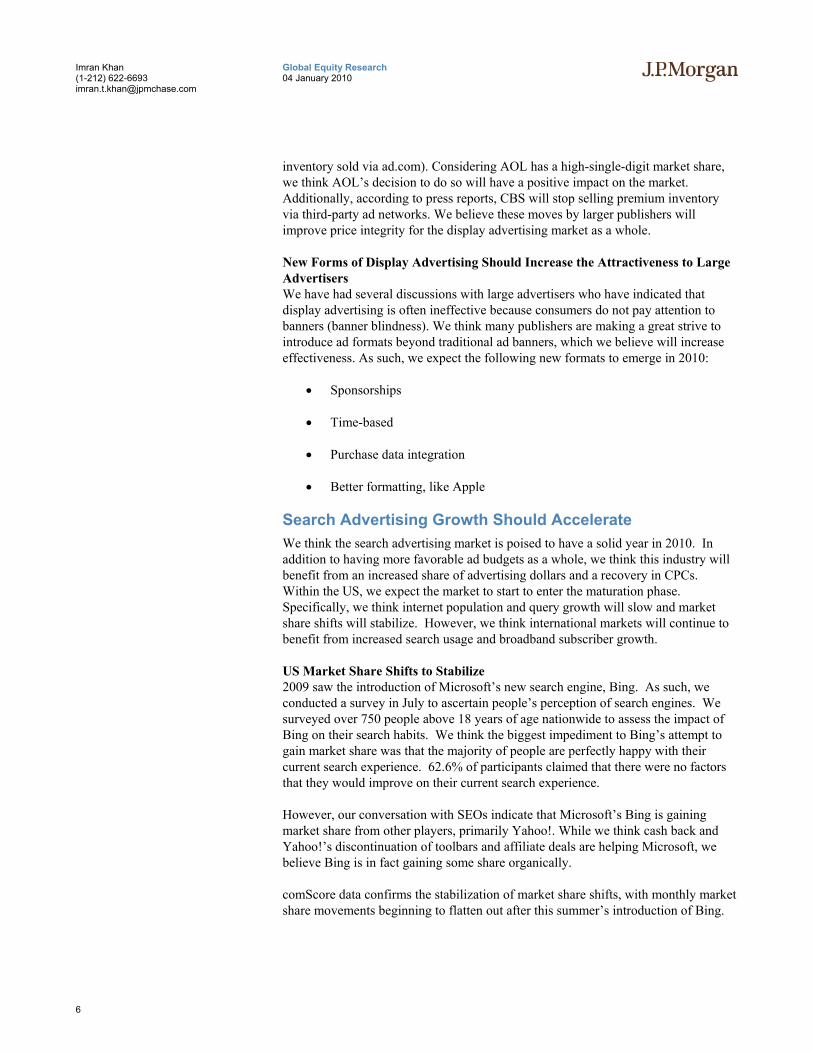
comScore data confirms the stabilization of market share shifts, with monthly market share movements beginning to flatten out after this summer’s introduction of Bing.
7
Global Equity Research 04 January 2010
Imran Khan (1-212) 622-6693 [email protected]
Table 2: Domestic Core Search Market Share Jan-09 Feb-09 Mar-09 Apr-09 May-09 Jun-09 Jul-09 Aug-09 Sep-09 Oct-09
Google Sites 63.0% 63.3% 63.7% 64.2% 65.0% 65.0% 64.7% 64.6% 64.9% 65.4% Yahoo! Sites 21.0% 20.6% 20.5% 20.4% 20.1% 19.6% 19.3% 19.3% 18.8% 18.0% Microsoft Sites 8.5% 8.2% 8.3% 8.2% 8.0% 8.4% 8.9% 9.3% 9.4% 9.9% AOL LLC 3.9% 3.9% 3.7% 3.4% 3.1% 3.1% 3.1% 3.0% 3.0% 2.9% Ask Network 3.7% 4.1% 3.8% 3.8% 3.9% 3.9% 3.9% 3.9% 3.9% 3.9%
Source: ComScore data and J.P. Morgan estimates.
International Strong Growth Opportunity In the US, search players generate ~$65 per internet user, while we estimate the international market generates ~$15 per search internet user. We think this gap is due to the following two reasons: 1) digitalization of content, and 2) lack of broadband penetration.
However, we estimate that advertising outside the US represents roughly 50% of global advertising revenues. As such, we believe there is significant growth potential in the international search markets. We think increased mobile penetration and faster broadband will help drive growth in 2010.
We Think eCommerce Will Continue to Capture Share in the Retail Market According to the US Department of Commerce, in the first nine months of 2009, US Retail sales were down 10% Y/Y, while US eCommerce sales were down just half of that (-5%). We think US growth in eCommerce (including eBay GMV) will experience a recovery in Y/Y growth rates as economic conditions improve. At the same time, we expect a greater proportion of retail sales to continue to shift online, driven by (1) increases in product selection, (2) continued Y/Y improvements online for brick-and-mortar retailers, (3) volatility and uncertainty in the offline retail space, and (4) further improved efficiencies from site optimization.
We see two trends that affect offline retail in a way we think should be a positive for online retailers:
Low Inventories Could Drive Consumers Online We think traditional retailers have been very conservative with merchandising during the 2009 holiday season. We expect online retailers to benefit from this defensive posture, as consumers who show up to brick-and-mortar stores and find that the items they are looking for are not available.
In this regard, eCommerce companies benefit from their less complicated supply chain: instead of needing to maintain appropriate stock levels at several hundred stores, web retailers only need to worry about inventory levels at one warehouse (or, at most, a handful of warehouses).
Brick-and-Mortar Bankruptcies A variety of brick-and-mortar retailers have gone through bankruptcy since the start of the economic downturn. We think offline bankruptcies can have the following effects on eCommerce:
8
Global Equity Research 04 January 2010
Imran Khan (1-212) 622-6693 [email protected]
• Near-term pricing pressure. As stores enter bankruptcy and close, the push to liquidate inventory could result in margin pressure on the survivors, both online and offline.
• Upheaval changes consumer behavior. We believe some consumers establish shopping habits and relationships with retailers that can be difficult to break. A bankruptcy can drive these customers, who would have otherwise been difficult to acquire, to examine alternative options and form new shopping habits. For some such shoppers, changes in the offline world could result in lower convenience (e.g., the store nearby closes and now the closest store is too far away), which would drive greater adoption of eCommerce.
• In the medium to long term, we think thinning the B&M herd could prove to be a positive for online retailers, which could find it easier to win and maintain wallet share in a marketplace with fewer competitors.
We think one significant winner is likely to continue to be Amazon, which stands to gain from the decline of players in both its core media arena (given the difficulties for Borders) and in its growing electronics business (Circuit City et al.) Similarly, we think Blue Nile could see its market share increase as traditional jewelers struggle.
9
Global Equity Research 04 January 2010
Imran Khan (1-212) 622-6693 [email protected]
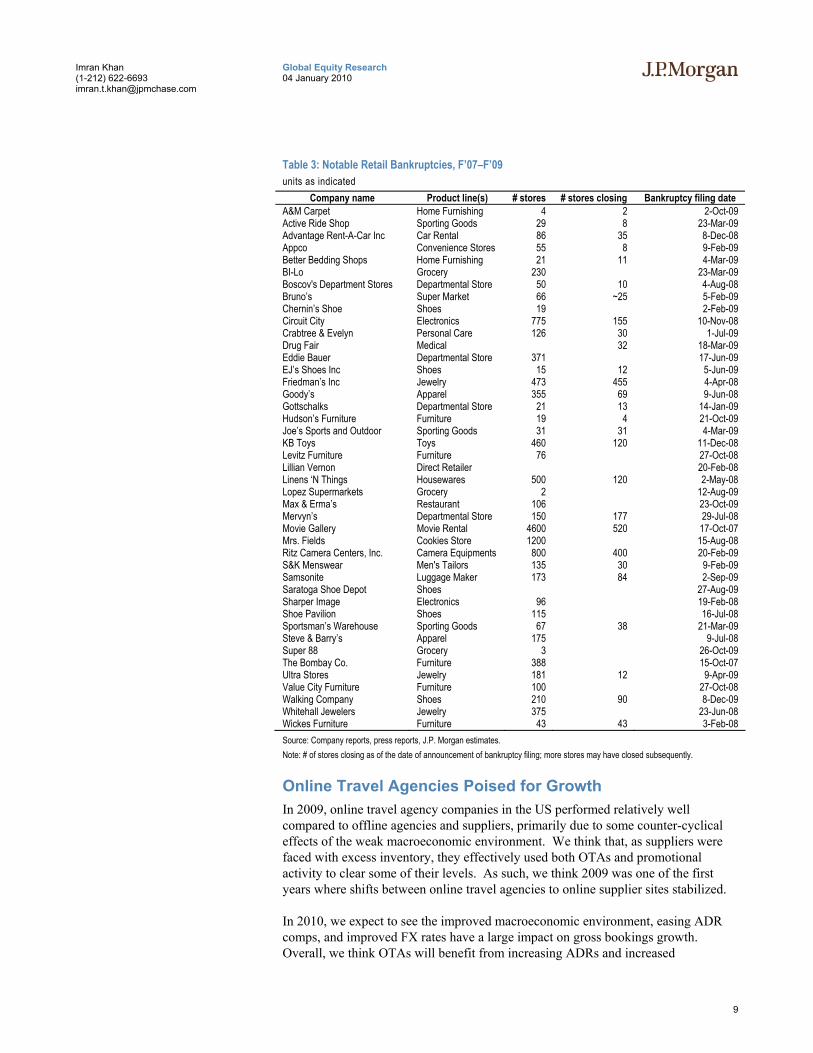
Table 3: Notable Retail Bankruptcies, F’07–F’09 units as indicated
Company name Product line(s) # stores # stores closing Bankruptcy filing date A&M Carpet Home Furnishing 4 2 2-Oct-09 Active Ride Shop Sporting Goods 29 8 23-Mar-09 Advantage Rent-A-Car Inc Car Rental 86 35 8-Dec-08 Appco Convenience Stores 55 8 9-Feb-09 Better Bedding Shops Home Furnishing 21 11 4-Mar-09 BI-Lo Grocery 230 23-Mar-09 Boscov's Department Stores Departmental Store 50 10 4-Aug-08 Bruno’s Super Market 66 ~25 5-Feb-09 Chernin’s Shoe Shoes 19 2-Feb-09 Circuit City Electronics 775 155 10-Nov-08 Crabtree & Evelyn Personal Care 126 30 1-Jul-09 Drug Fair Medical 32 18-Mar-09 Eddie Bauer Departmental Store 371 17-Jun-09 EJ’s Shoes Inc Shoes 15 12 5-Jun-09 Friedman’s Inc Jewelry 473 455 4-Apr-08 Goody’s Apparel 355 69 9-Jun-08 Gottschalks Departmental Store 21 13 14-Jan-09 Hudson’s Furniture Furniture 19 4 21-Oct-09 Joe’s Sports and Outdoor Sporting Goods 31 31 4-Mar-09 KB Toys Toys 460 120 11-Dec-08 Levitz Furniture Furniture 76 27-Oct-08 Lillian Vernon Direct Retailer 20-Feb-08 Linens ‘N Things Housewares 500 120 2-May-08 Lopez Supermarkets Grocery 2 12-Aug-09 Max & Erma’s Restaurant 106 23-Oct-09 Mervyn’s Departmental Store 150 177 29-Jul-08 Movie Gallery Movie Rental 4600 520 17-Oct-07 Mrs. Fields Cookies Store 1200 15-Aug-08 Ritz Camera Centers, Inc. Camera Equipments 800 400 20-Feb-09 S&K Menswear Men's Tailors 135 30 9-Feb-09 Samsonite Luggage Maker 173 84 2-Sep-09 Saratoga Shoe Depot Shoes 27-Aug-09 Sharper Image Electronics 96 19-Feb-08 Shoe Pavilion Shoes 115 16-Jul-08 Sportsman’s Warehouse Sporting Goods 67 38 21-Mar-09 Steve & Barry’s Apparel 175 9-Jul-08 Super 88 Grocery 3 26-Oct-09 The Bombay Co. Furniture 388 15-Oct-07 Ultra Stores Jewelry 181 12 9-Apr-09 Value City Furniture Furniture 100 27-Oct-08 Walking Company Shoes 210 90 8-Dec-09 Whitehall Jewelers Jewelry 375 23-Jun-08 Wickes Furniture Furniture 43 43 3-Feb-08 Source: Company reports, press reports, J.P. Morgan estimates. Note: # of stores closing as of the date of announcement of bankruptcy filing; more stores may have closed subsequently.
Online Travel Agencies Poised for Growth In 2009, online travel agency companies in the US performed relatively well compared to offline agencies and suppliers, primarily due to some counter-cyclical effects of the weak macroeconomic environment. We think that, as suppliers were faced with excess inventory, they effectively used both OTAs and promotional activity to clear some of their levels. As such, we think 2009 was one of the first years where shifts between online travel agencies to online supplier sites stabilized.
In 2010, we expect to see the improved macroeconomic environment, easing ADR comps, and improved FX rates have a large impact on gross bookings growth. Overall, we think OTAs will benefit from increasing ADRs and increased
10
Global Equity Research 04 January 2010
Imran Khan (1-212) 622-6693 [email protected]
international online penetration. However, increased business travel may potentially hurt volume growth rates.
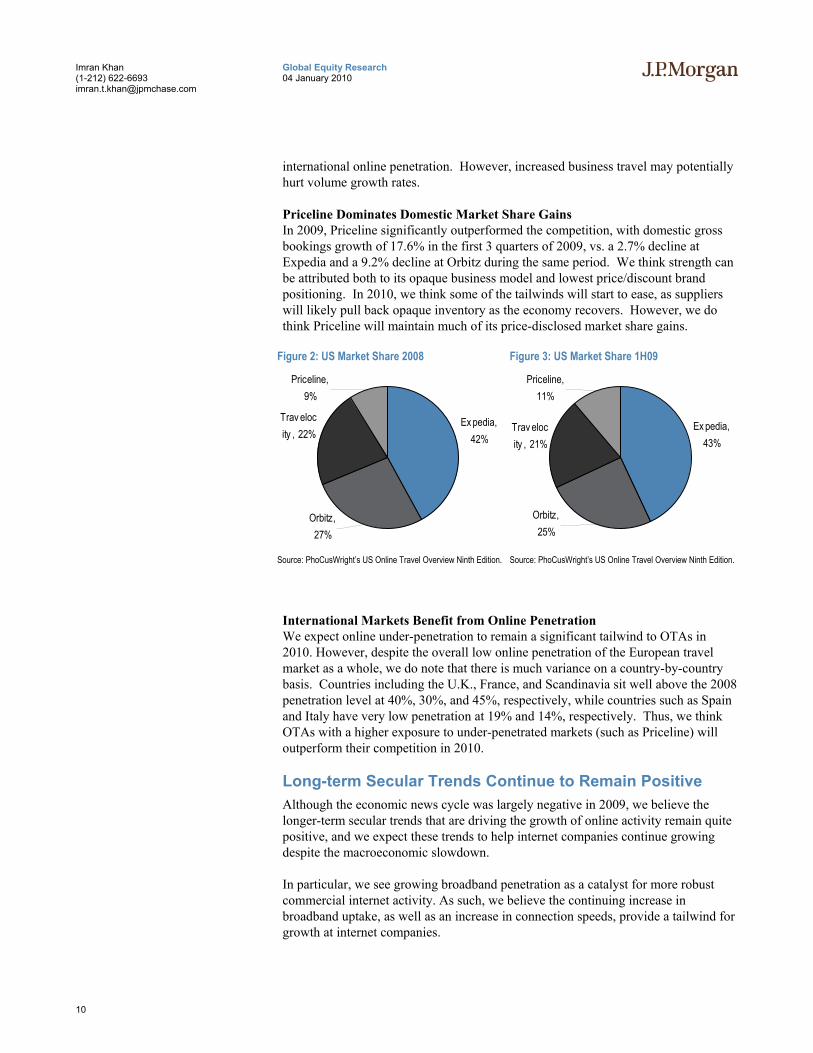
Priceline Dominates Domestic Market Share Gains In 2009, Priceline significantly outperformed the competition, with domestic gross bookings growth of 17.6% in the first 3 quarters of 2009, vs. a 2.7% decline at Expedia and a 9.2% decline at Orbitz during the same period. We think strength can be attributed both to its opaque business model and lowest price/discount brand positioning. In 2010, we think some of the tailwinds will start to ease, as suppliers will likely pull back opaque inventory as the economy recovers. However, we do think Priceline will maintain much of its price-disclosed market share gains.
Figure 2: US Market Share 2008
Ex pedia, 42%
Trav elocity , 22%
Priceline, 9%
Orbitz, 27%
Source: PhoCusWright’s US Online Travel Overview Ninth Edition.
Figure 3: US Market Share 1H09
Ex pedia, 43%
Trav elocity , 21%
Orbitz, 25%
Priceline, 11%
Source: PhoCusWright’s US Online Travel Overview Ninth Edition.
International Markets Benefit from Online Penetration We expect online under-penetration to remain a significant tailwind to OTAs in 2010. However, despite the overall low online penetration of the European travel market as a whole, we do note that there is much variance on a country-by-country basis. Countries including the U.K., France, and Scandinavia sit well above the 2008 penetration level at 40%, 30%, and 45%, respectively, while countries such as Spain and Italy have very low penetration at 19% and 14%, respectively. Thus, we think OTAs with a higher exposure to under-penetrated markets (such as Priceline) will outperform their competition in 2010.
Long-term Secular Trends Continue to Remain Positive Although the economic news cycle was largely negative in 2009, we believe the longer-term secular trends that are driving the growth of online activity remain quite positive, and we expect these trends to help internet companies continue growing despite the macroeconomic slowdown.
In particular, we see growing broadband penetration as a catalyst for more robust commercial internet activity. As such, we believe the continuing increase in broadband uptake, as well as an increase in connection speeds, provide a tailwind for growth at internet companies.
11
Global Equity Research 04 January 2010
Imran Khan (1-212) 622-6693 [email protected]
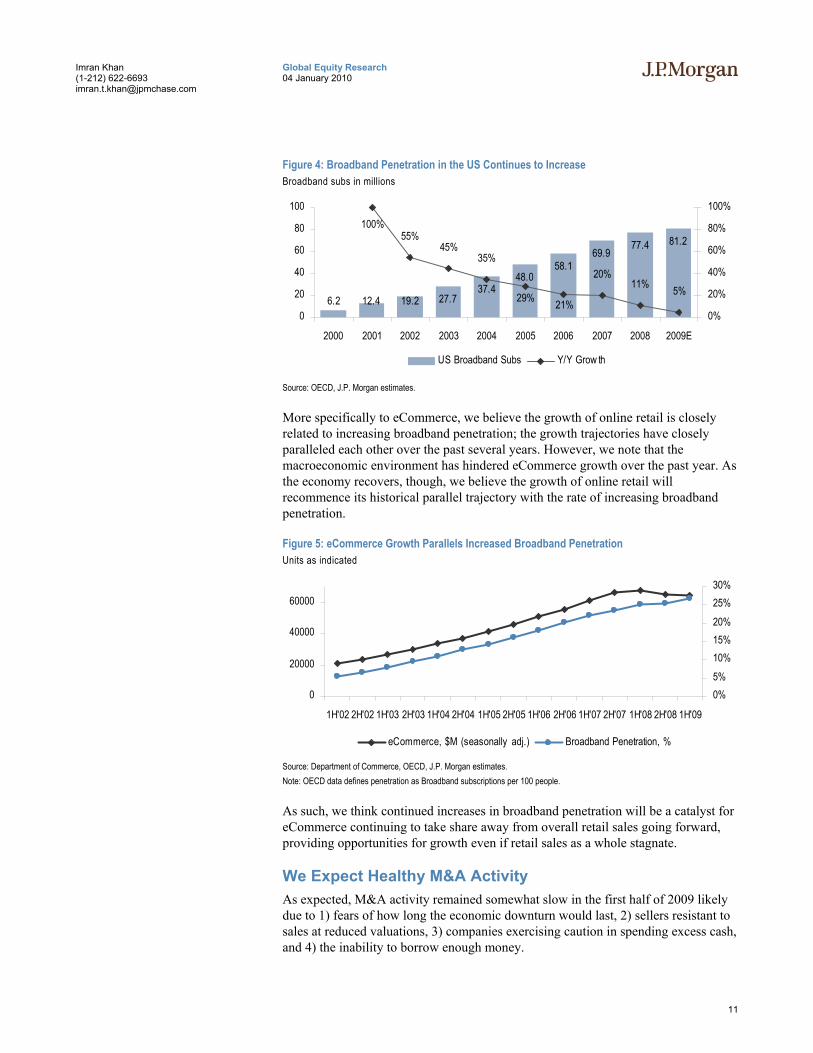
Figure 4: Broadband Penetration in the US Continues to Increase Broadband subs in millions
6.2 12.4 19.2 27.737.4
48.058.1
69.977.4 81.255%
45%35%
20%11% 5%
100%
29% 21%0
20
40
60
80
100
2000 2001 2002 2003 2004 2005 2006 2007 2008 2009E
0%
20%
40%
60%
80%
100%
US Broadband Subs Y/Y Grow th
Source: OECD, J.P. Morgan estimates.
More specifically to eCommerce, we believe the growth of online retail is closely related to increasing broadband penetration; the growth trajectories have closely paralleled each other over the past several years. However, we note that the macroeconomic environment has hindered eCommerce growth over the past year. As the economy recovers, though, we believe the growth of online retail will recommence its historical parallel trajectory with the rate of increasing broadband penetration.
Figure 5: eCommerce Growth Parallels Increased Broadband Penetration Units as indicated
0
20000
40000
60000
1H'02 2H'02 1H'03 2H'03 1H'04 2H'04 1H'05 2H'05 1H'06 2H'06 1H'07 2H'07 1H'08 2H'08 1H'09
0%5%10%15%20%25%30%
eCommerce, $M (seasonally adj.) Broadband Penetration, %
Source: Department of Commerce, OECD, J.P. Morgan estimates. Note: OECD data defines penetration as Broadband subscriptions per 100 people.
As such, we think continued increases in broadband penetration will be a catalyst for eCommerce continuing to take share away from overall retail sales going forward, providing opportunities for growth even if retail sales as a whole stagnate.
We Expect Healthy M&A Activity As expected, M&A activity remained somewhat slow in the first half of 2009 likely due to 1) fears of how long the economic downturn would last, 2) sellers resistant to sales at reduced valuations, 3) companies exercising caution in spending excess cash, and 4) the inability to borrow enough money.

12
Global Equity Research 04 January 2010
Imran Khan (1-212) 622-6693 [email protected]
However, in the second half of 2009, we saw a modest pick-up as management teams began to feel more comfortable with the economic outlook. For example, in October 2009, Adobe’s acquisition of Omniture was completed, a transaction worth approximately $1.8B on a fully-diluted equity value basis.
In 2010, as market fundamentals continue to improve, we expect M&A activity to increase. To the extent acquirers are willing to part with cash, we expect them to have the resources: large internet and media companies continue to generate significant cash flows. At the large-cap internet companies, we expect 36% FCF growth in F’09, and 12% growth in F’10. Including the Media universe, the respective expectations are for 2% growth in ’09 and 17% in ’10. Including Microsoft, J.P. Morgan estimates call for nearly $50B in FCF generated in the broader internet space in F’10. As such, we expect to see more cash deals. Additionally, the loosening of the credit markets should make financing more accessible to companies seeking to borrow funds.
Table 4: We Project $17B+ in FCF at Large Internet Companies $ in millions
2008 2009E 2010E GOOG 5,494 8,559 9,303 YHOO 1,312 1,219 1,392 AMZN 1,364 2,386 2,737 EBAY 2,316 2,095 2,476 PCLN 288 487 600 EXPE 361 439 499 TWX 4,177 3,175 3,099 DIS 3,868 3,311 4,239 NWS 2,482 1,147 2,258 VIA 1,748 1,980 1,995 CBS 1,672 750 1,178 MSFT 16,375 17,070 16,768 Total 41,458 42,619 46,545 Y/Y Growth 3% 9% All excluding MSFT 25,083 25,549 29,777 Y/Y Growth 2% 17% Large-Cap Internet 11,135 15,186 17,007 Y/Y Growth 36% 12% Source: Company reports and J.P. Morgan estimates. Note: For Disney and News Corp., fiscal year data used rather than calendar year.

13
Global Equity Research 04 January 2010
Imran Khan (1-212) 622-6693 [email protected]
Table 5: Selected M&A Activity in the Internet Space, 2009 Symbol Deal Type Date Annc’d Target Acquirer Seller Annc’d Tot Payment Status
IACI ACQ 3/26/2009 Sportspickle.Com IAC/Interactivecorp N/A Cash Complete DIS DIV 4/1/2009 Multiple Targets Walt Disney Co Kab Distribution Inc 18.4 Cash Complete EBAY DIV 4/13/2009 Stumbleupon Inc Multiple Acquirers eBay Inc N/A Cash Complete DIS ACQ 4/30/2009 Hulu LLC Walt Disney Co N/A Undisclosed Complete TWX SPIN 5/28/2009 Aol Inc Shareholders Time Warner Inc 2512.42 Complete DHX ACQ 6/11/2009 Allhealthcarejobs.Com Dice Holdings Inc 3.73 Cash & Stock Complete TWX ACQ 6/11/2009 Multiple Targets Time Warner Inc N/A Undisclosed Complete IACI DIV 7/7/2009 People Media IAC/Interactivecorp American Capital Ltd 57 Cash Complete TWX ACQ 7/15/2009 mmafighting.Com Time Warner Inc N/A Cash Complete GOOG ACQ 8/5/2009 On2 Technologies Inc Google Inc 105.45 Stock Pending EBAY DIV 9/1/2009 Skype Technologies SA Multiple Acquirers eBay Inc 2025 Cash and Debt Complete NWSA DIV 9/24/2009 Pinnacor Inc Yellowbrix Inc News Corp N/A Undisclosed Complete ADBE ACQ 10/23/2009 Omniture, Inc. Adobe Systems Inc. NA Cash Complete GOOG ACQ 11/23/2009 Teracent Google Inc N/A Undisclosed Pending GOOG ACQ 12/4/2009 Appjet Inc Google Inc N/A Undisclosed Complete Source: Bloomberg, company reports, news reports.
We continue to see three key factors as motivating drivers for M&A activity in the internet space:
• Traffic. Developing high-traffic sites is difficult, and larger companies are often willing to pay for sites that have proven an ability to generate traffic.
• Technology. Companies that develop a technology that is difficult or uneconomical to replicate are often targets for acquisitions; such companies may also generate traffic but the technology is often a motivator for the buyer.
• Transactional. Companies with a proven track record of revenue and sales generation can make attractive targets, as well; an example of a transactional-focused acquisition is the 2007 purchase of Mezimedia by ValueClick.
Key Attributes of Acquisition Targets We believe the attributes that potential acquirers will seek in a target include:
• Brand strength. Acquirers will likely seek a company that garners recognition and respect from both its customers and its partners.
• Product leadership. We think acquirers hold the power in this weak M&A environment and, as such, will seek out companies that have the best product as viewed by customers, partners, and competitors.
• Ease of integration. With an increasing focus on profitability in this weak economy, we think companies will attach more importance to the level of challenge in integrating the company and the time required to recognize synergies.
• Barriers to entry. This will likely be a key determining factor in the build vs. buy decision making process.
Within our universe, we believe the two independent companies that best embody these attributes are MercadoLibre and Netflix.
IPO Market Should Pick Up in 2010 As predicted in our Nothing but Net 2009 report, the IPO market remained fairly difficult in 2009. However, as market conditions improve and we see an increase in

14
Global Equity Research 04 January 2010
Imran Khan (1-212) 622-6693 [email protected]
cash flow, we think the IPO market will show signs of a recovery in 2010 with the internet sector as a leading driver of growth.
Table 6: Internet and Related IPOs, F’09 Units as indicated
Pricing Date Issuer Name Symbol Amt ($M) Mkt cap ($M) % mcap Offering Price Price, 12/15 Performance 04/01/09 Changyou.Com Ltd CYOU 138 1,664 8% 16.00 32.40 103% 05/13/09 Digitalglobe Inc DGI 279 1,058 26% 19.00 23.54 24% 05/19/09 Solarwinds Inc SWI 174 1,373 13% 12.50 21.09 69% 05/20/09 Opentable Inc OPEN 69 592 12% 20.00 26.48 32% 06/24/09 Medidata Solutions Inc MDSO 101 356 28% 14.00 15.72 12% 06/30/09 Logmein Inc LOGM 123 468 26% 16.00 20.97 31% 09/23/09 Vitacost.Com Inc VITC 132 251 53% 12.00 9.12 -24% 09/24/09 Shanda Games Ltd GAME 1,044 2,947 35% 12.50 10.23 -18% 11/04/09 Ancestry.Com Inc ACOM 100 594 17% 13.50 14.00 4% 11/19/09 Archipelago Learning Inc ARCL 119 477 25% 16.50 19.00 15%
Source: Company reports, Bloomberg, J.P. Morgan estimates.
Our Top Picks In our coverage universe, we think Amazon (Price Target $175), Yahoo! (Price Target $21), Priceline (Price Target $260), and Netflix (Price Target $63) are the best positioned global internet companies and offer the best risk/reward return for investors. Please see the appropriate company sections for a detailed analysis of our thesis.
15
Global Equity Research 04 January 2010
Imran Khan (1-212) 622-6693 [email protected]
Dot.Khan’s Top Ten Things to Watch for in 2010
1. Is display advertising secular or cyclical?
2. Can Yahoo! turn around its business?
3. Increased M&A activity
4. Continued growth of casual and social gaming and its impact on console gaming
5. Rapid growth of mobile search and increased monetization in international markets
6. Improved monetization of social networking; is social networking a new gateway?
7. More innovation for online payments
8. App economy on social networking and mobile platforms and its impact on the broader market
9. Can we see further margins improvement?
10. Rapid growth of the eCommerce market at the expense of brick-and-mortar stores; is Amazon on its way to become the new Wal-Mart?

17
Global Equity Research 04 January 2010
Imran Khan (1-212) 622-6693 [email protected]
U.S. Sector Outlooks
U.S
. Sec
tor
Out
look
s
19
Global Equity Research 04 January 2010
Imran Khan (1-212) 622-6693 [email protected]
State of Advertising Overview We think the online advertising market is at an interesting inflection point. On the one hand, time spent online continues to grow, DVR usage is on the rise, and newspaper advertising revenues are consistently declining. However, advertisers and content providers still seem to be struggling with targeting, successful brand advertising campaigns, copyright issues, and the massive amounts of inventory. Below we will look at drivers of the total advertising market and then in the following sections, we will study the issues relating specifically to search, display, video, and mobile advertising.
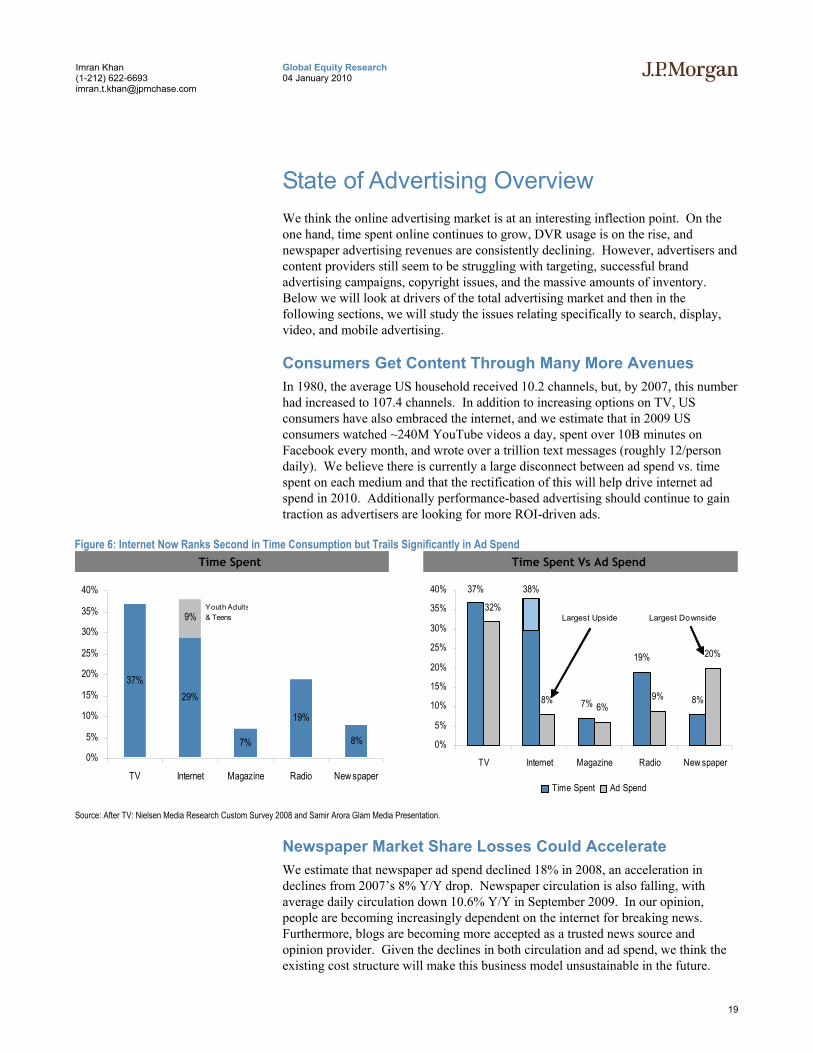
Consumers Get Content Through Many More Avenues In 1980, the average US household received 10.2 channels, but, by 2007, this number had increased to 107.4 channels. In addition to increasing options on TV, US consumers have also embraced the internet, and we estimate that in 2009 US consumers watched ~240M YouTube videos a day, spent over 10B minutes on Facebook every month, and wrote over a trillion text messages (roughly 12/person daily). We believe there is currently a large disconnect between ad spend vs. time spent on each medium and that the rectification of this will help drive internet ad spend in 2010. Additionally performance-based advertising should continue to gain traction as advertisers are looking for more ROI-driven ads.
Figure 6: Internet Now Ranks Second in Time Consumption but Trails Significantly in Ad Spend
37%
7%
19%
8%
9%
29%
0%
5%
10%
15%
20%
25%
30%
35%
40%
TV Internet Magazine Radio New spaper
Youth Adults& Teens
Time Spent Vs Ad SpendTime Spent Vs Ad SpendTime SpentTime Spent
37% 38%
7%
19%
8%8%6%
9%
20%
32%
0%
5%
10%
15%
20%
25%
30%
35%
40%
TV Internet Magazine Radio New spaper
Time Spent Ad Spend
Largest DownsideLargest Upside
Source: After TV: Nielsen Media Research Custom Survey 2008 and Samir Arora Glam Media Presentation.
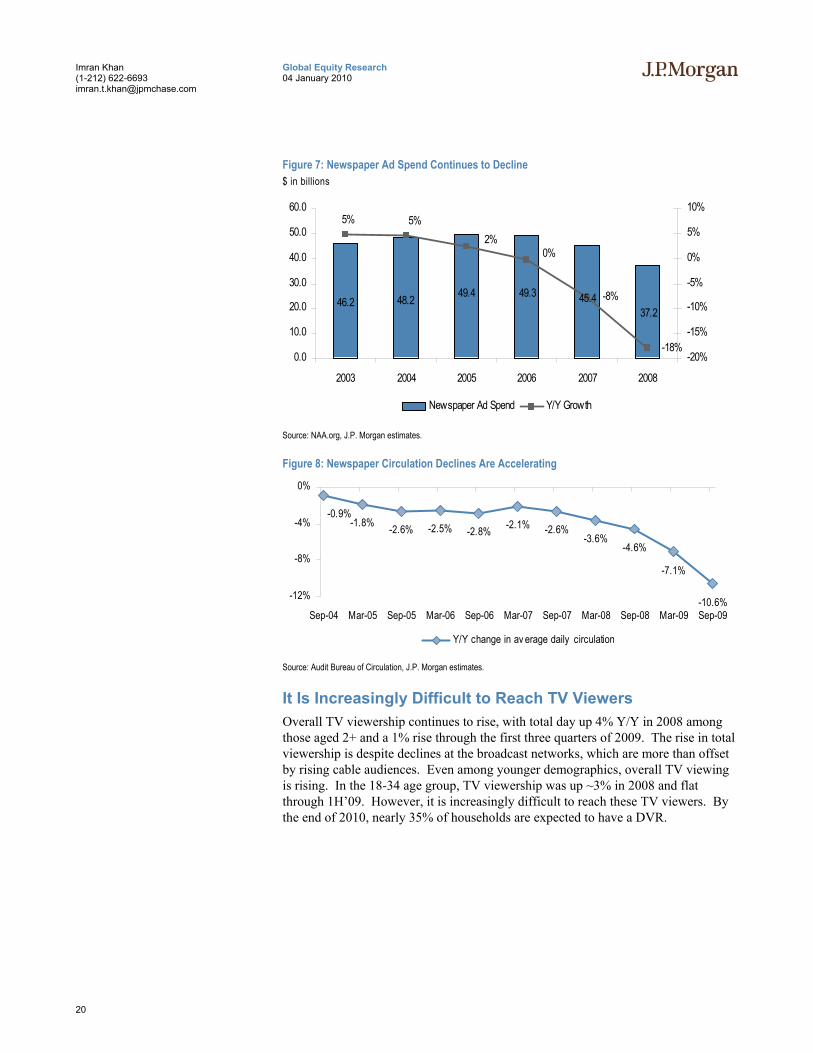
Newspaper Market Share Losses Could Accelerate We estimate that newspaper ad spend declined 18% in 2008, an acceleration in declines from 2007’s 8% Y/Y drop. Newspaper circulation is also falling, with average daily circulation down 10.6% Y/Y in September 2009. In our opinion, people are becoming increasingly dependent on the internet for breaking news. Furthermore, blogs are becoming more accepted as a trusted news source and opinion provider. Given the declines in both circulation and ad spend, we think the existing cost structure will make this business model unsustainable in the future.
20
Global Equity Research 04 January 2010
Imran Khan (1-212) 622-6693 [email protected]
Figure 7: Newspaper Ad Spend Continues to Decline $ in billions
46.2 48.2 49.4 49.337.2
45.4
-18%
-8%
0%2%
5%5%
0.0
10.0
20.0
30.0
40.0
50.0
60.0
2003 2004 2005 2006 2007 2008
-20%
-15%
-10%
-5%
0%
5%
10%
Newspaper Ad Spend Y/Y Growth
Source: NAA.org, J.P. Morgan estimates.
Figure 8: Newspaper Circulation Declines Are Accelerating
-1.8% -2.6% -2.5% -2.8% -2.1% -2.6%-3.6%
-4.6%
-7.1%
-10.6%
-0.9%
-12%
-8%
-4%
0%
Sep-04 Mar-05 Sep-05 Mar-06 Sep-06 Mar-07 Sep-07 Mar-08 Sep-08 Mar-09 Sep-09
Y/Y change in av erage daily circulation
Source: Audit Bureau of Circulation, J.P. Morgan estimates.
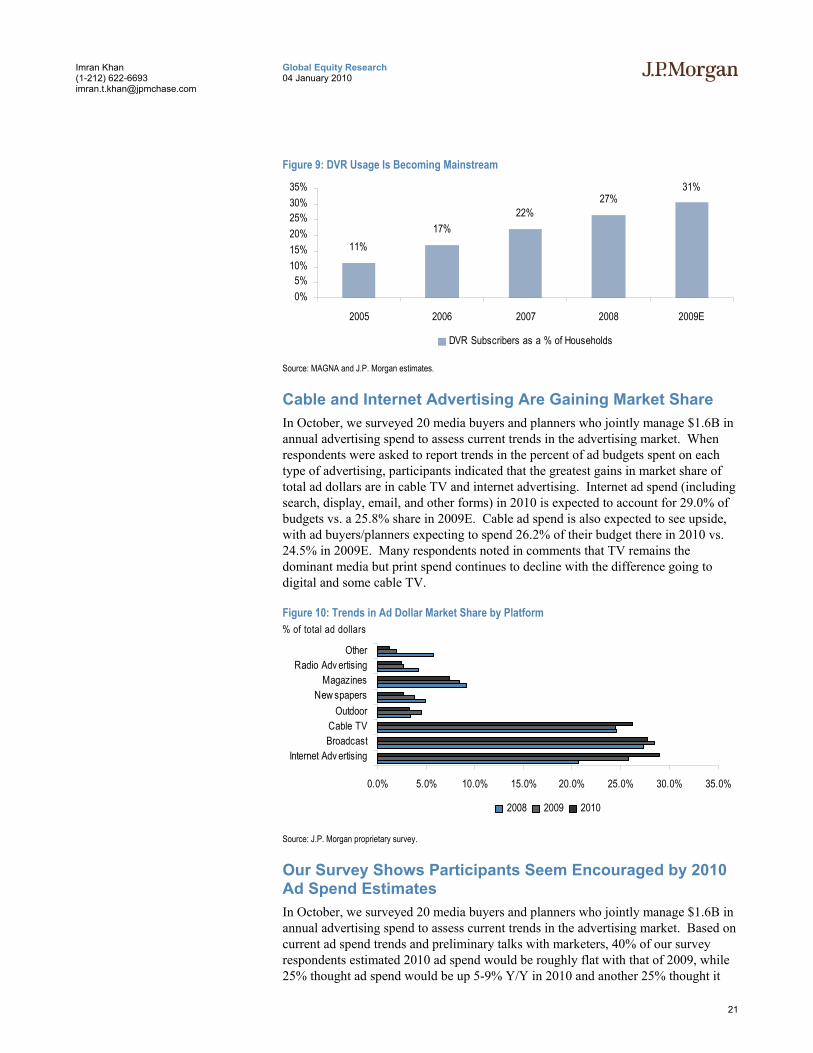
It Is Increasingly Difficult to Reach TV Viewers Overall TV viewership continues to rise, with total day up 4% Y/Y in 2008 among those aged 2+ and a 1% rise through the first three quarters of 2009. The rise in total viewership is despite declines at the broadcast networks, which are more than offset by rising cable audiences. Even among younger demographics, overall TV viewing is rising. In the 18-34 age group, TV viewership was up ~3% in 2008 and flat through 1H’09. However, it is increasingly difficult to reach these TV viewers. By the end of 2010, nearly 35% of households are expected to have a DVR.
21
Global Equity Research 04 January 2010
Imran Khan (1-212) 622-6693 [email protected]
Figure 9: DVR Usage Is Becoming Mainstream
11%17%
22%27%
31%
0%5%
10%15%20%25%30%35%
2005 2006 2007 2008 2009E
DVR Subscribers as a % of Households
Source: MAGNA and J.P. Morgan estimates.
Cable and Internet Advertising Are Gaining Market Share In October, we surveyed 20 media buyers and planners who jointly manage $1.6B in annual advertising spend to assess current trends in the advertising market. When respondents were asked to report trends in the percent of ad budgets spent on each type of advertising, participants indicated that the greatest gains in market share of total ad dollars are in cable TV and internet advertising. Internet ad spend (including search, display, email, and other forms) in 2010 is expected to account for 29.0% of budgets vs. a 25.8% share in 2009E. Cable ad spend is also expected to see upside, with ad buyers/planners expecting to spend 26.2% of their budget there in 2010 vs. 24.5% in 2009E. Many respondents noted in comments that TV remains the dominant media but print spend continues to decline with the difference going to digital and some cable TV.
Figure 10: Trends in Ad Dollar Market Share by Platform % of total ad dollars
0.0% 5.0% 10.0% 15.0% 20.0% 25.0% 30.0% 35.0%
Internet Adv ertisingBroadcastCable TV
OutdoorNew spapers
MagazinesRadio Adv ertising
Other
2008 2009 2010
Source: J.P. Morgan proprietary survey.
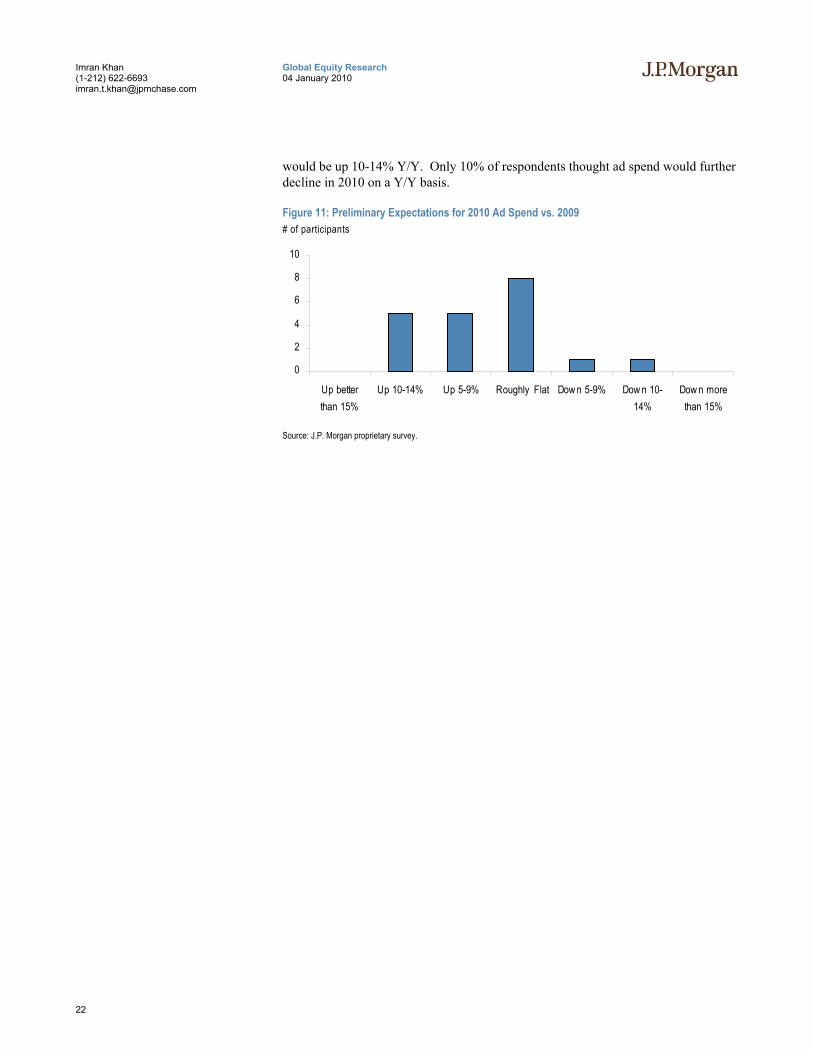
Our Survey Shows Participants Seem Encouraged by 2010 Ad Spend Estimates In October, we surveyed 20 media buyers and planners who jointly manage $1.6B in annual advertising spend to assess current trends in the advertising market. Based on current ad spend trends and preliminary talks with marketers, 40% of our survey respondents estimated 2010 ad spend would be roughly flat with that of 2009, while 25% thought ad spend would be up 5-9% Y/Y in 2010 and another 25% thought it
22
Global Equity Research 04 January 2010
Imran Khan (1-212) 622-6693 [email protected]
would be up 10-14% Y/Y. Only 10% of respondents thought ad spend would further decline in 2010 on a Y/Y basis.
Figure 11: Preliminary Expectations for 2010 Ad Spend vs. 2009 # of participants
0
2
4
6
8
10
Up betterthan 15%
Up 10-14% Up 5-9% Roughly Flat Dow n 5-9% Dow n 10-14%
Dow n morethan 15%
Source: J.P. Morgan proprietary survey.
23
Global Equity Research 04 January 2010
Imran Khan (1-212) 622-6693 [email protected]
Online Advertising Primers Graphical Advertising 101 Graphical advertising, also known as display advertising, includes all forms of advertising excluding search. Thus a range of advertisements from traditional banner ads to video and lead generation are included in this category. Because of the range included in this category, it is more difficult to make generalizations about graphical ad characteristics. However, the following factors should be evaluated when looking at the graphical advertisement space.
We Expect More Innovation in the Display Advertising Market We think display advertising companies will aggressively tackle challenges including 1) unlimited inventory, 2) lack of marketer confidence with ROI, and 3) declining RPMs. Some key developments that we expect to see are:
• Sponsorship Advertising. We think content providers are misusing page views by creating excessive content and ads. As a result, we think sponsored ads, which allow the advertiser to control the entire user experience, will become more widespread, particularly with brand advertisers.
• Time-based Advertising. We think advertisers will begin to use time spent on a page as a measure of user engagement. This could then give guidance to what ads are shown and how much of an impact they had on a user.
• New Ad Formats. We think many users are beginning to tune out the standard banner ads on a page. As a result, we think new ad formats beyond those of the IAB need to be introduced to grab user attention.
• More Optimization. We think display ads need to be better targeted through use of behavioral targeting and interest-based ads.
Content Quality Probably one of the most important factors in ad placement is the content near where the ad will be placed. In general, graphical ads are less targeted than search ads since search ads are dictated by the interest of the user whereas graphical ads are generally determined by the content of the host website. Typically, webpages are grouped into two categories: premium inventory and non-premium inventory. Premium inventory is more focused on a specific vertical of content or demographic. An example of premium inventory would be the Yahoo! Finance page. Non-premium inventory includes very general untargeted pages. Examples of non-premium inventory include social networking sites and email.
Revenue Model Revenue for graphical advertising can be cost-per-thousand (CPM), cost-per-click (CPC), or cost-per-action (CPA). CPM-based advertising is the traditional TV model employed in graphical advertising. In this model, advertisers negotiate a rate that will be paid for every thousand times the ad is displayed. Because the likelihood of a target market user seeing the ad is much higher on premium inventory than on non-premium inventory (where advertisers likely pay for many non-target users to see the ad), the range of CPMs is wide. Premium inventory can carry CPMs north of $30, while non-premium CPMs can be below $1.00.
24
Global Equity Research 04 January 2010
Imran Khan (1-212) 622-6693 [email protected]
CPC and CPA models fall into the category of performance-based advertising, since an action by the user is required before the advertiser is charged for the advertisement. In CPC advertisements, the advertiser is charged per click on the ad. In CPA models, the advertiser is charged when a pre-defined action is taken by the user (such as providing contact information on a form).
Ad Characteristics A final consideration in graphical advertising is the specifics of the advertisement. Banner ads can be found in a variety of size and shapes, can be in video form, and can be incorporated into pop-ups. Positioning on the web page is also a key concern. These factors are all important in the consideration of setting a price for the advertisement.
Why Use Graphical Advertising? Since no action is required on the part of the user, this form of advertising is very attractive to brand advertisers, which are hoping to cultivate name recognition and brand identification rather than just driving immediate sales. However, there has been some evidence that graphical advertisements can directly increase sales, when mixed with a search advertising campaign. In a study conducted by Atlas Solutions, participants were split into three groups: those who clicked only on search advertisements, those who clicked only on display advertisements, and those who clicked on a search advertisement and also viewed or clicked a display advertisement. Using the display click only group’s conversion rate as a baseline, Atlas found that search click only users convert at a rate over 3 times higher. Users exposed to both search and display convert at an even higher rate – 22 percent better than search alone and 400 percent better than display only.
Placing and Measuring a Graphical Advertisement The graphical ad placement process is a little more intensive than the search ad placement process. First, the banner ad or video needs to be created according to the specifications of the host website. As different websites might have different requirements, the format may have to be altered to meet various content website demands. A price and budget is then negotiated with the content website. Larger websites typically have their own sales force, with which advertisers deal directly. However, smaller websites often outsource the process of finding advertisers and hosting ads to ad networks that standardize the process across multiple host websites. The ad is then provided to each website or to the ad network for placement and performance tracking.
New technologies have made the measurement of display advertisements more difficult. For example, AJAX technology now allows users to preview the contents of a page without actually clicking over to the page itself. These technologies have begun to render page views as a less important metric of performance (time spent at a site is becoming more important) and performance measurement and content monetization are currently hotly debated topics.
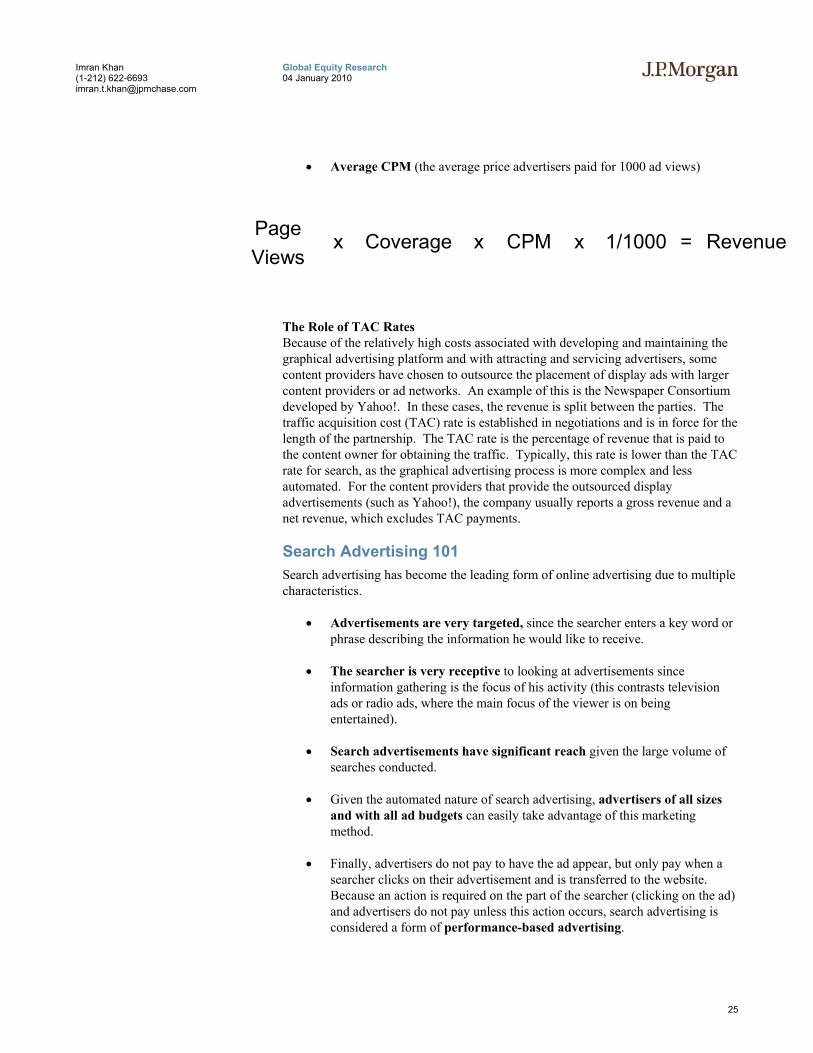
How Graphical Ad Revenue Is Determined The total revenue of a publishing site is determined by 3 factors:
• Page Views (the total number of pages viewed in a given period)
• Coverage (the proportion of pages that had an ad)
25
Global Equity Research 04 January 2010
Imran Khan (1-212) 622-6693 [email protected]
• Average CPM (the average price advertisers paid for 1000 ad views)
The Role of TAC Rates Because of the relatively high costs associated with developing and maintaining the graphical advertising platform and with attracting and servicing advertisers, some content providers have chosen to outsource the placement of display ads with larger content providers or ad networks. An example of this is the Newspaper Consortium developed by Yahoo!. In these cases, the revenue is split between the parties. The traffic acquisition cost (TAC) rate is established in negotiations and is in force for the length of the partnership. The TAC rate is the percentage of revenue that is paid to the content owner for obtaining the traffic. Typically, this rate is lower than the TAC rate for search, as the graphical advertising process is more complex and less automated. For the content providers that provide the outsourced display advertisements (such as Yahoo!), the company usually reports a gross revenue and a net revenue, which excludes TAC payments.
Search Advertising 101 Search advertising has become the leading form of online advertising due to multiple characteristics.
• Advertisements are very targeted, since the searcher enters a key word or phrase describing the information he would like to receive.
• The searcher is very receptive to looking at advertisements since information gathering is the focus of his activity (this contrasts television ads or radio ads, where the main focus of the viewer is on being entertained).
• Search advertisements have significant reach given the large volume of searches conducted.
• Given the automated nature of search advertising, advertisers of all sizes and with all ad budgets can easily take advantage of this marketing method.
• Finally, advertisers do not pay to have the ad appear, but only pay when a searcher clicks on their advertisement and is transferred to the website. Because an action is required on the part of the searcher (clicking on the ad) and advertisers do not pay unless this action occurs, search advertising is considered a form of performance-based advertising.
PageViews
x Coverage x CPM x 1/1000 = Revenue
26
Global Equity Research 04 January 2010
Imran Khan (1-212) 622-6693 [email protected]
Efforts Are Being Made to Innovate in Search After years of the same format for search results, we have seen most of the key players start to innovate in the space. Some key developments that we expect to see are:
• Multimedia Search Results. We think search companies will embrace the diversity of data media and incorporate more video, image, and audio results into searches.
• Increased Personalization. We think a greater focus will be made to target results based on geographic location and other factors.
• Dynamic Results. With data constantly being added to the web through blogs, twitter, and social networks, we think real-time results will become more the standard.
The Auction Process Advertisers or search engine marketers (SEMs are advertising agencies that manage the search ad campaigns of larger companies) first create a text ad, which is a very short (~70 characters in length), text-only, advertisement or description of the website. Advertisers then select the key search words or phrases that they would like their ads to appear alongside. Advertisers also select their monthly budget and their maximum cost-per-click (CPC), which is the amount an advertiser is willing to spend to have one searcher click on the ad and be transferred to the advertising website.
When a searcher uses the keyword in a search, a search algorithm compares all of the maximum bids for the keyword and the quality of the advertising site. Both factors are usually used in the formula for selecting an advertisement and determining the order in which advertisements appear, since search engines are concerned with providing the most relevant ads to users to maximize the user experience. Thus, there are occasions when ads with lower maximum CPC bids appear above ads with higher bids. The ads then appear in the order determined by the algorithm. If the searcher clicks on an ad, that advertiser is charged a CPC based on other bids in the auction and the quality determination of the advertiser.
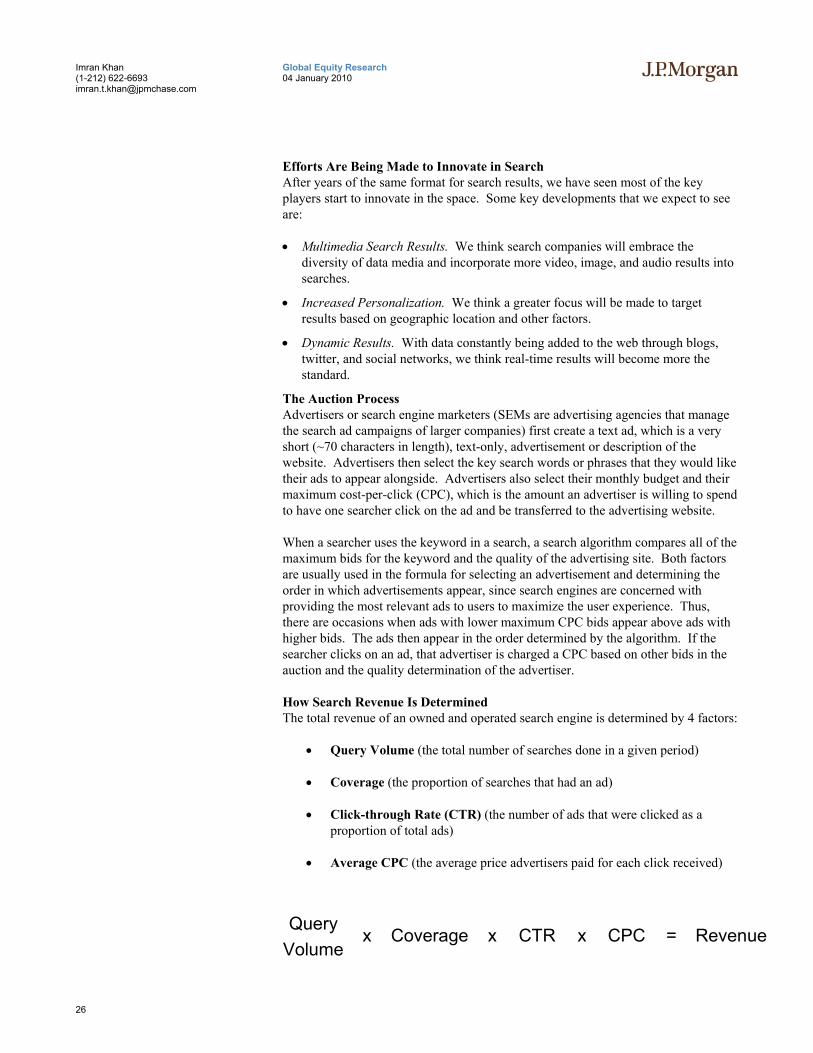
How Search Revenue Is Determined The total revenue of an owned and operated search engine is determined by 4 factors:
• Query Volume (the total number of searches done in a given period)
• Coverage (the proportion of searches that had an ad)
• Click-through Rate (CTR) (the number of ads that were clicked as a proportion of total ads)
• Average CPC (the average price advertisers paid for each click received)
QueryVolume
x Coverage x CTR x CPC = Revenue

27
Global Equity Research 04 January 2010
Imran Khan (1-212) 622-6693 [email protected]
The Role of TAC Rates Because of the relatively high costs associated with developing and maintaining the search advertising platform and with attracting and servicing advertisers, some search and content providers have chosen to outsource the placement of text ads with larger search engines. Examples of this include both AOL and Ask, which outsource search advertisements to Google. In these cases, the revenue is split between the parties. The traffic acquisition cost (TAC) rate is established in negotiations and is in force for the length of the partnership. The TAC rate is the percentage of revenue that is paid to the content owner for obtaining the traffic. Typically, this rate is north of 75%. For the search engine that provides the outsourced search advertisements (such as Google), the company usually reports a gross revenue and a net revenue, which excludes TAC payments.
28
Global Equity Research 04 January 2010
Imran Khan (1-212) 622-6693 [email protected]
Search Advertising We think the search advertising market is poised to have a solid year in 2010. In addition to having more favorable ad budgets as a whole, we think this industry will benefit from an increased share of advertising dollars and a recovery in CPCs. Within the US, we expect the market to start to enter the maturation phase. By this, we think internet population and query growth will slow and market share shifts will stabilize. However, we think international markets will continue to benefit from increased search usage and broadband subscriber growth. Following are our more detailed thoughts on the space.
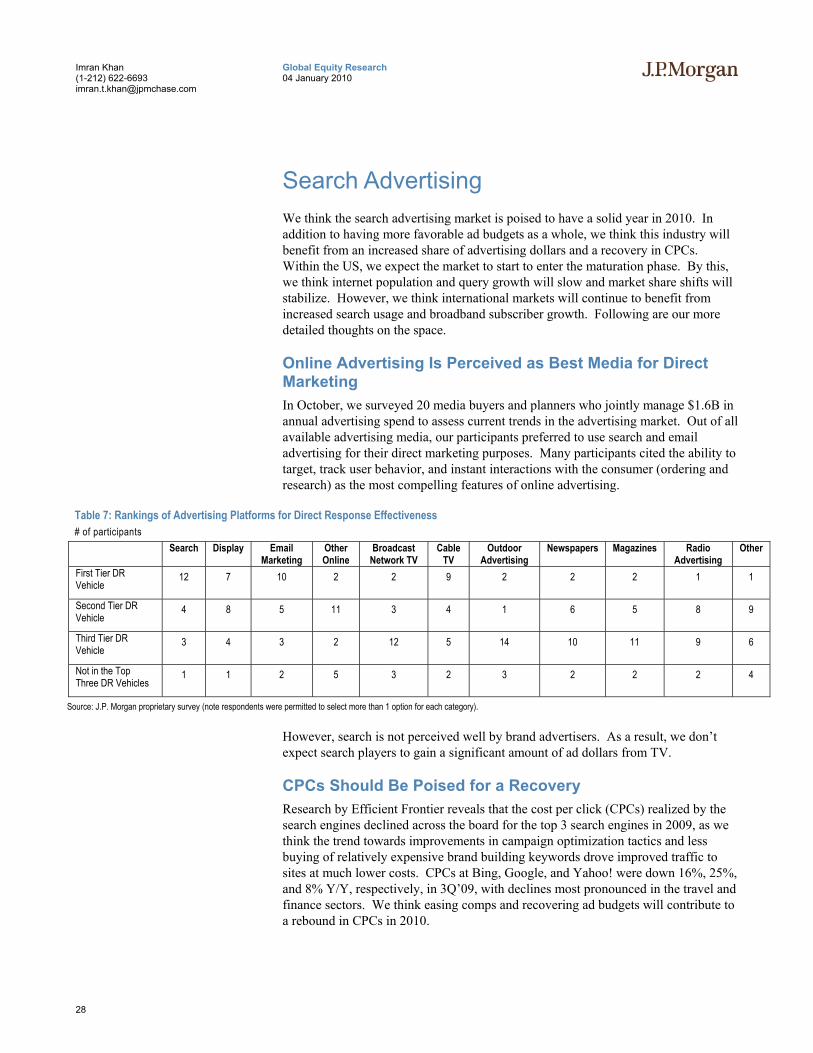
Online Advertising Is Perceived as Best Media for Direct Marketing In October, we surveyed 20 media buyers and planners who jointly manage $1.6B in annual advertising spend to assess current trends in the advertising market. Out of all available advertising media, our participants preferred to use search and email advertising for their direct marketing purposes. Many participants cited the ability to target, track user behavior, and instant interactions with the consumer (ordering and research) as the most compelling features of online advertising.
Table 7: Rankings of Advertising Platforms for Direct Response Effectiveness # of participants
Search Display Email Marketing
Other Online
Broadcast Network TV
Cable TV
Outdoor Advertising
Newspapers Magazines Radio Advertising
Other
First Tier DR Vehicle
12 7 10 2 2 9 2 2 2 1 1
Second Tier DR Vehicle
4 8 5 11 3 4 1 6 5 8 9
Third Tier DR Vehicle
3 4 3 2 12 5 14 10 11 9 6
Not in the Top Three DR Vehicles
1 1 2 5 3 2 3 2 2 2 4
Source: J.P. Morgan proprietary survey (note respondents were permitted to select more than 1 option for each category).
However, search is not perceived well by brand advertisers. As a result, we don’t expect search players to gain a significant amount of ad dollars from TV.
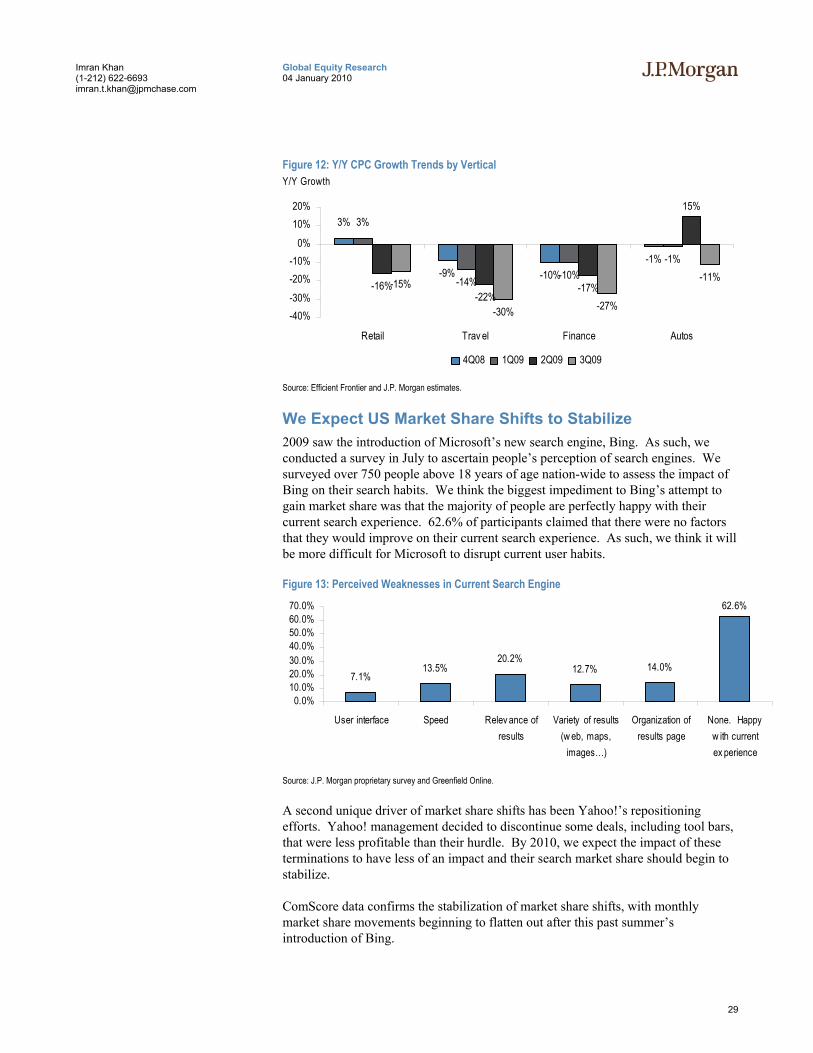
CPCs Should Be Poised for a Recovery Research by Efficient Frontier reveals that the cost per click (CPCs) realized by the search engines declined across the board for the top 3 search engines in 2009, as we think the trend towards improvements in campaign optimization tactics and less buying of relatively expensive brand building keywords drove improved traffic to sites at much lower costs. CPCs at Bing, Google, and Yahoo! were down 16%, 25%, and 8% Y/Y, respectively, in 3Q’09, with declines most pronounced in the travel and finance sectors. We think easing comps and recovering ad budgets will contribute to a rebound in CPCs in 2010.
29
Global Equity Research 04 January 2010
Imran Khan (1-212) 622-6693 [email protected]
Figure 12: Y/Y CPC Growth Trends by Vertical Y/Y Growth
3%
-9% -10%-1%
3%
-14% -10%-1%
-16%-22%
-17%
15%
-15%
-30% -27%
-11%
-40%-30%-20%-10%
0%10%20%
Retail Trav el Finance Autos
4Q08 1Q09 2Q09 3Q09
Source: Efficient Frontier and J.P. Morgan estimates.
We Expect US Market Share Shifts to Stabilize 2009 saw the introduction of Microsoft’s new search engine, Bing. As such, we conducted a survey in July to ascertain people’s perception of search engines. We surveyed over 750 people above 18 years of age nation-wide to assess the impact of Bing on their search habits. We think the biggest impediment to Bing’s attempt to gain market share was that the majority of people are perfectly happy with their current search experience. 62.6% of participants claimed that there were no factors that they would improve on their current search experience. As such, we think it will be more difficult for Microsoft to disrupt current user habits.
Figure 13: Perceived Weaknesses in Current Search Engine
7.1%13.5%
20.2%12.7% 14.0%
62.6%
0.0%10.0%20.0%30.0%40.0%50.0%60.0%70.0%
User interface Speed Relev ance ofresults
Variety of results(w eb, maps,
images…)
Organization ofresults page
None. Happyw ith currentex perience
Source: J.P. Morgan proprietary survey and Greenfield Online.
A second unique driver of market share shifts has been Yahoo!’s repositioning efforts. Yahoo! management decided to discontinue some deals, including tool bars, that were less profitable than their hurdle. By 2010, we expect the impact of these terminations to have less of an impact and their search market share should begin to stabilize.
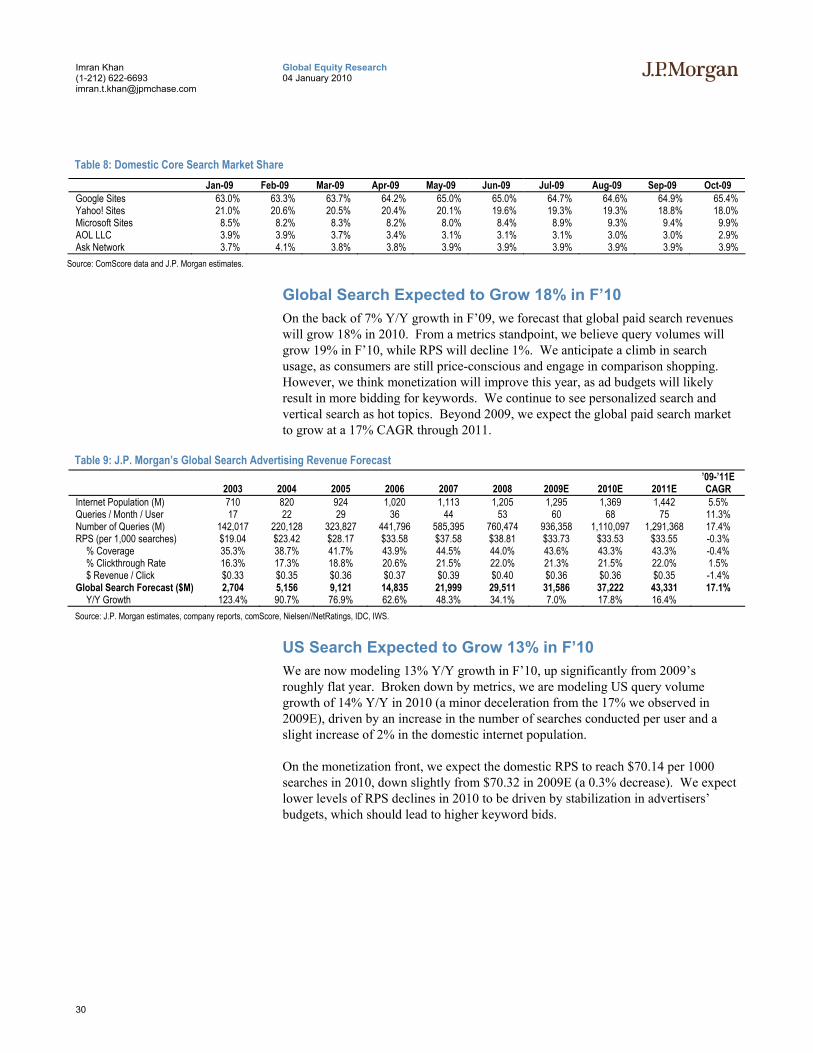
ComScore data confirms the stabilization of market share shifts, with monthly market share movements beginning to flatten out after this past summer’s introduction of Bing.
30
Global Equity Research 04 January 2010
Imran Khan (1-212) 622-6693 [email protected]
Table 8: Domestic Core Search Market Share Jan-09 Feb-09 Mar-09 Apr-09 May-09 Jun-09 Jul-09 Aug-09 Sep-09 Oct-09
Google Sites 63.0% 63.3% 63.7% 64.2% 65.0% 65.0% 64.7% 64.6% 64.9% 65.4% Yahoo! Sites 21.0% 20.6% 20.5% 20.4% 20.1% 19.6% 19.3% 19.3% 18.8% 18.0% Microsoft Sites 8.5% 8.2% 8.3% 8.2% 8.0% 8.4% 8.9% 9.3% 9.4% 9.9% AOL LLC 3.9% 3.9% 3.7% 3.4% 3.1% 3.1% 3.1% 3.0% 3.0% 2.9% Ask Network 3.7% 4.1% 3.8% 3.8% 3.9% 3.9% 3.9% 3.9% 3.9% 3.9%
Source: ComScore data and J.P. Morgan estimates.
Global Search Expected to Grow 18% in F’10 On the back of 7% Y/Y growth in F’09, we forecast that global paid search revenues will grow 18% in 2010. From a metrics standpoint, we believe query volumes will grow 19% in F’10, while RPS will decline 1%. We anticipate a climb in search usage, as consumers are still price-conscious and engage in comparison shopping. However, we think monetization will improve this year, as ad budgets will likely result in more bidding for keywords. We continue to see personalized search and vertical search as hot topics. Beyond 2009, we expect the global paid search market to grow at a 17% CAGR through 2011.
Table 9: J.P. Morgan’s Global Search Advertising Revenue Forecast
Global 2003 2004 2005 2006 2007 2008 2009E 2010E 2011E ’09-’11E CAGR
Internet Population (M) 710 820 924 1,020 1,113 1,205 1,295 1,369 1,442 5.5% Queries / Month / User 17 22 29 36 44 53 60 68 75 11.3% Number of Queries (M) 142,017 220,128 323,827 441,796 585,395 760,474 936,358 1,110,097 1,291,368 17.4% RPS (per 1,000 searches) $19.04 $23.42 $28.17 $33.58 $37.58 $38.81 $33.73 $33.53 $33.55 -0.3%
% Coverage 35.3% 38.7% 41.7% 43.9% 44.5% 44.0% 43.6% 43.3% 43.3% -0.4% % Clickthrough Rate 16.3% 17.3% 18.8% 20.6% 21.5% 22.0% 21.3% 21.5% 22.0% 1.5% $ Revenue / Click $0.33 $0.35 $0.36 $0.37 $0.39 $0.40 $0.36 $0.36 $0.35 -1.4%
Global Search Forecast ($M) 2,704 5,156 9,121 14,835 21,999 29,511 31,586 37,222 43,331 17.1% Y/Y Growth 123.4% 90.7% 76.9% 62.6% 48.3% 34.1% 7.0% 17.8% 16.4%
Source: J.P. Morgan estimates, company reports, comScore, Nielsen//NetRatings, IDC, IWS.
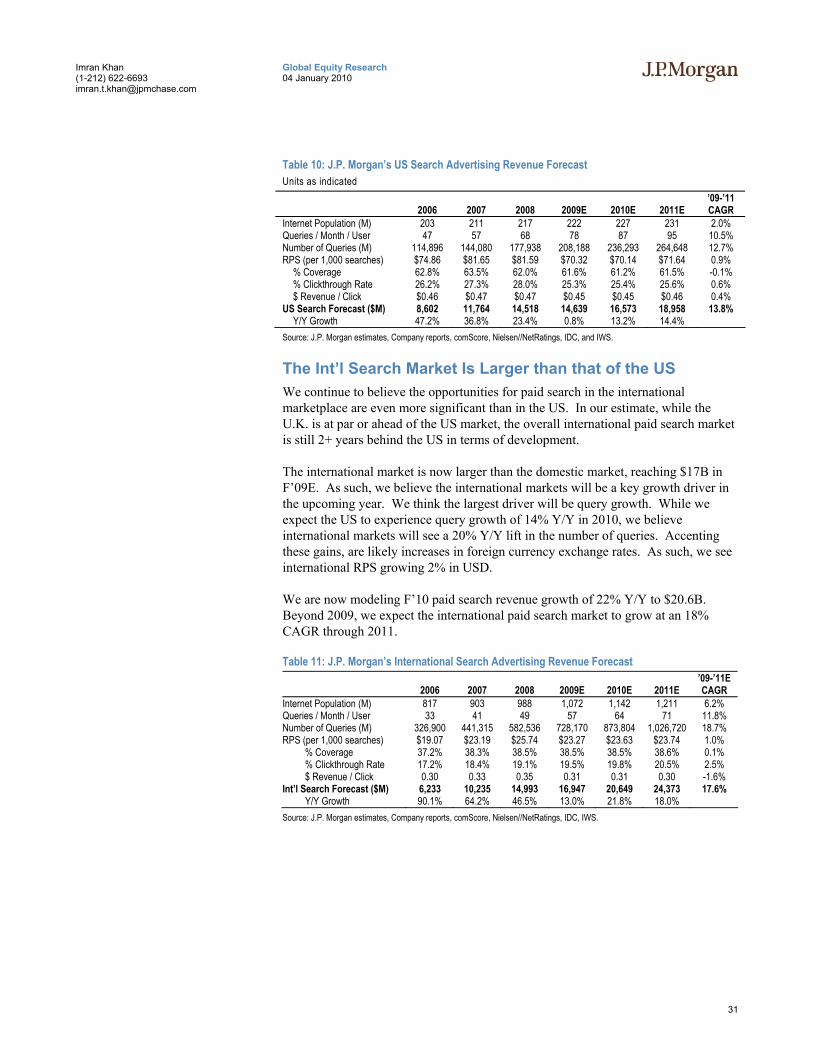
US Search Expected to Grow 13% in F’10 We are now modeling 13% Y/Y growth in F’10, up significantly from 2009’s roughly flat year. Broken down by metrics, we are modeling US query volume growth of 14% Y/Y in 2010 (a minor deceleration from the 17% we observed in 2009E), driven by an increase in the number of searches conducted per user and a slight increase of 2% in the domestic internet population.
On the monetization front, we expect the domestic RPS to reach $70.14 per 1000 searches in 2010, down slightly from $70.32 in 2009E (a 0.3% decrease). We expect lower levels of RPS declines in 2010 to be driven by stabilization in advertisers’ budgets, which should lead to higher keyword bids.
31
Global Equity Research 04 January 2010
Imran Khan (1-212) 622-6693 [email protected]
Table 10: J.P. Morgan’s US Search Advertising Revenue Forecast Units as indicated
United States 2006 2007 2008 2009E 2010E 2011E ’09-’11 CAGR
Internet Population (M) 203 211 217 222 227 231 2.0% Queries / Month / User 47 57 68 78 87 95 10.5% Number of Queries (M) 114,896 144,080 177,938 208,188 236,293 264,648 12.7% RPS (per 1,000 searches) $74.86 $81.65 $81.59 $70.32 $70.14 $71.64 0.9%
% Coverage 62.8% 63.5% 62.0% 61.6% 61.2% 61.5% -0.1% % Clickthrough Rate 26.2% 27.3% 28.0% 25.3% 25.4% 25.6% 0.6% $ Revenue / Click $0.46 $0.47 $0.47 $0.45 $0.45 $0.46 0.4%
US Search Forecast ($M) 8,602 11,764 14,518 14,639 16,573 18,958 13.8% Y/Y Growth 47.2% 36.8% 23.4% 0.8% 13.2% 14.4%
Source: J.P. Morgan estimates, Company reports, comScore, Nielsen//NetRatings, IDC, and IWS.
The Int’l Search Market Is Larger than that of the US We continue to believe the opportunities for paid search in the international marketplace are even more significant than in the US. In our estimate, while the U.K. is at par or ahead of the US market, the overall international paid search market is still 2+ years behind the US in terms of development.
The international market is now larger than the domestic market, reaching $17B in F’09E. As such, we believe the international markets will be a key growth driver in the upcoming year. We think the largest driver will be query growth. While we expect the US to experience query growth of 14% Y/Y in 2010, we believe international markets will see a 20% Y/Y lift in the number of queries. Accenting these gains, are likely increases in foreign currency exchange rates. As such, we see international RPS growing 2% in USD.
We are now modeling F’10 paid search revenue growth of 22% Y/Y to $20.6B. Beyond 2009, we expect the international paid search market to grow at an 18% CAGR through 2011.
Table 11: J.P. Morgan’s International Search Advertising Revenue Forecast
International 2006 2007 2008 2009E 2010E 2011E ’09-’11E CAGR
Internet Population (M) 817 903 988 1,072 1,142 1,211 6.2% Queries / Month / User 33 41 49 57 64 71 11.8% Number of Queries (M) 326,900 441,315 582,536 728,170 873,804 1,026,720 18.7% RPS (per 1,000 searches) $19.07 $23.19 $25.74 $23.27 $23.63 $23.74 1.0%
% Coverage 37.2% 38.3% 38.5% 38.5% 38.5% 38.6% 0.1% % Clickthrough Rate 17.2% 18.4% 19.1% 19.5% 19.8% 20.5% 2.5% $ Revenue / Click 0.30 0.33 0.35 0.31 0.31 0.30 -1.6%
Int’l Search Forecast ($M) 6,233 10,235 14,993 16,947 20,649 24,373 17.6% Y/Y Growth 90.1% 64.2% 46.5% 13.0% 21.8% 18.0%
Source: J.P. Morgan estimates, Company reports, comScore, Nielsen//NetRatings, IDC, IWS.
32
Global Equity Research 04 January 2010
Imran Khan (1-212) 622-6693 [email protected]
Display Advertising Although online advertising as a percent of total ad spend is seeing gains, the display advertising sector has been less well embraced than search advertising. We think display advertising has a couple unique challenges facing it, including a large influx of inventory, poorer targeting capabilities, and an unclear value proposition to brand advertisers. We think the winners in this space going into 2010 will be the largest content and consumer aggregators such as Yahoo!, Microsoft, and AOL, which have the scale necessary for behavioral targeting, content packaging, and a sales force that can devote itself to clearly explaining the branding benefits of the media. Furthermore, we expect that more and more large brand advertisers will want to work directly with content providers to create unique, personalized, and interactive campaigns.
Internet Users Have Faced a Large Influx of Inventory While portals were once dominant, Yahoo!, AOL, and Microsoft accounted for less than one-quarter of minutes spent online in August 2009, down from 42% in August 2002. Meanwhile online gaming and social networking websites have experienced double-digit Y/Y growth rates in minutes spent online. This fragmented audience not only makes it more difficult for advertisers to reach their target audience through only a few publishers, but it also makes it difficult for publishers to attract advertisers given their limited scale. While increasing user reach is half the battle, we recognize that many page views are not very meaningful to advertisers unless user information can be gathered and ads are targeted. In order to most effectively target the ads, publishers need to have access to user behavior on multiple sites to collect data and to repeatedly show ads to the user.
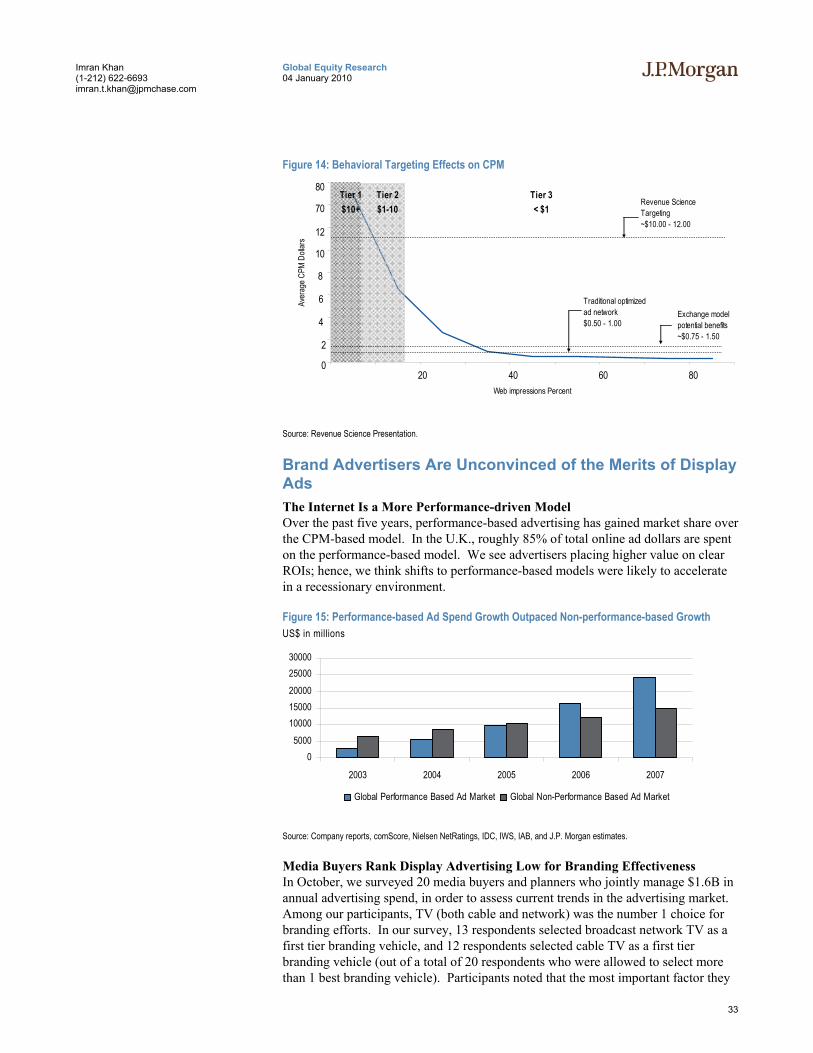
Monetizing Non-Premium Inventory The concept of behavioral targeting is not a new one, and it has been held out as a solution to declining CPMs for some years now. Marketers appear to value targeted advertising, as evidenced by Google’s well targeted search ads generating RPQs of more than double Yahoo!’s. We expect that this same principal will apply to graphical advertising and note that Revenue Science estimates a 15x CPM premium for behaviorally targeted ads. However, the industry has encountered some problems using behavioral targeting in getting the scale necessary for this to be effective for advertisers and in fighting off privacy issues. Google is the latest to offer behavioral targeting capabilities in its interest-based advertising product launched in March 2009. But, according to estimates by TechCrunch and Jim Brock, founder of PrivacyChoice, chairman of Attributor, and a former senior VP at Yahoo, only about 25% of AdSense sites are serving targeted ads.
33
Global Equity Research 04 January 2010
Imran Khan (1-212) 622-6693 [email protected]
Figure 14: Behavioral Targeting Effects on CPM
0
200
400
600
800
1000
1200
1400
1600
1 2 3 4 5 6 7 8 9
Web impressions Percent
Aver
age C
PM D
ollar
s
80
70
12
10
8
6
4
2
020 40 60 80
Tier 3< $1
Tier 2$1-10
Tier 1$10+
Revenue Science Targeting~$10.00 - 12.00
Exchange modelpotential benefits~$0.75 - 1.50
Traditional optimizedad network$0.50 - 1.00
Source: Revenue Science Presentation.
Brand Advertisers Are Unconvinced of the Merits of Display Ads The Internet Is a More Performance-driven Model Over the past five years, performance-based advertising has gained market share over the CPM-based model. In the U.K., roughly 85% of total online ad dollars are spent on the performance-based model. We see advertisers placing higher value on clear ROIs; hence, we think shifts to performance-based models were likely to accelerate in a recessionary environment.
Figure 15: Performance-based Ad Spend Growth Outpaced Non-performance-based Growth US$ in millions
05000
1000015000200002500030000
2003 2004 2005 2006 2007
Global Performance Based Ad Market Global Non-Performance Based Ad Market
Source: Company reports, comScore, Nielsen NetRatings, IDC, IWS, IAB, and J.P. Morgan estimates.
Media Buyers Rank Display Advertising Low for Branding Effectiveness In October, we surveyed 20 media buyers and planners who jointly manage $1.6B in annual advertising spend, in order to assess current trends in the advertising market. Among our participants, TV (both cable and network) was the number 1 choice for branding efforts. In our survey, 13 respondents selected broadcast network TV as a first tier branding vehicle, and 12 respondents selected cable TV as a first tier branding vehicle (out of a total of 20 respondents who were allowed to select more than 1 best branding vehicle). Participants noted that the most important factor they

34
Global Equity Research 04 January 2010
Imran Khan (1-212) 622-6693 [email protected]
were looking for in a branding vehicle was mass reach and felt TV was the most effective way to achieve this. Some participants noted that magazines were also effective, as the magazines’ reputation and loyal readership lent validity to the brand. Display advertising ranked at the bottom of choices for top branding vehicle, only trailed by email marketing and newspapers.
Table 12: Rankings of Advertising Platforms for Branding Effectiveness # of participants
Search Display Email Marketing
Other Online
Broadcast Network TV
Cable TV
Outdoor Advertising
Newspapers Magazines Radio Advertising
Other
First Tier Branding Vehicle 3 3 2 3 13 12 6 2 6 3 2
Second Tier Branding Vehicle 3 7 4 4 3 4 8 9 6 8 9
Third Tier Branding Vehicle 10 9 10 9 3 4 3 6 7 6 4
Not in the Top Three Branding Vehicles 4 1 3 4 1 0 3 3 1 3 5
Source: J.P. Morgan proprietary survey (note respondents were permitted to select more than 1 option for each category).
As a result of this hesitancy, although just slightly under 50% of advertising budgets are devoted to brand advertising, brand advertising accounts for only ~27% of internet ad spend.
Figure 16: Brand Advertisers Are Hesitant to Adopt Display Advertising Units as indicated
Direct (Internet) $17.4B
Brand (Internet) $6.5B
Direct (Total) $159.2B
Brand (Total) $146.2B
Source: DMA’s 2008 Power of Direct Marketing, comScore, IAB, Nielsen, company reports, and J.P. Morgan estimates.
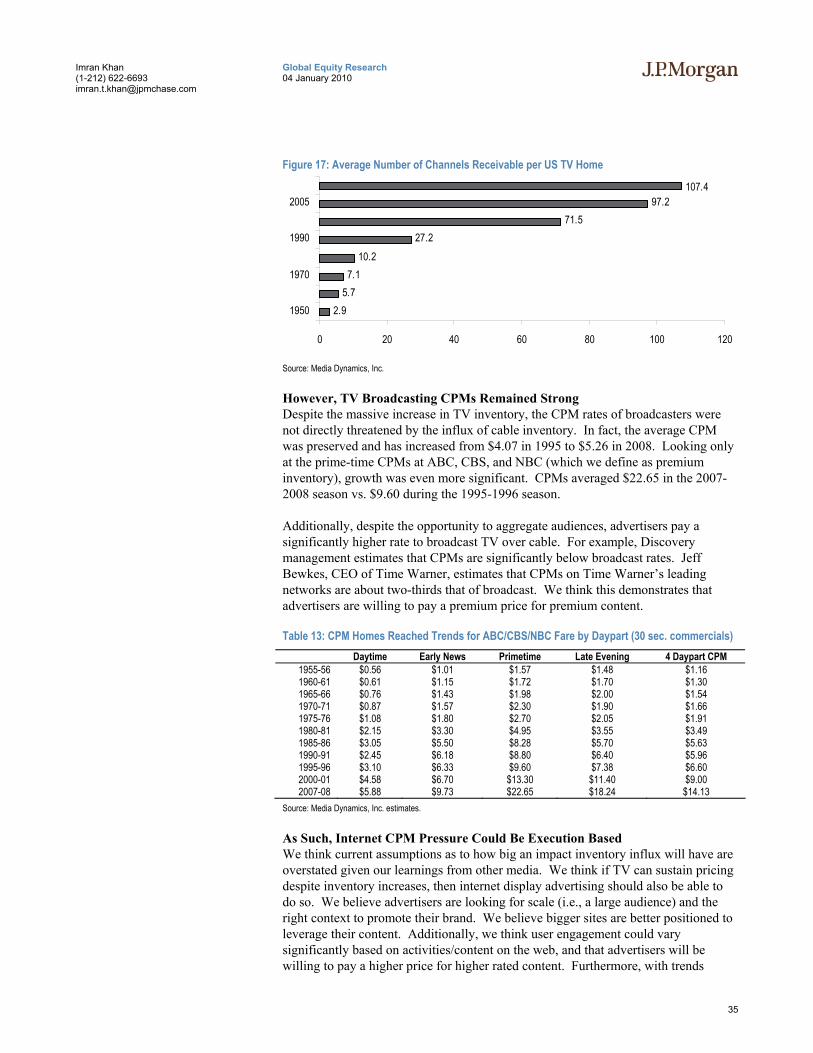
We Think Inventory Growth Concerns Are Overstated Although there seems to be much concern over the influx of display advertising inventory, this is not the first time a CPM-based ad industry has seen a period of such rapid growth. Looking at the TV industry, the average US TV home received only 2.9 channels in 1950, according to Media Dynamics. This number increased by only ~7 over the next 30 years, topping out at 10.2 in 1980. However, at this point, the industry entered a period of major flux with the advent of cable. By 2007, US TV homes were able to receive 107.4 channels.
35
Global Equity Research 04 January 2010
Imran Khan (1-212) 622-6693 [email protected]
Figure 17: Average Number of Channels Receivable per US TV Home
2.95.77.1
10.227.2
71.597.2
107.4
0 20 40 60 80 100 120
1950
1970
1990
2005
Source: Media Dynamics, Inc.
However, TV Broadcasting CPMs Remained Strong Despite the massive increase in TV inventory, the CPM rates of broadcasters were not directly threatened by the influx of cable inventory. In fact, the average CPM was preserved and has increased from $4.07 in 1995 to $5.26 in 2008. Looking only at the prime-time CPMs at ABC, CBS, and NBC (which we define as premium inventory), growth was even more significant. CPMs averaged $22.65 in the 2007-2008 season vs. $9.60 during the 1995-1996 season.
Additionally, despite the opportunity to aggregate audiences, advertisers pay a significantly higher rate to broadcast TV over cable. For example, Discovery management estimates that CPMs are significantly below broadcast rates. Jeff Bewkes, CEO of Time Warner, estimates that CPMs on Time Warner’s leading networks are about two-thirds that of broadcast. We think this demonstrates that advertisers are willing to pay a premium price for premium content.
Table 13: CPM Homes Reached Trends for ABC/CBS/NBC Fare by Daypart (30 sec. commercials) Daytime Early News Primetime Late Evening 4 Daypart CPM
1955-56 $0.56 $1.01 $1.57 $1.48 $1.16 1960-61 $0.61 $1.15 $1.72 $1.70 $1.30 1965-66 $0.76 $1.43 $1.98 $2.00 $1.54 1970-71 $0.87 $1.57 $2.30 $1.90 $1.66 1975-76 $1.08 $1.80 $2.70 $2.05 $1.91 1980-81 $2.15 $3.30 $4.95 $3.55 $3.49 1985-86 $3.05 $5.50 $8.28 $5.70 $5.63 1990-91 $2.45 $6.18 $8.80 $6.40 $5.96 1995-96 $3.10 $6.33 $9.60 $7.38 $6.60 2000-01 $4.58 $6.70 $13.30 $11.40 $9.00 2007-08 $5.88 $9.73 $22.65 $18.24 $14.13
Source: Media Dynamics, Inc. estimates.
As Such, Internet CPM Pressure Could Be Execution Based We think current assumptions as to how big an impact inventory influx will have are overstated given our learnings from other media. We think if TV can sustain pricing despite inventory increases, then internet display advertising should also be able to do so. We believe advertisers are looking for scale (i.e., a large audience) and the right context to promote their brand. We believe bigger sites are better positioned to leverage their content. Additionally, we think user engagement could vary significantly based on activities/content on the web, and that advertisers will be willing to pay a higher price for higher rated content. Furthermore, with trends
36
Global Equity Research 04 January 2010
Imran Khan (1-212) 622-6693 [email protected]
shifting towards more open platforms and easy inter-access, we think premium sites may be beneficiaries of extensive inventory levels as these smaller sites turn to them for traffic and monetization help.
Bottom Line We expect new forms of display advertising to begin to emerge. These may include:
• Sponsorships
• Time-based
• Purchase data integration
• Better formatting, like Apple
Online Video Advertising Online video, like social networking, is an internet medium that has taken off in terms of consumer usage but has left publishers and advertisers struggling with how to monetize it. We continue to think that monetization of the online video space will underperform early expectations. We believe both performance-based marketers and brand advertisers are looking at three variables in determining their investment: reach, content quality, and performance measurability. We expect weakness in the space to be driven by the lack of an established video ad format, a plethora of non-premium inventory, and the lack of a clear revenue split model between publishers and websites such as Youtube.
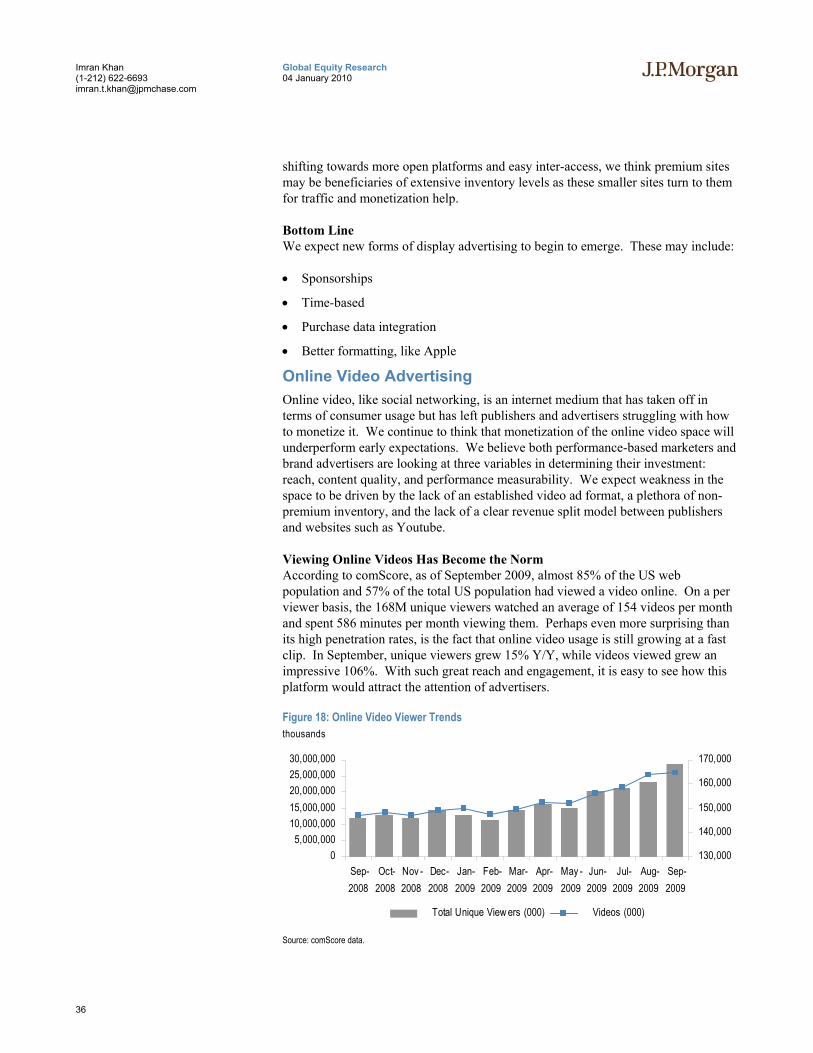
Viewing Online Videos Has Become the Norm According to comScore, as of September 2009, almost 85% of the US web population and 57% of the total US population had viewed a video online. On a per viewer basis, the 168M unique viewers watched an average of 154 videos per month and spent 586 minutes per month viewing them. Perhaps even more surprising than its high penetration rates, is the fact that online video usage is still growing at a fast clip. In September, unique viewers grew 15% Y/Y, while videos viewed grew an impressive 106%. With such great reach and engagement, it is easy to see how this platform would attract the attention of advertisers.
Figure 18: Online Video Viewer Trends thousands
05,000,000
10,000,00015,000,00020,000,00025,000,00030,000,000
Sep-2008
Oct-2008
Nov -2008
Dec-2008
Jan-2009
Feb-2009
Mar-2009
Apr-2009
May -2009
Jun-2009
Jul-2009
Aug-2009
Sep-2009
130,000
140,000
150,000
160,000
170,000
Total Unique View ers (000) Videos (000)
Source: comScore data.
37
Global Equity Research 04 January 2010
Imran Khan (1-212) 622-6693 [email protected]
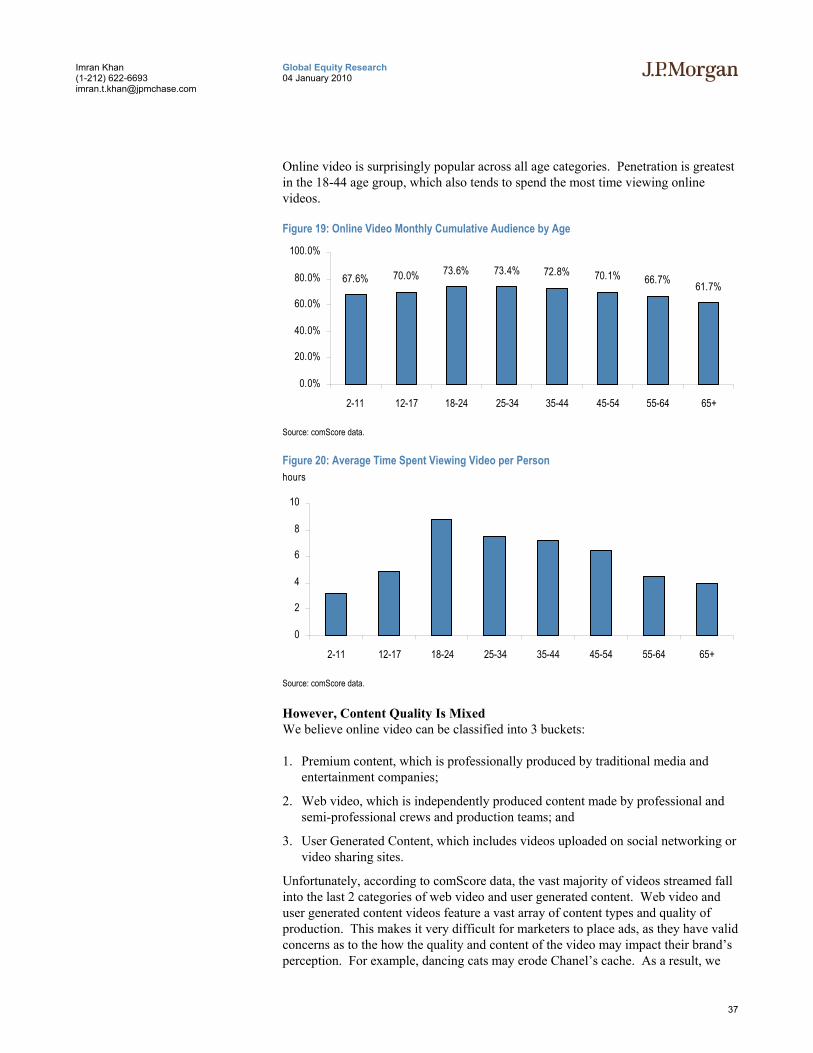
Online video is surprisingly popular across all age categories. Penetration is greatest in the 18-44 age group, which also tends to spend the most time viewing online videos.
Figure 19: Online Video Monthly Cumulative Audience by Age
67.6% 70.0% 73.6% 73.4% 72.8% 70.1% 66.7% 61.7%
0.0%
20.0%
40.0%
60.0%
80.0%
100.0%
2-11 12-17 18-24 25-34 35-44 45-54 55-64 65+
Source: comScore data.
Figure 20: Average Time Spent Viewing Video per Person hours
0
2
4
6
8
10
2-11 12-17 18-24 25-34 35-44 45-54 55-64 65+
Source: comScore data.
However, Content Quality Is Mixed We believe online video can be classified into 3 buckets:
1. Premium content, which is professionally produced by traditional media and entertainment companies;
2. Web video, which is independently produced content made by professional and semi-professional crews and production teams; and
3. User Generated Content, which includes videos uploaded on social networking or video sharing sites.
Unfortunately, according to comScore data, the vast majority of videos streamed fall into the last 2 categories of web video and user generated content. Web video and user generated content videos feature a vast array of content types and quality of production. This makes it very difficult for marketers to place ads, as they have valid concerns as to the how the quality and content of the video may impact their brand’s perception. For example, dancing cats may erode Chanel’s cache. As a result, we
38
Global Equity Research 04 January 2010
Imran Khan (1-212) 622-6693 [email protected]
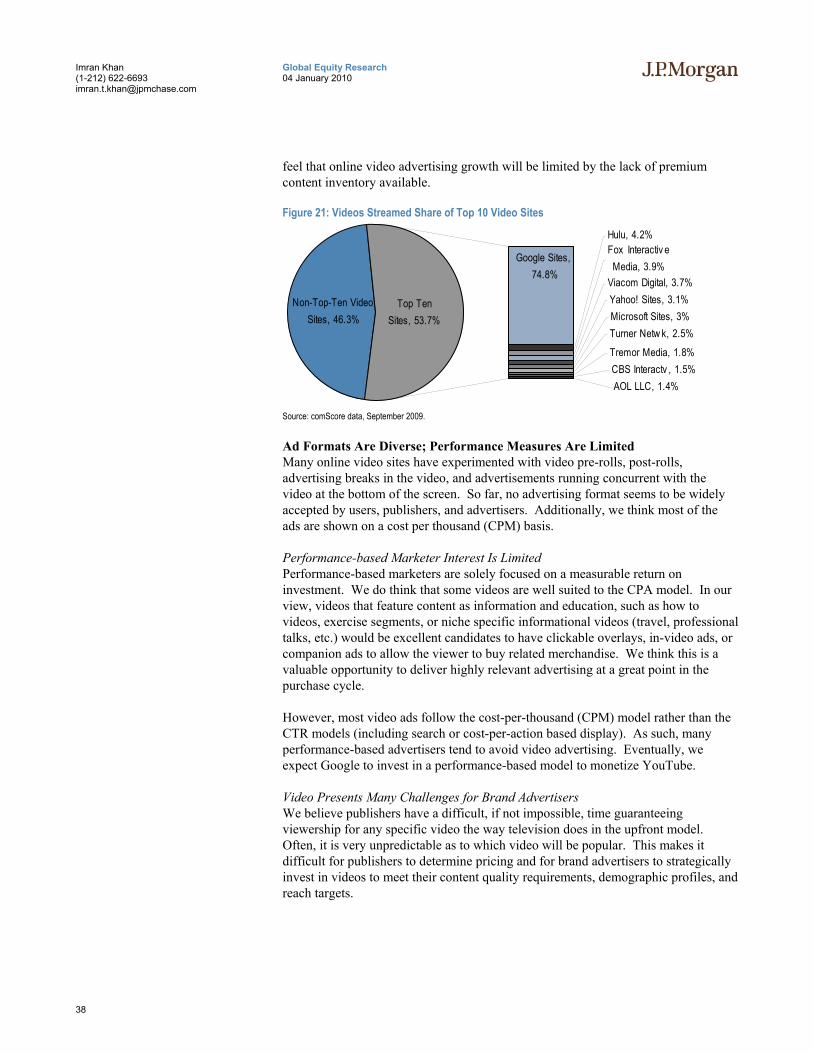
feel that online video advertising growth will be limited by the lack of premium content inventory available.
Figure 21: Videos Streamed Share of Top 10 Video Sites
Microsoft Sites, 3%
Viacom Digital, 3.7%Yahoo! Sites, 3.1%
AOL LLC, 1.4%
Turner Netw k, 2.5%
CBS Interactv , 1.5%Tremor Media, 1.8%
Hulu, 4.2%Fox Interactiv e Media, 3.9%
Google Sites, 74.8%
Non-Top-Ten Video Sites, 46.3%
Top TenSites, 53.7%
Source: comScore data, September 2009.
Ad Formats Are Diverse; Performance Measures Are Limited Many online video sites have experimented with video pre-rolls, post-rolls, advertising breaks in the video, and advertisements running concurrent with the video at the bottom of the screen. So far, no advertising format seems to be widely accepted by users, publishers, and advertisers. Additionally, we think most of the ads are shown on a cost per thousand (CPM) basis.
Performance-based Marketer Interest Is Limited Performance-based marketers are solely focused on a measurable return on investment. We do think that some videos are well suited to the CPA model. In our view, videos that feature content as information and education, such as how to videos, exercise segments, or niche specific informational videos (travel, professional talks, etc.) would be excellent candidates to have clickable overlays, in-video ads, or companion ads to allow the viewer to buy related merchandise. We think this is a valuable opportunity to deliver highly relevant advertising at a great point in the purchase cycle.
However, most video ads follow the cost-per-thousand (CPM) model rather than the CTR models (including search or cost-per-action based display). As such, many performance-based advertisers tend to avoid video advertising. Eventually, we expect Google to invest in a performance-based model to monetize YouTube.
Video Presents Many Challenges for Brand Advertisers We believe publishers have a difficult, if not impossible, time guaranteeing viewership for any specific video the way television does in the upfront model. Often, it is very unpredictable as to which video will be popular. This makes it difficult for publishers to determine pricing and for brand advertisers to strategically invest in videos to meet their content quality requirements, demographic profiles, and reach targets.
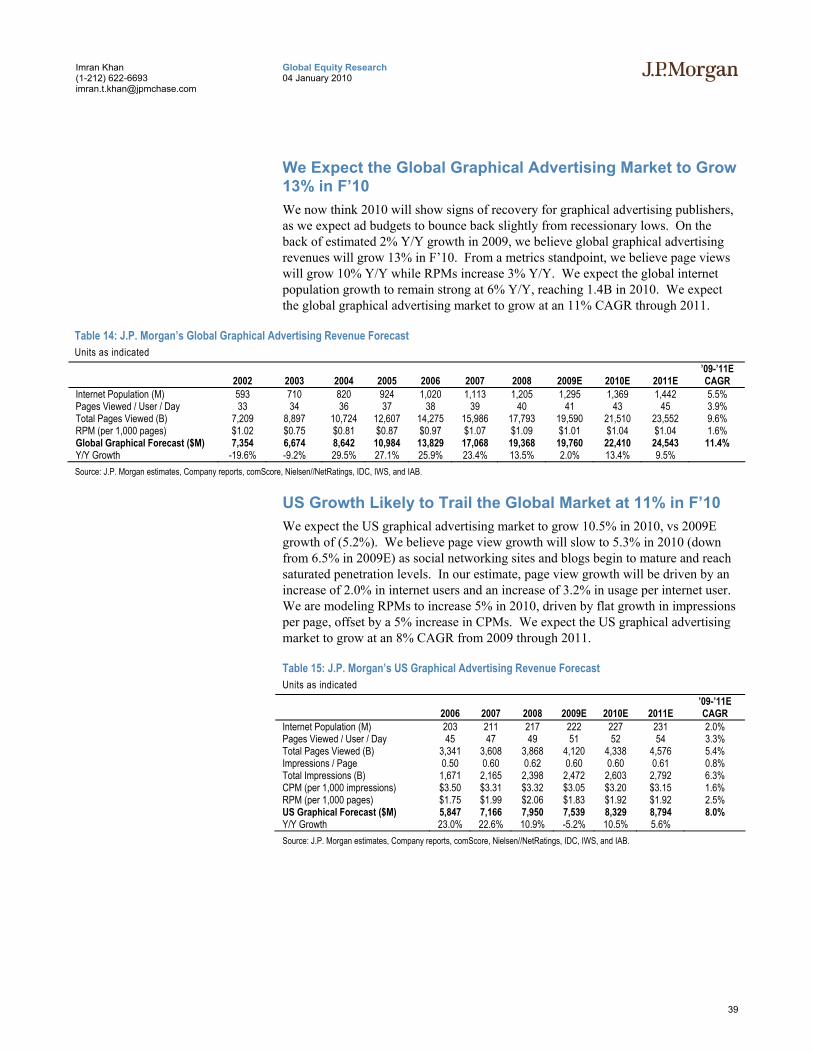
39
Global Equity Research 04 January 2010
Imran Khan (1-212) 622-6693 [email protected]
We Expect the Global Graphical Advertising Market to Grow 13% in F’10 We now think 2010 will show signs of recovery for graphical advertising publishers, as we expect ad budgets to bounce back slightly from recessionary lows. On the back of estimated 2% Y/Y growth in 2009, we believe global graphical advertising revenues will grow 13% in F’10. From a metrics standpoint, we believe page views will grow 10% Y/Y while RPMs increase 3% Y/Y. We expect the global internet population growth to remain strong at 6% Y/Y, reaching 1.4B in 2010. We expect the global graphical advertising market to grow at an 11% CAGR through 2011.
Table 14: J.P. Morgan’s Global Graphical Advertising Revenue Forecast Units as indicated
Global 2002 2003 2004 2005 2006 2007 2008 2009E 2010E 2011E ’09-’11E CAGR
Internet Population (M) 593 710 820 924 1,020 1,113 1,205 1,295 1,369 1,442 5.5% Pages Viewed / User / Day 33 34 36 37 38 39 40 41 43 45 3.9% Total Pages Viewed (B) 7,209 8,897 10,724 12,607 14,275 15,986 17,793 19,590 21,510 23,552 9.6% RPM (per 1,000 pages) $1.02 $0.75 $0.81 $0.87 $0.97 $1.07 $1.09 $1.01 $1.04 $1.04 1.6% Global Graphical Forecast ($M) 7,354 6,674 8,642 10,984 13,829 17,068 19,368 19,760 22,410 24,543 11.4% Y/Y Growth -19.6% -9.2% 29.5% 27.1% 25.9% 23.4% 13.5% 2.0% 13.4% 9.5% Source: J.P. Morgan estimates, Company reports, comScore, Nielsen//NetRatings, IDC, IWS, and IAB.
US Growth Likely to Trail the Global Market at 11% in F’10 We expect the US graphical advertising market to grow 10.5% in 2010, vs 2009E growth of (5.2%). We believe page view growth will slow to 5.3% in 2010 (down from 6.5% in 2009E) as social networking sites and blogs begin to mature and reach saturated penetration levels. In our estimate, page view growth will be driven by an increase of 2.0% in internet users and an increase of 3.2% in usage per internet user. We are modeling RPMs to increase 5% in 2010, driven by flat growth in impressions per page, offset by a 5% increase in CPMs. We expect the US graphical advertising market to grow at an 8% CAGR from 2009 through 2011.
Table 15: J.P. Morgan’s US Graphical Advertising Revenue Forecast Units as indicated
United States 2006 2007 2008 2009E 2010E 2011E ’09-’11E CAGR
Internet Population (M) 203 211 217 222 227 231 2.0% Pages Viewed / User / Day 45 47 49 51 52 54 3.3% Total Pages Viewed (B) 3,341 3,608 3,868 4,120 4,338 4,576 5.4% Impressions / Page 0.50 0.60 0.62 0.60 0.60 0.61 0.8% Total Impressions (B) 1,671 2,165 2,398 2,472 2,603 2,792 6.3% CPM (per 1,000 impressions) $3.50 $3.31 $3.32 $3.05 $3.20 $3.15 1.6% RPM (per 1,000 pages) $1.75 $1.99 $2.06 $1.83 $1.92 $1.92 2.5% US Graphical Forecast ($M) 5,847 7,166 7,950 7,539 8,329 8,794 8.0% Y/Y Growth 23.0% 22.6% 10.9% -5.2% 10.5% 5.6% Source: J.P. Morgan estimates, Company reports, comScore, Nielsen//NetRatings, IDC, IWS, and IAB.
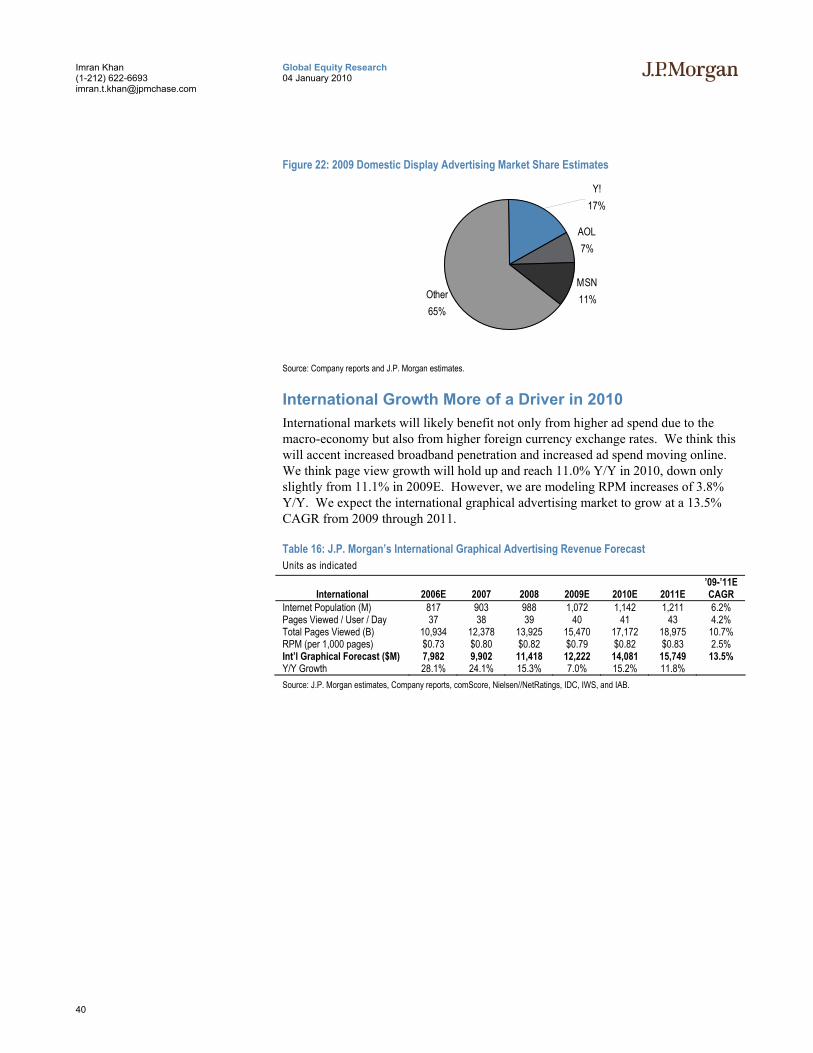
40
Global Equity Research 04 January 2010
Imran Khan (1-212) 622-6693 [email protected]
Figure 22: 2009 Domestic Display Advertising Market Share Estimates
AOL7%
MSN11%Other
65%
Y!17%
Source: Company reports and J.P. Morgan estimates.
International Growth More of a Driver in 2010 International markets will likely benefit not only from higher ad spend due to the macro-economy but also from higher foreign currency exchange rates. We think this will accent increased broadband penetration and increased ad spend moving online. We think page view growth will hold up and reach 11.0% Y/Y in 2010, down only slightly from 11.1% in 2009E. However, we are modeling RPM increases of 3.8% Y/Y. We expect the international graphical advertising market to grow at a 13.5% CAGR from 2009 through 2011.
Table 16: J.P. Morgan’s International Graphical Advertising Revenue Forecast Units as indicated
International 2006E 2007 2008 2009E 2010E 2011E ’09-’11E CAGR
Internet Population (M) 817 903 988 1,072 1,142 1,211 6.2% Pages Viewed / User / Day 37 38 39 40 41 43 4.2% Total Pages Viewed (B) 10,934 12,378 13,925 15,470 17,172 18,975 10.7% RPM (per 1,000 pages) $0.73 $0.80 $0.82 $0.79 $0.82 $0.83 2.5% Int’l Graphical Forecast ($M) 7,982 9,902 11,418 12,222 14,081 15,749 13.5% Y/Y Growth 28.1% 24.1% 15.3% 7.0% 15.2% 11.8% Source: J.P. Morgan estimates, Company reports, comScore, Nielsen//NetRatings, IDC, IWS, and IAB.

41
Global Equity Research 04 January 2010
Imran Khan (1-212) 622-6693 [email protected]
Mobile Advertising In our opinion, mobile advertising has been a promising but nascent industry, as the limited availability and usage of smartphones did not provide the scale necessary to reach a broad audience through advertising. However, we now think 2010 will be an inflection point, as the prevalence of iPhones and Android phones makes this technology more mainstream. Although there was exponential growth in smart phone users last year, only about 29M of 233M mobile subscribers used smart phones as of March 2009, according to comScore. As these users are 3x as likely to browse the mobile web, 3x as likely to use a mobile app, and 2x as likely to send photos or videos, we think smart phone penetration is key to mobile advertising growth.
Figure 23: Smart vs. Non-smart Phone Penetration
Non-smart phone users, 88%
Smart phone users, 12%
Source: comScore data, March 2009.
Use of the Mobile Web Is Becoming Mainstream According to comScore research, only 37% of US phone users are still solely using the phone for traditional voice purposes, with an additional 28% using SMS features plus voice, and another 35% employing the available mobile media (defined as anyone who browses, downloads, or uses and application). We are very encouraged that well over half the US population is making use of advanced features on mobile phones. Furthermore, we are equally encouraged by the pace of mobile media adoption, as mobile media users as a percent of mobile phone users grew 680 bps to 35.3% in January 2009 from 28.5% in January 2008. We think much of the growth in 2010 will be spurred by the highly anticipated launches of Android phones.

42
Global Equity Research 04 January 2010
Imran Khan (1-212) 622-6693 [email protected]
Table 17: Usage of Available Mobile Services Ranking Activity # of Users (M) % Users Y/Y Growth
Total Market 230 5.0% 1 Sent text message to another phone 131.9 57.3% 25.7% 2 Took photos 102.6 44.6% 27.5% 3 Mobile media users (browsers, downloaders, or apps
users) 81.2 35.3% 30.1%
4 Used network services for sending photos/videos 70.5 30.7% 46.8% 5 Sent photo directly to another phone 64.8 28.2% 46.6% 6 Changed to native ringtone 64 27.8% 23.4% 7 SMS Ads: Number received in month 57.4 24.9% 36.4% 8 Changed to native graphics 57.2 24.9% 33.0% 9 Played games 56.3 24.5% 19.6%
10 Set graphics with camera 55.3 24.1% 22.4% 11 News/info via browser 45.9 20.0% 59.7% 12 Transferred photo to PC 45.9 19.9% 48.0% 13 Captured video 40.9 17.8% 54.5% 14 Used email (work or personal) 40.7 17.7% 54.2% 15 Sent photo via email 39.5 17.2% 55.1% 16 News/info via SMS 32.4 14.1% 114.9% 17 Used major instant messaging service 31.9 13.9% 85.8% 18 Made own ringtone 28.9 12.6% 35.4% 19 Sent video directly to another phone 25.9 11.3% 81.7% 20 Listened to music on mobile phone 25 10.9% 71.0%
Source: comScore reports.
Social Networks and Top-Branded Publishers Drive Growth With better devices, improved data speeds, and more attractive data plans, content and service providers have been able to recognize distinct growth in usage. According to comScore, the steepest rises in the mobile internet have been spearheaded by social networking, which has seen 196.7% Y/Y growth, and apps, which recognized 116.7% Y/Y growth. Mobile users spend ~24 minutes on Facebook and average 3.3 visits per day, which is now equal if not better than PC users who spend 27.5minutes per day and average 2.3 visits. On the more traditional content side, search appears to remain the entry point to the mobile web with the most usage of mobile genres, according to comScore. Furthermore, branding appears to remain key, with strong web brands dominating mobile devices.
Table 18: Top 10 Mobile Web News Brands in the US Male Female
1 CNN CNN 2 ESPN Yahoo! 3 Yahoo! The Weather Channel 4 The Weather Channel Google 5 FOX FOX 6 Google ABC News 7 CBS AOL 8 MSNBC MSNBC 9 ABC News CBS 10 NFL.com ESPN
Source: comScore MobiLens, October 2008.
Mobile users access their smart-phones across all times and days with slight peaks during the daytime and evening hours, consistent with sleeping patterns. We think this offers advertisers an attractive pattern as, ad rates and consumer reach should not be dependent on certain prime-time hours and days.
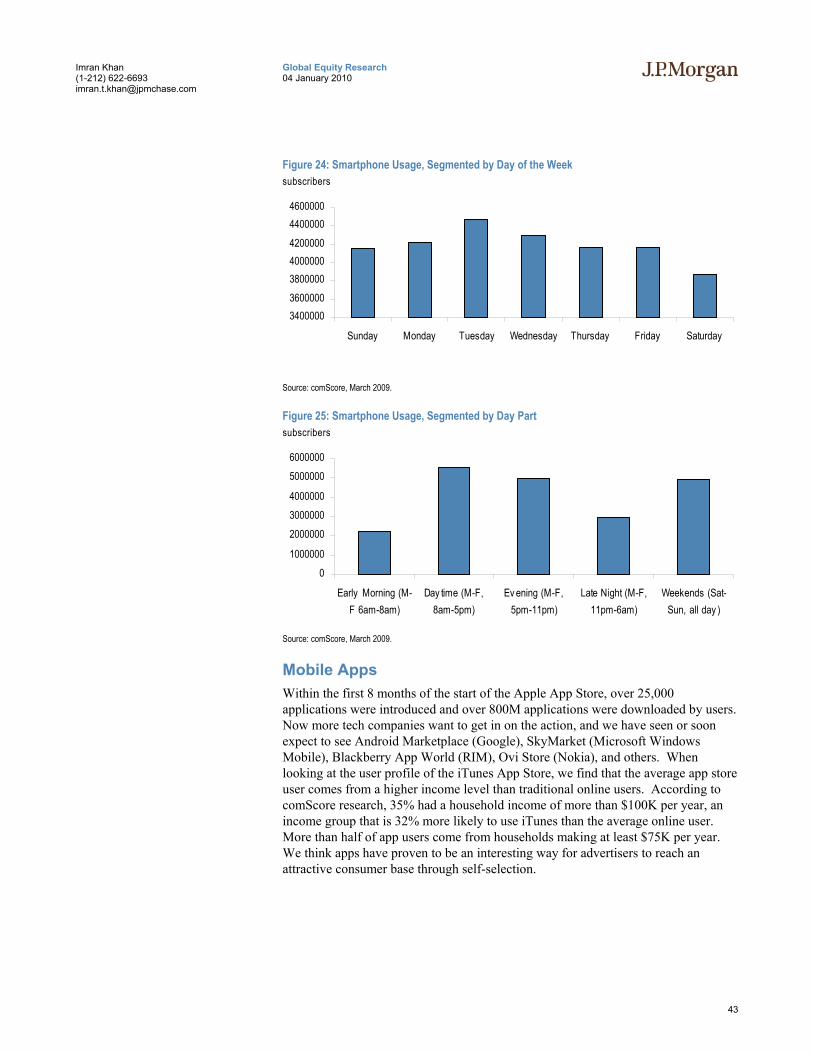
43
Global Equity Research 04 January 2010
Imran Khan (1-212) 622-6693 [email protected]
Figure 24: Smartphone Usage, Segmented by Day of the Week subscribers
3400000360000038000004000000420000044000004600000
Sunday Monday Tuesday Wednesday Thursday Friday Saturday
Source: comScore, March 2009.
Figure 25: Smartphone Usage, Segmented by Day Part subscribers
01000000
200000030000004000000
50000006000000
Early Morning (M-F 6am-8am)
Day time (M-F,8am-5pm)
Ev ening (M-F,5pm-11pm)
Late Night (M-F,11pm-6am)
Weekends (Sat-Sun, all day )
Source: comScore, March 2009.
Mobile Apps Within the first 8 months of the start of the Apple App Store, over 25,000 applications were introduced and over 800M applications were downloaded by users. Now more tech companies want to get in on the action, and we have seen or soon expect to see Android Marketplace (Google), SkyMarket (Microsoft Windows Mobile), Blackberry App World (RIM), Ovi Store (Nokia), and others. When looking at the user profile of the iTunes App Store, we find that the average app store user comes from a higher income level than traditional online users. According to comScore research, 35% had a household income of more than $100K per year, an income group that is 32% more likely to use iTunes than the average online user. More than half of app users come from households making at least $75K per year. We think apps have proven to be an interesting way for advertisers to reach an attractive consumer base through self-selection.
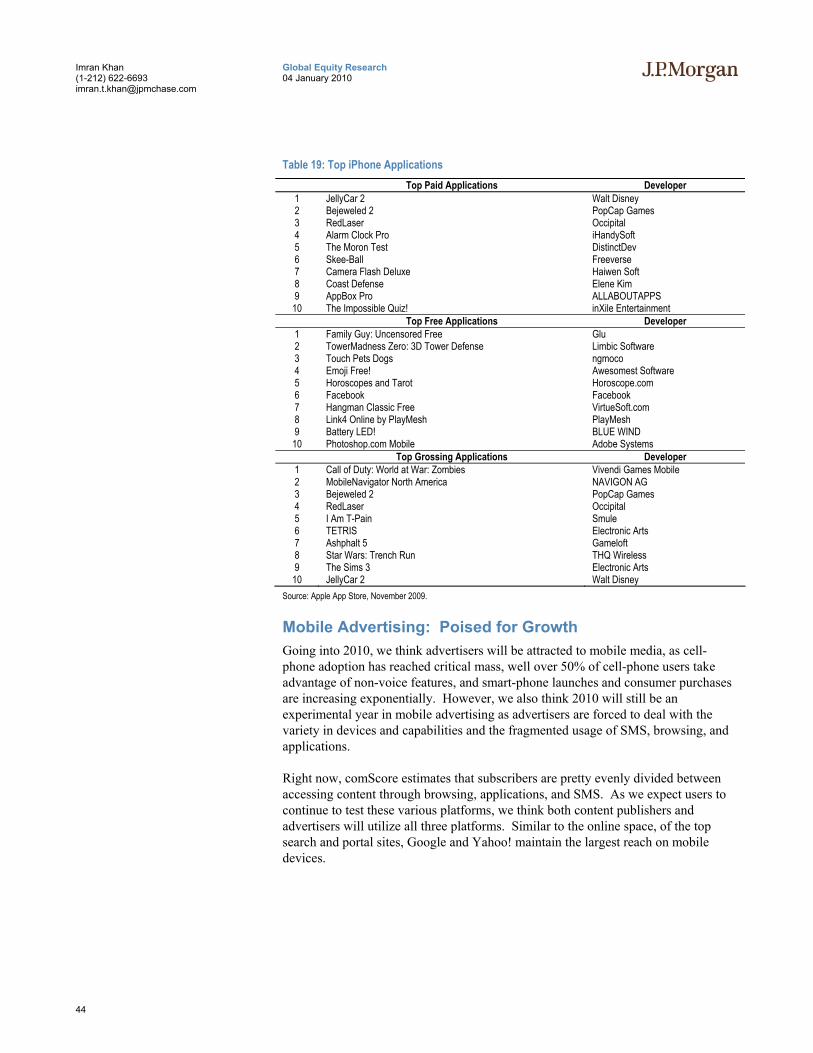
44
Global Equity Research 04 January 2010
Imran Khan (1-212) 622-6693 [email protected]
Table 19: Top iPhone Applications Top Paid Applications Developer
1 JellyCar 2 Walt Disney 2 Bejeweled 2 PopCap Games 3 RedLaser Occipital 4 Alarm Clock Pro iHandySoft 5 The Moron Test DistinctDev 6 Skee-Ball Freeverse 7 Camera Flash Deluxe Haiwen Soft 8 Coast Defense Elene Kim 9 AppBox Pro ALLABOUTAPPS 10 The Impossible Quiz! inXile Entertainment
Top Free Applications Developer 1 Family Guy: Uncensored Free Glu 2 TowerMadness Zero: 3D Tower Defense Limbic Software 3 Touch Pets Dogs ngmoco 4 Emoji Free! Awesomest Software 5 Horoscopes and Tarot Horoscope.com 6 Facebook Facebook 7 Hangman Classic Free VirtueSoft.com 8 Link4 Online by PlayMesh PlayMesh 9 Battery LED! BLUE WIND 10 Photoshop.com Mobile Adobe Systems
Top Grossing Applications Developer 1 Call of Duty: World at War: Zombies Vivendi Games Mobile 2 MobileNavigator North America NAVIGON AG 3 Bejeweled 2 PopCap Games 4 RedLaser Occipital 5 I Am T-Pain Smule 6 TETRIS Electronic Arts 7 Ashphalt 5 Gameloft 8 Star Wars: Trench Run THQ Wireless 9 The Sims 3 Electronic Arts 10 JellyCar 2 Walt Disney
Source: Apple App Store, November 2009.
Mobile Advertising: Poised for Growth Going into 2010, we think advertisers will be attracted to mobile media, as cell-phone adoption has reached critical mass, well over 50% of cell-phone users take advantage of non-voice features, and smart-phone launches and consumer purchases are increasing exponentially. However, we also think 2010 will still be an experimental year in mobile advertising as advertisers are forced to deal with the variety in devices and capabilities and the fragmented usage of SMS, browsing, and applications.
Right now, comScore estimates that subscribers are pretty evenly divided between accessing content through browsing, applications, and SMS. As we expect users to continue to test these various platforms, we think both content publishers and advertisers will utilize all three platforms. Similar to the online space, of the top search and portal sites, Google and Yahoo! maintain the largest reach on mobile devices.
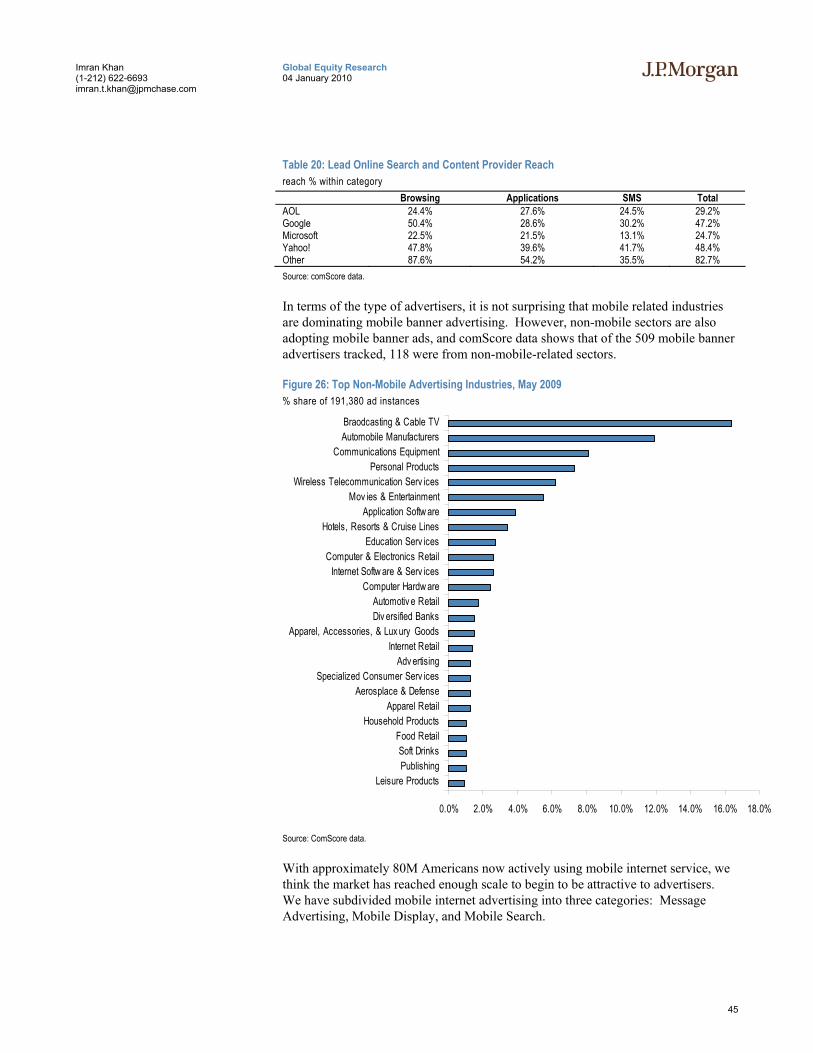
45
Global Equity Research 04 January 2010
Imran Khan (1-212) 622-6693 [email protected]
Table 20: Lead Online Search and Content Provider Reach reach % within category
Browsing Applications SMS Total AOL 24.4% 27.6% 24.5% 29.2% Google 50.4% 28.6% 30.2% 47.2% Microsoft 22.5% 21.5% 13.1% 24.7% Yahoo! 47.8% 39.6% 41.7% 48.4% Other 87.6% 54.2% 35.5% 82.7% Source: comScore data.
In terms of the type of advertisers, it is not surprising that mobile related industries are dominating mobile banner advertising. However, non-mobile sectors are also adopting mobile banner ads, and comScore data shows that of the 509 mobile banner advertisers tracked, 118 were from non-mobile-related sectors.
Figure 26: Top Non-Mobile Advertising Industries, May 2009 % share of 191,380 ad instances
0.0% 2.0% 4.0% 6.0% 8.0% 10.0% 12.0% 14.0% 16.0% 18.0%
Leisure ProductsPublishingSoft Drinks
Food RetailHousehold Products
Apparel RetailAerosplace & Defense
Specialized Consumer Serv icesAdv ertising
Internet RetailApparel, Accessories, & Lux ury Goods
Div ersified BanksAutomotiv e Retail
Computer Hardw areInternet Softw are & Serv ices
Computer & Electronics RetailEducation Serv ices
Hotels, Resorts & Cruise LinesApplication Softw are
Mov ies & EntertainmentWireless Telecommunication Serv ices
Personal ProductsCommunications Equipment
Automobile ManufacturersBraodcasting & Cable TV
Source: ComScore data.
With approximately 80M Americans now actively using mobile internet service, we think the market has reached enough scale to begin to be attractive to advertisers. We have subdivided mobile internet advertising into three categories: Message Advertising, Mobile Display, and Mobile Search.
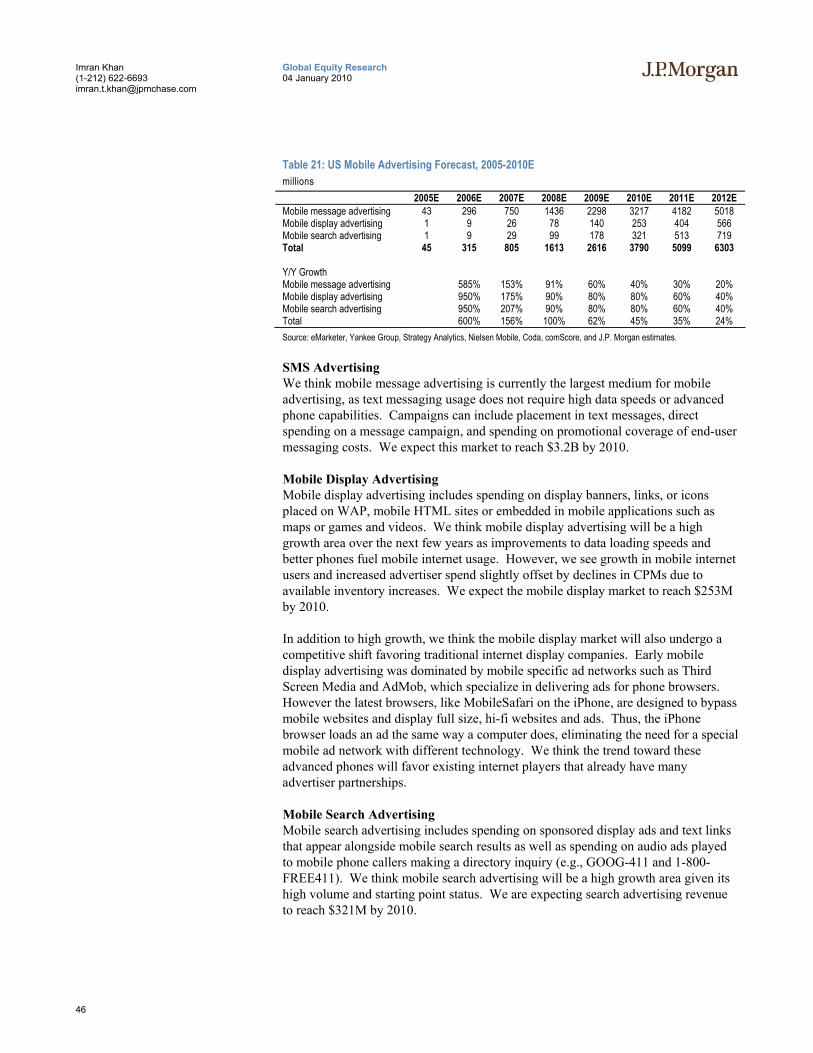
46
Global Equity Research 04 January 2010
Imran Khan (1-212) 622-6693 [email protected]
Table 21: US Mobile Advertising Forecast, 2005-2010E millions
2005E 2006E 2007E 2008E 2009E 2010E 2011E 2012E Mobile message advertising 43 296 750 1436 2298 3217 4182 5018 Mobile display advertising 1 9 26 78 140 253 404 566 Mobile search advertising 1 9 29 99 178 321 513 719 Total 45 315 805 1613 2616 3790 5099 6303 Y/Y Growth Mobile message advertising 585% 153% 91% 60% 40% 30% 20% Mobile display advertising 950% 175% 90% 80% 80% 60% 40% Mobile search advertising 950% 207% 90% 80% 80% 60% 40% Total 600% 156% 100% 62% 45% 35% 24% Source: eMarketer, Yankee Group, Strategy Analytics, Nielsen Mobile, Coda, comScore, and J.P. Morgan estimates.
SMS Advertising We think mobile message advertising is currently the largest medium for mobile advertising, as text messaging usage does not require high data speeds or advanced phone capabilities. Campaigns can include placement in text messages, direct spending on a message campaign, and spending on promotional coverage of end-user messaging costs. We expect this market to reach $3.2B by 2010.
Mobile Display Advertising Mobile display advertising includes spending on display banners, links, or icons placed on WAP, mobile HTML sites or embedded in mobile applications such as maps or games and videos. We think mobile display advertising will be a high growth area over the next few years as improvements to data loading speeds and better phones fuel mobile internet usage. However, we see growth in mobile internet users and increased advertiser spend slightly offset by declines in CPMs due to available inventory increases. We expect the mobile display market to reach $253M by 2010.
In addition to high growth, we think the mobile display market will also undergo a competitive shift favoring traditional internet display companies. Early mobile display advertising was dominated by mobile specific ad networks such as Third Screen Media and AdMob, which specialize in delivering ads for phone browsers. However the latest browsers, like MobileSafari on the iPhone, are designed to bypass mobile websites and display full size, hi-fi websites and ads. Thus, the iPhone browser loads an ad the same way a computer does, eliminating the need for a special mobile ad network with different technology. We think the trend toward these advanced phones will favor existing internet players that already have many advertiser partnerships.
Mobile Search Advertising Mobile search advertising includes spending on sponsored display ads and text links that appear alongside mobile search results as well as spending on audio ads played to mobile phone callers making a directory inquiry (e.g., GOOG-411 and 1-800-FREE411). We think mobile search advertising will be a high growth area given its high volume and starting point status. We are expecting search advertising revenue to reach $321M by 2010.
47
Global Equity Research 04 January 2010
Imran Khan (1-212) 622-6693 [email protected]
Company Initiatives Google Works on Android Google decided to address distribution difficulties head-on with the creation of the Open Handset Alliance, composed of leading technology and wireless companies committed to the development of an open platform for mobile devices. The Android platform is a fully integrated mobile "software stack” consisting of an operating system, middleware, user-friendly interface, and applications. The first phones based on Android have just begun debuting. By bringing the internet developer model to the mobile market, it is hoped that increased innovation will make the phone features more attractive, affordable, and user-friendly for the consumer.
If the Android open platform is widely rolled out, more consumers would have access to Google features. Google has introduced many mobile products, including search, Gmail, YouTube, Picassa, maps, Google Apps and GOOG-411. We believe Google is well positioned to capitalize on the mobile space with its search dominance. Currently, advertisers can elect to place mobile search or content ads through AdWords.
Yahoo! Emphasizes Mobile Yahoo! has introduced a comprehensive mobile offering including:
• Mobile Homepage
• Yahoo! oneSearch, which provides instant answers to any query not just web links
• Yahoo! oneSearch with Voice, allowing users to launch searches by simple speaking
• Yahoo! oneConnect, an all-in-one communications application offering
• Yahoo! onePlace, a content management application
Similar to Google, Yahoo! has created an open environment that enables developers and publishers to make their offerings mobile. Yahoo!’s Mobile Widget Platform gives developers an easy-to-use XML-based blueprint and instant scalability across all mobile devices that Yahoo!’s own mobile services run on. Yahoo! has promoted uptake of its mobile services through carrier partnerships. During 2008, it also launched Yahoo! Search Boss and SearchMonkey. Yahoo! has announced to discontinue its Yahoo! Go service starting January 12, 2010.
Yahoo! has also begun to monetize the space. The company currently offers mobile display advertising in 23 territories across Europe, Asia, and the Americas. Search marketing solutions are available in the United States, the United Kingdom, and Japan. In addition to being Vodafone’s exclusive advertising partner in the U.K., Yahoo! announced a strategic partnership in the U.K. that will deliver the first graphical advertising to appear on T-Mobile’s Web’n’walk service. In June 2008, Maxis Communications Berhad in Malaysia and Idea Cellular Limited in India extended Yahoo!’s mobile graphical advertising reach through new partnerships.
48
Global Equity Research 04 January 2010
Imran Khan (1-212) 622-6693 [email protected]
MSN Updates Its Mobile Portal and Adds Features In June 2007, Microsoft launched MSN Mobile, a redesigned portal providing customers with access to email, news, videos, sports, entertainment, local movie listings, maps and directions, weather, Windows Live Messenger, and Bing Search. Like Yahoo!, Microsoft is pursuing strategic alliances. As of February 2009, Windows Mobile was running phones from 50 device makers used by 160 mobile operators. Microsoft software and services, including Windows Mobile, Windows Live Messenger, Hotmail, and Windows Live Spaces, are also used by device makers including HTC Corp, LG Electronics, Motorola, Nokia, Palm, RIM, and Samsung.
Microsoft now has firm footing in the mobile advertising world. Last spring, Microsoft announced the acquisition of ScreenTonic, a Paris-based company that specializes in delivering location-based ads to mobile devices. ScreenTonic’s platform, called Stamp, enables delivery of text or banner links on portals, ads in SMS (Short Message Service) messages and ads in mobile web pages that vary depending on where the reader is located. Last year, Microsoft made two more acquisitions. TellMe provides a voice search recognition platform. Danger provides communication, organization, and information services through real-time mobile messaging, social networking, web browsing, and personal information management applications. Microsoft has teamed up with Thumbplay to give users fast access to Ringtones, Games and Wallpaper downloads.
Other Company Initiatives Amobee Amobee delivers a unified, telco-grade system for funding mobile content and communications through advertising revenues. Amobee dynamically inserts targeted, interactive advertisements into all types of mobile entertainment and communication channels, including videos, music, messaging, games, and WAP. Amobee launched mobile advertising for Telefonica in Spain in May 2009.
Enpocket Enpocket, acquired by Nokia in 2007, allows brands to plan, create, execute, measure and optimize mobile advertising campaigns around the world. The Enpocket platform is a mobile advertising campaign management and delivery system distinguished by advanced consumer insight, targeting, and measurement. The platform can deliver mobile advertising across multiple formats including SMS, MMS, mobile Internet advertising, and video.
Greystripe Greystripe’s AdWRAP products provide mobile content free to consumers in an ad-supported model through the operation of an in-game mobile ad network and mobile game distribution platform. The ad network takes full screen images, videos, and scrolling banners and dynamically delivers them into mobile games and applications. Last year, Greystripe announced that it is launching an iPhone 3G API for game developers.
JumpTap JumpTap reaches over 170 million mobile subscribers through partnerships with 16 mobile operators and numerous content publishers, JumpTap’s search and advertising solutions enable carriers to maintain a position in the mobile marketing value chain, drive traffic and revenue opportunities to content publishers, and give
49
Global Equity Research 04 January 2010
Imran Khan (1-212) 622-6693 [email protected]
advertisers access to targeted customers. In April 2009, JumpTap announced tapMatch, its pay-per-click (PPC) performance mobile ad marketplace.
Medio Systems Medio Systems is a provider of mobile search and advertising solutions. Created specifically for mobile, Medio Mobile Search combines a user interface with recommendation and personalization technologies. Using the targeting capabilities of the mobile search platform, the Medio MobileNow Search Advertising Network enables advertisers to identify and reach interested audiences. Through Medio’s unique partnerships with mobile carriers and publishers, ads are integrated into the consumer mobile search experience where increased relevance drives response. Medio Systems also partners with AdMob (which was recently acquired by Google) to improve monetization of mobile web advertising.
Millennial Media Millennial Media is a mobile media network that specializes in the “millennial” audience. Millenial Media’s advertising offerings include Millennial Motion rich media, the MBrand network for targeted audiences across premium content and Decktrade for performance-driven campaigns. On November 16, 2009, Millennial Media received $16M of new funding to expand advertising on mobile devices.
MoVoxx MoVoxx is an interactive advertising agency focused on mobile advertising via SMS/text. The company’s solutions are intended to give traditional and interactive agencies, media buyers and brand managers a quick, silent way to have a 1-to-1 dialogue with mobile consumers. INTXT allows advertisers to append ads to the outgoing SMS messages of MoVoxx Publisher Network traffic. The technology allows ads to be targeted by geography, daypart, and content channel. INADS enables advertisers to build their own mobile inventory through keyword/shortcode placements within existing advertisements – print, TV, radio, internet, or in-venue. The product also integrates a method for tracking and reporting the success of a campaign.
SmartReply SmartReply, Inc. provides voice and mobile messaging solutions to retailers and retail brands in the United States and Canada. The company also offers mobile marketing, text messaging, and email marketing solutions. Its client base includes retail, consumer packaged goods, and mobile marketing companies. SmartReply was founded in 2001 and is headquartered in Irvine, California. The company acquired mSnap, Inc. on March 23, 2009.
Quattro Quattro is a mobile ad network that provides targeted, interactive multi-media mobile ad units (Video, SMS, WAP, click-to-call, email, share), all of which can be tracked in real-time. Quattro’s offering for publishers includes a proprietary Juicing technology (which allows publishers to run wired assets on wireless devices without feeds), as well as handset expertise, and interactive feature sets.
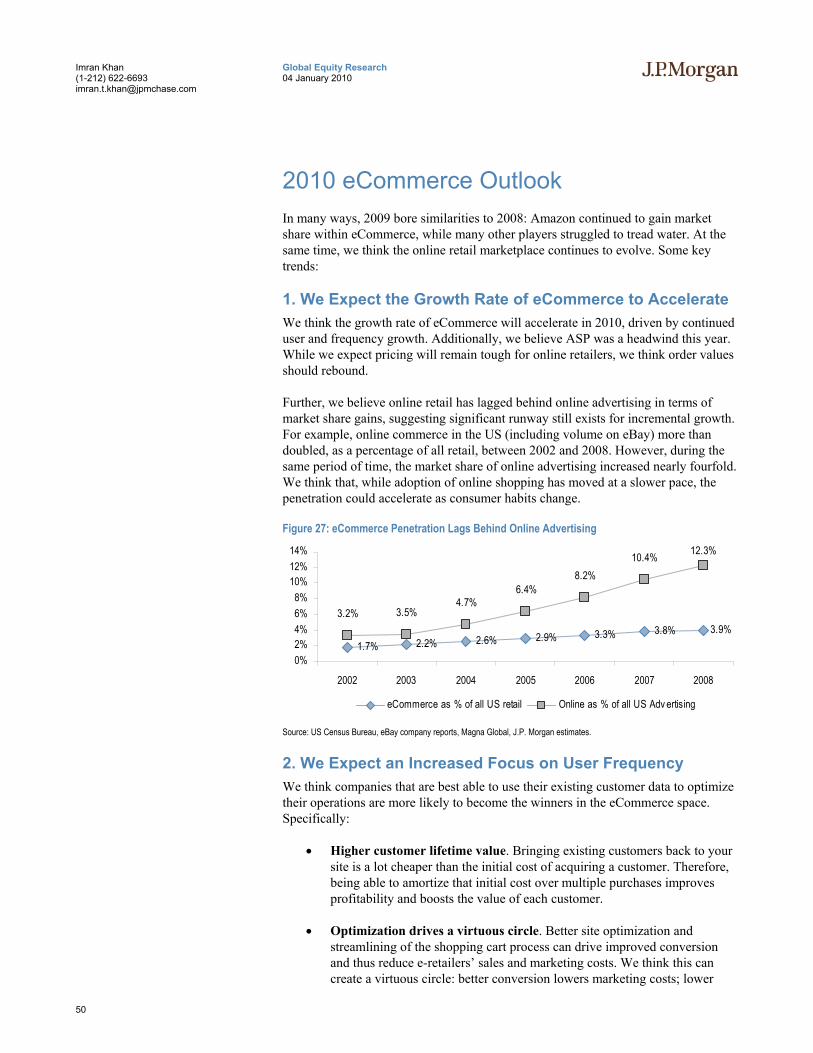
50
Global Equity Research 04 January 2010
Imran Khan (1-212) 622-6693 [email protected]
2010 eCommerce Outlook In many ways, 2009 bore similarities to 2008: Amazon continued to gain market share within eCommerce, while many other players struggled to tread water. At the same time, we think the online retail marketplace continues to evolve. Some key trends:
1. We Expect the Growth Rate of eCommerce to Accelerate We think the growth rate of eCommerce will accelerate in 2010, driven by continued user and frequency growth. Additionally, we believe ASP was a headwind this year. While we expect pricing will remain tough for online retailers, we think order values should rebound.
Further, we believe online retail has lagged behind online advertising in terms of market share gains, suggesting significant runway still exists for incremental growth. For example, online commerce in the US (including volume on eBay) more than doubled, as a percentage of all retail, between 2002 and 2008. However, during the same period of time, the market share of online advertising increased nearly fourfold. We think that, while adoption of online shopping has moved at a slower pace, the penetration could accelerate as consumer habits change.
Figure 27: eCommerce Penetration Lags Behind Online Advertising
1.7% 2.2% 2.6% 2.9% 3.8% 3.9%3.2% 3.5%
4.7%6.4%
8.2%10.4% 12.3%
3.3%
0%2%4%6%8%
10%12%14%
2002 2003 2004 2005 2006 2007 2008
eCommerce as % of all US retail Online as % of all US Adv ertising
Source: US Census Bureau, eBay company reports, Magna Global, J.P. Morgan estimates.
2. We Expect an Increased Focus on User Frequency We think companies that are best able to use their existing customer data to optimize their operations are more likely to become the winners in the eCommerce space. Specifically:
• Higher customer lifetime value. Bringing existing customers back to your site is a lot cheaper than the initial cost of acquiring a customer. Therefore, being able to amortize that initial cost over multiple purchases improves profitability and boosts the value of each customer.
• Optimization drives a virtuous circle. Better site optimization and streamlining of the shopping cart process can drive improved conversion and thus reduce e-retailers’ sales and marketing costs. We think this can create a virtuous circle: better conversion lowers marketing costs; lower
51
Global Equity Research 04 January 2010
Imran Khan (1-212) 622-6693 [email protected]
marketing costs can enable lower selling prices; lower selling prices increase volume and improve the capacity for additional optimization.
3. Offline Pain Continues to Drive Online Gain We see two trends that affect offline retail in a way we think should be a positive for online retailers:
Low Inventories Could Drive Consumers Online We think traditional retailers have been very conservative with merchandising during the 2009 holiday season. We expect online retailers to benefit from this defensive posture, as consumers who show up to brick-and-mortar stores and find that the items they are looking for are not available.
In this regard, eCommerce companies benefit from their less complicated supply chain: instead of needing to maintain appropriate stock levels at several hundred stores, web retailers only need to worry about inventory levels at one warehouse (or, at most, a handful of warehouses).
Brick-and-Mortar Bankruptcies A variety of brick-and-mortar retailers have gone through bankruptcy since the start of the economic downturn. We think offline bankruptcies can have the following effects on eCommerce:
• Near-term pricing pressure. As stores enter bankruptcy and close, the push to liquidate inventory could result in margin pressure on the survivors, both online and offline.
• Upheaval changes consumer behavior. We believe some consumers establish shopping habits and relationships with retailers that can be difficult to break. A bankruptcy can drive these customers, who would have otherwise been difficult to acquire, to examine alternative options and form new shopping habits. For some such shoppers, changes in the offline world could result in lower convenience (e.g., the store nearby closes and now the closest store is too far away), which could drive greater adoption of eCommerce.
• In the medium to long term, we think thinning the B&M herd could prove to be a positive for online retailers, which could find it easier to win and maintain wallet share in a marketplace with fewer competitors.
We think one significant winner is likely to continue to be Amazon, which stands to gain from the decline of players in both its core media arena (given the difficulties for Borders) and in its growing electronics business (Circuit City et al.) Similarly, we think Blue Nile could see its market share increase as traditional jewelers struggle.
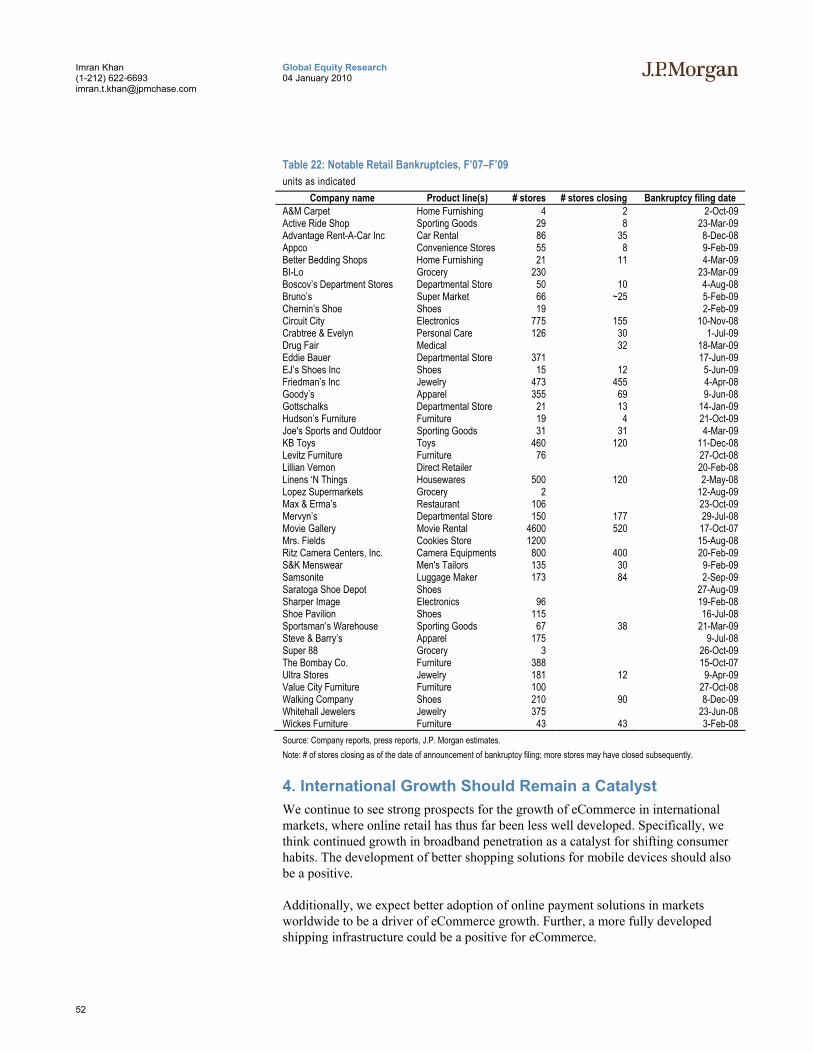
52
Global Equity Research 04 January 2010
Imran Khan (1-212) 622-6693 [email protected]
Table 22: Notable Retail Bankruptcies, F’07–F’09 units as indicated
Company name Product line(s) # stores # stores closing Bankruptcy filing date A&M Carpet Home Furnishing 4 2 2-Oct-09 Active Ride Shop Sporting Goods 29 8 23-Mar-09 Advantage Rent-A-Car Inc Car Rental 86 35 8-Dec-08 Appco Convenience Stores 55 8 9-Feb-09 Better Bedding Shops Home Furnishing 21 11 4-Mar-09 BI-Lo Grocery 230 23-Mar-09 Boscov’s Department Stores Departmental Store 50 10 4-Aug-08 Bruno’s Super Market 66 ~25 5-Feb-09 Chernin’s Shoe Shoes 19 2-Feb-09 Circuit City Electronics 775 155 10-Nov-08 Crabtree & Evelyn Personal Care 126 30 1-Jul-09 Drug Fair Medical 32 18-Mar-09 Eddie Bauer Departmental Store 371 17-Jun-09 EJ’s Shoes Inc Shoes 15 12 5-Jun-09 Friedman’s Inc Jewelry 473 455 4-Apr-08 Goody’s Apparel 355 69 9-Jun-08 Gottschalks Departmental Store 21 13 14-Jan-09 Hudson’s Furniture Furniture 19 4 21-Oct-09 Joe's Sports and Outdoor Sporting Goods 31 31 4-Mar-09 KB Toys Toys 460 120 11-Dec-08 Levitz Furniture Furniture 76 27-Oct-08 Lillian Vernon Direct Retailer 20-Feb-08 Linens ‘N Things Housewares 500 120 2-May-08 Lopez Supermarkets Grocery 2 12-Aug-09 Max & Erma’s Restaurant 106 23-Oct-09 Mervyn’s Departmental Store 150 177 29-Jul-08 Movie Gallery Movie Rental 4600 520 17-Oct-07 Mrs. Fields Cookies Store 1200 15-Aug-08 Ritz Camera Centers, Inc. Camera Equipments 800 400 20-Feb-09 S&K Menswear Men's Tailors 135 30 9-Feb-09 Samsonite Luggage Maker 173 84 2-Sep-09 Saratoga Shoe Depot Shoes 27-Aug-09 Sharper Image Electronics 96 19-Feb-08 Shoe Pavilion Shoes 115 16-Jul-08 Sportsman’s Warehouse Sporting Goods 67 38 21-Mar-09 Steve & Barry’s Apparel 175 9-Jul-08 Super 88 Grocery 3 26-Oct-09 The Bombay Co. Furniture 388 15-Oct-07 Ultra Stores Jewelry 181 12 9-Apr-09 Value City Furniture Furniture 100 27-Oct-08 Walking Company Shoes 210 90 8-Dec-09 Whitehall Jewelers Jewelry 375 23-Jun-08 Wickes Furniture Furniture 43 43 3-Feb-08 Source: Company reports, press reports, J.P. Morgan estimates. Note: # of stores closing as of the date of announcement of bankruptcy filing; more stores may have closed subsequently.
4. International Growth Should Remain a Catalyst We continue to see strong prospects for the growth of eCommerce in international markets, where online retail has thus far been less well developed. Specifically, we think continued growth in broadband penetration as a catalyst for shifting consumer habits. The development of better shopping solutions for mobile devices should also be a positive.
Additionally, we expect better adoption of online payment solutions in markets worldwide to be a driver of eCommerce growth. Further, a more fully developed shipping infrastructure could be a positive for eCommerce.
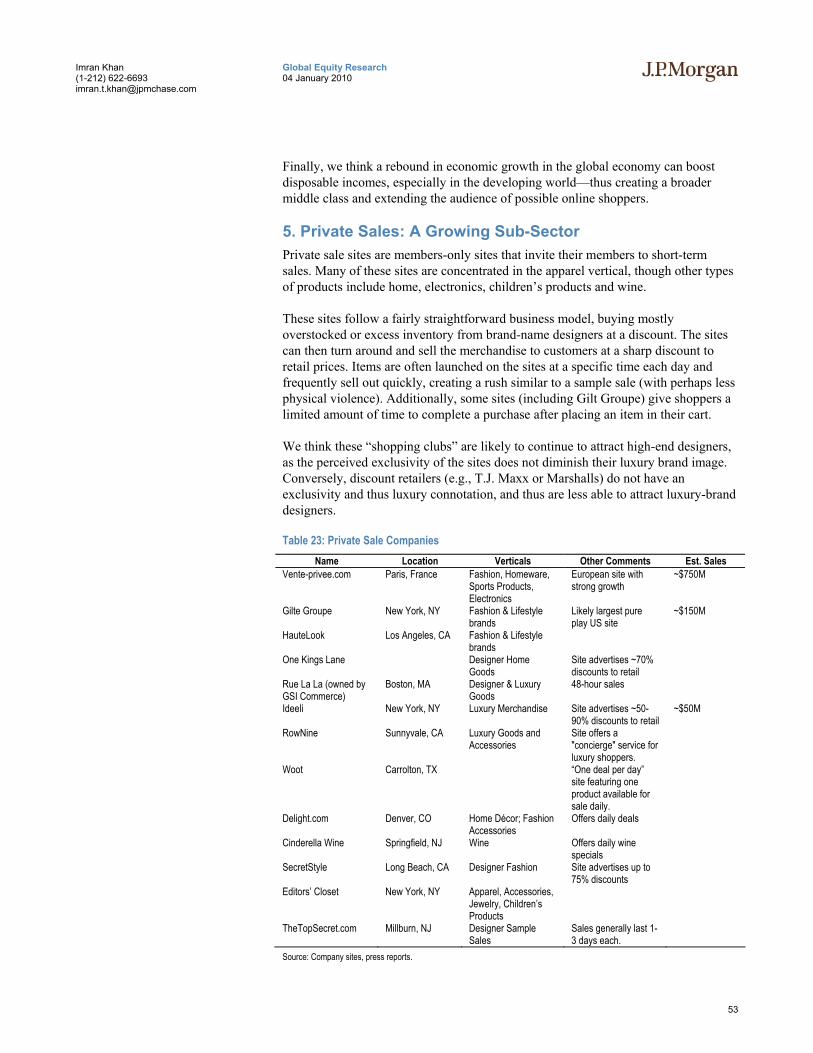
53
Global Equity Research 04 January 2010
Imran Khan (1-212) 622-6693 [email protected]
Finally, we think a rebound in economic growth in the global economy can boost disposable incomes, especially in the developing world—thus creating a broader middle class and extending the audience of possible online shoppers.
5. Private Sales: A Growing Sub-Sector Private sale sites are members-only sites that invite their members to short-term sales. Many of these sites are concentrated in the apparel vertical, though other types of products include home, electronics, children’s products and wine.
These sites follow a fairly straightforward business model, buying mostly overstocked or excess inventory from brand-name designers at a discount. The sites can then turn around and sell the merchandise to customers at a sharp discount to retail prices. Items are often launched on the sites at a specific time each day and frequently sell out quickly, creating a rush similar to a sample sale (with perhaps less physical violence). Additionally, some sites (including Gilt Groupe) give shoppers a limited amount of time to complete a purchase after placing an item in their cart.
We think these “shopping clubs” are likely to continue to attract high-end designers, as the perceived exclusivity of the sites does not diminish their luxury brand image. Conversely, discount retailers (e.g., T.J. Maxx or Marshalls) do not have an exclusivity and thus luxury connotation, and thus are less able to attract luxury-brand designers.
Table 23: Private Sale Companies Name Location Verticals Other Comments Est. Sales
Vente-privee.com Paris, France Fashion, Homeware, Sports Products, Electronics
European site with strong growth
~$750M
Gilte Groupe New York, NY Fashion & Lifestyle brands
Likely largest pure play US site
~$150M
HauteLook Los Angeles, CA Fashion & Lifestyle brands
One Kings Lane Designer Home Goods
Site advertises ~70% discounts to retail
Rue La La (owned by GSI Commerce)
Boston, MA Designer & Luxury Goods
48-hour sales
Ideeli New York, NY Luxury Merchandise Site advertises ~50-90% discounts to retail
~$50M
RowNine Sunnyvale, CA Luxury Goods and Accessories
Site offers a "concierge" service for luxury shoppers.
Woot Carrolton, TX “One deal per day” site featuring one product available for sale daily.
Delight.com Denver, CO Home Décor; Fashion Accessories
Offers daily deals
Cinderella Wine Springfield, NJ Wine Offers daily wine specials
SecretStyle Long Beach, CA Designer Fashion Site advertises up to 75% discounts
Editors’ Closet New York, NY Apparel, Accessories, Jewelry, Children’s Products
TheTopSecret.com Millburn, NJ Designer Sample Sales
Sales generally last 1-3 days each.
Source: Company sites, press reports.
54
Global Equity Research 04 January 2010
Imran Khan (1-212) 622-6693 [email protected]
Recent Investment Activity The area has received significant recent attention from investors. Gilt Groupe reportedly received a $43M financing round from Matrix Partners and General Atlantic in August 2009. In October, GSI Commerce (NASDAQ: GSIC) acquired Retail Convergence, the parent company of Rue La La (a private sale site) and SmartBargains.com (an off-price eCommerce marketplace) for a package of $180M and an additional $170M in earnouts. December saw Kleiner Perkins Caufield & Byers invest in One Kings Lane, a home décor private sale site.
Usage and Traffic Growth Members of these sites have grown significantly over the past year, as current members continue to invite friends to join. Rue La La has approximately 1.2M members, while Gilt has nearly 1.6M. On a Y/Y basis, unique users to the two sites have grown 265% and 142%, respectively, since last October.
6. The User Experience: Reduce Frictions We think eCommerce companies are increasingly focused on reducing frictions for consumers: trying to remove as many kinks as possible from the online shopping experience.
We think consumers continue to have greater and greater expectations of convenience in shopping online. As such, more sites are offering free shipping (usually with a spend threshold), and Amazon has begun rolling out same-day delivery in certain metro areas. Additionally, sites are rolling out more payment options (PayPal’s footprint continues to grow, e.g.). The success of Zappos also illuminates the positive impact of generous return policies.
7. A Multi-Channel Environment From a seller’s perspective, we think eCommerce is becoming more complicated: inventory goes through large sites like eBay and Amazon (and likely more tomorrow), and through your own site, aided by search engine marketing and comparison shopping sites. On top of this, a seller needs inventory management, email marketing and analytics. As a result, better seller tools that can tie these needs and platforms together become a near-necessity.
From the perspective of the big sites, we think price and selection continue to be critical. The ability to lock in customers remains low (with Amazon Prime and eBay Bucks as possible exceptions). As such, competitive pricing and broad selection are key to success, and it’s not surprising we’re seeing more sites attempting to set up third-party marketplaces.
2009 has seen significant growth in third-party solutions, with Wal-Mart and Sears both entering the fray and adding third-party sellers to their sites, to go along with Amazon (where third-party volume continues to grow) and eBay (as well as smaller players such as buy.com).
Within this space, we believe Amazon’s FBA product offers a significant competitive advantage, as it allows sellers to better access Amazon’s customer base while at the same time making for a better, more frictionless experience for the customer.
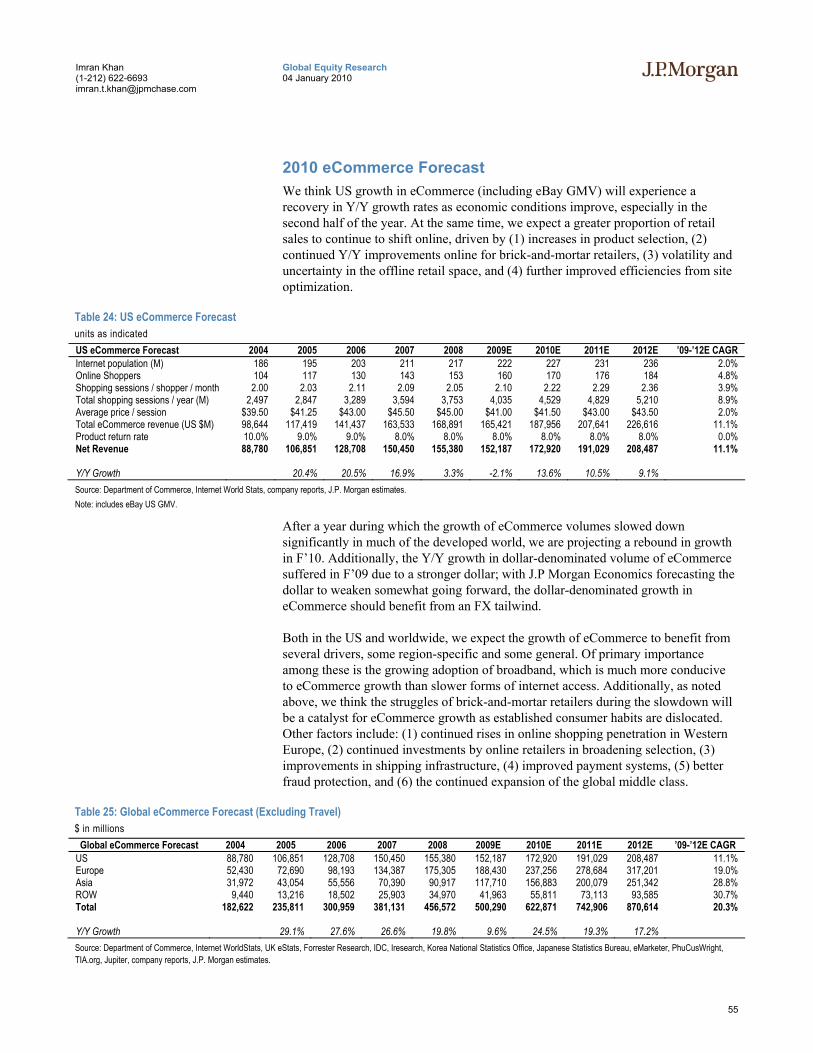
55
Global Equity Research 04 January 2010
Imran Khan (1-212) 622-6693 [email protected]
2010 eCommerce Forecast We think US growth in eCommerce (including eBay GMV) will experience a recovery in Y/Y growth rates as economic conditions improve, especially in the second half of the year. At the same time, we expect a greater proportion of retail sales to continue to shift online, driven by (1) increases in product selection, (2) continued Y/Y improvements online for brick-and-mortar retailers, (3) volatility and uncertainty in the offline retail space, and (4) further improved efficiencies from site optimization.
Table 24: US eCommerce Forecast units as indicated US eCommerce Forecast 2004 2005 2006 2007 2008 2009E 2010E 2011E 2012E ’09-’12E CAGR Internet population (M) 186 195 203 211 217 222 227 231 236 2.0% Online Shoppers 104 117 130 143 153 160 170 176 184 4.8% Shopping sessions / shopper / month 2.00 2.03 2.11 2.09 2.05 2.10 2.22 2.29 2.36 3.9% Total shopping sessions / year (M) 2,497 2,847 3,289 3,594 3,753 4,035 4,529 4,829 5,210 8.9% Average price / session $39.50 $41.25 $43.00 $45.50 $45.00 $41.00 $41.50 $43.00 $43.50 2.0% Total eCommerce revenue (US $M) 98,644 117,419 141,437 163,533 168,891 165,421 187,956 207,641 226,616 11.1% Product return rate 10.0% 9.0% 9.0% 8.0% 8.0% 8.0% 8.0% 8.0% 8.0% 0.0% Net Revenue 88,780 106,851 128,708 150,450 155,380 152,187 172,920 191,029 208,487 11.1% Y/Y Growth 20.4% 20.5% 16.9% 3.3% -2.1% 13.6% 10.5% 9.1% Source: Department of Commerce, Internet World Stats, company reports, J.P. Morgan estimates. Note: includes eBay US GMV.
After a year during which the growth of eCommerce volumes slowed down significantly in much of the developed world, we are projecting a rebound in growth in F’10. Additionally, the Y/Y growth in dollar-denominated volume of eCommerce suffered in F’09 due to a stronger dollar; with J.P Morgan Economics forecasting the dollar to weaken somewhat going forward, the dollar-denominated growth in eCommerce should benefit from an FX tailwind.
Both in the US and worldwide, we expect the growth of eCommerce to benefit from several drivers, some region-specific and some general. Of primary importance among these is the growing adoption of broadband, which is much more conducive to eCommerce growth than slower forms of internet access. Additionally, as noted above, we think the struggles of brick-and-mortar retailers during the slowdown will be a catalyst for eCommerce growth as established consumer habits are dislocated. Other factors include: (1) continued rises in online shopping penetration in Western Europe, (2) continued investments by online retailers in broadening selection, (3) improvements in shipping infrastructure, (4) improved payment systems, (5) better fraud protection, and (6) the continued expansion of the global middle class.
Table 25: Global eCommerce Forecast (Excluding Travel) $ in millions
Global eCommerce Forecast 2004 2005 2006 2007 2008 2009E 2010E 2011E 2012E ’09-’12E CAGR US 88,780 106,851 128,708 150,450 155,380 152,187 172,920 191,029 208,487 11.1% Europe 52,430 72,690 98,193 134,387 175,305 188,430 237,256 278,684 317,201 19.0% Asia 31,972 43,054 55,556 70,390 90,917 117,710 156,883 200,079 251,342 28.8% ROW 9,440 13,216 18,502 25,903 34,970 41,963 55,811 73,113 93,585 30.7% Total 182,622 235,811 300,959 381,131 456,572 500,290 622,871 742,906 870,614 20.3%
Y/Y Growth 29.1% 27.6% 26.6% 19.8% 9.6% 24.5% 19.3% 17.2% Source: Department of Commerce, Internet WorldStats, UK eStats, Forrester Research, IDC, Iresearch, Korea National Statistics Office, Japanese Statistics Bureau, eMarketer, PhuCusWright, TIA.org, Jupiter, company reports, J.P. Morgan estimates.

56
Global Equity Research 04 January 2010
Imran Khan (1-212) 622-6693 [email protected]
Internet Sales Tax: Mostly Headline Risk In 2008, the state of New York began requiring online retailers to collect sales taxes even if they had no physical presence in the state, so long as members of their affiliate networks (who get paid a commission for driving sales traffic to the site) are present in the state.
Several companies, notably Amazon, have started collecting the NY sales tax while appealing the ruling. Overstock.com, on the other hand, has chosen to drop its NY-based affiliates and not charge the tax.
In 2009, several other states, including North Carolina and Rhode Island, took similar steps. As a result, Amazon ended its affiliate relationships in those states. Other states, including most significantly California, ended up choosing not to enact similar sales tax changes.
In all, we believe the impact of such laws is limited, especially on a site like Amazon, which focuses on offering consumer value rather than the lowest available price. We think the lower transparency of sales taxes, which are not visible until the checkout screen, limits the impact on sales revenue in those states where a sales tax is charged.
Third-Party Platforms Proliferating eBay was the original model for a successful third-party platform, with the company taking on no inventory but providing a meeting place for sellers and buyers. Over time, Amazon has gained on eBay, and now over 30% of the units sold on Amazon’s sites are sold by third-party sellers. In 2009, we saw Wal-Mart begin making an effort to expand its third-party capacity. We think these developments are emblematic of a secular shift toward a multi-channel world.
Multi-channel Whereas in the past, eBay was the primary avenue for an online business to move merchandize, we now operate in a world where sellers put their inventory on eBay—but then also on Amazon (and perhaps Wal-Mart as its stable of sellers grows), as well as their own sites, making greater use of comparison shopping engines and search engines to drive traffic.
Getting Third Party Right Is Hard In our opinion, a significant portion of Amazon’s success in growing its third-party business has been driven by a focus on the customer experience. While maintaining a positive experience is challenging for all online sellers, we think a third-party business—where a smaller seller is often piggybacking on the reputation of a larger one—is especially fraught with complications.
Key Differentiator: FBA One factor differentiating Amazon’s third-party offering is Fulfillment by Amazon, a program that lets sellers on Amazon have their items stored and shipped by the company, thereby making them eligible for Amazon Prime and for Super-saver shipping. Additionally, the shipping rates for third-party sellers (not using FBA) on Amazon’s site are largely standardized, depending on the type of product.

57
Global Equity Research 04 January 2010
Imran Khan (1-212) 622-6693 [email protected]
Reducing Frictions Is a Key Driver of Success We think part of the success of Amazon in gaining market share in recent years has been driven by a focus on reducing frictions in eCommerce, with a focus on providing customers with a seamless user experience. We see several drivers that sites can use to reduce frictions:
• Free shipping. The growing prevalence of free shipping offers (usually with a spending threshold) is an indication that sellers see this as a key tool in their arsenal. Additionally, as noted in the figure below, orders with free shipping tend to carry a higher average order value. Finally, we see the success of Zappos, with a very customer-friendly shipping and returns policy, as an indication of the way a site can benefit from reduced shipping-related friction.
Figure 28: Free Shipping Gaining Penetration and Driving Higher AOV
$113 $120 $115 $116 $114 $104 $106$86 $88 $91 $96 $87 $88 $90
31% 34% 35% 38% 37%43% 42%
$0
$50
$100
$150
1Q'08 2Q'08 3Q'08 4Q'08 1Q'09 2Q'09 3Q'09
0%
10%
20%
30%
40%
50%
AOV w / free shipping AOV w / paid shipping % of transactions w ith free shipping
Source: comScore.
• Easier payment. Tools such as PayPal, and especially PayPal Express Checkout (which allows a customer to pay with only their email address and password, without needing to re-enter data such as shipping/billing address and a credit card number), speed up the checkout process and thus reduce friction. [PayPal Express Checkout allows this, PayPal doesn’t]
• Giving the customer what they want. Another tool available to retailers is better merchandizing, through personalized recommendations. We think recommendation engines—as well as other optimization and testing tools—will continue to be a driver of incremental sales.
Catalysts for International Growth We believe the rising tide of increased internet use across the world is likely to help lift eCommerce globally. However, we see three key challenges to overcome for eCommerce to fulfill its potential:
• Improvement of shipping infrastructure. Postal and parcel service in many parts of the world can be unreliable, and a reliable distribution channel is an essential prerequisite for the growth of eCommerce.
• Improved payment systems. This is not a world-wide challenge, but rather a slew of country-specific challenges related to the idiosyncrasies of
58
Global Equity Research 04 January 2010
Imran Khan (1-212) 622-6693 [email protected]
different countries’ banking systems and conventions. Even in more developed countries, significant differences emerge: e.g., Germany and Austria have historically seen lower rates of PayPal use than other eBay geographies due to the prevalence of bank transfers as a mode of payment there; likewise Korea has an idiosyncratic payment culture that prevents high PayPal penetration.
• Better fraud protection. The promise of eCommerce has been one of lower prices and/or better selection, with the trade-off that many purchases must be made sight-unseen. The threat of fraud remains present, and structures that insure buyers against fraud should help smooth operations in an eCommerce environment that is not yet fully mature. (An example is eBay’s PayPal, which has, over the course of the past year, augmented the level of fraud protection it provides in the US, from $2K per transaction to as much as the full purchase price of the transaction. PayPal uses such protection to create buyer confidence, with transaction loss rates for the PayPal unit of 24-33 bps, as denominated by total payment volume).
We note that the above is not intended to be an exhaustive list of catalysts for international growth – many specific markets can present unique challenges – such as governmental ones – for the operation of eCommerce companies.
As eCommerce Matures, Private Labels Could Help Margins Private label items accounted for 16.9% of sales at US mass, food and drug retailers in the 52 weeks ended July 11, 2009. The share represented a ~70 bps increase over the prior year, according to Nielsen data.
Chris Horvers, J.P. Morgan’s Hardlines Retail analyst, estimates that private label products account for approximately 25% of sales at retail office superstores (e.g., Staples or Office Depot) , and 10%-15% at a large consumer electronics or home improvement retailer (e.g., Best Buy, Home Depot or Lowe’s).
In the past, few online-only retailers have had the scale to bring private-label products to market. However, as the industry matures and as more and more eRetailers start to attain significant sales volumes, we expect them to look at private label as an additional margin lever. Already, Amazon is offering private-label goods in certain home categories as well as connector cables and recordable media.
Drivers of Private Label Growth Several factors can drive growth of private label offerings for traditional retailers; as shown below, some of these have a higher relevance to online sellers than others.
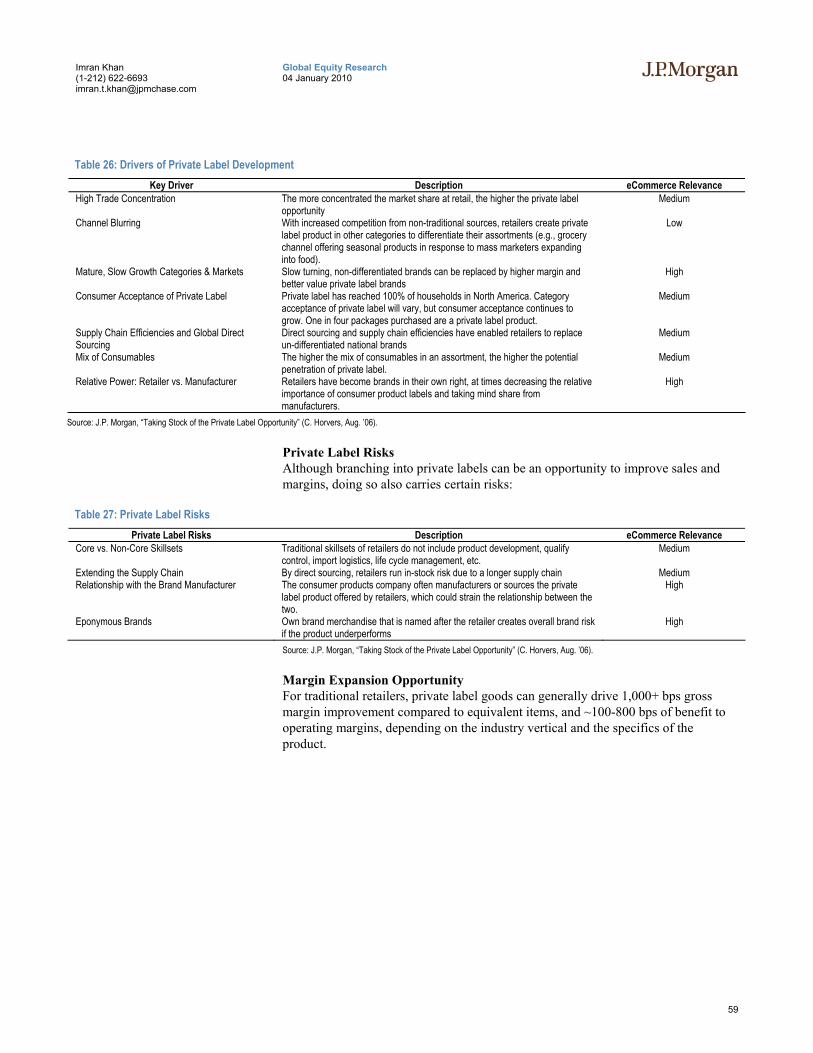
59
Global Equity Research 04 January 2010
Imran Khan (1-212) 622-6693 [email protected]
Table 26: Drivers of Private Label Development Key Driver Description eCommerce Relevance
High Trade Concentration The more concentrated the market share at retail, the higher the private label opportunity
Medium
Channel Blurring With increased competition from non-traditional sources, retailers create private label product in other categories to differentiate their assortments (e.g., grocery channel offering seasonal products in response to mass marketers expanding into food).
Low
Mature, Slow Growth Categories & Markets Slow turning, non-differentiated brands can be replaced by higher margin and better value private label brands
High
Consumer Acceptance of Private Label Private label has reached 100% of households in North America. Category acceptance of private label will vary, but consumer acceptance continues to grow. One in four packages purchased are a private label product.
Medium
Supply Chain Efficiencies and Global Direct Sourcing
Direct sourcing and supply chain efficiencies have enabled retailers to replace un-differentiated national brands
Medium
Mix of Consumables The higher the mix of consumables in an assortment, the higher the potential penetration of private label.
Medium
Relative Power: Retailer vs. Manufacturer Retailers have become brands in their own right, at times decreasing the relative importance of consumer product labels and taking mind share from manufacturers.
High
Source: J.P. Morgan, “Taking Stock of the Private Label Opportunity” (C. Horvers, Aug. ’06).
Private Label Risks Although branching into private labels can be an opportunity to improve sales and margins, doing so also carries certain risks:
Table 27: Private Label Risks Private Label Risks Description eCommerce Relevance
Core vs. Non-Core Skillsets Traditional skillsets of retailers do not include product development, qualify control, import logistics, life cycle management, etc.
Medium
Extending the Supply Chain By direct sourcing, retailers run in-stock risk due to a longer supply chain Medium Relationship with the Brand Manufacturer The consumer products company often manufacturers or sources the private
label product offered by retailers, which could strain the relationship between the two.
High
Eponymous Brands Own brand merchandise that is named after the retailer creates overall brand risk if the product underperforms
High
Source: J.P. Morgan, “Taking Stock of the Private Label Opportunity” (C. Horvers, Aug. ’06).
Margin Expansion Opportunity For traditional retailers, private label goods can generally drive 1,000+ bps gross margin improvement compared to equivalent items, and ~100-800 bps of benefit to operating margins, depending on the industry vertical and the specifics of the product.
60
Global Equity Research 04 January 2010
Imran Khan (1-212) 622-6693 [email protected]
2010 Online Payment Outlook Following on the back of a strong 2008, online payment platforms continued to perform well in 2009. PayPal remains the runaway leader, with 14% growth in Total Payment Volume and 12% growth in revenue despite the global slowdown in eCommerce and despite the softness in eBay’s core business. In Latin America, Mercadolibre’s payment business, MercadoPago, saw a hiccup in volume growth in the first part of the year due to higher interest rates, followed by a return to growth starting in 3Q, and the company plans to incorporate the service into its Marketplace for no additional charge, which we believe should provide a boost to growth.
1. We Expect Alternative Payments to Outgrow eCommerce We expect growth in alternative online payments to continue in 2010, helped by:
• Continued global e-commerce growth, helped by increased global broadband penetration;
• The growing acceptance of online payment solutions on third-party platforms, including travel sites;
• Consumers’ hunger for simpler, one-click shopping experiences;
• Traditional credit card companies’ lack of direct access to the consumer market;
• In Europe, challenges in using PIN-authenticated credit cards for online payment;
• Increased use of mobile money transfer platforms helping drive revenues for those with a presence in the market, such as PayPal and Amazon Payment (through its relationship with Textpayme); and
• Increased fee generation from deferred payment plan options, which are particularly attractive in developing markets.
At the same time, we see several challenges to the Payment space, which may cloud the outlook somewhat.
• Although we expect eCommerce to continue to win wallet share from offline shopping, the challenging macro environment could continue to put somewhat of a brake on growth.
• A credit environment that remains chilly may likewise dampen the growth in the segment derived from improved financing options.
2. US Strategies May Not Work in Emerging Markets Online payment providers in developed markets tend to focus on offering alternatives to the established payment infrastructure. One notable trend is a greater reliance on the escrow format (to address issues of trust); several of MercadoPago’s geographies, as well as Alipay, operate on an escrow principle.
Secondly, both MercadoPago and Alipay are focusing on providing their service free of charge, with the payment processing cost implicitly incorporated into the cost of their respective Marketplace partners. We don’t believe there is a strategic silver bullet for growing payment systems in emerging markets, but we do expect the space to continue evolving.
61
Global Equity Research 04 January 2010
Imran Khan (1-212) 622-6693 [email protected]
3. More Competition from Traditional Payment Networks We think the strong and continued growth of PayPal has been a rude awakening for the incumbent players in the payment space. As such, we expect them to be more aggressive in defending their market share online. We think a key block for many of the incumbent players (esp. Visa and MasterCard) is their lack of a direct relationship with consumers, as the big networks are brands that have historically had stronger relationships with issuers than cardholders.
Some initiatives from the existing players include:
• Visa’s Right Cliq is a product that allows consumers to create a universal wish list, and is intended to simplify comparison shopping, as well as possibly allow merchants or issuers to offer discounts or coupons. The company announced the initiative on its 4Q’09 conference call.
• MasterCard SecureCode is a tool that allows users to set an additional level of protection for their MasterCard, and then uses a user-specified PIN to authorize transactions at online merchants that are set up to accept the product.
• American Express acquired Revolution Money, a provider of C2C payment solutions. We expect AmEx to use the acquisition to expand its offerings within online payment, although the precise way the acquisition will fit into the company’s portfolio is somewhat uncertain.
• Both Discover and MasterCard have used promotional tools to drive users to shop online using those cards. E.g., Discover has offered $10 discounts for Amazon users purchasing certain consumer electronics during the holiday season, while MasterCard offered a $10 Amazon MP3 promotion as an incentive to make qualified MasterCard purchases.
• Minimal short-term impact on PayPal. We think many of these initiatives are of a strategic nature and thus will take some time to play out. As such, we do not expect a material impact on PayPal in the near term.
4. Getting Micropayments Right Could Be a Catalyst One of the challenges in monetizing content websites, social networks, casual games, and a variety of similar sites, is that the price users may be willing to pay tends to be quite small. However, the credit card ecosystem is not, at present, designed to manage small payments, and merchants pay significantly more for payment processing if all the payments they process are in the sub-$5 range.
We see several factors that lead us to expect progress in micropayments:
• PayPal X. PayPal has opened its system to developers, broadening the number of people working to improve the online payment landscape. Improved micropayment platforms were among the targeted areas of development.
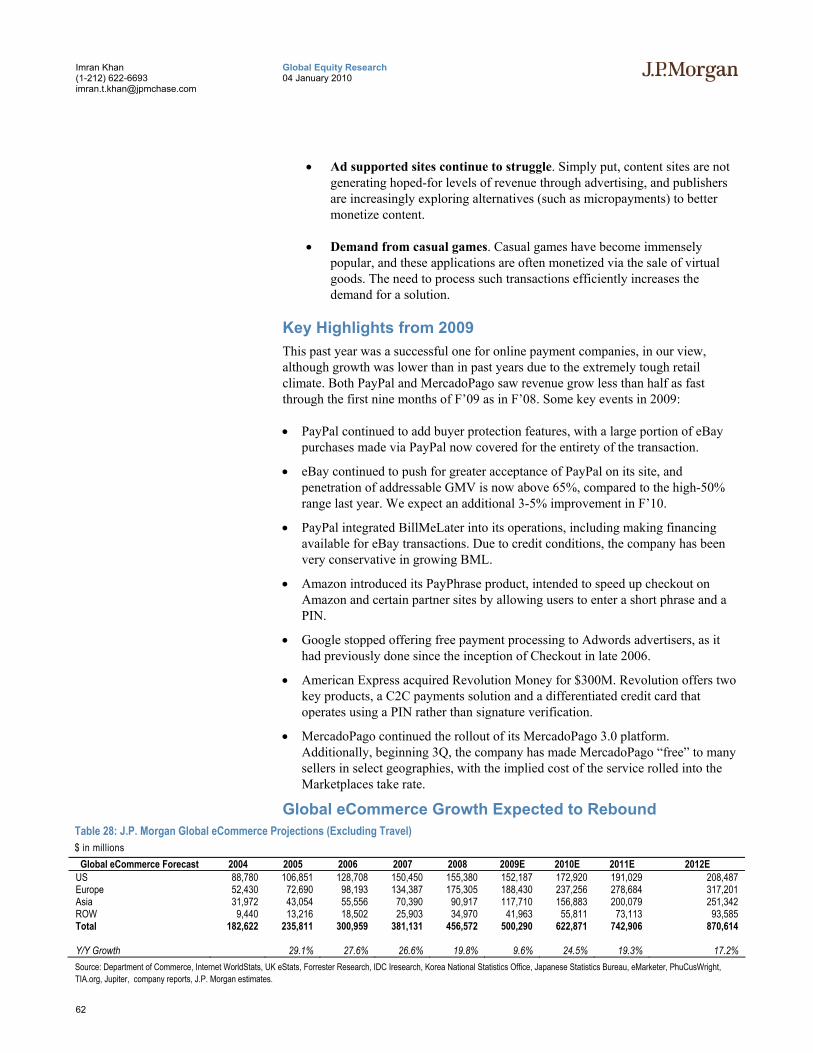
62
Global Equity Research 04 January 2010
Imran Khan (1-212) 622-6693 [email protected]
• Ad supported sites continue to struggle. Simply put, content sites are not generating hoped-for levels of revenue through advertising, and publishers are increasingly exploring alternatives (such as micropayments) to better monetize content.
• Demand from casual games. Casual games have become immensely popular, and these applications are often monetized via the sale of virtual goods. The need to process such transactions efficiently increases the demand for a solution.
Key Highlights from 2009 This past year was a successful one for online payment companies, in our view, although growth was lower than in past years due to the extremely tough retail climate. Both PayPal and MercadoPago saw revenue grow less than half as fast through the first nine months of F’09 as in F’08. Some key events in 2009:
• PayPal continued to add buyer protection features, with a large portion of eBay purchases made via PayPal now covered for the entirety of the transaction.
• eBay continued to push for greater acceptance of PayPal on its site, and penetration of addressable GMV is now above 65%, compared to the high-50% range last year. We expect an additional 3-5% improvement in F’10.
• PayPal integrated BillMeLater into its operations, including making financing available for eBay transactions. Due to credit conditions, the company has been very conservative in growing BML.
• Amazon introduced its PayPhrase product, intended to speed up checkout on Amazon and certain partner sites by allowing users to enter a short phrase and a PIN.
• Google stopped offering free payment processing to Adwords advertisers, as it had previously done since the inception of Checkout in late 2006.
• American Express acquired Revolution Money for $300M. Revolution offers two key products, a C2C payments solution and a differentiated credit card that operates using a PIN rather than signature verification.
• MercadoPago continued the rollout of its MercadoPago 3.0 platform. Additionally, beginning 3Q, the company has made MercadoPago “free” to many sellers in select geographies, with the implied cost of the service rolled into the Marketplaces take rate.
Global eCommerce Growth Expected to Rebound Table 28: J.P. Morgan Global eCommerce Projections (Excluding Travel) $ in millions
Global eCommerce Forecast 2004 2005 2006 2007 2008 2009E 2010E 2011E 2012E US 88,780 106,851 128,708 150,450 155,380 152,187 172,920 191,029 208,487 Europe 52,430 72,690 98,193 134,387 175,305 188,430 237,256 278,684 317,201 Asia 31,972 43,054 55,556 70,390 90,917 117,710 156,883 200,079 251,342 ROW 9,440 13,216 18,502 25,903 34,970 41,963 55,811 73,113 93,585 Total 182,622 235,811 300,959 381,131 456,572 500,290 622,871 742,906 870,614
Y/Y Growth 29.1% 27.6% 26.6% 19.8% 9.6% 24.5% 19.3% 17.2% Source: Department of Commerce, Internet WorldStats, UK eStats, Forrester Research, IDC Iresearch, Korea National Statistics Office, Japanese Statistics Bureau, eMarketer, PhuCusWright, TIA.org, Jupiter, company reports, J.P. Morgan estimates.
63
Global Equity Research 04 January 2010
Imran Khan (1-212) 622-6693 [email protected]
Payment Business Basics When a buyer hands cash to a seller, the transaction is self-contained. If a credit (or debit) card is involved, however, several other parties become involved in the transaction, which we describe below:
• Issuer (Cardholder’s Bank). Card transactions start with a card issued by an issuing bank (e.g., Bank of America, Chase, etc.) to a consumer. In terms of economics, the bank that issued the consumer’s credit card takes the purchase price, collects its interchange fee (in the US, ~170 -225 bps, depending on the type of card), and passes the remainder to the…
• Acquirer (Commonly the Merchant’s Bank). The acquirer provides merchant services to the merchant, handling all the card and/or electronic payment acceptance needs of the merchant. The merchant’s acquiring bank accepts the payment, collects a merchant discount (generally in the 30-50 bps range in the US), and forwards the balance to the seller/merchant. Both the Issuer and the Acquirer pay a small (~7-9 bps each) fee to the Payment Network (see next entry). Merchant acquirer functions include:
• Signing up merchants to enable them to accept card payments;
• Enabling merchants to authorize card payments via the network;
• Paying all network and associated fees for a merchant’s transactions;
• Facilitating clearing and settlement of card payments; and
• Providing incremental services, e.g., sending out statements, etc.
• Payment Network (e.g., Visa, MasterCard). As the backbone to the payments industry, networks connect various banks that need to process credit card payments with merchants and provide authorization, clearing and settlement services. Networks also set rules and interchange rates (earned by the issuing bank).
• Payment Gateway. In the offline world, the payment gateway is the equivalent of a point-of-sale terminal that accepts the payment type (e.g., credit, debit card) and translates it into a format that can be accepted by the merchant acquirer. In the online world, the gateway generally connects an eCommerce site with the merchant acquirer. PayPal already functions as a Payment Gateway, largely as a result of its acquisition of VeriSign’s payment business, which had 144,000 customers when acquired in 4Q’05.
For a primer on the payments industry, please see Payment Processing: Payments Market Share Handbook published on June 5, 2009 by J.P. Morgan’s Computer Services & IT Consulting analyst, Tien-tsin Huang
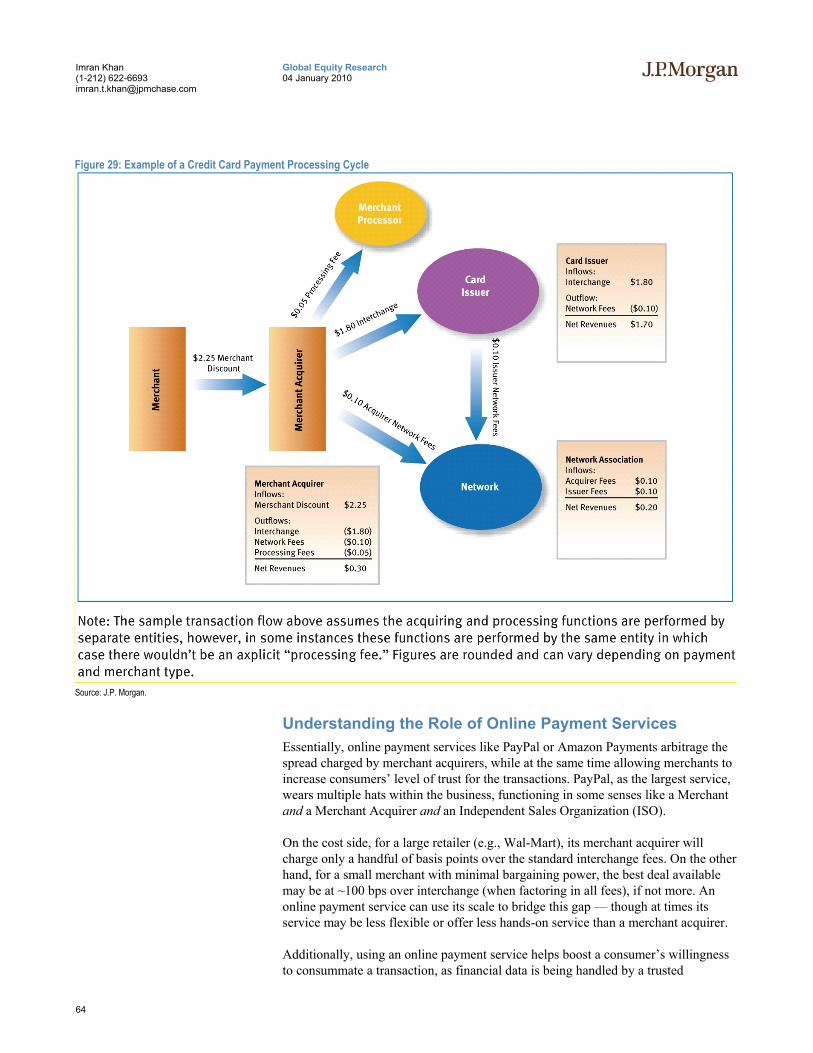
64
Global Equity Research 04 January 2010
Imran Khan (1-212) 622-6693 [email protected]
Figure 29: Example of a Credit Card Payment Processing Cycle
Source: J.P. Morgan.
Understanding the Role of Online Payment Services Essentially, online payment services like PayPal or Amazon Payments arbitrage the spread charged by merchant acquirers, while at the same time allowing merchants to increase consumers’ level of trust for the transactions. PayPal, as the largest service, wears multiple hats within the business, functioning in some senses like a Merchant and a Merchant Acquirer and an Independent Sales Organization (ISO).
On the cost side, for a large retailer (e.g., Wal-Mart), its merchant acquirer will charge only a handful of basis points over the standard interchange fees. On the other hand, for a small merchant with minimal bargaining power, the best deal available may be at ~100 bps over interchange (when factoring in all fees), if not more. An online payment service can use its scale to bridge this gap — though at times its service may be less flexible or offer less hands-on service than a merchant acquirer.
Additionally, using an online payment service helps boost a consumer’s willingness to consummate a transaction, as financial data is being handled by a trusted
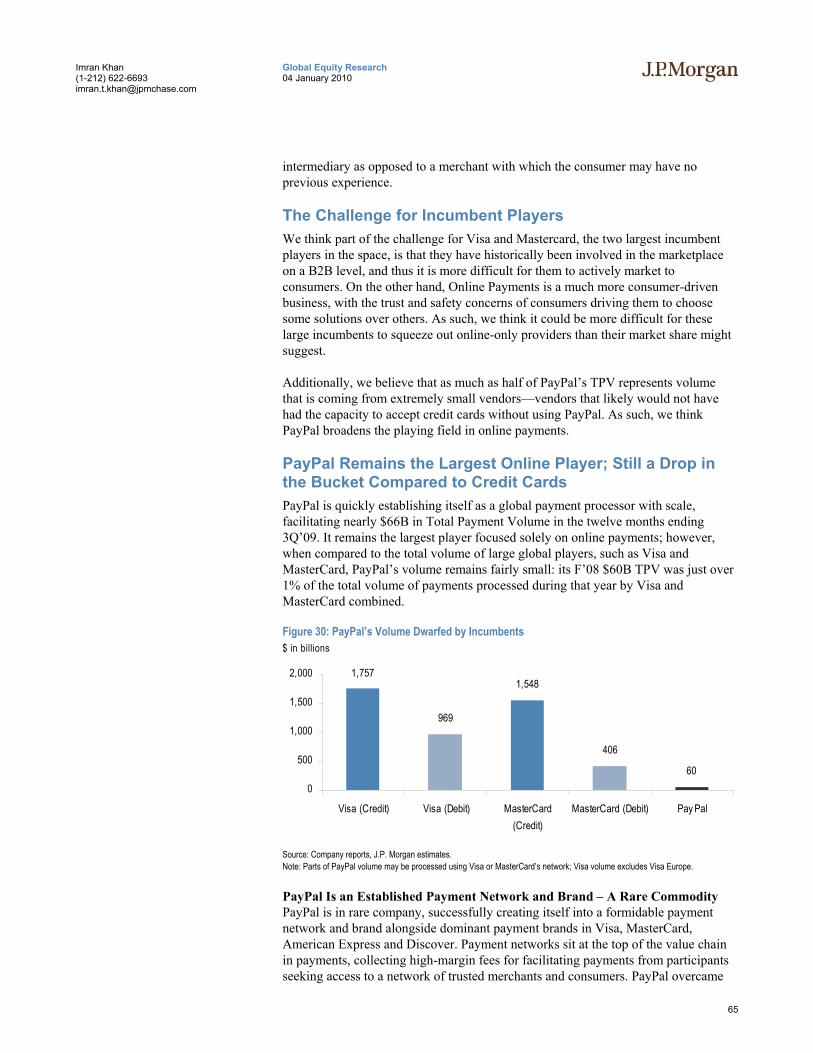
65
Global Equity Research 04 January 2010
Imran Khan (1-212) 622-6693 [email protected]
intermediary as opposed to a merchant with which the consumer may have no previous experience.
The Challenge for Incumbent Players We think part of the challenge for Visa and Mastercard, the two largest incumbent players in the space, is that they have historically been involved in the marketplace on a B2B level, and thus it is more difficult for them to actively market to consumers. On the other hand, Online Payments is a much more consumer-driven business, with the trust and safety concerns of consumers driving them to choose some solutions over others. As such, we think it could be more difficult for these large incumbents to squeeze out online-only providers than their market share might suggest.
Additionally, we believe that as much as half of PayPal’s TPV represents volume that is coming from extremely small vendors—vendors that likely would not have had the capacity to accept credit cards without using PayPal. As such, we think PayPal broadens the playing field in online payments.
PayPal Remains the Largest Online Player; Still a Drop in the Bucket Compared to Credit Cards PayPal is quickly establishing itself as a global payment processor with scale, facilitating nearly $66B in Total Payment Volume in the twelve months ending 3Q’09. It remains the largest player focused solely on online payments; however, when compared to the total volume of large global players, such as Visa and MasterCard, PayPal’s volume remains fairly small: its F’08 $60B TPV was just over 1% of the total volume of payments processed during that year by Visa and MasterCard combined.
Figure 30: PayPal’s Volume Dwarfed by Incumbents $ in billions
1,757
969
1,548
406
600
500
1,000
1,500
2,000
Visa (Credit) Visa (Debit) MasterCard(Credit)
MasterCard (Debit) Pay Pal
Source: Company reports, J.P. Morgan estimates. Note: Parts of PayPal volume may be processed using Visa or MasterCard’s network; Visa volume excludes Visa Europe.
PayPal Is an Established Payment Network and Brand – A Rare Commodity PayPal is in rare company, successfully creating itself into a formidable payment network and brand alongside dominant payment brands in Visa, MasterCard, American Express and Discover. Payment networks sit at the top of the value chain in payments, collecting high-margin fees for facilitating payments from participants seeking access to a network of trusted merchants and consumers. PayPal overcame

66
Global Equity Research 04 January 2010
Imran Khan (1-212) 622-6693 [email protected]
the classic chicken-and-egg dilemma and now has a critical mass of users in its network, differentiated as a trusted brand for facilitating online payments with the potential to extend its presence into offline opportunities longer term.
One driver of PayPal’s growth is that, unlike traditional payment methods that developed in an offline world and have been overlaid onto eCommerce, PayPal’s platform was built with eCommerce in mind. As such, PayPal has developed tools and risk management measures to address the unique complexities of handling card-not-present payments over the web – one of the fastest growth categories in payments. Moreover, in our view, PayPal is elegantly structured to simplify the web of connections required in a traditional payment system, making it well positioned to penetrate the small business payments market.
Figure 31: PayPal Simplifies the Payment Process
Source: J.P. Morgan.
We think the online marketplace, and sellers in particular, benefit from this simplification in several ways:
• Ease of Use. PayPal gives virtually anyone the capacity to accept payments, enabling a merchant to operate even at an initial scale that would otherwise be uneconomical (i.e., there are no minimum requirements for payment volume in order to use PayPal.)
• Higher Level of Trust. The payments system is not very transparent, and not all aspects were intended for mass use. A trusted central clearinghouse like PayPal can encourage use of online payments by lowering users’ safety concerns and raising their willingness to send money online.
PayPal Is Differentiated Beyond Just Online Commerce PayPal is different from other payment brands (e.g., MasterCard, Visa) in that it is a vertically integrated payment provider. In other words, PayPal is a single source provider of payment services. By contracting directly with PayPal Merchant Services, small merchants can get all of their payment needs and do not necessarily need a separate merchant bank account or payment gateway services provider.
PayPal is gradually expanding its presence off eBay by promoting itself as an integrated payment offering along side other payment brands (e.g., MasterCard, Visa), supported by PayPal’s own merchant services offering and alliances with payment vendors like CyberSource (payment gateway) and Chase Paymentech (largest merchant acquirer in the US).
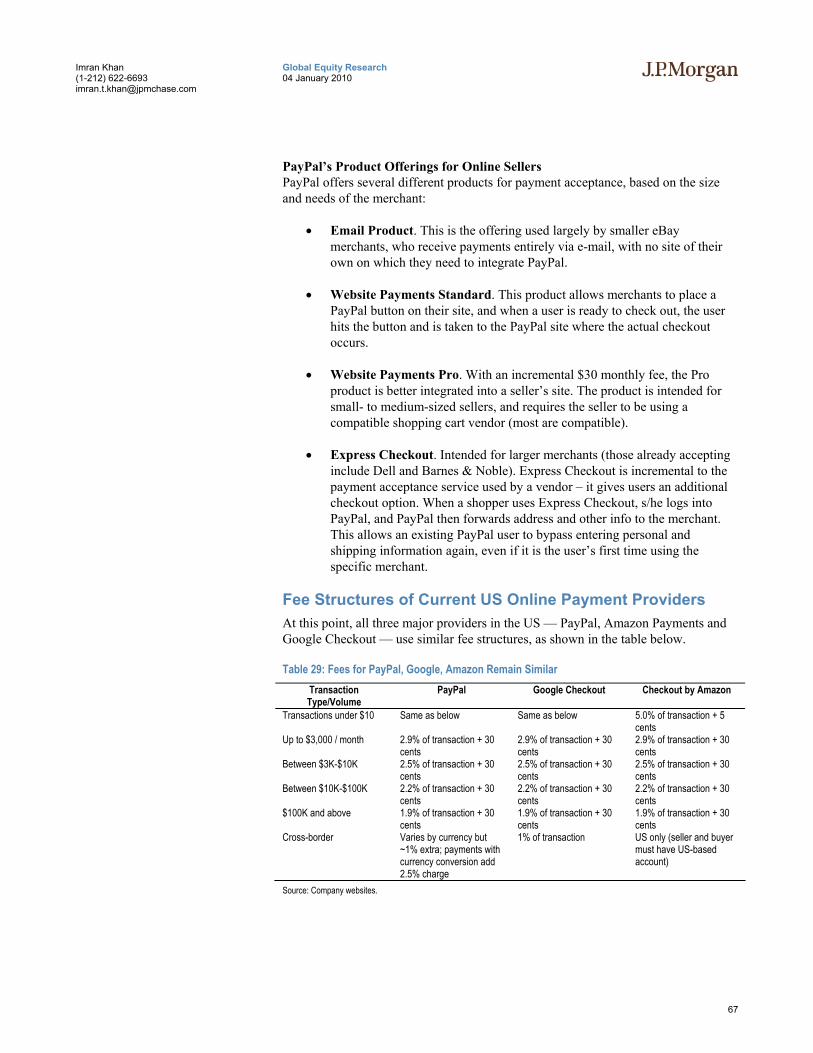
67
Global Equity Research 04 January 2010
Imran Khan (1-212) 622-6693 [email protected]
PayPal’s Product Offerings for Online Sellers PayPal offers several different products for payment acceptance, based on the size and needs of the merchant:
• Email Product. This is the offering used largely by smaller eBay merchants, who receive payments entirely via e-mail, with no site of their own on which they need to integrate PayPal.
• Website Payments Standard. This product allows merchants to place a PayPal button on their site, and when a user is ready to check out, the user hits the button and is taken to the PayPal site where the actual checkout occurs.
• Website Payments Pro. With an incremental $30 monthly fee, the Pro product is better integrated into a seller’s site. The product is intended for small- to medium-sized sellers, and requires the seller to be using a compatible shopping cart vendor (most are compatible).
• Express Checkout. Intended for larger merchants (those already accepting include Dell and Barnes & Noble). Express Checkout is incremental to the payment acceptance service used by a vendor – it gives users an additional checkout option. When a shopper uses Express Checkout, s/he logs into PayPal, and PayPal then forwards address and other info to the merchant. This allows an existing PayPal user to bypass entering personal and shipping information again, even if it is the user’s first time using the specific merchant.
Fee Structures of Current US Online Payment Providers At this point, all three major providers in the US — PayPal, Amazon Payments and Google Checkout — use similar fee structures, as shown in the table below.
Table 29: Fees for PayPal, Google, Amazon Remain Similar Transaction Type/Volume
PayPal Google Checkout Checkout by Amazon
Transactions under $10 Same as below Same as below 5.0% of transaction + 5 cents
Up to $3,000 / month 2.9% of transaction + 30 cents
2.9% of transaction + 30 cents
2.9% of transaction + 30 cents
Between $3K-$10K 2.5% of transaction + 30 cents
2.5% of transaction + 30 cents
2.5% of transaction + 30 cents
Between $10K-$100K 2.2% of transaction + 30 cents
2.2% of transaction + 30 cents
2.2% of transaction + 30 cents
$100K and above 1.9% of transaction + 30 cents
1.9% of transaction + 30 cents
1.9% of transaction + 30 cents
Cross-border Varies by currency but ~1% extra; payments with currency conversion add 2.5% charge
1% of transaction US only (seller and buyer must have US-based account)
Source: Company websites.
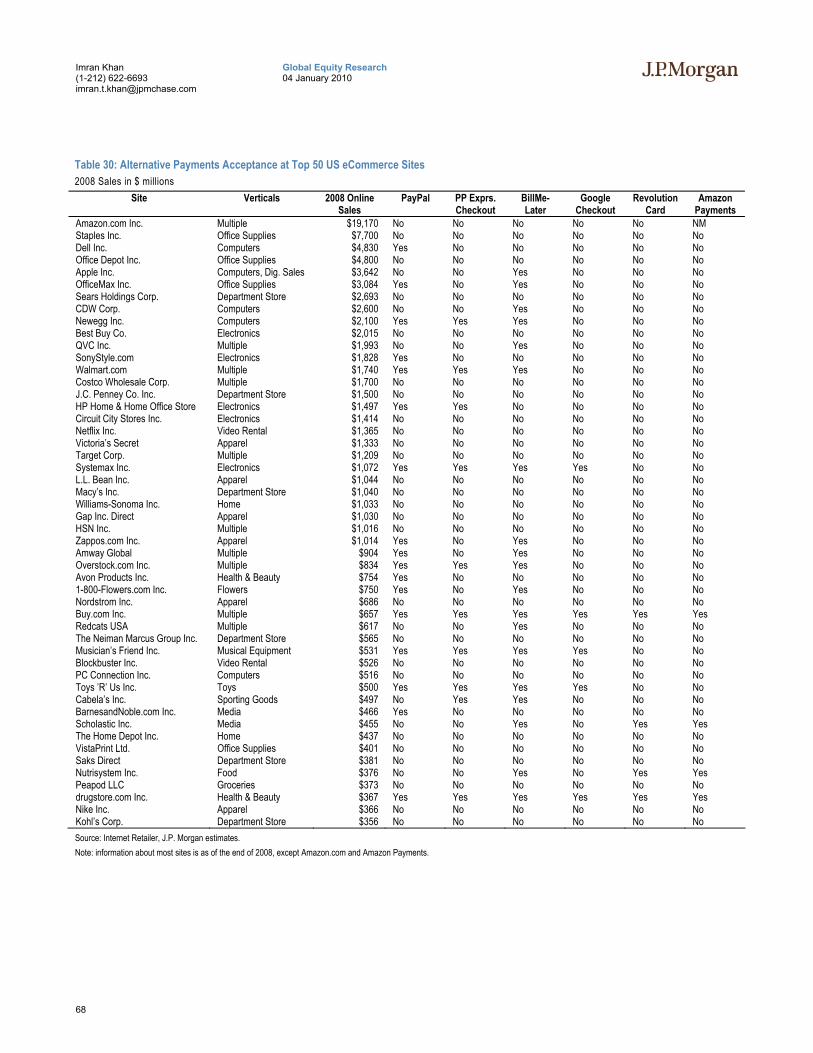
68
Global Equity Research 04 January 2010
Imran Khan (1-212) 622-6693 [email protected]
Table 30: Alternative Payments Acceptance at Top 50 US eCommerce Sites 2008 Sales in $ millions
Site Verticals 2008 Online Sales
PayPal PP Exprs. Checkout
BillMe- Later
Google Checkout
Revolution Card
Amazon Payments
Amazon.com Inc. Multiple $19,170 No No No No No NM Staples Inc. Office Supplies $7,700 No No No No No No Dell Inc. Computers $4,830 Yes No No No No No Office Depot Inc. Office Supplies $4,800 No No No No No No Apple Inc. Computers, Dig. Sales $3,642 No No Yes No No No OfficeMax Inc. Office Supplies $3,084 Yes No Yes No No No Sears Holdings Corp. Department Store $2,693 No No No No No No CDW Corp. Computers $2,600 No No Yes No No No Newegg Inc. Computers $2,100 Yes Yes Yes No No No Best Buy Co. Electronics $2,015 No No No No No No QVC Inc. Multiple $1,993 No No Yes No No No SonyStyle.com Electronics $1,828 Yes No No No No No Walmart.com Multiple $1,740 Yes Yes Yes No No No Costco Wholesale Corp. Multiple $1,700 No No No No No No J.C. Penney Co. Inc. Department Store $1,500 No No No No No No HP Home & Home Office Store Electronics $1,497 Yes Yes No No No No Circuit City Stores Inc. Electronics $1,414 No No No No No No Netflix Inc. Video Rental $1,365 No No No No No No Victoria’s Secret Apparel $1,333 No No No No No No Target Corp. Multiple $1,209 No No No No No No Systemax Inc. Electronics $1,072 Yes Yes Yes Yes No No L.L. Bean Inc. Apparel $1,044 No No No No No No Macy’s Inc. Department Store $1,040 No No No No No No Williams-Sonoma Inc. Home $1,033 No No No No No No Gap Inc. Direct Apparel $1,030 No No No No No No HSN Inc. Multiple $1,016 No No No No No No Zappos.com Inc. Apparel $1,014 Yes No Yes No No No Amway Global Multiple $904 Yes No Yes No No No Overstock.com Inc. Multiple $834 Yes Yes Yes No No No Avon Products Inc. Health & Beauty $754 Yes No No No No No 1-800-Flowers.com Inc. Flowers $750 Yes No Yes No No No Nordstrom Inc. Apparel $686 No No No No No No Buy.com Inc. Multiple $657 Yes Yes Yes Yes Yes Yes Redcats USA Multiple $617 No No Yes No No No The Neiman Marcus Group Inc. Department Store $565 No No No No No No Musician’s Friend Inc. Musical Equipment $531 Yes Yes Yes Yes No No Blockbuster Inc. Video Rental $526 No No No No No No PC Connection Inc. Computers $516 No No No No No No Toys ’R’ Us Inc. Toys $500 Yes Yes Yes Yes No No Cabela’s Inc. Sporting Goods $497 No Yes Yes No No No BarnesandNoble.com Inc. Media $466 Yes No No No No No Scholastic Inc. Media $455 No No Yes No Yes Yes The Home Depot Inc. Home $437 No No No No No No VistaPrint Ltd. Office Supplies $401 No No No No No No Saks Direct Department Store $381 No No No No No No Nutrisystem Inc. Food $376 No No Yes No Yes Yes Peapod LLC Groceries $373 No No No No No No drugstore.com Inc. Health & Beauty $367 Yes Yes Yes Yes Yes Yes Nike Inc. Apparel $366 No No No No No No Kohl’s Corp. Department Store $356 No No No No No No Source: Internet Retailer, J.P. Morgan estimates. Note: information about most sites is as of the end of 2008, except Amazon.com and Amazon Payments.
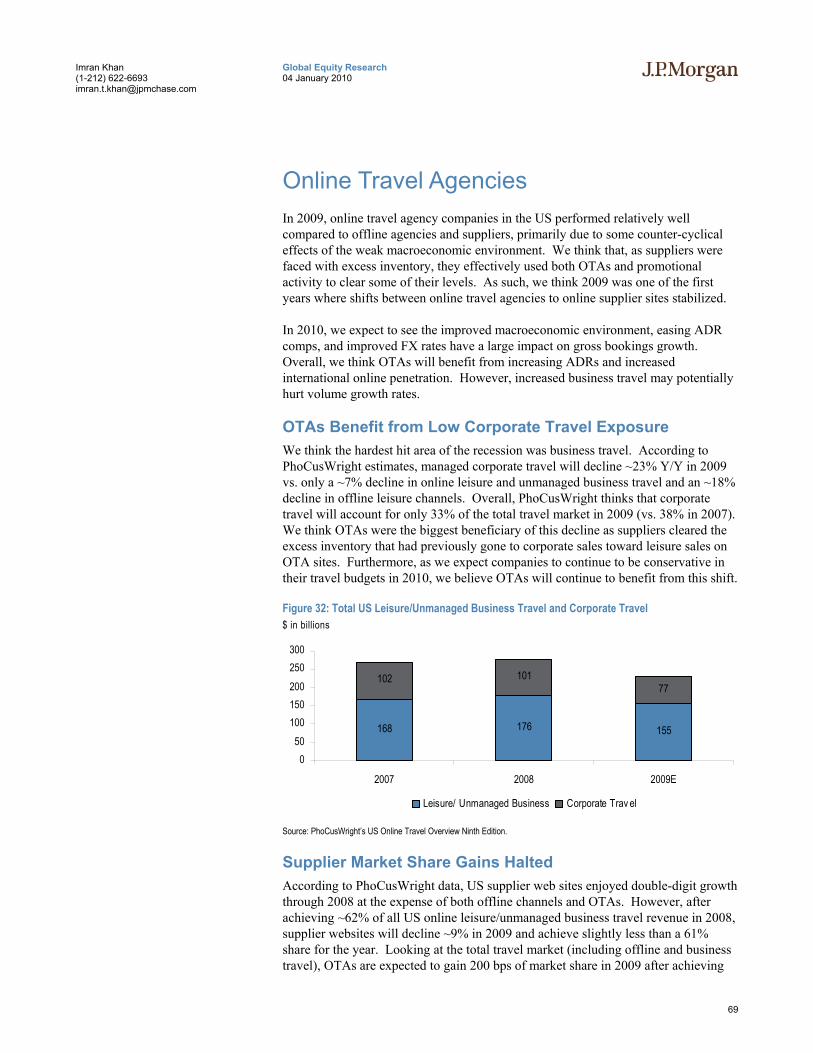
69
Global Equity Research 04 January 2010
Imran Khan (1-212) 622-6693 [email protected]
Online Travel Agencies In 2009, online travel agency companies in the US performed relatively well compared to offline agencies and suppliers, primarily due to some counter-cyclical effects of the weak macroeconomic environment. We think that, as suppliers were faced with excess inventory, they effectively used both OTAs and promotional activity to clear some of their levels. As such, we think 2009 was one of the first years where shifts between online travel agencies to online supplier sites stabilized.
In 2010, we expect to see the improved macroeconomic environment, easing ADR comps, and improved FX rates have a large impact on gross bookings growth. Overall, we think OTAs will benefit from increasing ADRs and increased international online penetration. However, increased business travel may potentially hurt volume growth rates.
OTAs Benefit from Low Corporate Travel Exposure We think the hardest hit area of the recession was business travel. According to PhoCusWright estimates, managed corporate travel will decline ~23% Y/Y in 2009 vs. only a ~7% decline in online leisure and unmanaged business travel and an ~18% decline in offline leisure channels. Overall, PhoCusWright thinks that corporate travel will account for only 33% of the total travel market in 2009 (vs. 38% in 2007). We think OTAs were the biggest beneficiary of this decline as suppliers cleared the excess inventory that had previously gone to corporate sales toward leisure sales on OTA sites. Furthermore, as we expect companies to continue to be conservative in their travel budgets in 2010, we believe OTAs will continue to benefit from this shift.
Figure 32: Total US Leisure/Unmanaged Business Travel and Corporate Travel $ in billions
168 176 155
102 10177
050
100150200250300
2007 2008 2009E
Leisure/ Unmanaged Business Corporate Trav el
Source: PhoCusWright’s US Online Travel Overview Ninth Edition.
Supplier Market Share Gains Halted According to PhoCusWright data, US supplier web sites enjoyed double-digit growth through 2008 at the expense of both offline channels and OTAs. However, after achieving ~62% of all US online leisure/unmanaged business travel revenue in 2008, supplier websites will decline ~9% in 2009 and achieve slightly less than a 61% share for the year. Looking at the total travel market (including offline and business travel), OTAs are expected to gain 200 bps of market share in 2009 after achieving
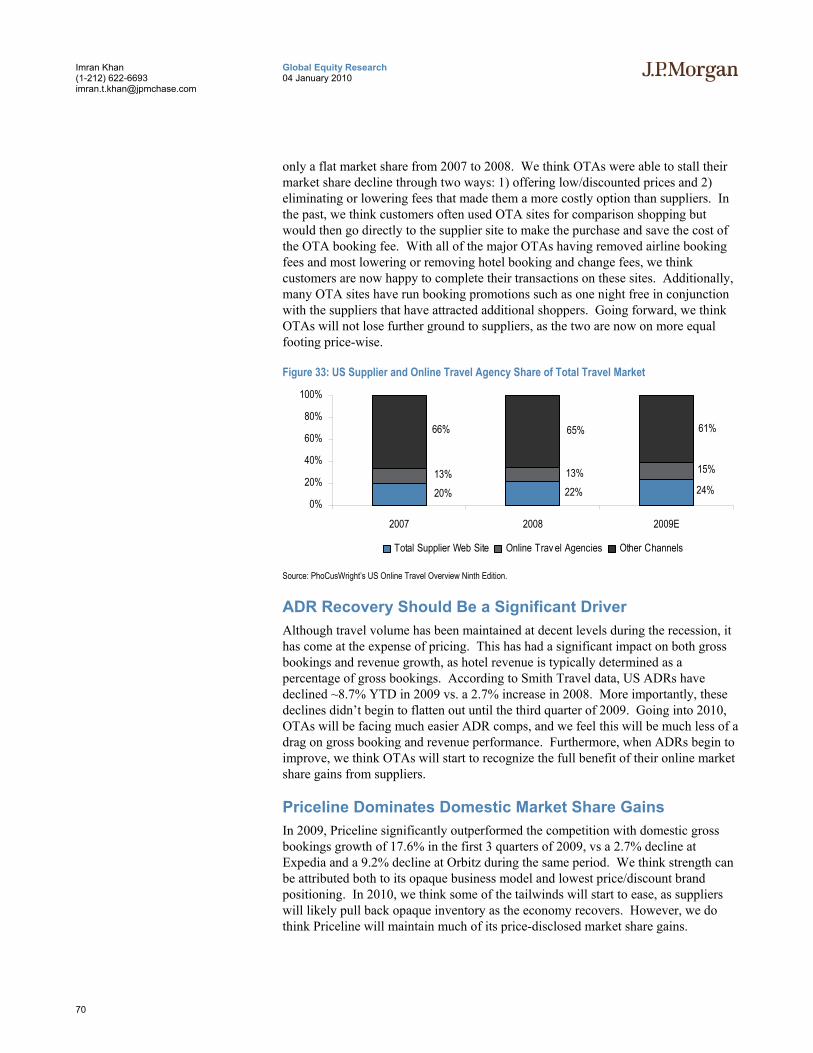
70
Global Equity Research 04 January 2010
Imran Khan (1-212) 622-6693 [email protected]
only a flat market share from 2007 to 2008. We think OTAs were able to stall their market share decline through two ways: 1) offering low/discounted prices and 2) eliminating or lowering fees that made them a more costly option than suppliers. In the past, we think customers often used OTA sites for comparison shopping but would then go directly to the supplier site to make the purchase and save the cost of the OTA booking fee. With all of the major OTAs having removed airline booking fees and most lowering or removing hotel booking and change fees, we think customers are now happy to complete their transactions on these sites. Additionally, many OTA sites have run booking promotions such as one night free in conjunction with the suppliers that have attracted additional shoppers. Going forward, we think OTAs will not lose further ground to suppliers, as the two are now on more equal footing price-wise.
Figure 33: US Supplier and Online Travel Agency Share of Total Travel Market
24%22%20%
15%13%13%
61%65%66%
0%
20%
40%
60%
80%
100%
2007 2008 2009E
Total Supplier Web Site Online Trav el Agencies Other Channels
Source: PhoCusWright’s US Online Travel Overview Ninth Edition.
ADR Recovery Should Be a Significant Driver Although travel volume has been maintained at decent levels during the recession, it has come at the expense of pricing. This has had a significant impact on both gross bookings and revenue growth, as hotel revenue is typically determined as a percentage of gross bookings. According to Smith Travel data, US ADRs have declined ~8.7% YTD in 2009 vs. a 2.7% increase in 2008. More importantly, these declines didn’t begin to flatten out until the third quarter of 2009. Going into 2010, OTAs will be facing much easier ADR comps, and we feel this will be much less of a drag on gross booking and revenue performance. Furthermore, when ADRs begin to improve, we think OTAs will start to recognize the full benefit of their online market share gains from suppliers.
Priceline Dominates Domestic Market Share Gains In 2009, Priceline significantly outperformed the competition with domestic gross bookings growth of 17.6% in the first 3 quarters of 2009, vs a 2.7% decline at Expedia and a 9.2% decline at Orbitz during the same period. We think strength can be attributed both to its opaque business model and lowest price/discount brand positioning. In 2010, we think some of the tailwinds will start to ease, as suppliers will likely pull back opaque inventory as the economy recovers. However, we do think Priceline will maintain much of its price-disclosed market share gains.
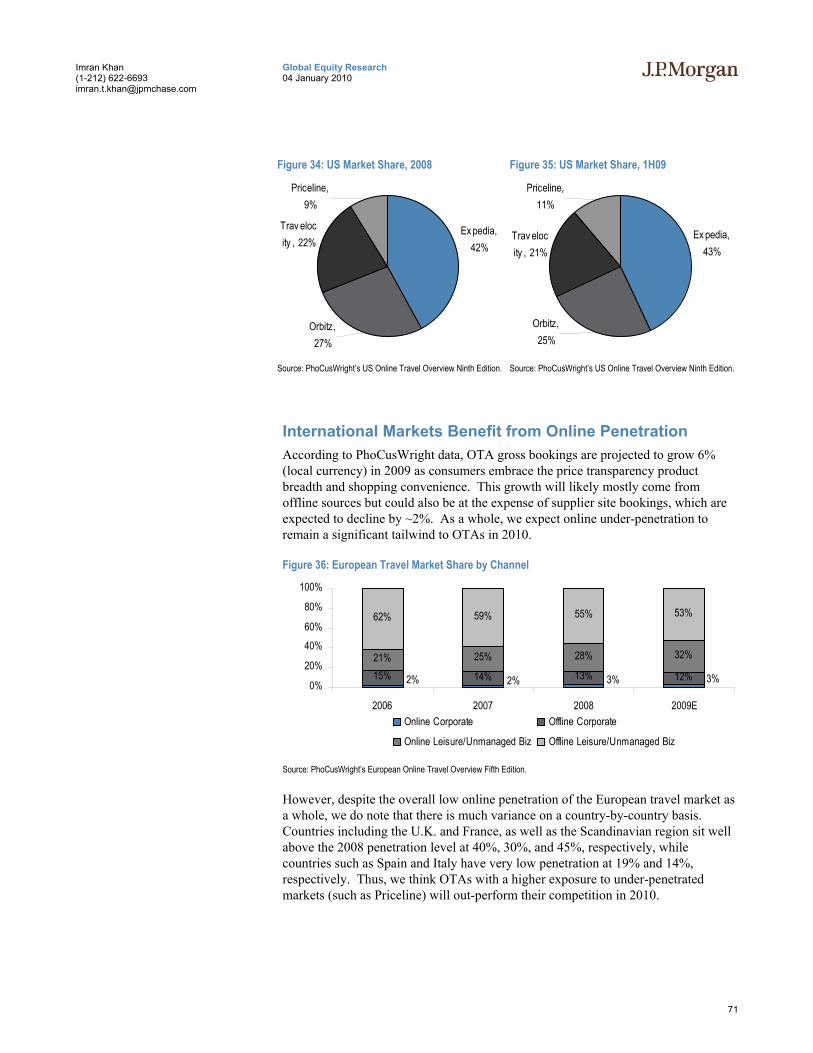
71
Global Equity Research 04 January 2010
Imran Khan (1-212) 622-6693 [email protected]
Figure 34: US Market Share, 2008
Ex pedia, 42%
Trav elocity , 22%
Priceline, 9%
Orbitz, 27%
Source: PhoCusWright’s US Online Travel Overview Ninth Edition.
Figure 35: US Market Share, 1H09
Ex pedia, 43%
Trav elocity , 21%
Orbitz, 25%
Priceline, 11%
Source: PhoCusWright’s US Online Travel Overview Ninth Edition.
International Markets Benefit from Online Penetration According to PhoCusWright data, OTA gross bookings are projected to grow 6% (local currency) in 2009 as consumers embrace the price transparency product breadth and shopping convenience. This growth will likely mostly come from offline sources but could also be at the expense of supplier site bookings, which are expected to decline by ~2%. As a whole, we expect online under-penetration to remain a significant tailwind to OTAs in 2010.
Figure 36: European Travel Market Share by Channel
15% 14% 13% 12%21% 25% 28% 32%
62% 59% 55% 53%
3%2% 2% 3%0%
20%
40%60%
80%
100%
2006 2007 2008 2009EOnline Corporate Offline Corporate
Online Leisure/Unmanaged Biz Offline Leisure/Unmanaged Biz
Source: PhoCusWright’s European Online Travel Overview Fifth Edition.
However, despite the overall low online penetration of the European travel market as a whole, we do note that there is much variance on a country-by-country basis. Countries including the U.K. and France, as well as the Scandinavian region sit well above the 2008 penetration level at 40%, 30%, and 45%, respectively, while countries such as Spain and Italy have very low penetration at 19% and 14%, respectively. Thus, we think OTAs with a higher exposure to under-penetrated markets (such as Priceline) will out-perform their competition in 2010.
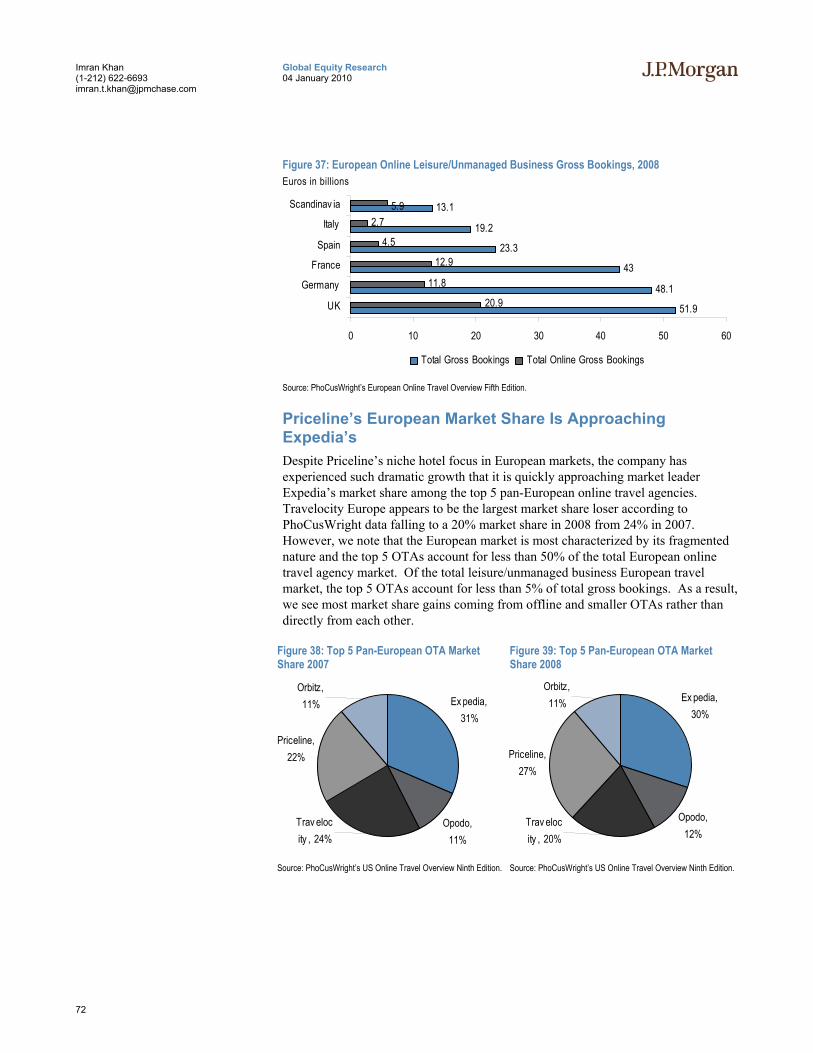
72
Global Equity Research 04 January 2010
Imran Khan (1-212) 622-6693 [email protected]
Figure 37: European Online Leisure/Unmanaged Business Gross Bookings, 2008 Euros in billions
51.9
48.1
43
23.3
19.2
13.1
20.9
11.8
12.9
4.5
2.75.9
0 10 20 30 40 50 60
UK
Germany
France
Spain
Italy
Scandinav ia
Total Gross Bookings Total Online Gross Bookings
Source: PhoCusWright’s European Online Travel Overview Fifth Edition.
Priceline’s European Market Share Is Approaching Expedia’s Despite Priceline’s niche hotel focus in European markets, the company has experienced such dramatic growth that it is quickly approaching market leader Expedia’s market share among the top 5 pan-European online travel agencies. Travelocity Europe appears to be the largest market share loser according to PhoCusWright data falling to a 20% market share in 2008 from 24% in 2007. However, we note that the European market is most characterized by its fragmented nature and the top 5 OTAs account for less than 50% of the total European online travel agency market. Of the total leisure/unmanaged business European travel market, the top 5 OTAs account for less than 5% of total gross bookings. As a result, we see most market share gains coming from offline and smaller OTAs rather than directly from each other.
Figure 38: Top 5 Pan-European OTA Market Share 2007
Ex pedia, 31%
Opodo, 11%
Priceline, 22%
Trav elocity , 24%
Orbitz, 11%
Source: PhoCusWright’s US Online Travel Overview Ninth Edition.
Figure 39: Top 5 Pan-European OTA Market Share 2008
Ex pedia, 30%
Opodo, 12%
Priceline, 27%
Trav elocity , 20%
Orbitz, 11%
Source: PhoCusWright’s US Online Travel Overview Ninth Edition.
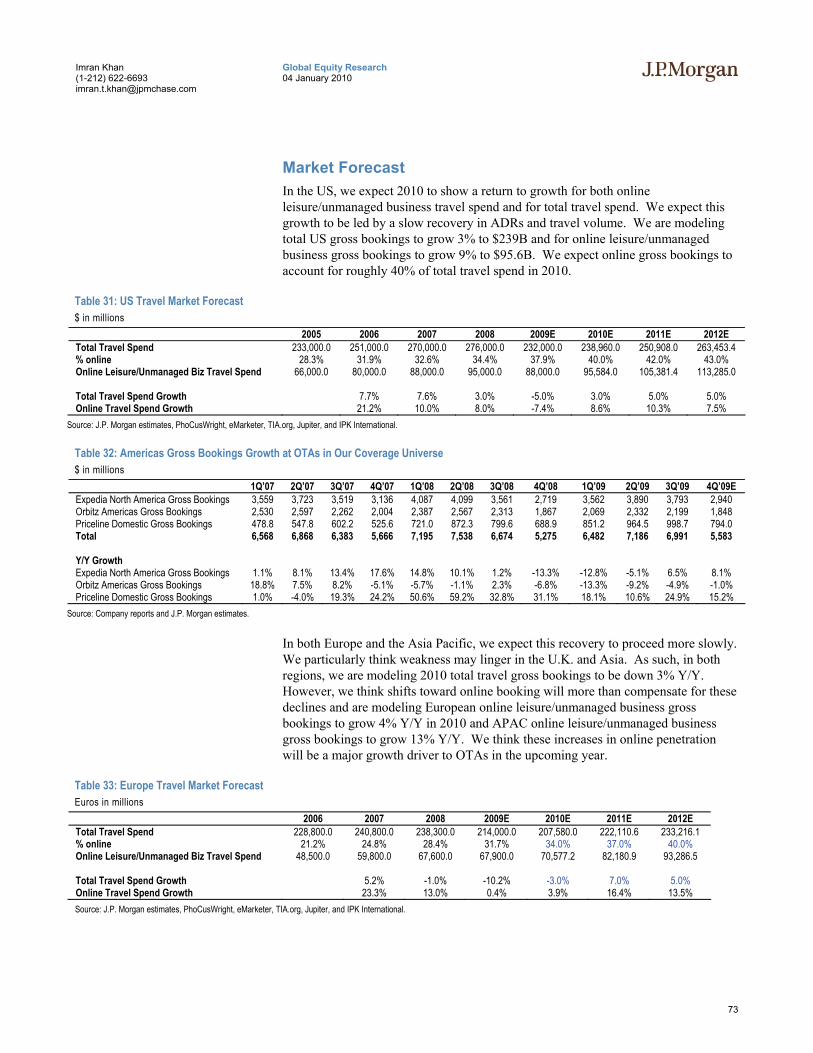
73
Global Equity Research 04 January 2010
Imran Khan (1-212) 622-6693 [email protected]
Market Forecast In the US, we expect 2010 to show a return to growth for both online leisure/unmanaged business travel spend and for total travel spend. We expect this growth to be led by a slow recovery in ADRs and travel volume. We are modeling total US gross bookings to grow 3% to $239B and for online leisure/unmanaged business gross bookings to grow 9% to $95.6B. We expect online gross bookings to account for roughly 40% of total travel spend in 2010.
Table 31: US Travel Market Forecast $ in millions
2005 2006 2007 2008 2009E 2010E 2011E 2012E Total Travel Spend 233,000.0 251,000.0 270,000.0 276,000.0 232,000.0 238,960.0 250,908.0 263,453.4 % online 28.3% 31.9% 32.6% 34.4% 37.9% 40.0% 42.0% 43.0% Online Leisure/Unmanaged Biz Travel Spend 66,000.0 80,000.0 88,000.0 95,000.0 88,000.0 95,584.0 105,381.4 113,285.0 Total Travel Spend Growth 7.7% 7.6% 3.0% -5.0% 3.0% 5.0% 5.0% Online Travel Spend Growth 21.2% 10.0% 8.0% -7.4% 8.6% 10.3% 7.5%
Source: J.P. Morgan estimates, PhoCusWright, eMarketer, TIA.org, Jupiter, and IPK International.
Table 32: Americas Gross Bookings Growth at OTAs in Our Coverage Universe $ in millions
1Q’07 2Q’07 3Q’07 4Q’07 1Q’08 2Q’08 3Q’08 4Q’08 1Q’09 2Q’09 3Q’09 4Q’09E Expedia North America Gross Bookings 3,559 3,723 3,519 3,136 4,087 4,099 3,561 2,719 3,562 3,890 3,793 2,940 Orbitz Americas Gross Bookings 2,530 2,597 2,262 2,004 2,387 2,567 2,313 1,867 2,069 2,332 2,199 1,848 Priceline Domestic Gross Bookings 478.8 547.8 602.2 525.6 721.0 872.3 799.6 688.9 851.2 964.5 998.7 794.0 Total 6,568 6,868 6,383 5,666 7,195 7,538 6,674 5,275 6,482 7,186 6,991 5,583 Y/Y Growth Expedia North America Gross Bookings 1.1% 8.1% 13.4% 17.6% 14.8% 10.1% 1.2% -13.3% -12.8% -5.1% 6.5% 8.1% Orbitz Americas Gross Bookings 18.8% 7.5% 8.2% -5.1% -5.7% -1.1% 2.3% -6.8% -13.3% -9.2% -4.9% -1.0% Priceline Domestic Gross Bookings 1.0% -4.0% 19.3% 24.2% 50.6% 59.2% 32.8% 31.1% 18.1% 10.6% 24.9% 15.2%
Source: Company reports and J.P. Morgan estimates.
In both Europe and the Asia Pacific, we expect this recovery to proceed more slowly. We particularly think weakness may linger in the U.K. and Asia. As such, in both regions, we are modeling 2010 total travel gross bookings to be down 3% Y/Y. However, we think shifts toward online booking will more than compensate for these declines and are modeling European online leisure/unmanaged business gross bookings to grow 4% Y/Y in 2010 and APAC online leisure/unmanaged business gross bookings to grow 13% Y/Y. We think these increases in online penetration will be a major growth driver to OTAs in the upcoming year.
Table 33: Europe Travel Market Forecast Euros in millions
2006 2007 2008 2009E 2010E 2011E 2012E Total Travel Spend 228,800.0 240,800.0 238,300.0 214,000.0 207,580.0 222,110.6 233,216.1 % online 21.2% 24.8% 28.4% 31.7% 34.0% 37.0% 40.0% Online Leisure/Unmanaged Biz Travel Spend 48,500.0 59,800.0 67,600.0 67,900.0 70,577.2 82,180.9 93,286.5
Total Travel Spend Growth 5.2% -1.0% -10.2% -3.0% 7.0% 5.0% Online Travel Spend Growth 23.3% 13.0% 0.4% 3.9% 16.4% 13.5% Source: J.P. Morgan estimates, PhoCusWright, eMarketer, TIA.org, Jupiter, and IPK International.
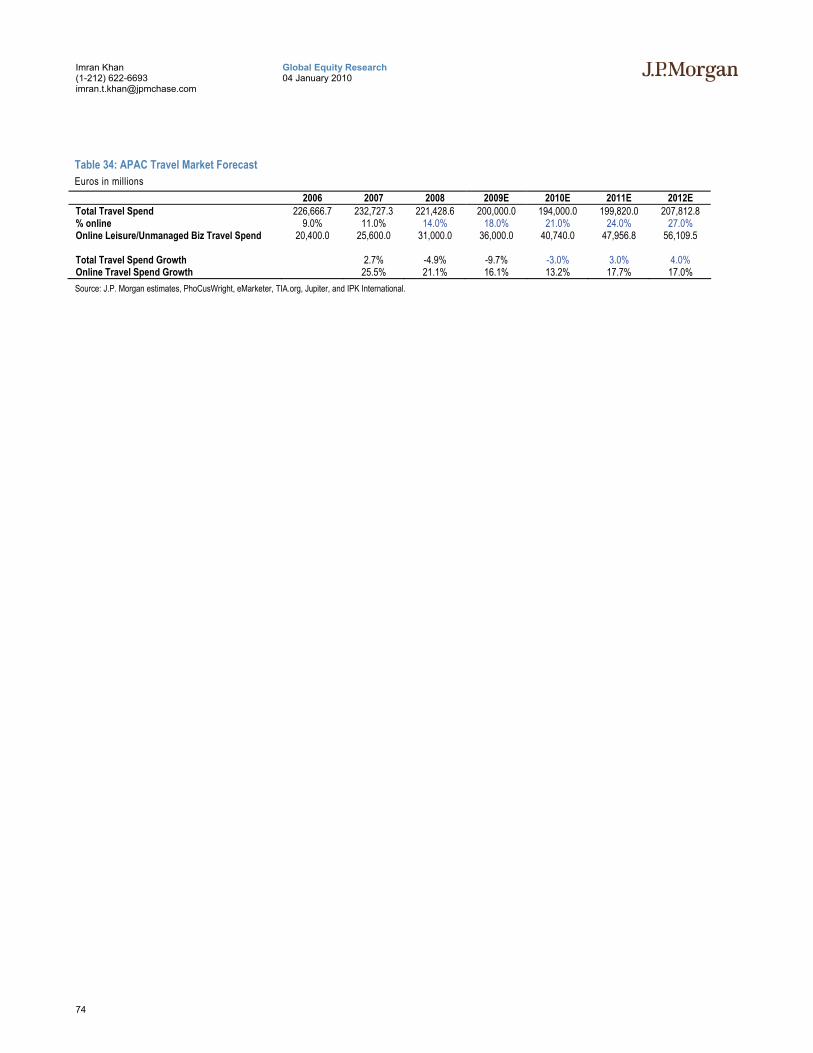
74
Global Equity Research 04 January 2010
Imran Khan (1-212) 622-6693 [email protected]
Table 34: APAC Travel Market Forecast Euros in millions
2006 2007 2008 2009E 2010E 2011E 2012E Total Travel Spend 226,666.7 232,727.3 221,428.6 200,000.0 194,000.0 199,820.0 207,812.8 % online 9.0% 11.0% 14.0% 18.0% 21.0% 24.0% 27.0% Online Leisure/Unmanaged Biz Travel Spend 20,400.0 25,600.0 31,000.0 36,000.0 40,740.0 47,956.8 56,109.5
Total Travel Spend Growth 2.7% -4.9% -9.7% -3.0% 3.0% 4.0% Online Travel Spend Growth 25.5% 21.1% 16.1% 13.2% 17.7% 17.0% Source: J.P. Morgan estimates, PhoCusWright, eMarketer, TIA.org, Jupiter, and IPK International.
75
Global Equity Research 04 January 2010
Imran Khan (1-212) 622-6693 [email protected]
Social Networks Primer Key Takeaways
• User adoption for Facebook continues to grow. US unique users to the site more than doubled in the twelve months since October 2008, to over 97M, or 49% of US internet users. Facebook passed the previous leader, MySpace, in May—then added another 25M+ users, and by October of last year had a 50% audience lead over MySpace. We think Facebook is beating MySpace and other similar platforms because of its 1) trusted network effect 2) robust app economy, and 3) scalable technology platform that makes it easier for users to connect and share. In addition to Facebook, LinkedIn had strong unique user growth in 2009 (up 131% during the first ten months of 2010). We believe LinkedIn has differentiated itself as a professional social networking platform that has resonated amongst its user base. It addresses the specialized needs of business professionals and recruiters, and we think the site’s distinct brand identity and differentiated value proposition has fueled its strong growth.
• Social networks are platforms. We view the social sites (esp. Facebook) as network platforms, like Visa/MasterCard. As such, they don’t necessarily need to monetize directly from their customers: they can enable applications such as casual games (or eCommerce, or virtual gifts) and collect a small fee as the providers of the network.
• A step forward for monetization. Casual games, integrated into the social network landscape, experienced runaway growth in 2009. We think such applications are one of several paths toward the successful monetization of social networks. While advertising-based monetization will remain a challenge, we think the sale of virtual goods, the sale of premium services, as well as the sale of certain aggregated user data, can help social sites monetize their runaway use.
Consumer Adoption Continues to Grow: Facebook Now Represents 5% of All Time Spent on the Internet Worldwide The growth of social networks in 2009 remained very strong, with comScore estimating that minutes of usage across all worldwide social networking sites were up 30% Y/Y through the first ten months of the year, only a slight slowdown from the growth last year.
However, the majority of the growth occurred at market share leader Facebook, which represented almost 49% of minutes spent worldwide at social networking sites in October 2009 (representing ~5% of all time spent on the internet worldwide), according to comScore. As noted in the table below, worldwide minutes spent decreased at most of the other key players in the social networking space, even as several added users. One important exception was LinkedIn, which more than doubled in size for a second consecutive year. Further, LinkedIn has built a trusted network for the business community and has created a differentiated identity. An additional outperformer not represented in the table below was the Russia-focused
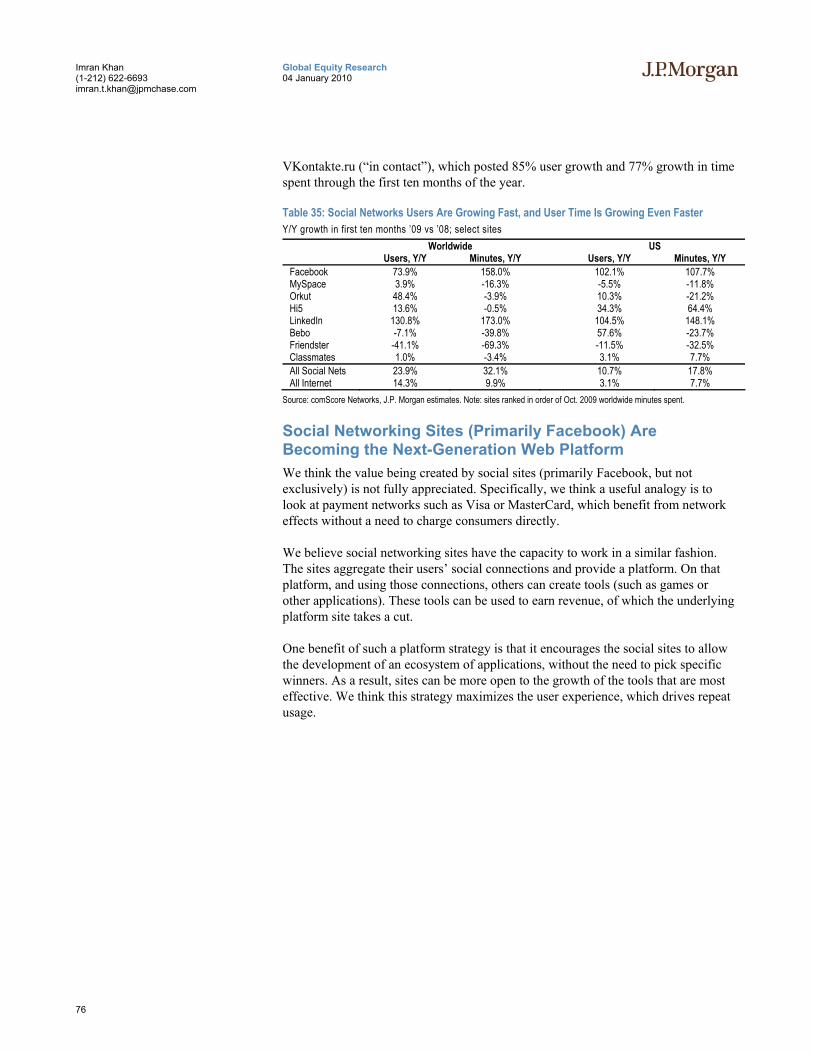
76
Global Equity Research 04 January 2010
Imran Khan (1-212) 622-6693 [email protected]
VKontakte.ru (“in contact”), which posted 85% user growth and 77% growth in time spent through the first ten months of the year.
Table 35: Social Networks Users Are Growing Fast, and User Time Is Growing Even Faster Y/Y growth in first ten months ’09 vs ’08; select sites
Worldwide US Users, Y/Y Minutes, Y/Y Users, Y/Y Minutes, Y/Y
Facebook 73.9% 158.0% 102.1% 107.7% MySpace 3.9% -16.3% -5.5% -11.8% Orkut 48.4% -3.9% 10.3% -21.2% Hi5 13.6% -0.5% 34.3% 64.4% LinkedIn 130.8% 173.0% 104.5% 148.1% Bebo -7.1% -39.8% 57.6% -23.7% Friendster -41.1% -69.3% -11.5% -32.5% Classmates 1.0% -3.4% 3.1% 7.7% All Social Nets 23.9% 32.1% 10.7% 17.8% All Internet 14.3% 9.9% 3.1% 7.7%
Source: comScore Networks, J.P. Morgan estimates. Note: sites ranked in order of Oct. 2009 worldwide minutes spent.
Social Networking Sites (Primarily Facebook) Are Becoming the Next-Generation Web Platform We think the value being created by social sites (primarily Facebook, but not exclusively) is not fully appreciated. Specifically, we think a useful analogy is to look at payment networks such as Visa or MasterCard, which benefit from network effects without a need to charge consumers directly.
We believe social networking sites have the capacity to work in a similar fashion. The sites aggregate their users’ social connections and provide a platform. On that platform, and using those connections, others can create tools (such as games or other applications). These tools can be used to earn revenue, of which the underlying platform site takes a cut.
One benefit of such a platform strategy is that it encourages the social sites to allow the development of an ecosystem of applications, without the need to pick specific winners. As a result, sites can be more open to the growth of the tools that are most effective. We think this strategy maximizes the user experience, which drives repeat usage.
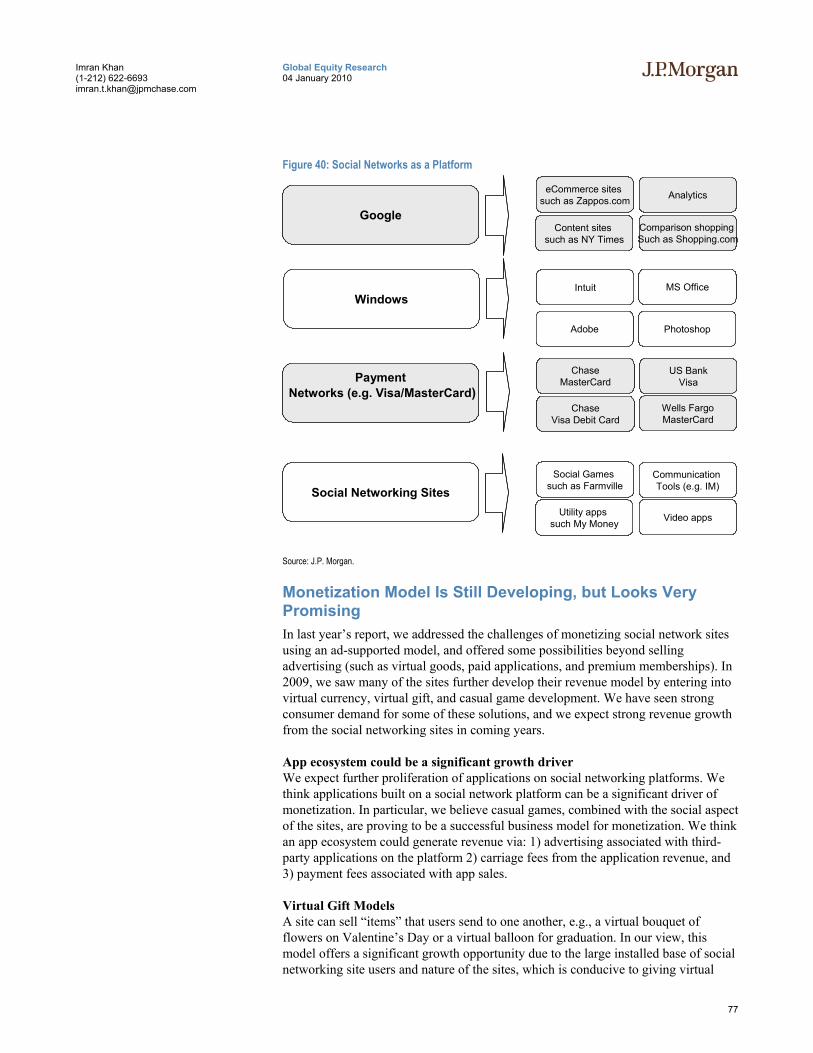
77
Global Equity Research 04 January 2010
Imran Khan (1-212) 622-6693 [email protected]
Figure 40: Social Networks as a Platform
Social Networking Sites
PaymentNetworks (e.g. Visa/MasterCard)
Windows
Utility apps such My Money
Communication Tools (e.g. IM)
Video apps
ChaseMasterCard
US BankVisa
Intuit
Adobe
MS Office
Photoshop
Content sites such as NY Times
Comparison shopping Such as Shopping.com
ChaseVisa Debit Card
Wells FargoMasterCard
Social Games such as Farmville
eCommerce sites such as Zappos.com Analytics
Source: J.P. Morgan.
Monetization Model Is Still Developing, but Looks Very Promising In last year’s report, we addressed the challenges of monetizing social network sites using an ad-supported model, and offered some possibilities beyond selling advertising (such as virtual goods, paid applications, and premium memberships). In 2009, we saw many of the sites further develop their revenue model by entering into virtual currency, virtual gift, and casual game development. We have seen strong consumer demand for some of these solutions, and we expect strong revenue growth from the social networking sites in coming years.
App ecosystem could be a significant growth driver We expect further proliferation of applications on social networking platforms. We think applications built on a social network platform can be a significant driver of monetization. In particular, we believe casual games, combined with the social aspect of the sites, are proving to be a successful business model for monetization. We think an app ecosystem could generate revenue via: 1) advertising associated with third-party applications on the platform 2) carriage fees from the application revenue, and 3) payment fees associated with app sales.
Virtual Gift Models A site can sell “items” that users send to one another, e.g., a virtual bouquet of flowers on Valentine’s Day or a virtual balloon for graduation. In our view, this model offers a significant growth opportunity due to the large installed base of social networking site users and nature of the sites, which is conducive to giving virtual

78
Global Equity Research 04 January 2010
Imran Khan (1-212) 622-6693 [email protected]
gifts. By way of illustration, if Facebook could generate $1 per registered user, it would amount to more than $350M in revenue.
Lead Generation Model Social networking companies have access to a massive amount of consumer data, and we think there are opportunities to monetize that data without violating consumer privacy. We think social networking sites can build out their own lead generation platforms or potentially charge a traffic acquisition cost to existing lead generation companies.
Classifieds Unlike a normal classified site, the level of trust can be higher because buyers and sellers can see the connection linking them within the social network. In our 2008 internet survey, social network users were users of classified sites at a higher rate than those who had not used social network sites. Classified advertising is rapidly migrating online from newspapers, and we think this area represents a significant market share gain opportunity for the social networking sites.
Paid Premium Memberships Sites like LinkedIn and Classmates.com offer these; at LinkedIn, paid accounts have greater access to users outside their immediate network, whereas at Classmates the premium memberships entitle users to have greater communication privileges with other members as well as a variety of other perks.
Traditional Display Advertising Could Be Challenging Social networking sites, as a group, have not been able to command very high advertising rates for their page view inventory; the supply of “bulk” page-view inventory from social networks was a contributing factor to the stagnating CPMs for graphical ads in the past several years (though the economy didn’t help), and we do not believe demand has yet caught up with this supply.
Further, despite a significant degree of effort expended to improve monetization, improvements have been hard to come by, and one of the most successful monetization strategies appears to be to get a guarantee from a search partner, such as MySpace’s $900M partnership with Google. We doubt this can be a successful long-term strategy, however. Google may not offer similarly favorable terms when the deal comes up for renewal in April 2010.
As time goes on, we think social networks will develop better targeting and monetization of their page view inventory. Given the wealth of personalized information available to the sites, there is a road map for improved monetization. Nevertheless, the technology remains fairly nascent, and we think the current environment is quite unfavorable for sites without a proven track record to try to attract graphical advertising.
Although both MySpace and Facebook have had success generating display ad revenue (nearly $380M in CY’08 display revenue at FIM; press reports put total ’08 revenue at Facebook of $265M), we continue to expect these sites to have trouble growing their effective CPMs over time.
79
Global Equity Research 04 January 2010
Imran Khan (1-212) 622-6693 [email protected]
Key Social Networking Sites Some of the notable social networking sites worldwide include:
• Facebook. Launched February 2004, the site remains independent but in October 2007 drew a $240M investment from Microsoft, which acquired a 1.6% equity stake. Microsoft also sells ads on Facebook. A Russian investor, Digital Sky Technologies, reportedly made a $200M investment in May 2009, receiving just under a 2% stake. The site became open to non-academic users in September 2006; according to comScore, it overtook MySpace in terms of worldwide user reach in mid-2008 and in the US in mid-2009.
• MySpace. Launched August 2003, the site was acquired by News Corporation in July 2005. MySpace’s user base tends to tilt somewhat toward teens and is more US-based than the audience for any of the other big six. Also popular with musicians and bands.
• Orkut. Launched by Google in January 2004. The site has not taken off significantly in the US but is quite popular in Brazil as well as in India and Pakistan.
• Friendster. Launched March 2003. In the US, the site has faded somewhat after being an early leader in the space, but it remains quite popular in Southeast Asia.
• Bebo. Launched January 2005. The site is popular in the UK and other English-speaking countries, including Ireland, as well as in Poland. In 4Q’07, it announced a partnership with AOL for integration of instant-messenger software; two quarters later AOL acquired Bebo for ~$850B.
• Hi5. Launched 2003. The site, though based out of the San Francisco Bay Area, maintains a base of popularity in Latin America as well as in some Asian countries.
• Classmates.com. A relative senior citizen in the space, launched in 1995. The site is now part of United Online, and traffic comes primarily from the United States. The site reported over four million paying accounts in 3Q’08, representing 37% Y/Y growth.
• LinkedIn. Launched 2003. LinkedIn is focused on building professional networks, and, as such, the site has a somewhat more up-market demographic and has had somewhat greater success in selling its ad inventory at higher CPMs. LinkedIn also sells premium memberships.
Understanding Social Games Online gaming represented an almost ~$12B market in 2008, according to iResearch, with the US just hanging on for the biggest market share at 29%, ahead of China (27%) and Korea (21%).
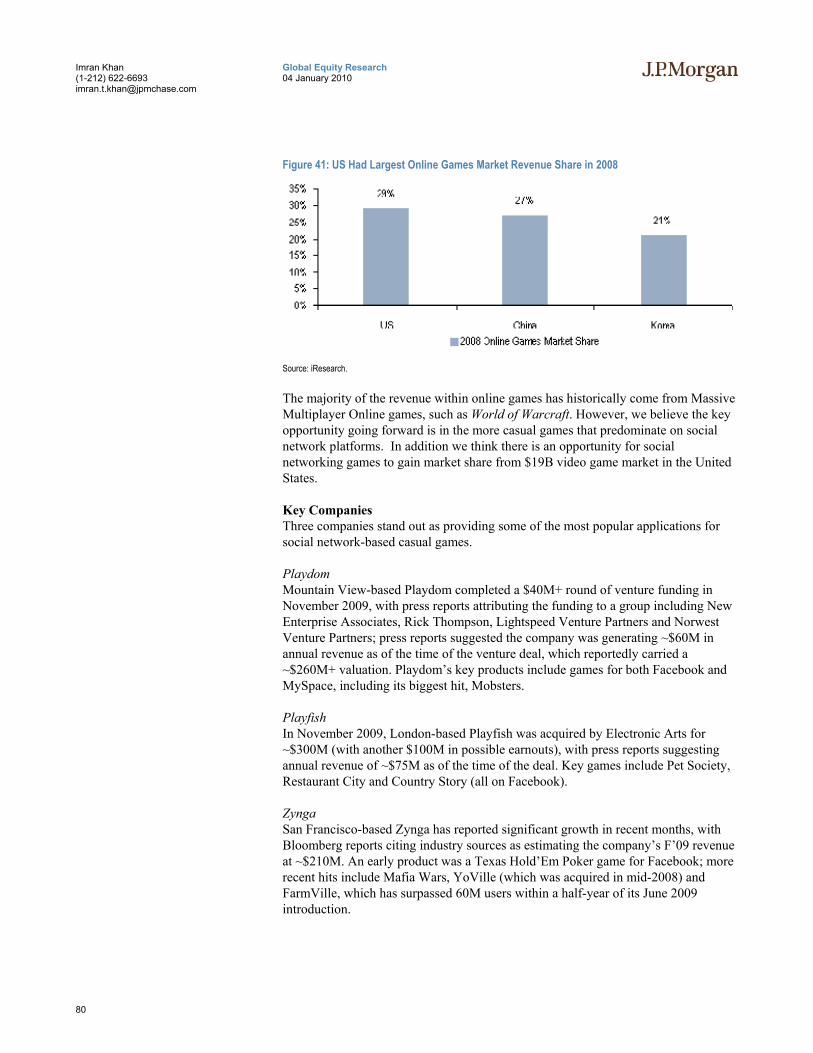
80
Global Equity Research 04 January 2010
Imran Khan (1-212) 622-6693 [email protected]
Figure 41: US Had Largest Online Games Market Revenue Share in 2008
Source: iResearch.
The majority of the revenue within online games has historically come from Massive Multiplayer Online games, such as World of Warcraft. However, we believe the key opportunity going forward is in the more casual games that predominate on social network platforms. In addition we think there is an opportunity for social networking games to gain market share from $19B video game market in the United States.
Key Companies Three companies stand out as providing some of the most popular applications for social network-based casual games.
Playdom Mountain View-based Playdom completed a $40M+ round of venture funding in November 2009, with press reports attributing the funding to a group including New Enterprise Associates, Rick Thompson, Lightspeed Venture Partners and Norwest Venture Partners; press reports suggested the company was generating ~$60M in annual revenue as of the time of the venture deal, which reportedly carried a ~$260M+ valuation. Playdom’s key products include games for both Facebook and MySpace, including its biggest hit, Mobsters.
Playfish In November 2009, London-based Playfish was acquired by Electronic Arts for ~$300M (with another $100M in possible earnouts), with press reports suggesting annual revenue of ~$75M as of the time of the deal. Key games include Pet Society, Restaurant City and Country Story (all on Facebook).
Zynga San Francisco-based Zynga has reported significant growth in recent months, with Bloomberg reports citing industry sources as estimating the company’s F’09 revenue at ~$210M. An early product was a Texas Hold’Em Poker game for Facebook; more recent hits include Mafia Wars, YoVille (which was acquired in mid-2008) and FarmVille, which has surpassed 60M users within a half-year of its June 2009 introduction.
81
Global Equity Research 04 January 2010
Imran Khan (1-212) 622-6693 [email protected]
Revenue Generation for Casual Games Although the market is fragmented and largely driven by private companies (and thus reliable figures are hard to come by), we believe casual online games generated in excess of $500M in F’09. We see three key revenue streams for these applications:
Advertising How: Show ads to users as they play game; add product placements to game.
Discussion: This was the revenue model for the original hit game on Facebook, Scrabulous (a Scrabble clone that was shut down as part of a rights dispute with Hasbro, then reincarnated, but with less success, as Lexulous). Currently, many games sell advertising. We think some of the challenges for the ad supported models are: (a) the inventory is very low-quality, (b) users are not hugely receptive to advertising while playing games and (c) unless there is a very large advertiser base, CPMs go down as users are saturated with multiple impressions of the same ad. However, we think there may be some revenue opportunity if game designers can build more creative integrations (e.g., cars in a Mafia game are of a particular brand), or advertisers promote their products with branded giveaways—but such integrations can be hard to scale.
Lead generation How: Users can activate advanced features in a game by providing information for promotional offers.
Discussion: Lead generation has brought (mostly negative) attention to the industry, as press reports (including the technology blog TechCrunch) have suggested some of the revenue was being driven by deceptive marketing practices. As a result, many of the game companies have raised their standards to cut down on egregious abuses of this process.
Virtual Goods and Premium Services How: Users can generally play a limited, entry-level version of a game for free, but additional in-game features and resources can be activated at extra cost.
Discussion: Sales of virtual items are believed to be the largest revenue stream for game companies, with Zynga saying in a statement that it gets ~90% of its revenue from such sales. According to the company, roughly 0.5% of its active monthly users pay for virtual items. We think the monetization story is likely to play out in this area for game companies. Although the majority of users will remain truly casual, we think a sufficient proportion can become more immersed in the games and would thus be willing to pay for incremental services. Additionally, we think the social aspect of such games can be a motivator: if others in your network are paying for extra features, it is easier to justify opening your wallet.
One challenge is that the current online payment infrastructure is not ideally configured for such sales, which tend to be fairly small in size, resulting in a disproportionately high payment processing cost if using a method such as credit cards. We expect innovation in the area of micropayments as well as growing user comfort with making such purchases to drive growth in virtual goods sales. We think PayPal’s recent PayPal X initiative, which opened its platform to developers, can be a catalyst for innovation.
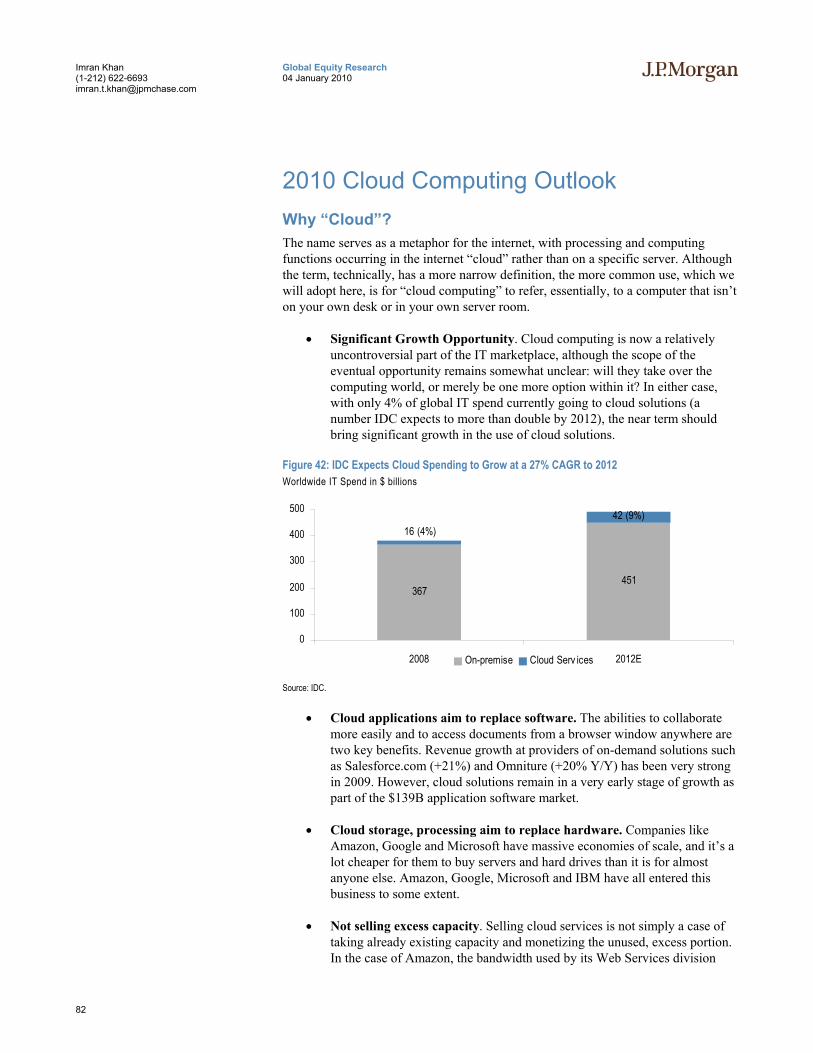
82
Global Equity Research 04 January 2010
Imran Khan (1-212) 622-6693 [email protected]
2010 Cloud Computing Outlook Why “Cloud”? The name serves as a metaphor for the internet, with processing and computing functions occurring in the internet “cloud” rather than on a specific server. Although the term, technically, has a more narrow definition, the more common use, which we will adopt here, is for “cloud computing” to refer, essentially, to a computer that isn’t on your own desk or in your own server room.
• Significant Growth Opportunity. Cloud computing is now a relatively uncontroversial part of the IT marketplace, although the scope of the eventual opportunity remains somewhat unclear: will they take over the computing world, or merely be one more option within it? In either case, with only 4% of global IT spend currently going to cloud solutions (a number IDC expects to more than double by 2012), the near term should bring significant growth in the use of cloud solutions.
Figure 42: IDC Expects Cloud Spending to Grow at a 27% CAGR to 2012 Worldwide IT Spend in $ billions
367451
42 (9%)16 (4%)
0
100
200
300
400
500
2008 2012EOn-premise Cloud Serv ices
Source: IDC.
• Cloud applications aim to replace software. The abilities to collaborate more easily and to access documents from a browser window anywhere are two key benefits. Revenue growth at providers of on-demand solutions such as Salesforce.com (+21%) and Omniture (+20% Y/Y) has been very strong in 2009. However, cloud solutions remain in a very early stage of growth as part of the $139B application software market.
• Cloud storage, processing aim to replace hardware. Companies like Amazon, Google and Microsoft have massive economies of scale, and it’s a lot cheaper for them to buy servers and hard drives than it is for almost anyone else. Amazon, Google, Microsoft and IBM have all entered this business to some extent.
• Not selling excess capacity. Selling cloud services is not simply a case of taking already existing capacity and monetizing the unused, excess portion. In the case of Amazon, the bandwidth used by its Web Services division
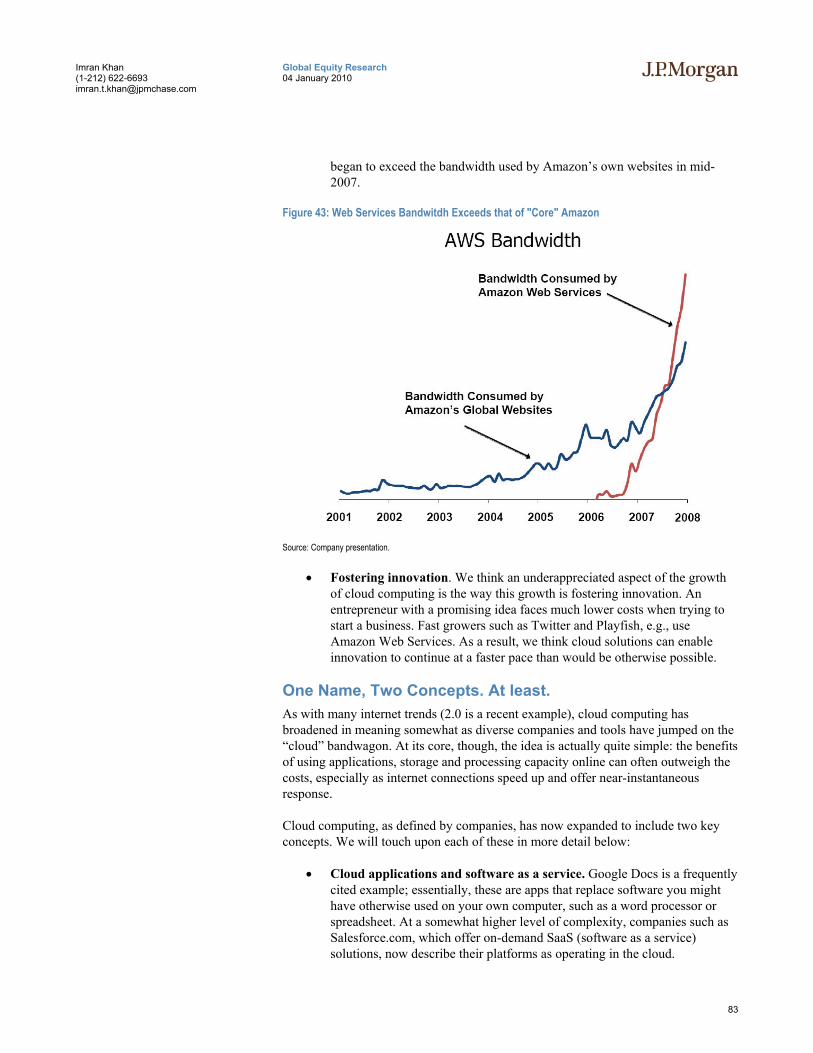
83
Global Equity Research 04 January 2010
Imran Khan (1-212) 622-6693 [email protected]
began to exceed the bandwidth used by Amazon’s own websites in mid-2007.
Figure 43: Web Services Bandwitdh Exceeds that of "Core" Amazon
Source: Company presentation.
• Fostering innovation. We think an underappreciated aspect of the growth of cloud computing is the way this growth is fostering innovation. An entrepreneur with a promising idea faces much lower costs when trying to start a business. Fast growers such as Twitter and Playfish, e.g., use Amazon Web Services. As a result, we think cloud solutions can enable innovation to continue at a faster pace than would be otherwise possible.
One Name, Two Concepts. At least. As with many internet trends (2.0 is a recent example), cloud computing has broadened in meaning somewhat as diverse companies and tools have jumped on the “cloud” bandwagon. At its core, though, the idea is actually quite simple: the benefits of using applications, storage and processing capacity online can often outweigh the costs, especially as internet connections speed up and offer near-instantaneous response.
Cloud computing, as defined by companies, has now expanded to include two key concepts. We will touch upon each of these in more detail below:
• Cloud applications and software as a service. Google Docs is a frequently cited example; essentially, these are apps that replace software you might have otherwise used on your own computer, such as a word processor or spreadsheet. At a somewhat higher level of complexity, companies such as Salesforce.com, which offer on-demand SaaS (software as a service) solutions, now describe their platforms as operating in the cloud.
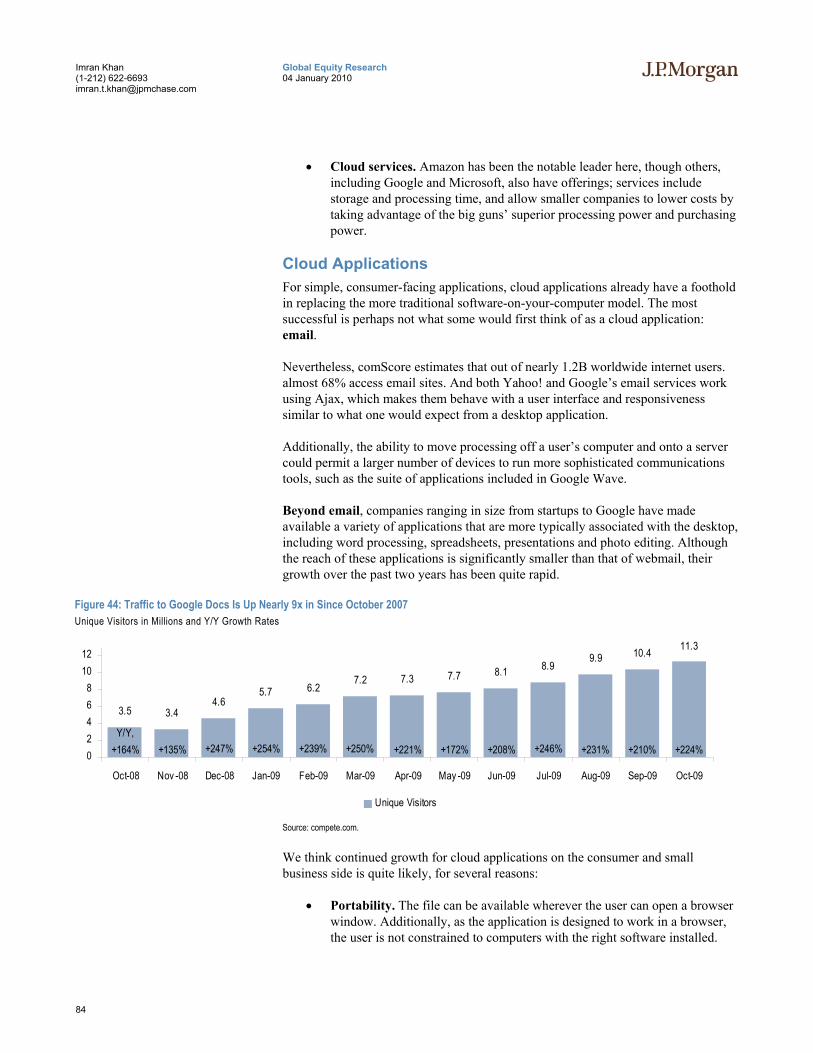
84
Global Equity Research 04 January 2010
Imran Khan (1-212) 622-6693 [email protected]
• Cloud services. Amazon has been the notable leader here, though others, including Google and Microsoft, also have offerings; services include storage and processing time, and allow smaller companies to lower costs by taking advantage of the big guns’ superior processing power and purchasing power.
Cloud Applications For simple, consumer-facing applications, cloud applications already have a foothold in replacing the more traditional software-on-your-computer model. The most successful is perhaps not what some would first think of as a cloud application: email.
Nevertheless, comScore estimates that out of nearly 1.2B worldwide internet users. almost 68% access email sites. And both Yahoo! and Google’s email services work using Ajax, which makes them behave with a user interface and responsiveness similar to what one would expect from a desktop application.
Additionally, the ability to move processing off a user’s computer and onto a server could permit a larger number of devices to run more sophisticated communications tools, such as the suite of applications included in Google Wave.
Beyond email, companies ranging in size from startups to Google have made available a variety of applications that are more typically associated with the desktop, including word processing, spreadsheets, presentations and photo editing. Although the reach of these applications is significantly smaller than that of webmail, their growth over the past two years has been quite rapid.
Figure 44: Traffic to Google Docs Is Up Nearly 9x in Since October 2007 Unique Visitors in Millions and Y/Y Growth Rates
3.5 3.44.6
5.7 6.27.2 7.3 7.7 8.1 8.9
9.9 10.4 11.3
+135% +247% +254% +239% +250% +221% +172% +208% +246% +231% +210% +224%Y/Y,
+164%02468
1012
Oct-08 Nov -08 Dec-08 Jan-09 Feb-09 Mar-09 Apr-09 May -09 Jun-09 Jul-09 Aug-09 Sep-09 Oct-09
Unique Visitors
Source: compete.com.
We think continued growth for cloud applications on the consumer and small business side is quite likely, for several reasons:
• Portability. The file can be available wherever the user can open a browser window. Additionally, as the application is designed to work in a browser, the user is not constrained to computers with the right software installed.
85
Global Equity Research 04 January 2010
Imran Khan (1-212) 622-6693 [email protected]
• Collaboration. Multiple people can work on the same document and see each others’ changes in real time. We think collaboration will become an even more core component of software innovation over the next decade.
• Convenience. The web application model frees the user from needing to ensure that software is up to date.
• Price point. Many of Google’s tools, e.g., are available for free, or for an annual fee of $50/user account for businesses. While we don’t expect these tools to make much headway at a large corporation such as J.P. Morgan, a smaller business may find the price compelling, compared to a Microsoft Office price point of over $100 retail.
• For the software company, easier to avoid piracy. The provider can ration access to the application, and there is less of a danger that multiple copies could be made from a single source.
At the same time, the model brings with it a variety of drawbacks, some more significant than others:
• Data security. Some clients, especially enterprise clients, may not want to put valuable information online in a way that enables the whole world to possibly access it.
• Lack of features. While online applications continue to make strides, they generally remain far short of the capabilities offered by a full-featured application such as Microsoft Excel. We believe that, for many users, a tool that offers only a fraction of Excel’s capabilities is likely to be sufficient, and the lack of bells and whistles may not be a significant drawback.
• Reliance on internet connection. Lose your link to the network, and you lose your documents – a tradeoff some may not be willing to risk. Some providers let users edit documents offline – but doing so temporarily removes some of the advantages described above.
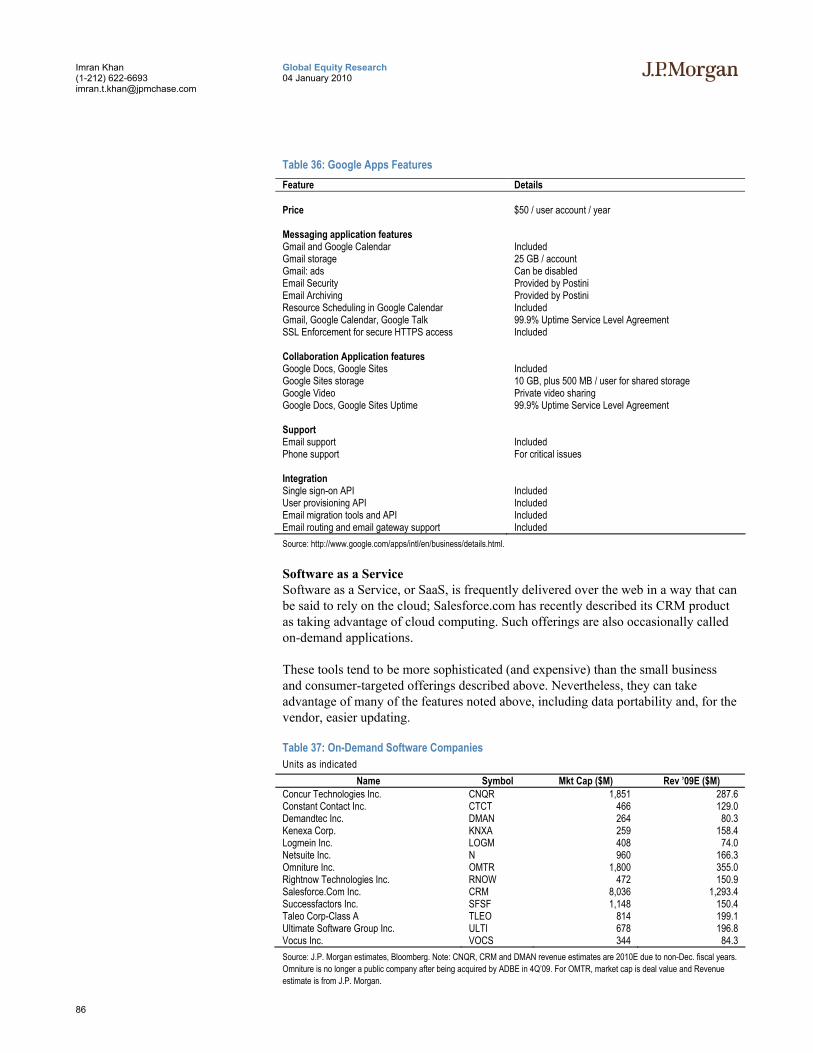
86
Global Equity Research 04 January 2010
Imran Khan (1-212) 622-6693 [email protected]
Table 36: Google Apps Features Feature Details Price $50 / user account / year
Messaging application features Gmail and Google Calendar Included Gmail storage 25 GB / account Gmail: ads Can be disabled Email Security Provided by Postini Email Archiving Provided by Postini Resource Scheduling in Google Calendar Included Gmail, Google Calendar, Google Talk 99.9% Uptime Service Level Agreement SSL Enforcement for secure HTTPS access Included
Collaboration Application features Google Docs, Google Sites Included Google Sites storage 10 GB, plus 500 MB / user for shared storage Google Video Private video sharing Google Docs, Google Sites Uptime 99.9% Uptime Service Level Agreement
Support Email support Included Phone support For critical issues
Integration Single sign-on API Included User provisioning API Included Email migration tools and API Included Email routing and email gateway support Included Source: http://www.google.com/apps/intl/en/business/details.html.
Software as a Service Software as a Service, or SaaS, is frequently delivered over the web in a way that can be said to rely on the cloud; Salesforce.com has recently described its CRM product as taking advantage of cloud computing. Such offerings are also occasionally called on-demand applications.
These tools tend to be more sophisticated (and expensive) than the small business and consumer-targeted offerings described above. Nevertheless, they can take advantage of many of the features noted above, including data portability and, for the vendor, easier updating.
Table 37: On-Demand Software Companies Units as indicated
Name Symbol Mkt Cap ($M) Rev ’09E ($M) Concur Technologies Inc. CNQR 1,851 287.6 Constant Contact Inc. CTCT 466 129.0 Demandtec Inc. DMAN 264 80.3 Kenexa Corp. KNXA 259 158.4 Logmein Inc. LOGM 408 74.0 Netsuite Inc. N 960 166.3 Omniture Inc. OMTR 1,800 355.0 Rightnow Technologies Inc. RNOW 472 150.9 Salesforce.Com Inc. CRM 8,036 1,293.4 Successfactors Inc. SFSF 1,148 150.4 Taleo Corp-Class A TLEO 814 199.1 Ultimate Software Group Inc. ULTI 678 196.8 Vocus Inc. VOCS 344 84.3 Source: J.P. Morgan estimates, Bloomberg. Note: CNQR, CRM and DMAN revenue estimates are 2010E due to non-Dec. fiscal years. Omniture is no longer a public company after being acquired by ADBE in 4Q’09. For OMTR, market cap is deal value and Revenue estimate is from J.P. Morgan.
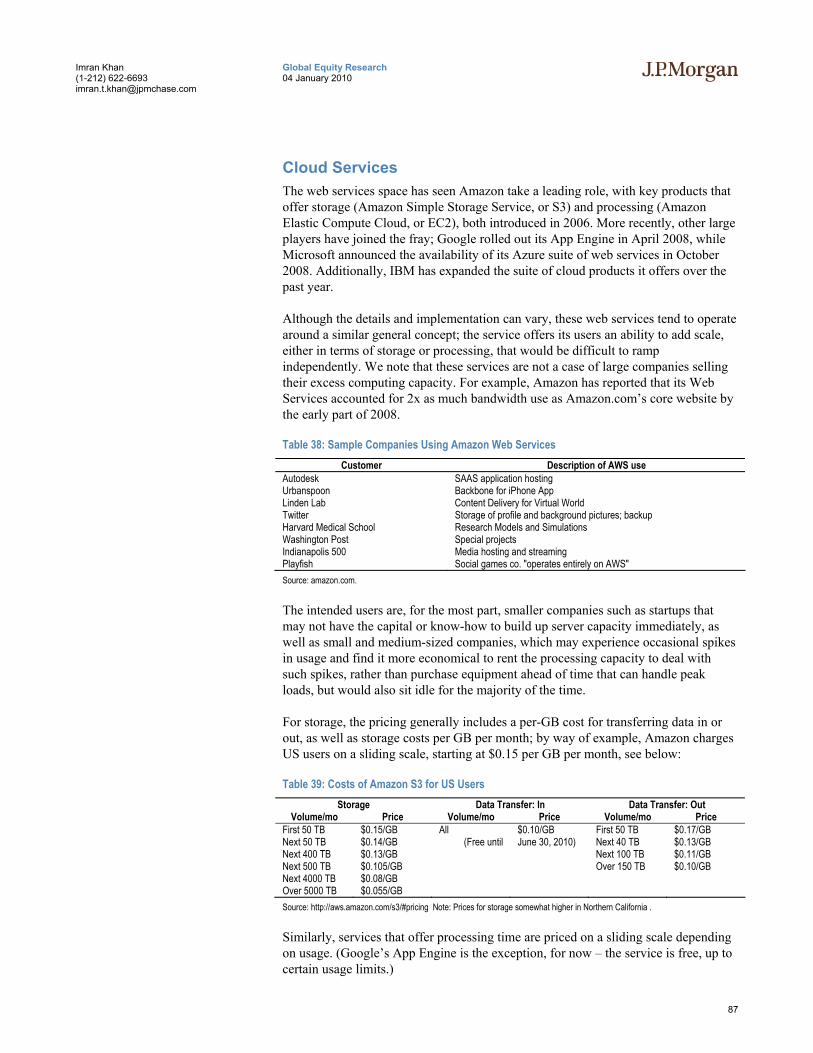
87
Global Equity Research 04 January 2010
Imran Khan (1-212) 622-6693 [email protected]
Cloud Services The web services space has seen Amazon take a leading role, with key products that offer storage (Amazon Simple Storage Service, or S3) and processing (Amazon Elastic Compute Cloud, or EC2), both introduced in 2006. More recently, other large players have joined the fray; Google rolled out its App Engine in April 2008, while Microsoft announced the availability of its Azure suite of web services in October 2008. Additionally, IBM has expanded the suite of cloud products it offers over the past year.
Although the details and implementation can vary, these web services tend to operate around a similar general concept; the service offers its users an ability to add scale, either in terms of storage or processing, that would be difficult to ramp independently. We note that these services are not a case of large companies selling their excess computing capacity. For example, Amazon has reported that its Web Services accounted for 2x as much bandwidth use as Amazon.com’s core website by the early part of 2008.
Table 38: Sample Companies Using Amazon Web Services Customer Description of AWS use
Autodesk SAAS application hosting Urbanspoon Backbone for iPhone App Linden Lab Content Delivery for Virtual World Twitter Storage of profile and background pictures; backup Harvard Medical School Research Models and Simulations Washington Post Special projects Indianapolis 500 Media hosting and streaming Playfish Social games co. "operates entirely on AWS" Source: amazon.com.
The intended users are, for the most part, smaller companies such as startups that may not have the capital or know-how to build up server capacity immediately, as well as small and medium-sized companies, which may experience occasional spikes in usage and find it more economical to rent the processing capacity to deal with such spikes, rather than purchase equipment ahead of time that can handle peak loads, but would also sit idle for the majority of the time.
For storage, the pricing generally includes a per-GB cost for transferring data in or out, as well as storage costs per GB per month; by way of example, Amazon charges US users on a sliding scale, starting at $0.15 per GB per month, see below:
Table 39: Costs of Amazon S3 for US Users Storage Data Transfer: In Data Transfer: Out
Volume/mo Price Volume/mo Price Volume/mo Price First 50 TB $0.15/GB All $0.10/GB First 50 TB $0.17/GB Next 50 TB $0.14/GB (Free until June 30, 2010) Next 40 TB $0.13/GB Next 400 TB $0.13/GB Next 100 TB $0.11/GB Next 500 TB $0.105/GB Over 150 TB $0.10/GB Next 4000 TB $0.08/GB Over 5000 TB $0.055/GB Source: http://aws.amazon.com/s3/#pricing Note: Prices for storage somewhat higher in Northern California .
Similarly, services that offer processing time are priced on a sliding scale depending on usage. (Google’s App Engine is the exception, for now – the service is free, up to certain usage limits.)
88
Global Equity Research 04 January 2010
Imran Khan (1-212) 622-6693 [email protected]
Advantages of Cloud Services Model: • Scalability. Rather than trying to project the growth of expected computing
needs, an enterprise can pay for exactly the level of computing resources it requires. Additionally, if a company’s needs spike unexpectedly, the cloud services model can absorb the spike, vs. needing to wait for resources to be bought and installed.
• Pricing. The large companies that offer these services tend to benefit from immense economies of scale, allowing them to price the services at levels that can be lower than what a smaller company would be able to achieve if buying its own hardware.
• Focus. Few companies, especially smaller ones, have a core competency in managing hardware and servers. By outsourcing these functions to a service provider, a company can focus on its core business.
Disadvantages: • Less configurable. The processing and storage resources that are bought in
a cloud model may not offer the option of being configured in precisely the way a user would prefer.
• Data security. As with cloud applications, some businesses may not be comfortable having key data stored on someone else’s computer.

89
Global Equity Research 04 January 2010
Imran Khan (1-212) 622-6693 [email protected]
eReader Market Outlook Since Amazon introduced the Kindle in 4Q’07, the eReader market has undergone rapid growth. With several devices debuting in late 2009 and early 2010, we believe the landscape in the eReader industry is likely to continue to shift.
Key Takeaways • Device marketplace is getting crowded. Sony and Amazon were the early
entrants, but Barnes & Noble’s nook (out November 30, though in limited supply) and Plastic Logic’s QUE (due to debut at CES in early January) are just two of the devices coming out soon. We expect the list of available devices to grow, and press reports abound of a possible reading device from Apple.
• A niche market can still be a big market. The majority of the population doesn’t read much. But even if only 15% of US adults read 25+ books a year, that would represent nearly 35M people, more than enough to allow for multiple winners in the eReader market—even setting aside any global opportunities.
• We think the money’s in content. We continue to believe selling the devices is likely to be a less important business than selling eBooks—and other content—for the devices. We have estimated that Amazon could see as much as 40c in annual EPS uplift if it is able to sell 2 titles a month across six million devices.
• Content means more than just books. Newspapers and magazines are, if anything, a more natural use for an eReader: the current paper format is largely disposable.
• More than one business model can succeed. We think a variety of possibilities exist for the eReader market: e.g., cell-phone type plans with unlimited content for a set monthly fee, or “book club” deals where an eReader is free but the consumer must buy a certain number of titles. In the near future, we think an advertising-supported approach is less plausible for books, where the user experience suffers with interruption. eNewspapers, on the other hand, could eventually be supported partly with advertising.
eReader Marketplace Getting Crowded Below is a quick primer on eReader devices currently (or soon) available. As a note, throughout this report we refer to the devices as eReaders and to the content as eBooks. First, a look at key features shared by many of the devices.
Key Features The majority of recent eReader devices have many or all of the following features:
• E Ink display. Perhaps the key differentiator of eReaders from other handheld devices, an E Ink display is not backlit, and allows the reader to look at a surface that is like paper, which reduces eye strain for many users.
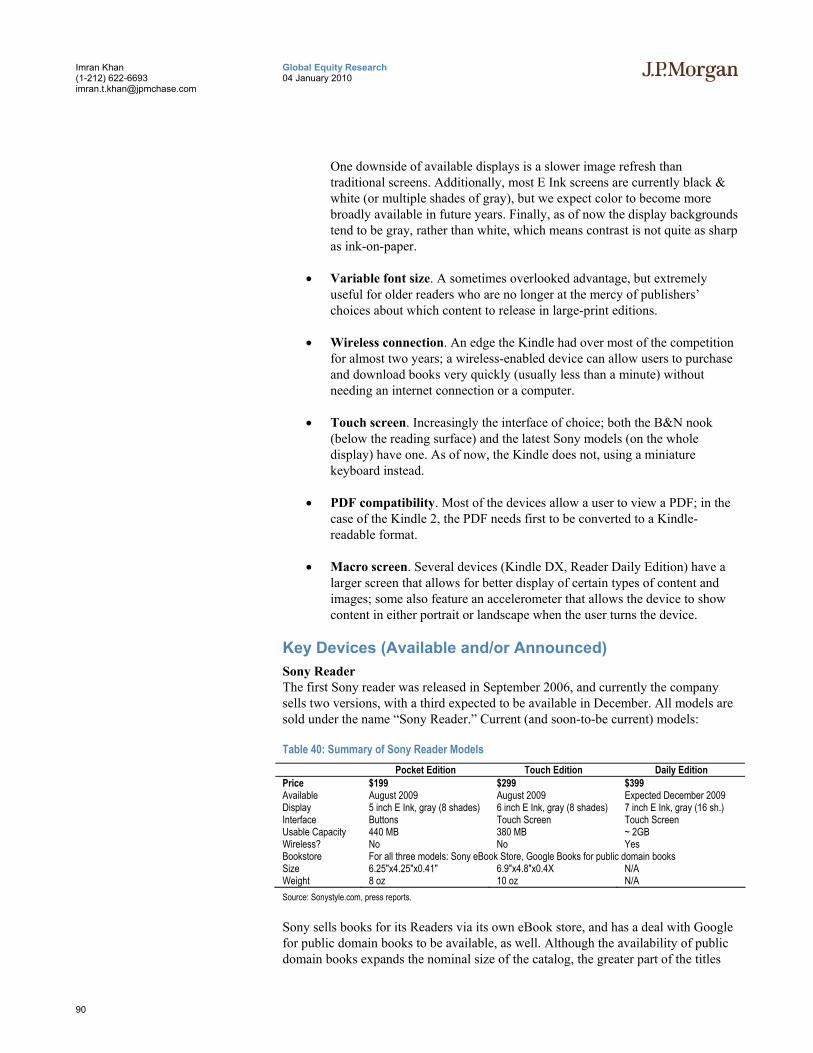
90
Global Equity Research 04 January 2010
Imran Khan (1-212) 622-6693 [email protected]
One downside of available displays is a slower image refresh than traditional screens. Additionally, most E Ink screens are currently black & white (or multiple shades of gray), but we expect color to become more broadly available in future years. Finally, as of now the display backgrounds tend to be gray, rather than white, which means contrast is not quite as sharp as ink-on-paper.
• Variable font size. A sometimes overlooked advantage, but extremely useful for older readers who are no longer at the mercy of publishers’ choices about which content to release in large-print editions.
• Wireless connection. An edge the Kindle had over most of the competition for almost two years; a wireless-enabled device can allow users to purchase and download books very quickly (usually less than a minute) without needing an internet connection or a computer.
• Touch screen. Increasingly the interface of choice; both the B&N nook (below the reading surface) and the latest Sony models (on the whole display) have one. As of now, the Kindle does not, using a miniature keyboard instead.
• PDF compatibility. Most of the devices allow a user to view a PDF; in the case of the Kindle 2, the PDF needs first to be converted to a Kindle-readable format.
• Macro screen. Several devices (Kindle DX, Reader Daily Edition) have a larger screen that allows for better display of certain types of content and images; some also feature an accelerometer that allows the device to show content in either portrait or landscape when the user turns the device.
Key Devices (Available and/or Announced) Sony Reader The first Sony reader was released in September 2006, and currently the company sells two versions, with a third expected to be available in December. All models are sold under the name “Sony Reader.” Current (and soon-to-be current) models:
Table 40: Summary of Sony Reader Models Pocket Edition Touch Edition Daily Edition
Price $199 $299 $399 Available August 2009 August 2009 Expected December 2009 Display 5 inch E Ink, gray (8 shades) 6 inch E Ink, gray (8 shades) 7 inch E Ink, gray (16 sh.) Interface Buttons Touch Screen Touch Screen Usable Capacity 440 MB 380 MB ~ 2GB Wireless? No No Yes Bookstore For all three models: Sony eBook Store, Google Books for public domain books Size 6.25"x4.25"x0.41" 6.9"x4.8"x0.4X N/A Weight 8 oz 10 oz N/A Source: Sonystyle.com, press reports.
Sony sells books for its Readers via its own eBook store, and has a deal with Google for public domain books to be available, as well. Although the availability of public domain books expands the nominal size of the catalog, the greater part of the titles
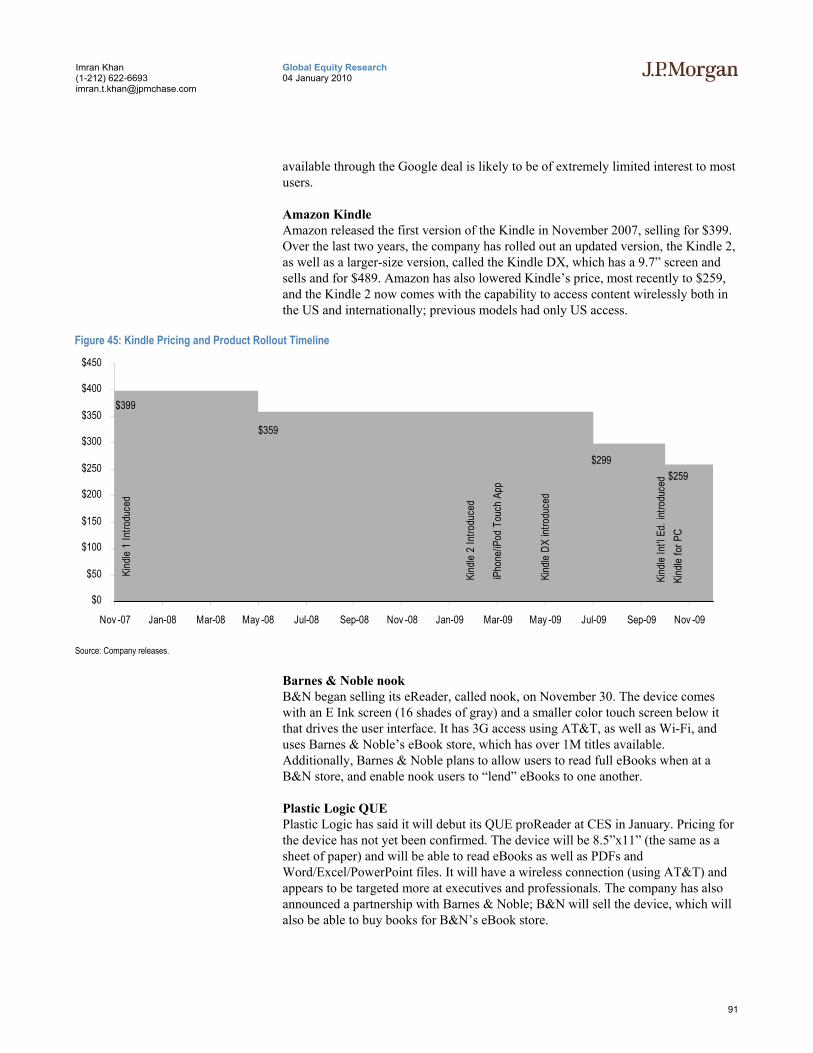
91
Global Equity Research 04 January 2010
Imran Khan (1-212) 622-6693 [email protected]
available through the Google deal is likely to be of extremely limited interest to most users.
Amazon Kindle Amazon released the first version of the Kindle in November 2007, selling for $399. Over the last two years, the company has rolled out an updated version, the Kindle 2, as well as a larger-size version, called the Kindle DX, which has a 9.7” screen and sells and for $489. Amazon has also lowered Kindle’s price, most recently to $259, and the Kindle 2 now comes with the capability to access content wirelessly both in the US and internationally; previous models had only US access.
Figure 45: Kindle Pricing and Product Rollout Timeline
$359
$399
$299$259
Kind
le fo
r PC
Kind
le In
t'l Ed
. int
rodu
ced
Kind
le DX
intro
duce
d
Kind
le 1
Intro
duce
d
Kind
le 2
Intro
duce
d
iPho
ne/iP
od T
ouch
App
$0
$50
$100
$150
$200
$250
$300
$350
$400
$450
Nov -07 Jan-08 Mar-08 May -08 Jul-08 Sep-08 Nov -08 Jan-09 Mar-09 May -09 Jul-09 Sep-09 Nov -09
Source: Company releases.
Barnes & Noble nook B&N began selling its eReader, called nook, on November 30. The device comes with an E Ink screen (16 shades of gray) and a smaller color touch screen below it that drives the user interface. It has 3G access using AT&T, as well as Wi-Fi, and uses Barnes & Noble’s eBook store, which has over 1M titles available. Additionally, Barnes & Noble plans to allow users to read full eBooks when at a B&N store, and enable nook users to “lend” eBooks to one another.
Plastic Logic QUE Plastic Logic has said it will debut its QUE proReader at CES in January. Pricing for the device has not yet been confirmed. The device will be 8.5”x11” (the same as a sheet of paper) and will be able to read eBooks as well as PDFs and Word/Excel/PowerPoint files. It will have a wireless connection (using AT&T) and appears to be targeted more at executives and professionals. The company has also announced a partnership with Barnes & Noble; B&N will sell the device, which will also be able to buy books for B&N’s eBook store.
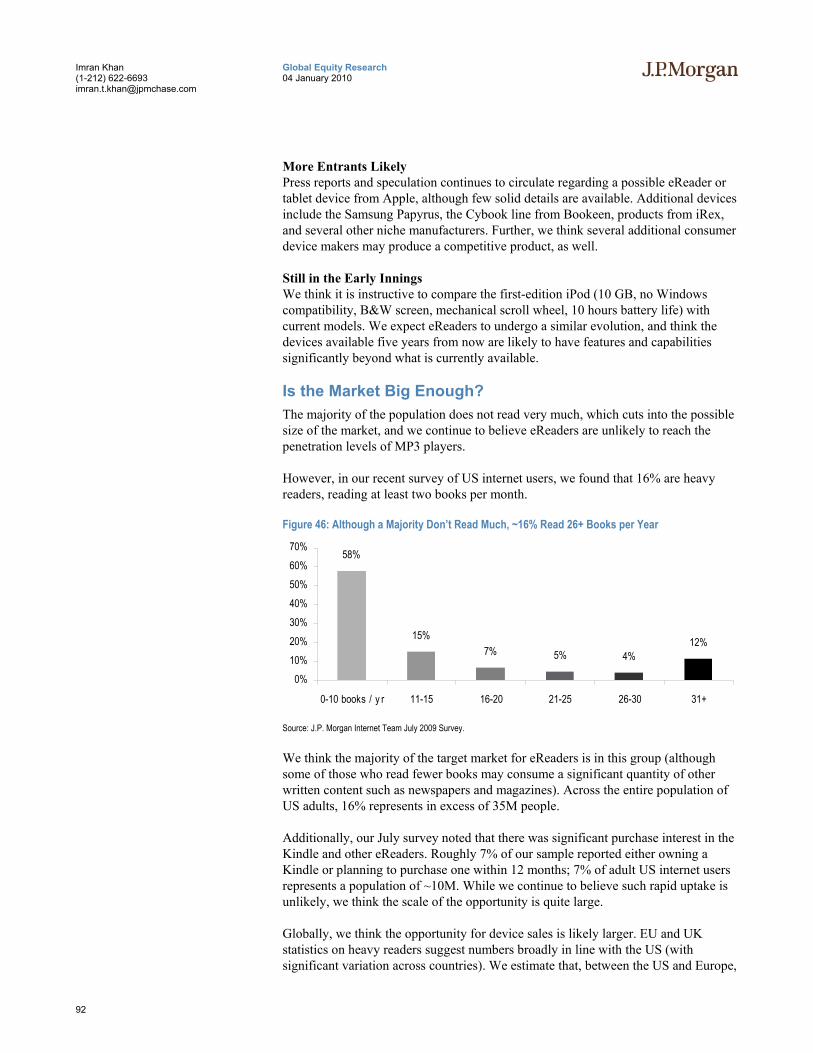
92
Global Equity Research 04 January 2010
Imran Khan (1-212) 622-6693 [email protected]
More Entrants Likely Press reports and speculation continues to circulate regarding a possible eReader or tablet device from Apple, although few solid details are available. Additional devices include the Samsung Papyrus, the Cybook line from Bookeen, products from iRex, and several other niche manufacturers. Further, we think several additional consumer device makers may produce a competitive product, as well.
Still in the Early Innings We think it is instructive to compare the first-edition iPod (10 GB, no Windows compatibility, B&W screen, mechanical scroll wheel, 10 hours battery life) with current models. We expect eReaders to undergo a similar evolution, and think the devices available five years from now are likely to have features and capabilities significantly beyond what is currently available.
Is the Market Big Enough? The majority of the population does not read very much, which cuts into the possible size of the market, and we continue to believe eReaders are unlikely to reach the penetration levels of MP3 players.
However, in our recent survey of US internet users, we found that 16% are heavy readers, reading at least two books per month.
Figure 46: Although a Majority Don’t Read Much, ~16% Read 26+ Books per Year
58%
15%7% 5% 4%
12%
0%10%20%30%40%50%60%70%
0-10 books / y r 11-15 16-20 21-25 26-30 31+
Source: J.P. Morgan Internet Team July 2009 Survey.
We think the majority of the target market for eReaders is in this group (although some of those who read fewer books may consume a significant quantity of other written content such as newspapers and magazines). Across the entire population of US adults, 16% represents in excess of 35M people.
Additionally, our July survey noted that there was significant purchase interest in the Kindle and other eReaders. Roughly 7% of our sample reported either owning a Kindle or planning to purchase one within 12 months; 7% of adult US internet users represents a population of ~10M. While we continue to believe such rapid uptake is unlikely, we think the scale of the opportunity is quite large.
Globally, we think the opportunity for device sales is likely larger. EU and UK statistics on heavy readers suggest numbers broadly in line with the US (with significant variation across countries). We estimate that, between the US and Europe,
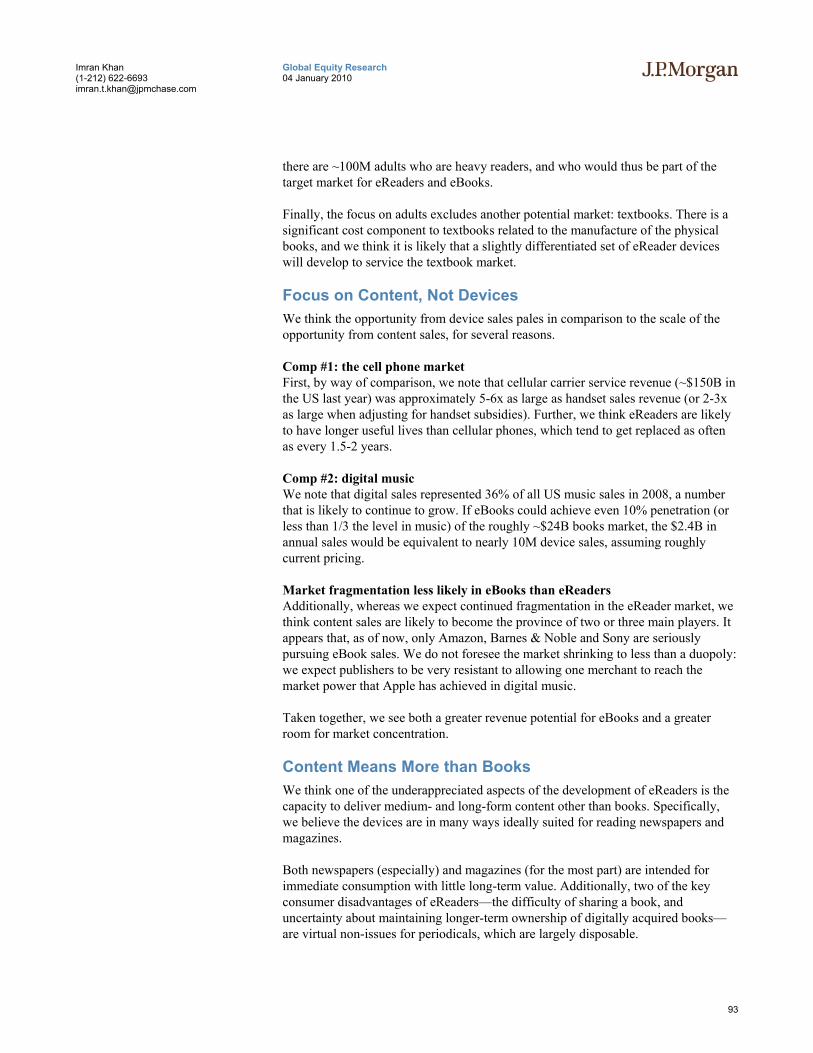
93
Global Equity Research 04 January 2010
Imran Khan (1-212) 622-6693 [email protected]
there are ~100M adults who are heavy readers, and who would thus be part of the target market for eReaders and eBooks.
Finally, the focus on adults excludes another potential market: textbooks. There is a significant cost component to textbooks related to the manufacture of the physical books, and we think it is likely that a slightly differentiated set of eReader devices will develop to service the textbook market.
Focus on Content, Not Devices We think the opportunity from device sales pales in comparison to the scale of the opportunity from content sales, for several reasons.
Comp #1: the cell phone market First, by way of comparison, we note that cellular carrier service revenue (~$150B in the US last year) was approximately 5-6x as large as handset sales revenue (or 2-3x as large when adjusting for handset subsidies). Further, we think eReaders are likely to have longer useful lives than cellular phones, which tend to get replaced as often as every 1.5-2 years.
Comp #2: digital music We note that digital sales represented 36% of all US music sales in 2008, a number that is likely to continue to grow. If eBooks could achieve even 10% penetration (or less than 1/3 the level in music) of the roughly ~$24B books market, the $2.4B in annual sales would be equivalent to nearly 10M device sales, assuming roughly current pricing.
Market fragmentation less likely in eBooks than eReaders Additionally, whereas we expect continued fragmentation in the eReader market, we think content sales are likely to become the province of two or three main players. It appears that, as of now, only Amazon, Barnes & Noble and Sony are seriously pursuing eBook sales. We do not foresee the market shrinking to less than a duopoly: we expect publishers to be very resistant to allowing one merchant to reach the market power that Apple has achieved in digital music.
Taken together, we see both a greater revenue potential for eBooks and a greater room for market concentration.
Content Means More than Books We think one of the underappreciated aspects of the development of eReaders is the capacity to deliver medium- and long-form content other than books. Specifically, we believe the devices are in many ways ideally suited for reading newspapers and magazines.
Both newspapers (especially) and magazines (for the most part) are intended for immediate consumption with little long-term value. Additionally, two of the key consumer disadvantages of eReaders—the difficulty of sharing a book, and uncertainty about maintaining longer-term ownership of digitally acquired books—are virtual non-issues for periodicals, which are largely disposable.

94
Global Equity Research 04 January 2010
Imran Khan (1-212) 622-6693 [email protected]
Business Models Should Evolve We think mass adoption of eReaders could drive changes in the standard business model of selling one book at a time. Below, we sketch out several possibilities for alternative business models. Some of these may succeed; some may never get off the ground:
• The cellular model. After acquiring an eReader (possibly subsidized, like a cell phone), you sign up for a monthly plan that lets you download a certain quantity of reading material each month. Different plans could include or exclude different types of content (e.g., new releases, or specialized business titles, or newspapers). Publishers could license content for a flat rate, or perhaps use revenue sharing with an imputed value for each download (a la Netflix).
• The “Columbia House” model. The user gets a (discounted/free) eReader after agreeing to purchase a specified number of titles over a specified period of time.
• Serialized content. In a world where publishing is not tied to physical paper, writers and publishers may choose to release books chapter-by-chapter, rather than all at once. This runs parallel to:
• Lower-priced content. An eReader combined with a micro-payments platform could allow for sales of content in ways that were not previously practical: e.g., $0.25 for a short story, or perhaps newspapers/magazines that sell individual articles for a few cents apiece.
• Enhanced content. Once writers become more comfortable with the format, a digital book could offer the possibility of a richer user experience, esp. in non-fiction. Much deeper sourcing or footnotes, more inter-linked information, etc.
• A variety of academic and specialty uses. For publications like scientific journals, faster distribution can be combined with a greater depth of content. As with many of the above, publications that are of high value, but only to a low circulation, can benefit significantly from lower distribution costs.
• Textbooks. As noted above, textbooks involve significant manufacturing expenses. A format that allows students to use eReaders instead of textbooks could achieve economies through lower manufacturing cost. Lighter backpacks would be another plus.
• Ad-supported content. We are skeptical of ad-supported books. Reading is too immersive and not well-suited to the interruption of an ad, even if it is targeted well. On the other hand, periodicals, with shorter articles, could well develop an advertising model. We would worry about issues of privacy (since the device seller knows exactly who the device owner is) as well as finding an ad format that’s desirable to advertisers but that does not significantly diminish the user experience.

95
Global Equity Research 04 January 2010
Imran Khan (1-212) 622-6693 [email protected]
• Search. As the devices and their wireless connections improve, we think there could be some capacity for search distribution deals, similar to existing toolbar deals between PC manufacturers and search engines.

97
Global Equity Research 04 January 2010
Imran Khan (1-212) 622-6693 [email protected]
International Sector Outlooks
Inte
rnat
iona
l Sec
tor
Out
look
s

99
Global Equity Research 04 January 2010
Imran Khan (1-212) 622-6693 [email protected]
China Internet Market Overview Internet Penetration Still Low at 25% China’s internet population grew at a rapid pace in 2009, increasing 34% Y/Y to 338MM by June 2009, according to China Internet Network Information Center (CNNIC). Since late 2008, China has the world’s largest internet user base. This strong growth in recent years has been driven by factors such as robust GDP growth, lower-priced computers, more affordable telecom connection fees, government support to internet usage, and low-cost entertainment aspects.
Figure 47: China Internet Users and Penetration Rate
23 27 34 46 59 68 80 87 94 103 123137162210
253298
338368398430
111
0
100
200
300
400
500
600
Dec-
00Ju
n-01
Dec-
01Ju
n-02
Dec-
02Ju
n-03
Dec-
03Ju
n-04
Dec-
04Ju
n-05
Dec-
05Ju
n-06
Dec-
06Ju
n-07
Dec-
07Ju
n-08
Dec-
08Ju
n-09
Dec-
09E
Jun-
10E
Dec-
10E
0%5%10%15%20%25%30%35%
Number of China Internet Users (Left, millions)
Penetration Rate as % of Total Population (Right)
Source: CNNIC J.P. Morgan estimates.
Further, rural internet population continued to adopt the internet in 1H09 with a 13.1% growth rate.
Figure 48: Rural Internet Penetration Reached 28.3% from 5.1% in Two Years
16.9% 21.6%
71.7%
2.6% 5.1%
28.3%
0%
20%
40%
60%
80%
Dec-05 Jun-07 Jun-09
Urban Rural
Source: CNNIC.
100
Global Equity Research 04 January 2010
Imran Khan (1-212) 622-6693 [email protected]
How Much More Growth? Despite this rapid growth, China's internet penetration rate of about 25.2% of the population is still well below that of developed markets like the US, Japan, and Korea (over 70%). We expect internet users to grow by around 17% Y/Y in 2010 to reach ~430MM, or the penetration rate to reach ~32% of the population by the end of 2010.
We draw the parallel between internet penetration and mobile phone penetration in China. We observe that in recent years, internet penetration lags mobile phone penetration by around four to five years. This gives us confidence that internet penetration will likely continue to grow in the future, with lower cost connection fee and equipment costs.
Figure 49: China Internet and Mobile Phone Users
0
100
200
300
400
500
600
700
800
Jun-
99
Jun-
00
Jun-
01
Jun-
02
Jun-
03
Jun-
04
Jun-
05
Jun-
06
Jun-
07
Jun-
08
Jun-
09
Jun-
10
Jun-
11
Jun-
12
Jun-
13
Mobile phone users (Mn) Intenet users (Mn) Mobile users shifted 4.5 years
Source: CNNIC, Ministry of Industry and Information Technology (MIIT), J.P. Morgan estimates.
Broadband and Mobile Continue Rapid Growth According to CNNIC, the number of users with broadband internet access grew 66% Y/Y to 270M (91% of total users) by the end of 2008, and to 319MM (94% of total users) by June 2009.
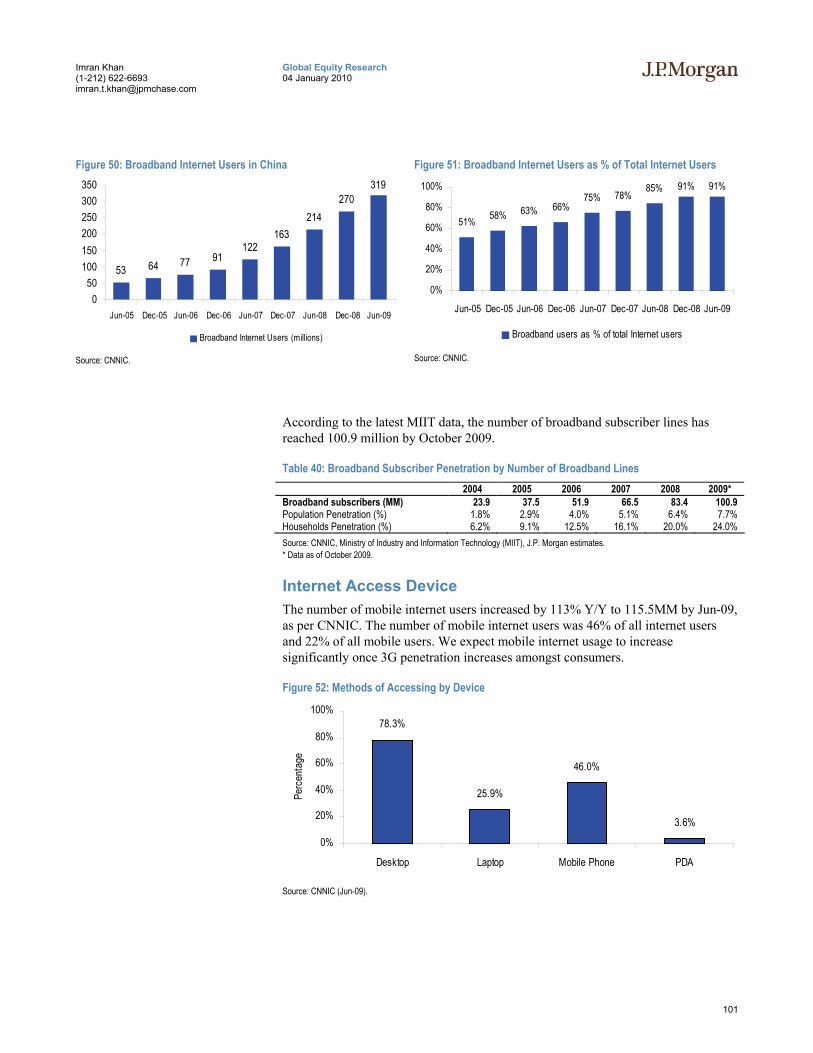
101
Global Equity Research 04 January 2010
Imran Khan (1-212) 622-6693 [email protected]
Figure 50: Broadband Internet Users in China
53 64 77 91122
163214
270319
050
100150200250300350
Jun-05 Dec-05 Jun-06 Dec-06 Jun-07 Dec-07 Jun-08 Dec-08 Jun-09
Broadband Internet Users (millions) Source: CNNIC.
Figure 51: Broadband Internet Users as % of Total Internet Users
51% 58% 63% 66%75% 78%
85% 91% 91%
0%
20%
40%
60%
80%
100%
Jun-05 Dec-05 Jun-06 Dec-06 Jun-07 Dec-07 Jun-08 Dec-08 Jun-09
Broadband users as % of total Internet users
Source: CNNIC.
According to the latest MIIT data, the number of broadband subscriber lines has reached 100.9 million by October 2009.
Table 40: Broadband Subscriber Penetration by Number of Broadband Lines 2004 2005 2006 2007 2008 2009*
Broadband subscribers (MM) 23.9 37.5 51.9 66.5 83.4 100.9 Population Penetration (%) 1.8% 2.9% 4.0% 5.1% 6.4% 7.7% Households Penetration (%) 6.2% 9.1% 12.5% 16.1% 20.0% 24.0% Source: CNNIC, Ministry of Industry and Information Technology (MIIT), J.P. Morgan estimates. * Data as of October 2009.
Internet Access Device The number of mobile internet users increased by 113% Y/Y to 115.5MM by Jun-09, as per CNNIC. The number of mobile internet users was 46% of all internet users and 22% of all mobile users. We expect mobile internet usage to increase significantly once 3G penetration increases amongst consumers.
Figure 52: Methods of Accessing by Device
78.3%
25.9%
46.0%
3.6%
0%
20%
40%
60%
80%
100%
Desktop Laptop Mobile Phone PDA
Perc
enta
ge
Source: CNNIC (Jun-09).
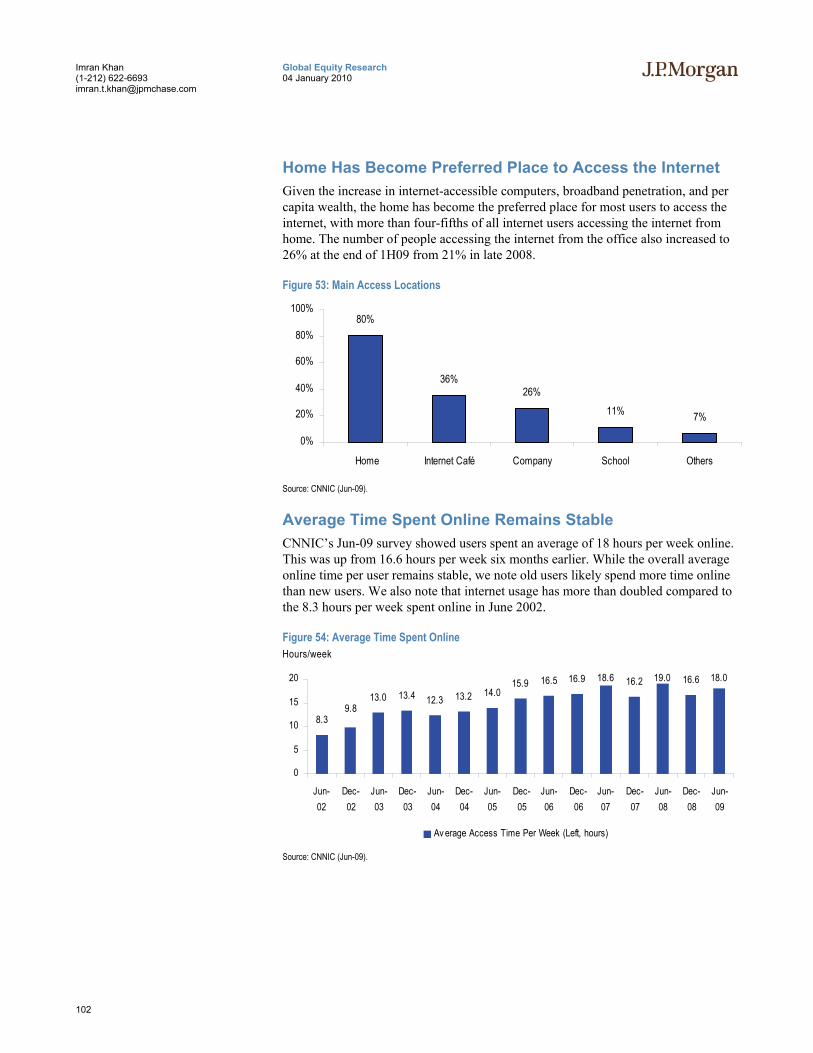
102
Global Equity Research 04 January 2010
Imran Khan (1-212) 622-6693 [email protected]
Home Has Become Preferred Place to Access the Internet Given the increase in internet-accessible computers, broadband penetration, and per capita wealth, the home has become the preferred place for most users to access the internet, with more than four-fifths of all internet users accessing the internet from home. The number of people accessing the internet from the office also increased to 26% at the end of 1H09 from 21% in late 2008.
Figure 53: Main Access Locations
80%
36%26%
11% 7%
0%
20%
40%
60%
80%
100%
Home Internet Café Company School Others
Source: CNNIC (Jun-09).
Average Time Spent Online Remains Stable CNNIC’s Jun-09 survey showed users spent an average of 18 hours per week online. This was up from 16.6 hours per week six months earlier. While the overall average online time per user remains stable, we note old users likely spend more time online than new users. We also note that internet usage has more than doubled compared to the 8.3 hours per week spent online in June 2002.
Figure 54: Average Time Spent Online Hours/week
8.3
13.0 13.4 12.3 13.2 14.015.9 16.5 16.9 18.6 16.2 19.0 16.6 18.0
9.8
0
5
10
15
20
Jun-02
Dec-02
Jun-03
Dec-03
Jun-04
Dec-04
Jun-05
Dec-05
Jun-06
Dec-06
Jun-07
Dec-07
Jun-08
Dec-08
Jun-09
Av erage Access Time Per Week (Left, hours)
Source: CNNIC (Jun-09).
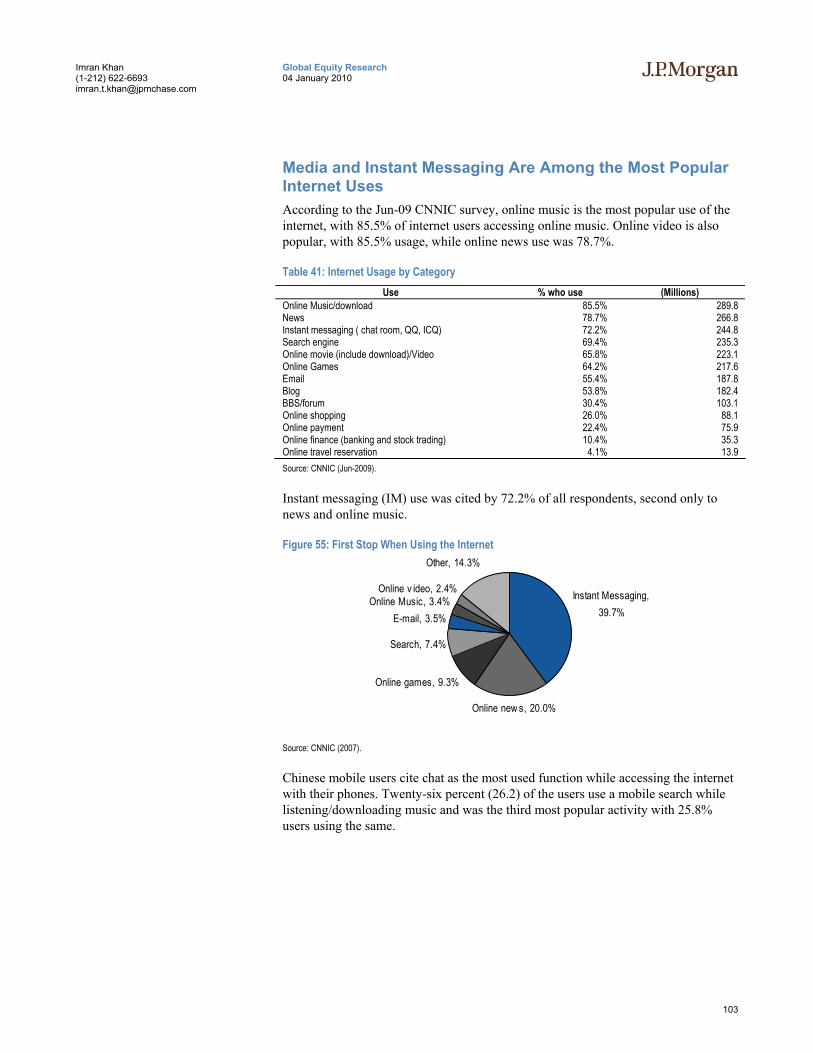
103
Global Equity Research 04 January 2010
Imran Khan (1-212) 622-6693 [email protected]
Media and Instant Messaging Are Among the Most Popular Internet Uses According to the Jun-09 CNNIC survey, online music is the most popular use of the internet, with 85.5% of internet users accessing online music. Online video is also popular, with 85.5% usage, while online news use was 78.7%.
Table 41: Internet Usage by Category Use % who use (Millions)
Online Music/download 85.5% 289.8 News 78.7% 266.8 Instant messaging ( chat room, QQ, ICQ) 72.2% 244.8 Search engine 69.4% 235.3 Online movie (include download)/Video 65.8% 223.1 Online Games 64.2% 217.6 Email 55.4% 187.8 Blog 53.8% 182.4 BBS/forum 30.4% 103.1 Online shopping 26.0% 88.1 Online payment 22.4% 75.9 Online finance (banking and stock trading) 10.4% 35.3 Online travel reservation 4.1% 13.9 Source: CNNIC (Jun-2009).
Instant messaging (IM) use was cited by 72.2% of all respondents, second only to news and online music.
Figure 55: First Stop When Using the Internet
Instant Messaging, 39.7%
Online new s, 20.0%
Online games, 9.3%
Search, 7.4%
E-mail, 3.5%Online Music, 3.4%
Online v ideo, 2.4%
Other, 14.3%
Source: CNNIC (2007).
Chinese mobile users cite chat as the most used function while accessing the internet with their phones. Twenty-six percent (26.2) of the users use a mobile search while listening/downloading music and was the third most popular activity with 25.8% users using the same.
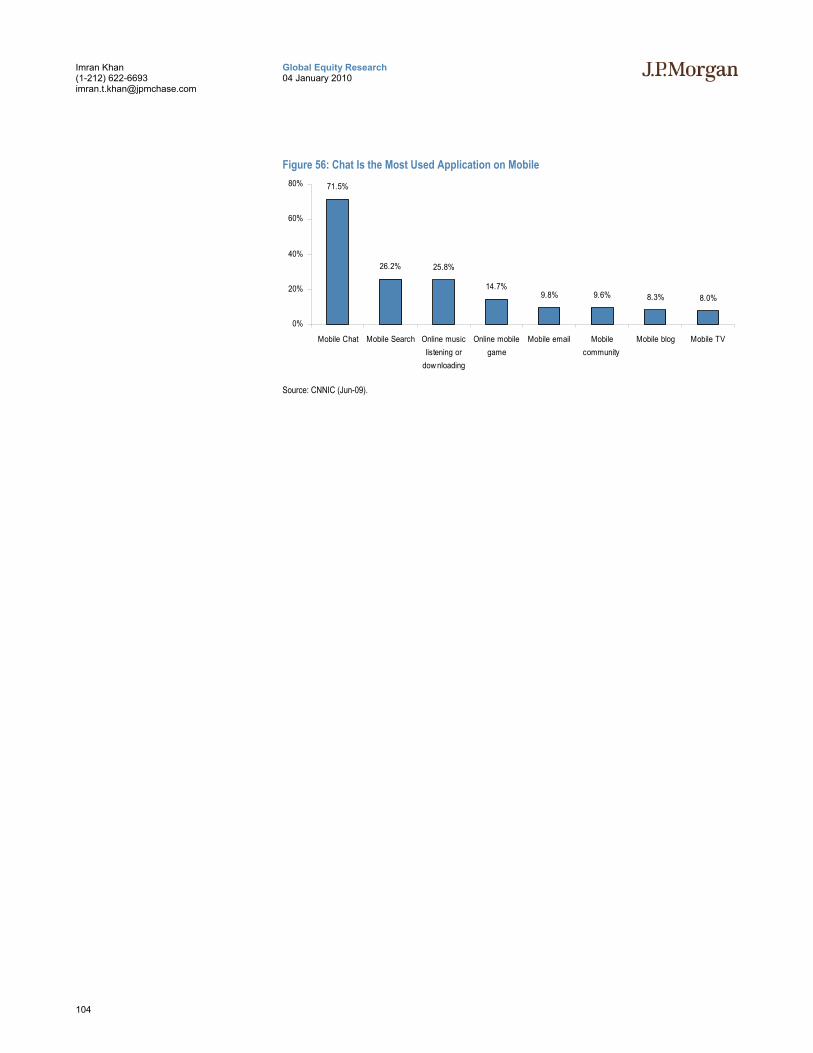
104
Global Equity Research 04 January 2010
Imran Khan (1-212) 622-6693 [email protected]
Figure 56: Chat Is the Most Used Application on Mobile 71.5%
26.2% 25.8%
14.7%9.8% 9.6% 8.3% 8.0%
0%
20%
40%
60%
80%
Mobile Chat Mobile Search Online musiclistening or
dow nloading
Online mobilegame
Mobile email Mobilecommunity
Mobile blog Mobile TV
Source: CNNIC (Jun-09).
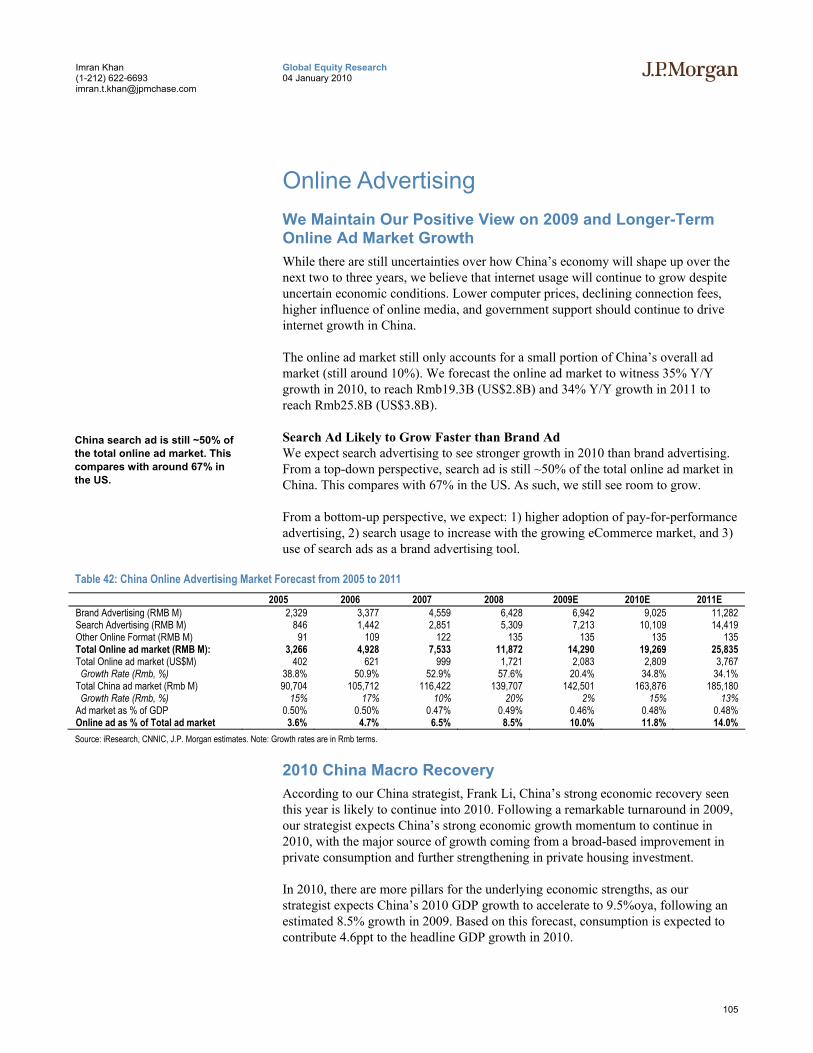
105
Global Equity Research 04 January 2010
Imran Khan (1-212) 622-6693 [email protected]
Online Advertising We Maintain Our Positive View on 2009 and Longer-Term Online Ad Market Growth While there are still uncertainties over how China’s economy will shape up over the next two to three years, we believe that internet usage will continue to grow despite uncertain economic conditions. Lower computer prices, declining connection fees, higher influence of online media, and government support should continue to drive internet growth in China.
The online ad market still only accounts for a small portion of China’s overall ad market (still around 10%). We forecast the online ad market to witness 35% Y/Y growth in 2010, to reach Rmb19.3B (US$2.8B) and 34% Y/Y growth in 2011 to reach Rmb25.8B (US$3.8B).
Search Ad Likely to Grow Faster than Brand Ad We expect search advertising to see stronger growth in 2010 than brand advertising. From a top-down perspective, search ad is still ~50% of the total online ad market in China. This compares with 67% in the US. As such, we still see room to grow.
From a bottom-up perspective, we expect: 1) higher adoption of pay-for-performance advertising, 2) search usage to increase with the growing eCommerce market, and 3) use of search ads as a brand advertising tool.
Table 42: China Online Advertising Market Forecast from 2005 to 2011 2005 2006 2007 2008 2009E 2010E 2011E
Brand Advertising (RMB M) 2,329 3,377 4,559 6,428 6,942 9,025 11,282 Search Advertising (RMB M) 846 1,442 2,851 5,309 7,213 10,109 14,419 Other Online Format (RMB M) 91 109 122 135 135 135 135 Total Online ad market (RMB M): 3,266 4,928 7,533 11,872 14,290 19,269 25,835 Total Online ad market (US$M) 402 621 999 1,721 2,083 2,809 3,767 Growth Rate (Rmb, %) 38.8% 50.9% 52.9% 57.6% 20.4% 34.8% 34.1% Total China ad market (Rmb M) 90,704 105,712 116,422 139,707 142,501 163,876 185,180 Growth Rate (Rmb, %) 15% 17% 10% 20% 2% 15% 13% Ad market as % of GDP 0.50% 0.50% 0.47% 0.49% 0.46% 0.48% 0.48% Online ad as % of Total ad market 3.6% 4.7% 6.5% 8.5% 10.0% 11.8% 14.0% Source: iResearch, CNNIC, J.P. Morgan estimates. Note: Growth rates are in Rmb terms.
2010 China Macro Recovery According to our China strategist, Frank Li, China’s strong economic recovery seen this year is likely to continue into 2010. Following a remarkable turnaround in 2009, our strategist expects China’s strong economic growth momentum to continue in 2010, with the major source of growth coming from a broad-based improvement in private consumption and further strengthening in private housing investment.
In 2010, there are more pillars for the underlying economic strengths, as our strategist expects China’s 2010 GDP growth to accelerate to 9.5%oya, following an estimated 8.5% growth in 2009. Based on this forecast, consumption is expected to contribute 4.6ppt to the headline GDP growth in 2010.
China search ad is still ~50% of the total online ad market. This compares with around 67% in the US.
106
Global Equity Research 04 January 2010
Imran Khan (1-212) 622-6693 [email protected]
A solid expansion in private housing investment as well as other private sector investment: Following strong sales and low investment growth earlier this year, inventory in the property market remains low, paving the way for rising private housing investment going forward. We also look for a gradual stabilization in export–related investment, following the sharp declines earlier in 2009.
Our strategist believes the central government is unlikely to make major adjustments to the monetary policy in the near team. In J.P. Morgan’s view, the central bank will not begin raising benchmark policy rates until mid-2010, when inflation pressure finally builds up (around 3%-4%oya) and export recovery is on more solid footing (with the headline growth rate returning to around 20%oya).
Rmb Will Likely Resume Appreciation in FY10 J.P. Morgan expects the Rmb to be stable for the rest of the year to reflect Chinese authorities’ attempts to support export-related jobs. We believe the government will resume Rmb appreciation in FY10 (J.P. Morgan forecasts Rmb/US$ will reach 6.5 by end-10).
We believe this will be a positive for the US dollar–based share price performance, as US$-based earnings would directly benefit from translation gains.
New Regulations SARFT Act 61 Limits TV Ad Inventory SARFT (The State Administration of Radio, Film and Television) recently published its Measures for the Administration of Broadcasting of Television Advertisements, also called “Act No. 61”. This Act replaces Act 17, which was released in September 2003. The new Act No. 61 will become effective on January 1, 2010.
What Are the Changes? 1) Non-prime hours - TV stations are allowed to show up to 12 minutes (or 20% of time) of commercial ads per hour. The wording in the new act is more restrictive compared to the old act, where it states 20% of a day. Historically, some TV stations put more than 12 minutes of ads during some hours, as long as it still comes under the 20% daily limit.
2) Prime hours (7:00pm – 9:00pm) - TV stations are allowed to show up to 18 minutes (15% of time) of commercials during the two hours. The new act is more flexible compared with the old act. In the old act: TV stations were allowed to show up to 9 minutes of commercial ads per hour.
3) Drama. Drama (or soap opera) is by far the most popular program on TV. Ads placed during drama hours usually demand the highest ad rate.
Prime-time drama: In prime hours (7:00pm – 9:00pm), during each drama episode (45 minutes), TV station can insert only one ad session. Each ad session should not be longer than 1 minute. TV stations can put the remaining 8 minutes of ads before or after the drama episode. The old act had no limit on the number of ad sessions and length of each session during a drama episode. This change is likely to have the most impact to ad revenues.
Non-prime-time drama: During non-prime hours, during each drama episode (45 minutes), TV stations can insert two ad sessions. Each ad session should not be
In J.P. Morgan’s view, the central bank will not begin raising benchmark policy rates until mid-2010
107
Global Equity Research 04 January 2010
Imran Khan (1-212) 622-6693 [email protected]
longer than 1.5 minutes. Old regulations called for only one ad session, lasting no more than 2.5 minutes, during each drama episode. Therefore the new rule allows more ad time to be inserted during each episode. (Total ad minutes per hour remain unchanged at 9 minutes per hour, as stated earlier).
Impact of the New Act The new act limits the flexibility of prime ad allocation during prime hours. Ad rates in in-program are typically higher than those before or after a drama. In particular, TV stations may have to air 4-8 minutes of ads before or after the drama. These long ad sessions typically demand lower rates. According to CTR China research, after the implementation of Act 61 (assuming stable ad price per minute), Rmb 10 billion of ad dollars will vanish.
(1) Local and regional TV stations to raise prices – helps shift ad dollars online In order to compensate for the potential loss in ad revenue, many local and regional satellite TV stations raise ad prices. For example, Hunan Satellite TV (one of China’s leading satellite TV stations) raised rates by 25% during popular shows. Other satellite TV stations, such as, Zhejiang Satellite TV, Shangdong Satellite TV, and Jiangsu Satellite TV have raised rates by 30% for 2010.
With high ad rates on TV, we expect advertisers to shift some ad dollars from TV to higher ROI media such as online and outdoor (such as bus TV).
(2) More implanted ads on TV drama TV stations likely to explore new formats of advertising, such as implanted ad, title sponsorships to increase ad revenue.
(3) More innovation in TV content With more restrictions on dramas, TV stations are likely to explore and create newer types of TV content, such as game shows, non-script programs, etc. We believe this will help the overall development of the content market in China.
New Regulations on TV Shopping In September, 2009 SARFT also issued new TV shopping regulations that will become effective on January 1, 2010. The key points are:
(1) All infomercials will be classified and regulated under the same manner as TV commercials. Advertising airtime is limited to 12 minutes per hour, and 18 minutes total between 7:00 p.m. and 9:00 p.m. Satellite channels are not allowed to broadcast infomercial programs between 6:00 p.m. and midnight. Infomercials are banned on news channels, international channels, and home shopping channels.
(2) All infomercials shall clearly identify the advertisers and guarantee “unconditional return” after certain days of sales and “payment upon product inspection.”
(3) The qualified infomercial companies must have (i) registered capital above CNY10 million; (ii) regular operation offices; (iii) a call center with more than 100 seats, an established logistic and payment settlement system; (iv) well-established after market, claims systems; (v) no fraudulent records in the past three years.

108
Global Equity Research 04 January 2010
Imran Khan (1-212) 622-6693 [email protected]
4) Encourage industry association or third-party mediators to establish “Quality Assurance Fund” to protect consumer interests.
While we do not believe TV shopping regulatory changes will directly impact online advertising, we believe more TV shopping companies will turn to online direct sales (B2C) to expand revenue. This shall indirectly benefit eCommerce-related ad spending through display and search ads.
2010: An Eventful Year Typically even years are more eventful years. For 2010, we expect events to drive higher ad spending with internet users becoming more engaged with these events over the internet.
FIFA World Cup 2010 This year the FIFA World Cup will be hosted by South Africa from June 11 to July 3 with 64 matches. Soccer is the most popular sport in China, and advertisers are likely to increase ad spending related to the events, such as FMCG, autos, and IT products.
Shanghai World Expo The World Expo will be held in Shanghai from May 1 to October 31, 2010. This is the first World Exposition in a developing country, which shows the world's expectations for China's future development. The organizing committee expects 70 million visitors to the Expo. We believe some additional ad spending will be allocated to internet as well.
16th Asian Games in Guangzhou While this every fourth year event is less prominent than the Olympics, we expect sports and FMCG advertisers will increase ad spending related to this event as well.
Online Advertising: Top-Down Perspective Internet Usage Growth – Same Old Story, But Is That What Is Driving the Online Ad Spending Growth Expected in 2009? We expect China's internet user base to grow around 20% CAGR (2009–11) to 36% penetration, from its current penetration rate of 25%. As mentioned earlier, this is driven by lower-priced computers, more affordable telecom connection fees, government support of internet usage, low-cost entertainment aspects, etc. As of June 2009, the number of internet users in China was 338 million (or 25% of the population). By the end of 2010, we expect the internet population to reach ~430 million (or 32% of the population).
We believe if the number of internet users grows 20% Y/Y (or roughly equal to the increase in media consumption), ~20% Y/Y growth in online brand ad spending should be achievable, given: 1) higher number of hours spent online per user, 2) the internet can reach a broader audience in smaller cities in China, 3) more measurable and lower cost compared with traditional media like TV, 4) general inflation in advertising rates, and 5) GDP growth should also drive overall ad spending up.
GDP Growth around 8%: Added to 20% Internet User Growth = Potential 28% Growth According to J.P. Morgan Strategist Frank Li, China's GDP growth can likely reach around “8%” oya in 2010.
109
Global Equity Research 04 January 2010
Imran Khan (1-212) 622-6693 [email protected]
U.S. Advertising Spending = 2% of GDP vs. China’s 0.5% Ad spend as a percent of GDP in China is still below the US level; as such, we still believe advertising in China can grow at least in line with GDP. Online ads should grow even faster. Therefore, a projection for flat growth is quite bearish, in our view.
Online Advertising: Bottom-Up Perspective Many investors are concerned about trends in a few significant sectors for online advertising: automobiles, real estate and financial services.
Automobiles Advertising Automobile sales have registered a record high in November 2009. Our auto analyst expects auto sales to continue to be strong in 2010, driven by government subsidies and a low interest rate environment.
Driver 1: Increase auto ad dollar In 2009, auto sales have reached a record due to heavy government subsidies. This indeed means less advertising is needed by auto makers. In 2010, we believe the auto sales environment will become more competitive with less government subsidies and a more aggressive auto launch schedule.
Driver 2: Increased Online Allocation Currently ~10% of automobiles advertising budget is allocated online in China, according to CTR Market Research. We believe that with internet population growing, more measurable results, and lower rates vs. TV, automobile companies will continue to increase budget allocation to online advertising.
In addition, we believe more money will be directed to drive product sales (through advertising particular models, driving traffic for test drives) rather than general branding exercise. In our opinion, a product-specific campaign would be more effective over the internet as Chinese consumers tend to do a lot of their own research before their first car purchase.
Driver 3: Geographic expansion in autos sales As we believe lower-tier cities will be seeing faster autos sales in the next few years, we believe advertisers would also be well served by investing more on the internet for nationwide customer reach (rather than magazine and newspaper, which has limited geographic coverage).
Real Estate Advertising Real Estate sales to remain healthy in 2010 but more competitive In 2009, private real estate was very strong driven by loose government policies and a low-interest rate environment. Hence, buyers actually line up to buy properties (less advertising is needed).With potentially tighter government policies and higher inventory, we expect the sales environment will become more competitive in 2010. This would benefit ad spend by property developers.
A Geographic Diversification Story Beyond Beijing Online real estate advertisers for Sina and Sohu are still concentrated around the Beijing area. Currently, more than 50% of Sina’s and Sohu’s real estate ads are from the Beijing area. We expect that adoption of online real estate ads will drive Sina’s (CRIC) ad sales. This is the trend Sina expects in 4Q09. eHouse/CRIC has offices in

110
Global Equity Research 04 January 2010
Imran Khan (1-212) 622-6693 [email protected]
more than 30 cities across China, and should be able to help Sina drive ad revenue outside of Beijing.
Even in the City of Beijing, Online Ad Growth Is Likely Despite Market Slowdown From our checks with other private real estate portals in Beijing, those sites are still seeing acceleration in online ad spending. We believe 1) online is an effective medium, and 2) the only way for real estate companies to relieve themselves of current inventories is to cut price and increase promotions.
Financial Services Advertising Investment funds increased their overall ad budgets in late 2007 and 2008; however, we’ve seen a significant pullback in 2009. With a better macro environment, we think these advertisers will likely come back in 2010. These advertisers likely advertise with Sina and Sohu. We think new drivers for the next few years could be insurance companies, personal banking, and wealth management advertisements.
Fast-Moving Consumer Goods Historically, these advertisers allocated less spending online. We expect the trend to continue to change with more allocation online, given a large internet population, a wider online demographic, and more integrated marketing campaign required to differentiate a brand.
Telecom Sector Spending In 2009, Sina benefited from 3G-related advertising spending. We expect telcos to diversify their spending online to different portals, with good results from Sina. We expect telcos will continue to invest in advertising, in order to drive 3G adoption (government–mandated strategy) and higher competition in the space with operators trying to recoup their capex spending.
Good CCTV 2010 Prime Time Auction Results Set Positive Tone for 2010 Ad Market Every year on November 18, CCTV (China Central Television) holds an advertising auction for the next year’s prime time ad resources on CCTV channels. This important event auctions off ~15% of the country’s total TV ad spending and sets the tone for ad growth in the coming year.
CCTV reported prime time ad revenue of Rmb10.97B, up 18.5% Y/Y: This is slightly above the high end of industry expectations of around 15%. We see the following implications: 1) while advertisers are generally cautiously optimistic about 2010’s outlook, the auction results suggest consensus (hundreds of advertisers participated) is more optimistic than cautious; 2) with the CCTV auction setting a positive tone, the online brand ad rate is likely to achieve >20% growth; 3) published rates for leading portals and media are likely to increase next year.
We continue to expect the online branded ad segment to benefit from decent 2010 overall ad market growth as well as increased online ad allocation.
We look at absolute dollar amounts of ads sold at the auction. The table below shows the auction results growth rate vs. online brand ad growth rate (in Rmb terms).

111
Global Equity Research 04 January 2010
Imran Khan (1-212) 622-6693 [email protected]
Table 43: CCTV Auction Results vs. Online Brand Ad Growth Year CCTV Prime time
Auction Revenue (Rmb billion)
YoY Growth Online Brand Ad Growth
Number of times (X): [Online Brand Ad Growth / CCTV
Auction Growth Ratio] 2003 3.31 26% 102% 3.9 2004 4.41 33% 72% 2.2 2005 5.25 19% 37% 2.0 2006 5.87 12% 45% 3.8 2007 6.80 16% 35% 2.2 2008 8.03 18% 41% 2.3 2009 9.26 15% 8% 0.5
2010E 10.97 19% 30% 1.6 Source: CCTV, ZenithOptimedia. Note: J. P. Morgan current estimates.
Industry Segments From the auction results, we note a few highlights:
• Home improvements industry (hardware store, paints, furniture) ad budget up over 110% YoY
• Home electronics up over 80% YoY
• Automobiles up over 70% YoY
We are encouraged to see good growth in autos and home improvements areas in CCTV auction. These segments account for more than 25% of portal's revenue.
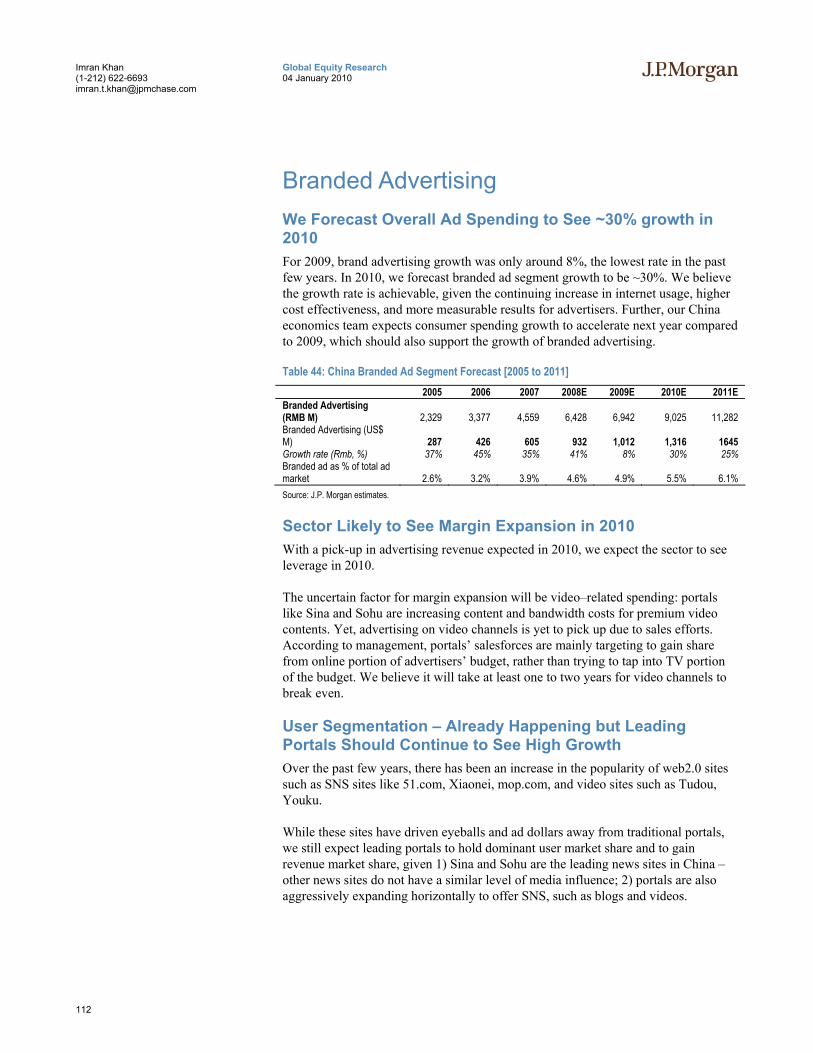
112
Global Equity Research 04 January 2010
Imran Khan (1-212) 622-6693 [email protected]
Branded Advertising We Forecast Overall Ad Spending to See ~30% growth in 2010 For 2009, brand advertising growth was only around 8%, the lowest rate in the past few years. In 2010, we forecast branded ad segment growth to be ~30%. We believe the growth rate is achievable, given the continuing increase in internet usage, higher cost effectiveness, and more measurable results for advertisers. Further, our China economics team expects consumer spending growth to accelerate next year compared to 2009, which should also support the growth of branded advertising.
Table 44: China Branded Ad Segment Forecast [2005 to 2011] 2005 2006 2007 2008E 2009E 2010E 2011E
Branded Advertising (RMB M) 2,329 3,377 4,559 6,428 6,942 9,025 11,282 Branded Advertising (US$ M) 287 426 605 932 1,012 1,316 1645 Growth rate (Rmb, %) 37% 45% 35% 41% 8% 30% 25% Branded ad as % of total ad market 2.6% 3.2% 3.9% 4.6% 4.9% 5.5% 6.1% Source: J.P. Morgan estimates.
Sector Likely to See Margin Expansion in 2010 With a pick-up in advertising revenue expected in 2010, we expect the sector to see leverage in 2010.
The uncertain factor for margin expansion will be video–related spending: portals like Sina and Sohu are increasing content and bandwidth costs for premium video contents. Yet, advertising on video channels is yet to pick up due to sales efforts. According to management, portals’ salesforces are mainly targeting to gain share from online portion of advertisers’ budget, rather than trying to tap into TV portion of the budget. We believe it will take at least one to two years for video channels to break even.
User Segmentation – Already Happening but Leading Portals Should Continue to See High Growth Over the past few years, there has been an increase in the popularity of web2.0 sites such as SNS sites like 51.com, Xiaonei, mop.com, and video sites such as Tudou, Youku.
While these sites have driven eyeballs and ad dollars away from traditional portals, we still expect leading portals to hold dominant user market share and to gain revenue market share, given 1) Sina and Sohu are the leading news sites in China –other news sites do not have a similar level of media influence; 2) portals are also aggressively expanding horizontally to offer SNS, such as blogs and videos.
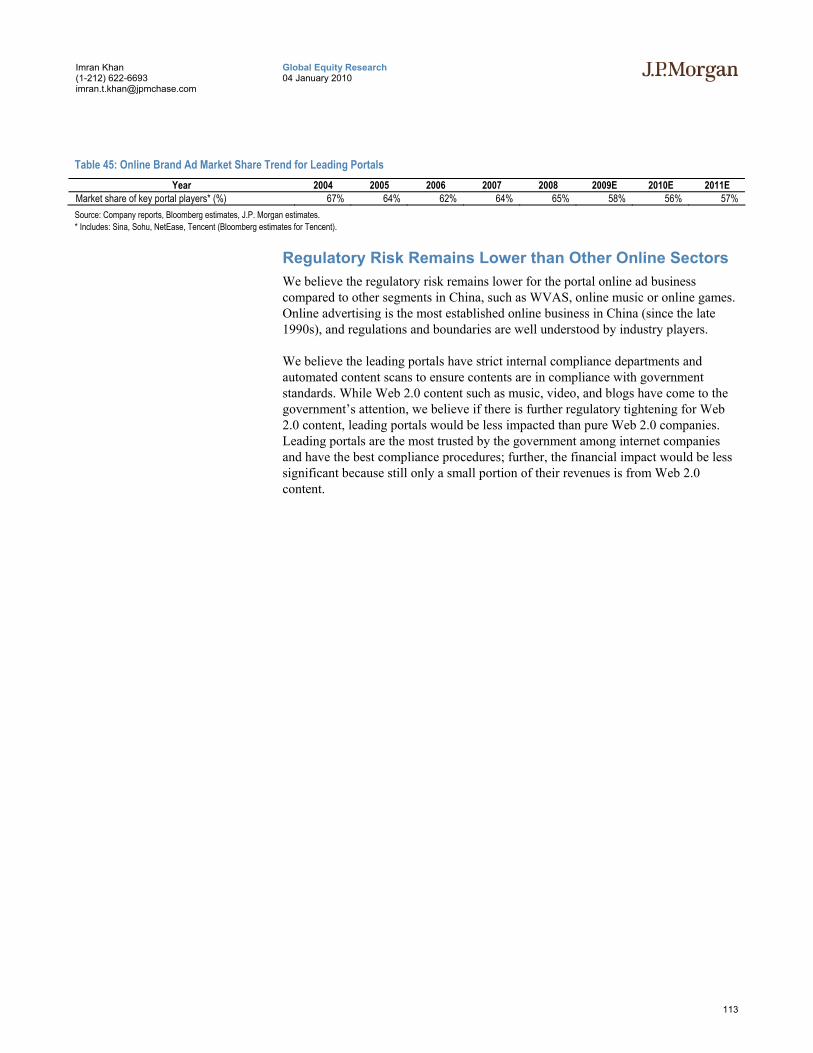
113
Global Equity Research 04 January 2010
Imran Khan (1-212) 622-6693 [email protected]
Table 45: Online Brand Ad Market Share Trend for Leading Portals Year 2004 2005 2006 2007 2008 2009E 2010E 2011E
Market share of key portal players* (%) 67% 64% 62% 64% 65% 58% 56% 57% Source: Company reports, Bloomberg estimates, J.P. Morgan estimates. * Includes: Sina, Sohu, NetEase, Tencent (Bloomberg estimates for Tencent).
Regulatory Risk Remains Lower than Other Online Sectors We believe the regulatory risk remains lower for the portal online ad business compared to other segments in China, such as WVAS, online music or online games. Online advertising is the most established online business in China (since the late 1990s), and regulations and boundaries are well understood by industry players.
We believe the leading portals have strict internal compliance departments and automated content scans to ensure contents are in compliance with government standards. While Web 2.0 content such as music, video, and blogs have come to the government’s attention, we believe if there is further regulatory tightening for Web 2.0 content, leading portals would be less impacted than pure Web 2.0 companies. Leading portals are the most trusted by the government among internet companies and have the best compliance procedures; further, the financial impact would be less significant because still only a small portion of their revenues is from Web 2.0 content.
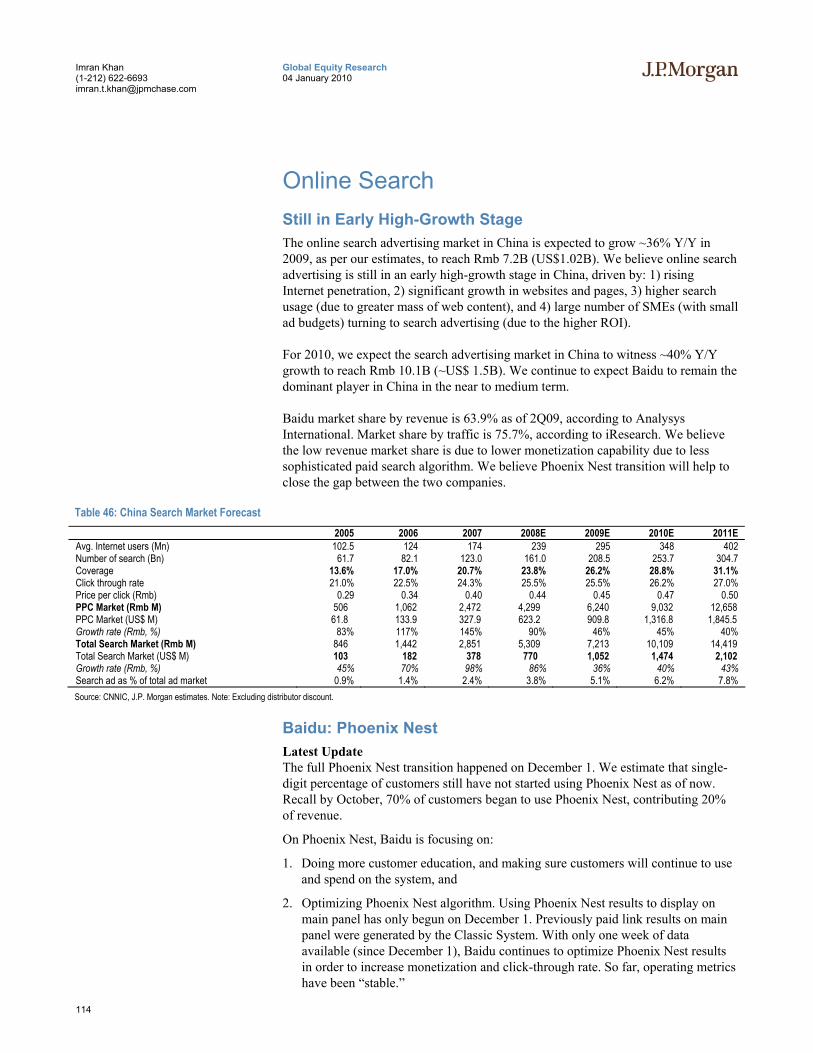
114
Global Equity Research 04 January 2010
Imran Khan (1-212) 622-6693 [email protected]
Online Search Still in Early High-Growth Stage The online search advertising market in China is expected to grow ~36% Y/Y in 2009, as per our estimates, to reach Rmb 7.2B (US$1.02B). We believe online search advertising is still in an early high-growth stage in China, driven by: 1) rising Internet penetration, 2) significant growth in websites and pages, 3) higher search usage (due to greater mass of web content), and 4) large number of SMEs (with small ad budgets) turning to search advertising (due to the higher ROI).
For 2010, we expect the search advertising market in China to witness ~40% Y/Y growth to reach Rmb 10.1B (~US$ 1.5B). We continue to expect Baidu to remain the dominant player in China in the near to medium term.
Baidu market share by revenue is 63.9% as of 2Q09, according to Analysys International. Market share by traffic is 75.7%, according to iResearch. We believe the low revenue market share is due to lower monetization capability due to less sophisticated paid search algorithm. We believe Phoenix Nest transition will help to close the gap between the two companies.
Table 46: China Search Market Forecast 2005 2006 2007 2008E 2009E 2010E 2011E
Avg. Internet users (Mn) 102.5 124 174 239 295 348 402 Number of search (Bn) 61.7 82.1 123.0 161.0 208.5 253.7 304.7 Coverage 13.6% 17.0% 20.7% 23.8% 26.2% 28.8% 31.1% Click through rate 21.0% 22.5% 24.3% 25.5% 25.5% 26.2% 27.0% Price per click (Rmb) 0.29 0.34 0.40 0.44 0.45 0.47 0.50 PPC Market (Rmb M) 506 1,062 2,472 4,299 6,240 9,032 12,658 PPC Market (US$ M) 61.8 133.9 327.9 623.2 909.8 1,316.8 1,845.5 Growth rate (Rmb, %) 83% 117% 145% 90% 46% 45% 40% Total Search Market (Rmb M) 846 1,442 2,851 5,309 7,213 10,109 14,419 Total Search Market (US$ M) 103 182 378 770 1,052 1,474 2,102 Growth rate (Rmb, %) 45% 70% 98% 86% 36% 40% 43% Search ad as % of total ad market 0.9% 1.4% 2.4% 3.8% 5.1% 6.2% 7.8% Source: CNNIC, J.P. Morgan estimates. Note: Excluding distributor discount.
Baidu: Phoenix Nest Latest Update The full Phoenix Nest transition happened on December 1. We estimate that single-digit percentage of customers still have not started using Phoenix Nest as of now. Recall by October, 70% of customers began to use Phoenix Nest, contributing 20% of revenue.
On Phoenix Nest, Baidu is focusing on:
1. Doing more customer education, and making sure customers will continue to use and spend on the system, and
2. Optimizing Phoenix Nest algorithm. Using Phoenix Nest results to display on main panel has only begun on December 1. Previously paid link results on main panel were generated by the Classic System. With only one week of data available (since December 1), Baidu continues to optimize Phoenix Nest results in order to increase monetization and click-through rate. So far, operating metrics have been “stable.”
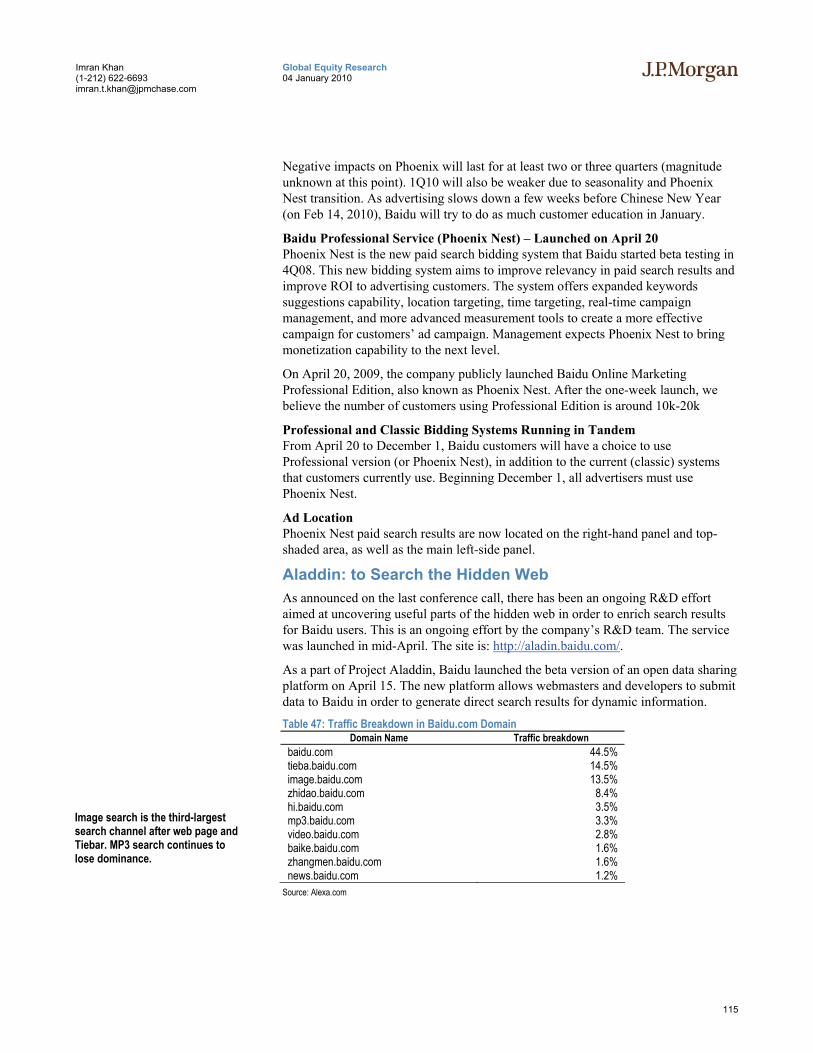
115
Global Equity Research 04 January 2010
Imran Khan (1-212) 622-6693 [email protected]
Negative impacts on Phoenix will last for at least two or three quarters (magnitude unknown at this point). 1Q10 will also be weaker due to seasonality and Phoenix Nest transition. As advertising slows down a few weeks before Chinese New Year (on Feb 14, 2010), Baidu will try to do as much customer education in January.
Baidu Professional Service (Phoenix Nest) – Launched on April 20 Phoenix Nest is the new paid search bidding system that Baidu started beta testing in 4Q08. This new bidding system aims to improve relevancy in paid search results and improve ROI to advertising customers. The system offers expanded keywords suggestions capability, location targeting, time targeting, real-time campaign management, and more advanced measurement tools to create a more effective campaign for customers’ ad campaign. Management expects Phoenix Nest to bring monetization capability to the next level.
On April 20, 2009, the company publicly launched Baidu Online Marketing Professional Edition, also known as Phoenix Nest. After the one-week launch, we believe the number of customers using Professional Edition is around 10k-20k
Professional and Classic Bidding Systems Running in Tandem From April 20 to December 1, Baidu customers will have a choice to use Professional version (or Phoenix Nest), in addition to the current (classic) systems that customers currently use. Beginning December 1, all advertisers must use Phoenix Nest.
Ad Location Phoenix Nest paid search results are now located on the right-hand panel and top-shaded area, as well as the main left-side panel.
Aladdin: to Search the Hidden Web As announced on the last conference call, there has been an ongoing R&D effort aimed at uncovering useful parts of the hidden web in order to enrich search results for Baidu users. This is an ongoing effort by the company’s R&D team. The service was launched in mid-April. The site is: http://aladin.baidu.com/.
As a part of Project Aladdin, Baidu launched the beta version of an open data sharing platform on April 15. The new platform allows webmasters and developers to submit data to Baidu in order to generate direct search results for dynamic information.
Table 47: Traffic Breakdown in Baidu.com Domain Domain Name Traffic breakdown
baidu.com 44.5% tieba.baidu.com 14.5% image.baidu.com 13.5% zhidao.baidu.com 8.4% hi.baidu.com 3.5% mp3.baidu.com 3.3% video.baidu.com 2.8% baike.baidu.com 1.6% zhangmen.baidu.com 1.6% news.baidu.com 1.2%
Source: Alexa.com
Image search is the third-largest search channel after web page and Tiebar. MP3 search continues to lose dominance.
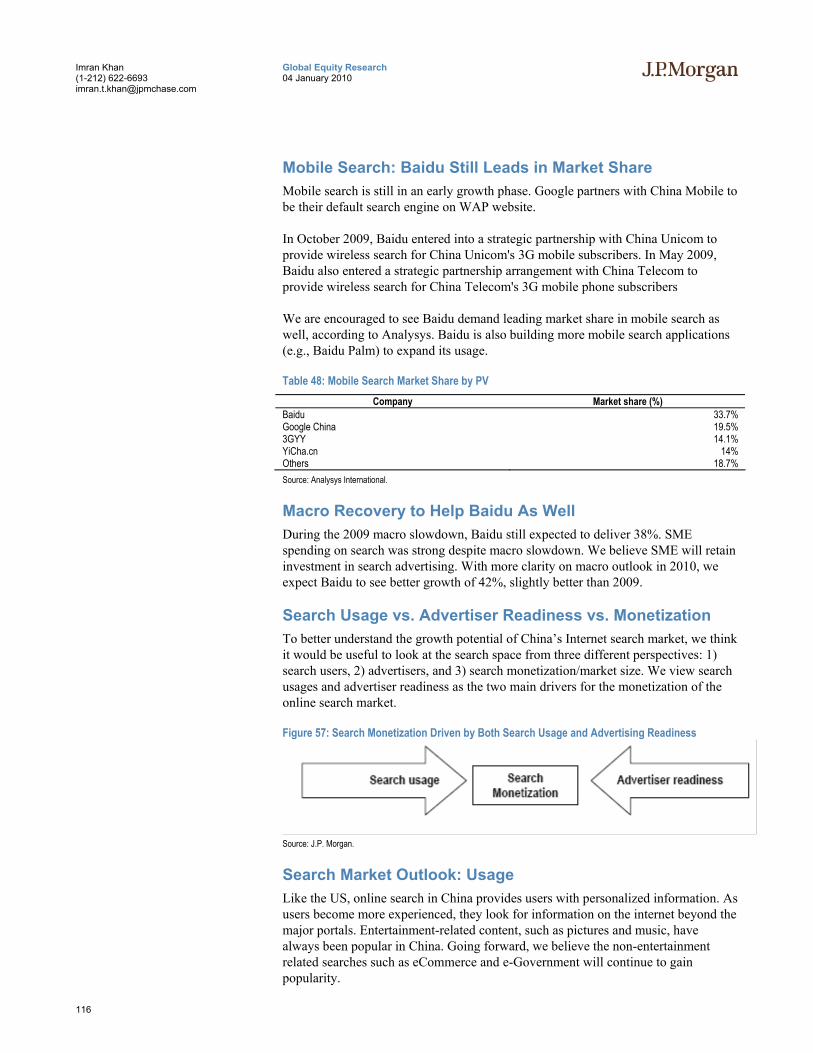
116
Global Equity Research 04 January 2010
Imran Khan (1-212) 622-6693 [email protected]
Mobile Search: Baidu Still Leads in Market Share Mobile search is still in an early growth phase. Google partners with China Mobile to be their default search engine on WAP website.
In October 2009, Baidu entered into a strategic partnership with China Unicom to provide wireless search for China Unicom's 3G mobile subscribers. In May 2009, Baidu also entered a strategic partnership arrangement with China Telecom to provide wireless search for China Telecom's 3G mobile phone subscribers
We are encouraged to see Baidu demand leading market share in mobile search as well, according to Analysys. Baidu is also building more mobile search applications (e.g., Baidu Palm) to expand its usage.
Table 48: Mobile Search Market Share by PV Company Market share (%)
Baidu 33.7% Google China 19.5% 3GYY 14.1% YiCha.cn 14% Others 18.7% Source: Analysys International.
Macro Recovery to Help Baidu As Well During the 2009 macro slowdown, Baidu still expected to deliver 38%. SME spending on search was strong despite macro slowdown. We believe SME will retain investment in search advertising. With more clarity on macro outlook in 2010, we expect Baidu to see better growth of 42%, slightly better than 2009.
Search Usage vs. Advertiser Readiness vs. Monetization To better understand the growth potential of China’s Internet search market, we think it would be useful to look at the search space from three different perspectives: 1) search users, 2) advertisers, and 3) search monetization/market size. We view search usages and advertiser readiness as the two main drivers for the monetization of the online search market.
Figure 57: Search Monetization Driven by Both Search Usage and Advertising Readiness
Source: J.P. Morgan.
Search Market Outlook: Usage Like the US, online search in China provides users with personalized information. As users become more experienced, they look for information on the internet beyond the major portals. Entertainment-related content, such as pictures and music, have always been popular in China. Going forward, we believe the non-entertainment related searches such as eCommerce and e-Government will continue to gain popularity.
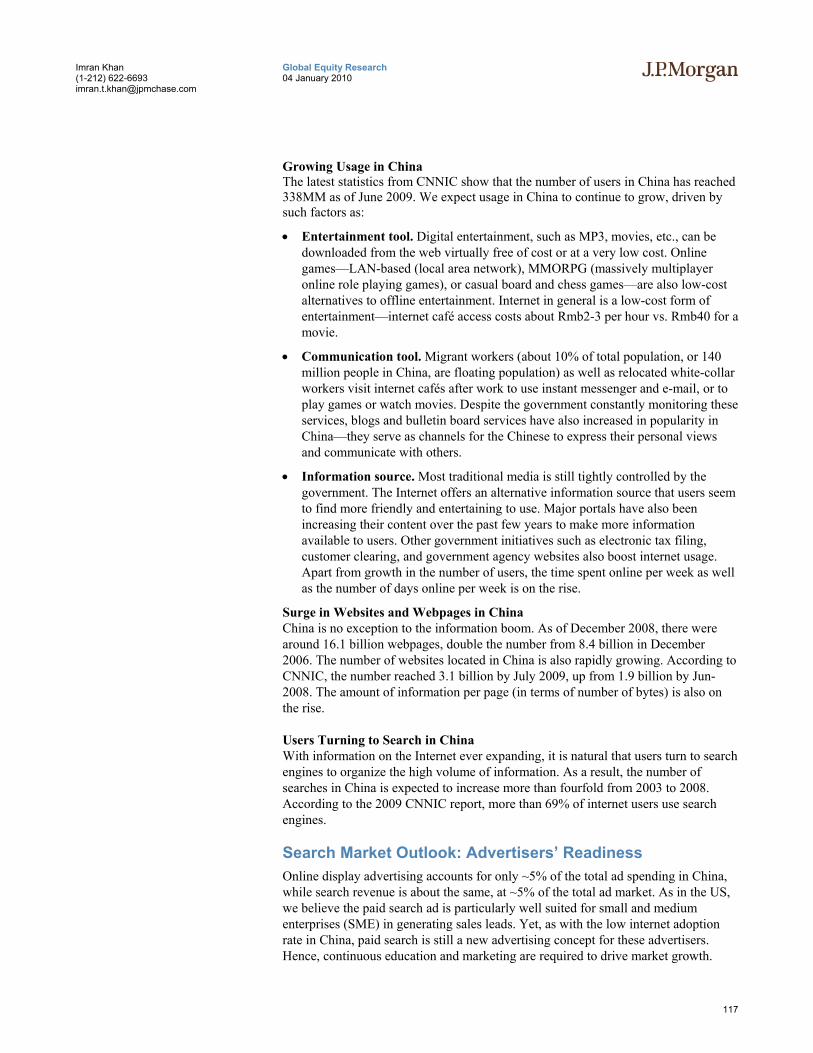
117
Global Equity Research 04 January 2010
Imran Khan (1-212) 622-6693 [email protected]
Growing Usage in China The latest statistics from CNNIC show that the number of users in China has reached 338MM as of June 2009. We expect usage in China to continue to grow, driven by such factors as:
• Entertainment tool. Digital entertainment, such as MP3, movies, etc., can be downloaded from the web virtually free of cost or at a very low cost. Online games—LAN-based (local area network), MMORPG (massively multiplayer online role playing games), or casual board and chess games—are also low-cost alternatives to offline entertainment. Internet in general is a low-cost form of entertainment—internet café access costs about Rmb2-3 per hour vs. Rmb40 for a movie.
• Communication tool. Migrant workers (about 10% of total population, or 140 million people in China, are floating population) as well as relocated white-collar workers visit internet cafés after work to use instant messenger and e-mail, or to play games or watch movies. Despite the government constantly monitoring these services, blogs and bulletin board services have also increased in popularity in China—they serve as channels for the Chinese to express their personal views and communicate with others.
• Information source. Most traditional media is still tightly controlled by the government. The Internet offers an alternative information source that users seem to find more friendly and entertaining to use. Major portals have also been increasing their content over the past few years to make more information available to users. Other government initiatives such as electronic tax filing, customer clearing, and government agency websites also boost internet usage. Apart from growth in the number of users, the time spent online per week as well as the number of days online per week is on the rise.
Surge in Websites and Webpages in China China is no exception to the information boom. As of December 2008, there were around 16.1 billion webpages, double the number from 8.4 billion in December 2006. The number of websites located in China is also rapidly growing. According to CNNIC, the number reached 3.1 billion by July 2009, up from 1.9 billion by Jun-2008. The amount of information per page (in terms of number of bytes) is also on the rise.
Users Turning to Search in China With information on the Internet ever expanding, it is natural that users turn to search engines to organize the high volume of information. As a result, the number of searches in China is expected to increase more than fourfold from 2003 to 2008. According to the 2009 CNNIC report, more than 69% of internet users use search engines.
Search Market Outlook: Advertisers’ Readiness Online display advertising accounts for only ~5% of the total ad spending in China, while search revenue is about the same, at ~5% of the total ad market. As in the US, we believe the paid search ad is particularly well suited for small and medium enterprises (SME) in generating sales leads. Yet, as with the low internet adoption rate in China, paid search is still a new advertising concept for these advertisers. Hence, continuous education and marketing are required to drive market growth.
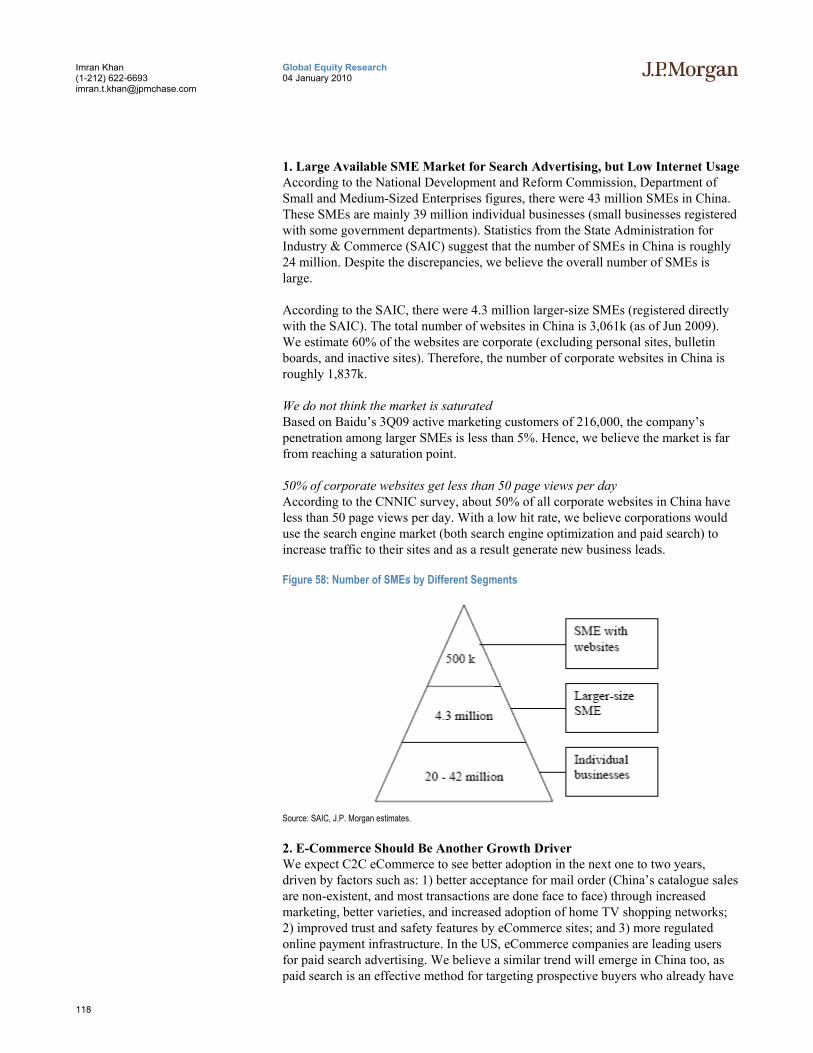
118
Global Equity Research 04 January 2010
Imran Khan (1-212) 622-6693 [email protected]
1. Large Available SME Market for Search Advertising, but Low Internet Usage According to the National Development and Reform Commission, Department of Small and Medium-Sized Enterprises figures, there were 43 million SMEs in China. These SMEs are mainly 39 million individual businesses (small businesses registered with some government departments). Statistics from the State Administration for Industry & Commerce (SAIC) suggest that the number of SMEs in China is roughly 24 million. Despite the discrepancies, we believe the overall number of SMEs is large.
According to the SAIC, there were 4.3 million larger-size SMEs (registered directly with the SAIC). The total number of websites in China is 3,061k (as of Jun 2009). We estimate 60% of the websites are corporate (excluding personal sites, bulletin boards, and inactive sites). Therefore, the number of corporate websites in China is roughly 1,837k.
We do not think the market is saturated Based on Baidu’s 3Q09 active marketing customers of 216,000, the company’s penetration among larger SMEs is less than 5%. Hence, we believe the market is far from reaching a saturation point.
50% of corporate websites get less than 50 page views per day According to the CNNIC survey, about 50% of all corporate websites in China have less than 50 page views per day. With a low hit rate, we believe corporations would use the search engine market (both search engine optimization and paid search) to increase traffic to their sites and as a result generate new business leads.
Figure 58: Number of SMEs by Different Segments
Source: SAIC, J.P. Morgan estimates.
2. E-Commerce Should Be Another Growth Driver We expect C2C eCommerce to see better adoption in the next one to two years, driven by factors such as: 1) better acceptance for mail order (China’s catalogue sales are non-existent, and most transactions are done face to face) through increased marketing, better varieties, and increased adoption of home TV shopping networks; 2) improved trust and safety features by eCommerce sites; and 3) more regulated online payment infrastructure. In the US, eCommerce companies are leading users for paid search advertising. We believe a similar trend will emerge in China too, as paid search is an effective method for targeting prospective buyers who already have
119
Global Equity Research 04 January 2010
Imran Khan (1-212) 622-6693 [email protected]
items in mind. Currently, leading online search advertisers in China include Dangdang, Joyo, Ctrip, and eLong. We expect paid search to benefit from eCommerce growth in the future.
3. Local Search: Another Promising Area Similar to the US, we believe there is a large commercial potential for local search in China. Particularly, there are a large number of households/individual businesses eager to promote their local businesses. In addition, IP address assignment is quite well organized in China. We expect IP-based marketing to be more popular going forward as online advertisers become more sophisticated.
4. IT Outsourcing Companies Are the Main Educators for Search Usage The two types of companies that help drive paid search usage of SMEs are ad agencies and IT outsourcing companies. While ad agencies mainly focus on companies that already have websites, IT outsourcing companies target SMEs that are less sophisticated in IT infrastructure.
IT outsourcing companies such as Sino-I (250.HK) and Hichina (net.cn) provide one-stop services for SMEs—domain name registration, web hosting, website design, and promotions (mainly through search engine optimization, paid search, directory listing). We believe the IT outsourcing companies will be key players in the future to drive Internet adoption growth and search usage for SMEs.
China Enterprise (ce.net) (fully-owned by Sino-I) is one of the first official agents for Google in China. It has approximately 220,000 customers. The company is a dedicated educator for IT services in China with each of its 77 offices conducting regular meetings for entrepreneurs and SMEs. We believe this kind of education will help expand the number of advertisers for online search services.
5. Ad Agencies Would Have to Drive Search Market Growth Paid search marketing campaigns are usually more involved than display ads. Advertisers need to decide on what keywords to use, the number of keywords, bidding strategy and bidding period. In addition, more sophisticated advertisers also pay attention to competitors’ strategy, lead quality and ROI. A well-run search campaign is arguably more difficult than banner ads where advertisers simply design the banners and place them on as many relevant websites as possible.
Furthermore, budgets for search campaigns are more difficult to manage as spending is based on the number of clicks, which non-experienced advertisers do not have control over. The ad spending amount essentially has no limit. Hence, advertisers are generally quite cautious about the initial spending and only allocate a small daily budget for trial, or even worse, may simply give up on paid search campaigns. We believe education by agents and distributors can eventually help advertisers overcome these barriers, and advertisers will thus increase their budgets on search campaigns.
Search Market Outlook: Monetization We expect monetization of the paid search market to grow quickly, driven by both higher search usage by users and better adoption by advertisers. The coverage ratio is low compared with that of the US, and we expect it to increase and drive monetization of the market.
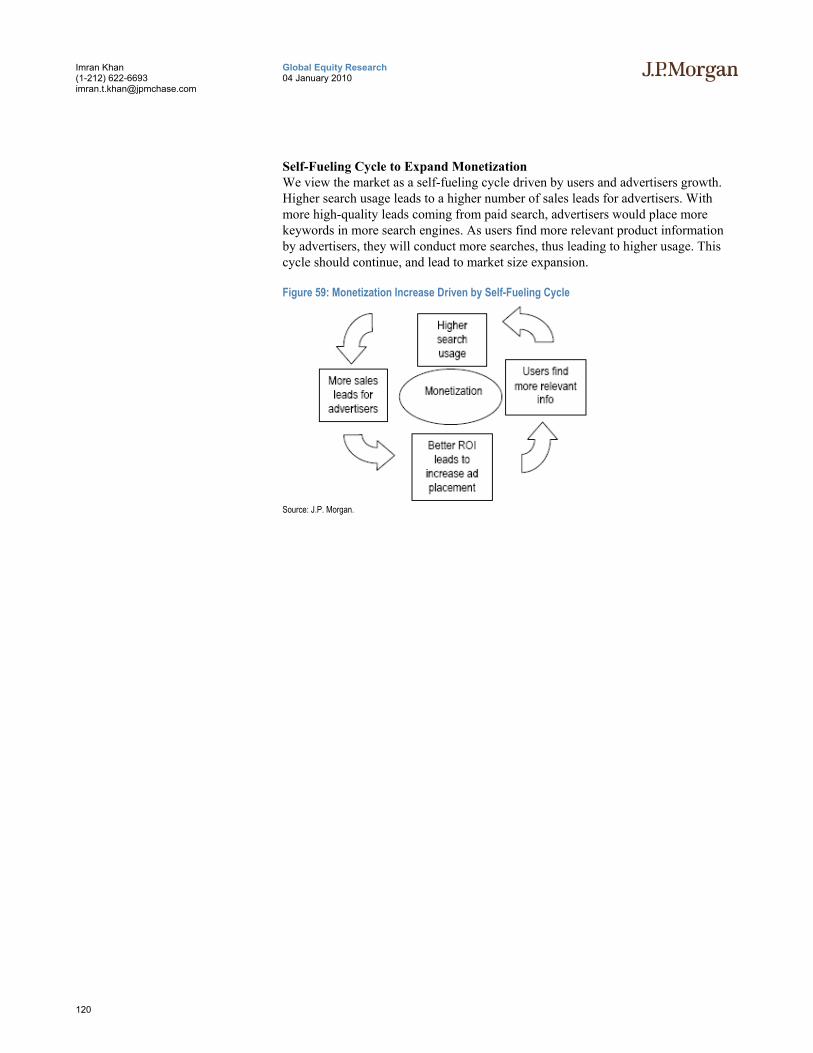
120
Global Equity Research 04 January 2010
Imran Khan (1-212) 622-6693 [email protected]
Self-Fueling Cycle to Expand Monetization We view the market as a self-fueling cycle driven by users and advertisers growth. Higher search usage leads to a higher number of sales leads for advertisers. With more high-quality leads coming from paid search, advertisers would place more keywords in more search engines. As users find more relevant product information by advertisers, they will conduct more searches, thus leading to higher usage. This cycle should continue, and lead to market size expansion.
Figure 59: Monetization Increase Driven by Self-Fueling Cycle
Source: J.P. Morgan.

121
Global Equity Research 04 January 2010
Imran Khan (1-212) 622-6693 [email protected]
Online Gaming Growth Outlook Remains Robust The online gaming sector continued to see strong growth in 2009, with ~38% Y/Y growth to reach Rmb24.3B (~US$3.6B), as per our estimates. The MMORPG segment (~85% of total gaming market) grew ~38% Y/Y to reach ~US$3.0B, as per our estimates, with the success of the free-to-play model continuing as a key factor. The casual game segment, meanwhile, grew ~42% Y/Y to reach ~US$537M, as per our estimates.
For 2010, we forecast ~33% Y/Y growth in the MMORPG segment and ~25% Y/Y growth in casual games. We expect companies with strong operating and marketing capabilities and healthy game pipelines to continue to benefit from the market’s growth.
Table 49: China MMORPG Market Forecast 2006 2007 2008 2009E 2010E 2011E 2012E
MMORPG gamers (million) 25.5 37.0 53.3 66.6 80.6 95.9 112.2 Game users penetration 18.6% 17.6% 17.9% 18.1% 18.8% 19.5% 19.9% Average ARPU per month (RMB) 19.7 21.3 23.7 25.8 28.4 30.6 31.9 Market size (RMB million) 6,043 9,463 15,125 20,608 27,430 35,253 42,895 MMORPG Market size (US$M) 728 1,257 2,201 3,016 4,014 5,159 6,278 Growth Rate: 25.5 37.0 53.3 66.6 80.6 95.9 22% Source: iResearch, J.P. Morgan estimates.
Table 50: China Casual Game Market Forecast 2006 2007 2008E 2009E 2010E 2011E 2012E
Casual game players (million) 32.6 47.3 68.1 88.5 105.3 122.2 141.7 Casual players penetration 23.8% 22.5% 22.8% 24.0% 24.5% 24.8% 25.2% Assumed Ratio of paying users 23% 25% 27% 29% 30% 31% 31% APRU per month (Rmb) 2.7 2.9 3.2 3.5 3.6 3.8 4.0 Market size (RMB million) 1,044 1,634 2,589 3,669 4,584 5,583 6,800 Casual Market size (US$M) 132 217 377 537 671 817 995 Growth Rate: 54% 65% 74% 42% 25% 22% 22% Source: iResearch, J.P. Morgan estimates.
Key Industry Drivers We expect continued robust growth of online gaming in China to be driven by:
1) Continued strong internet user growth in China (2008-11E CAGR of 18%).
2) Upside in gamer penetration, which is still less than half of Korea’s penetration (also below HK and Taiwan), with additional gamers coming particularly from lower-tier cities.
3) Increasing broadband penetration, with 319MM broadband internet users as of Jun-09, or 94% of total internet users; CAGR of ~100% over the last five years.
4) Efforts of game companies – better quality, innovative games and more effective promotions to continue to attract players; also, success of the free-to-play (item-based sales) model (contributing ~63% of industry revenues in 2007, up from ~52% in 2006, as per IDC estimates).
5) Limited leisure alternatives – teenagers in first-tier China cities spending more on entertainment like internet/games, with the trend being replicated in smaller cities.
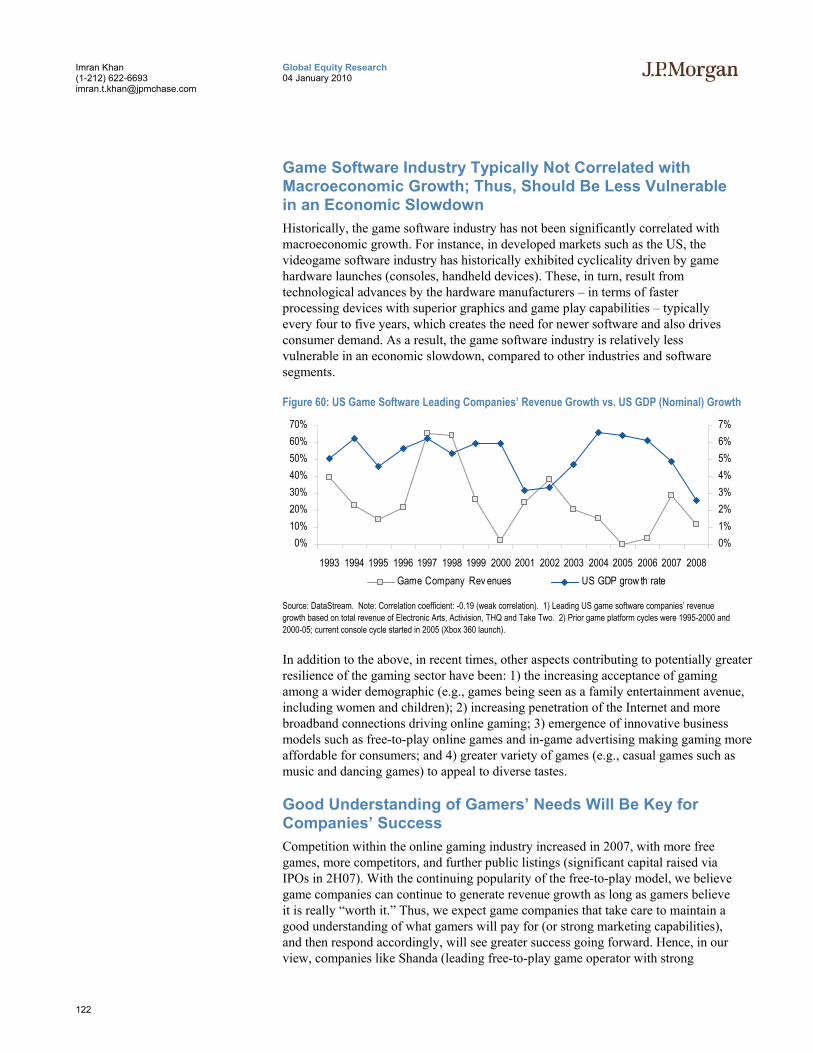
122
Global Equity Research 04 January 2010
Imran Khan (1-212) 622-6693 [email protected]
Game Software Industry Typically Not Correlated with Macroeconomic Growth; Thus, Should Be Less Vulnerable in an Economic Slowdown Historically, the game software industry has not been significantly correlated with macroeconomic growth. For instance, in developed markets such as the US, the videogame software industry has historically exhibited cyclicality driven by game hardware launches (consoles, handheld devices). These, in turn, result from technological advances by the hardware manufacturers – in terms of faster processing devices with superior graphics and game play capabilities – typically every four to five years, which creates the need for newer software and also drives consumer demand. As a result, the game software industry is relatively less vulnerable in an economic slowdown, compared to other industries and software segments.
Figure 60: US Game Software Leading Companies’ Revenue Growth vs. US GDP (Nominal) Growth
0%10%20%30%40%50%60%70%
1993 1994 1995 1996 1997 1998 1999 2000 2001 2002 2003 2004 2005 2006 2007 2008
0%1%2%3%4%5%6%7%
Game Company Rev enues US GDP grow th rate
Source: DataStream. Note: Correlation coefficient: -0.19 (weak correlation). 1) Leading US game software companies’ revenue growth based on total revenue of Electronic Arts, Activision, THQ and Take Two. 2) Prior game platform cycles were 1995-2000 and 2000-05; current console cycle started in 2005 (Xbox 360 launch).
In addition to the above, in recent times, other aspects contributing to potentially greater resilience of the gaming sector have been: 1) the increasing acceptance of gaming among a wider demographic (e.g., games being seen as a family entertainment avenue, including women and children); 2) increasing penetration of the Internet and more broadband connections driving online gaming; 3) emergence of innovative business models such as free-to-play online games and in-game advertising making gaming more affordable for consumers; and 4) greater variety of games (e.g., casual games such as music and dancing games) to appeal to diverse tastes.
Good Understanding of Gamers’ Needs Will Be Key for Companies’ Success Competition within the online gaming industry increased in 2007, with more free games, more competitors, and further public listings (significant capital raised via IPOs in 2H07). With the continuing popularity of the free-to-play model, we believe game companies can continue to generate revenue growth as long as gamers believe it is really “worth it.” Thus, we expect game companies that take care to maintain a good understanding of what gamers will pay for (or strong marketing capabilities), and then respond accordingly, will see greater success going forward. Hence, in our view, companies like Shanda (leading free-to-play game operator with strong
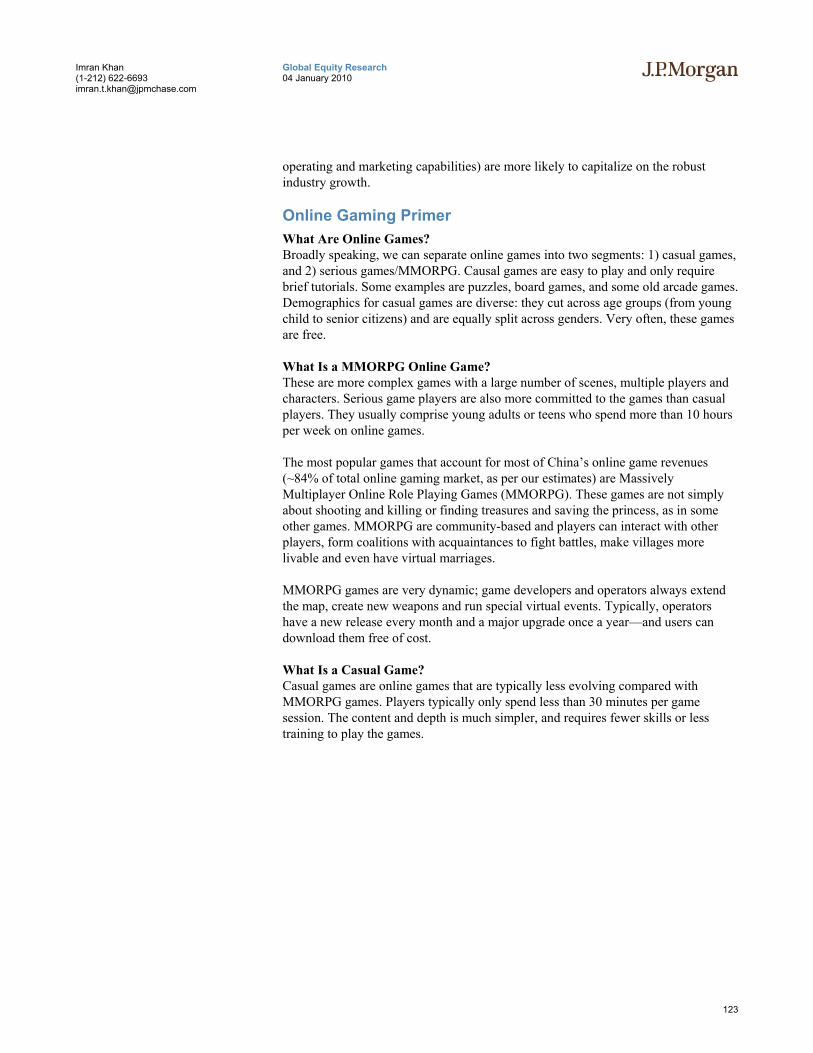
123
Global Equity Research 04 January 2010
Imran Khan (1-212) 622-6693 [email protected]
operating and marketing capabilities) are more likely to capitalize on the robust industry growth.
Online Gaming Primer What Are Online Games? Broadly speaking, we can separate online games into two segments: 1) casual games, and 2) serious games/MMORPG. Causal games are easy to play and only require brief tutorials. Some examples are puzzles, board games, and some old arcade games. Demographics for casual games are diverse: they cut across age groups (from young child to senior citizens) and are equally split across genders. Very often, these games are free.
What Is a MMORPG Online Game? These are more complex games with a large number of scenes, multiple players and characters. Serious game players are also more committed to the games than casual players. They usually comprise young adults or teens who spend more than 10 hours per week on online games.
The most popular games that account for most of China’s online game revenues (~84% of total online gaming market, as per our estimates) are Massively Multiplayer Online Role Playing Games (MMORPG). These games are not simply about shooting and killing or finding treasures and saving the princess, as in some other games. MMORPG are community-based and players can interact with other players, form coalitions with acquaintances to fight battles, make villages more livable and even have virtual marriages.
MMORPG games are very dynamic; game developers and operators always extend the map, create new weapons and run special virtual events. Typically, operators have a new release every month and a major upgrade once a year—and users can download them free of cost.
What Is a Casual Game? Casual games are online games that are typically less evolving compared with MMORPG games. Players typically only spend less than 30 minutes per game session. The content and depth is much simpler, and requires fewer skills or less training to play the games.
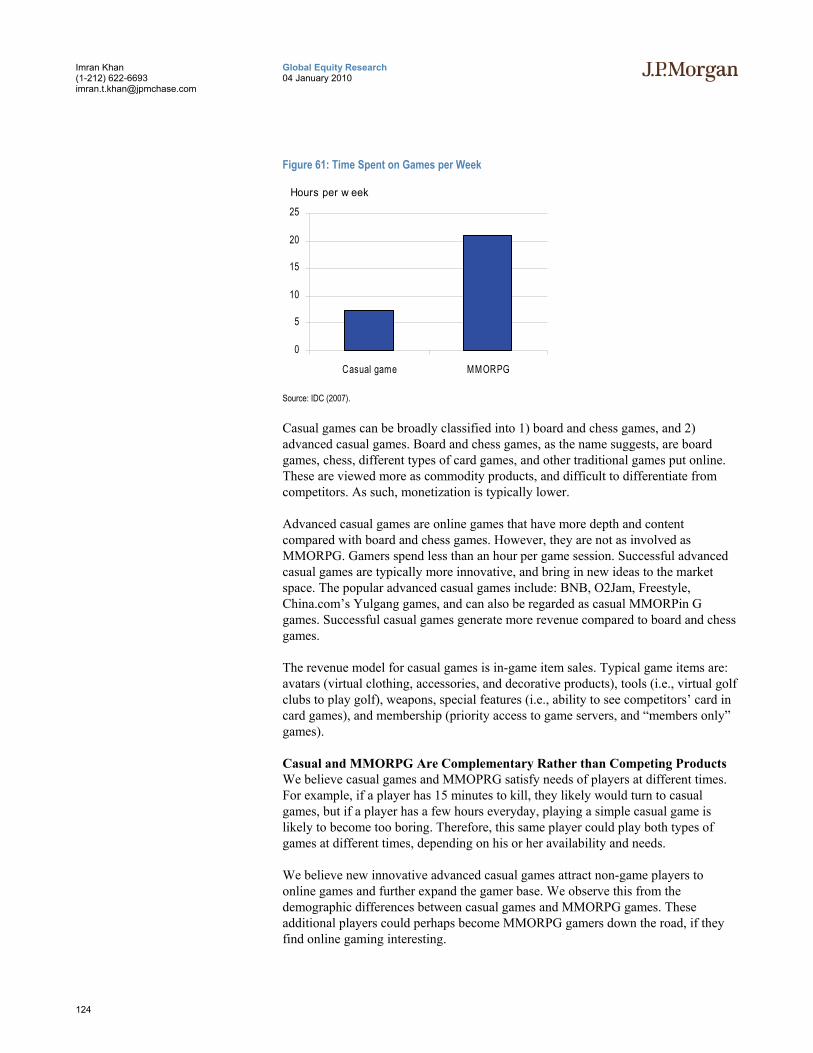
124
Global Equity Research 04 January 2010
Imran Khan (1-212) 622-6693 [email protected]
Figure 61: Time Spent on Games per Week
0
5
10
15
20
25
Casual game MMORPG
Hours per w eek
Source: IDC (2007).
Casual games can be broadly classified into 1) board and chess games, and 2) advanced casual games. Board and chess games, as the name suggests, are board games, chess, different types of card games, and other traditional games put online. These are viewed more as commodity products, and difficult to differentiate from competitors. As such, monetization is typically lower.
Advanced casual games are online games that have more depth and content compared with board and chess games. However, they are not as involved as MMORPG. Gamers spend less than an hour per game session. Successful advanced casual games are typically more innovative, and bring in new ideas to the market space. The popular advanced casual games include: BNB, O2Jam, Freestyle, China.com’s Yulgang games, and can also be regarded as casual MMORPin G games. Successful casual games generate more revenue compared to board and chess games.
The revenue model for casual games is in-game item sales. Typical game items are: avatars (virtual clothing, accessories, and decorative products), tools (i.e., virtual golf clubs to play golf), weapons, special features (i.e., ability to see competitors’ card in card games), and membership (priority access to game servers, and “members only” games).
Casual and MMORPG Are Complementary Rather than Competing Products We believe casual games and MMOPRG satisfy needs of players at different times. For example, if a player has 15 minutes to kill, they likely would turn to casual games, but if a player has a few hours everyday, playing a simple casual game is likely to become too boring. Therefore, this same player could play both types of games at different times, depending on his or her availability and needs.
We believe new innovative advanced casual games attract non-game players to online games and further expand the gamer base. We observe this from the demographic differences between casual games and MMORPG games. These additional players could perhaps become MMORPG gamers down the road, if they find online gaming interesting.
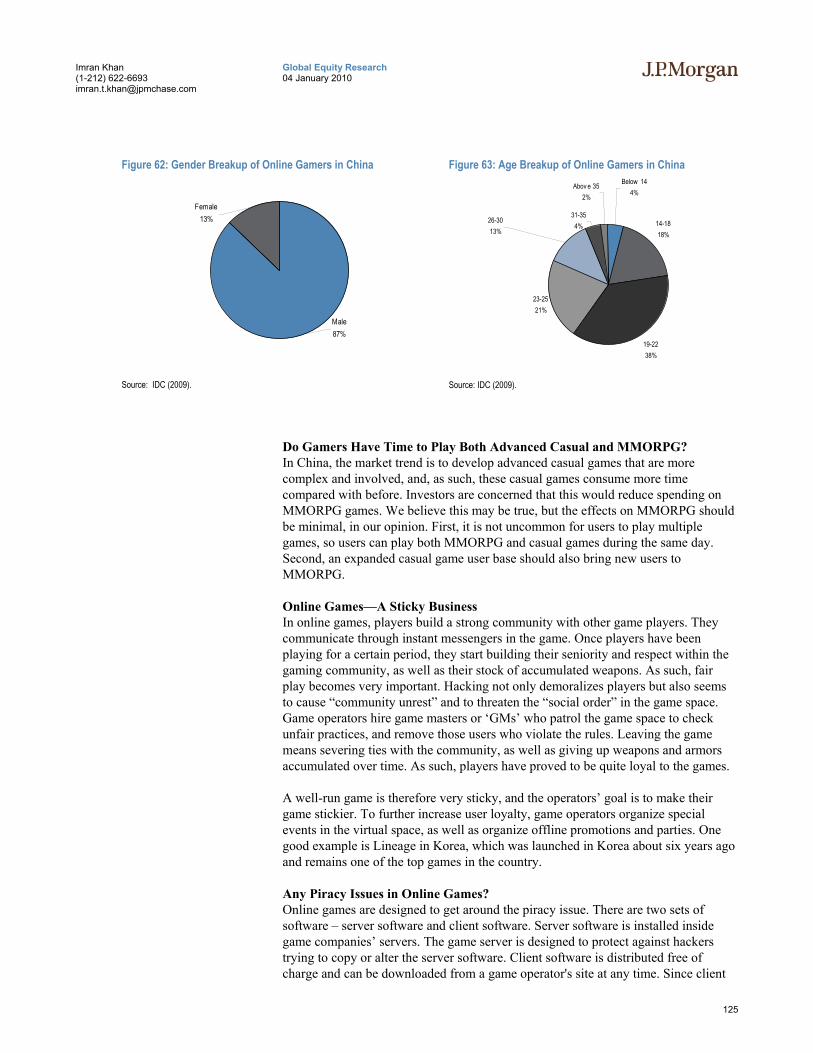
125
Global Equity Research 04 January 2010
Imran Khan (1-212) 622-6693 [email protected]
Figure 62: Gender Breakup of Online Gamers in China
Female13%
Male87%
Source: IDC (2009).
Figure 63: Age Breakup of Online Gamers in China
14-1818%
19-2238%
23-2521%
31-354%
Abov e 352%
Below 144%
26-3013%
Source: IDC (2009).
Do Gamers Have Time to Play Both Advanced Casual and MMORPG? In China, the market trend is to develop advanced casual games that are more complex and involved, and, as such, these casual games consume more time compared with before. Investors are concerned that this would reduce spending on MMORPG games. We believe this may be true, but the effects on MMORPG should be minimal, in our opinion. First, it is not uncommon for users to play multiple games, so users can play both MMORPG and casual games during the same day. Second, an expanded casual game user base should also bring new users to MMORPG.
Online Games—A Sticky Business In online games, players build a strong community with other game players. They communicate through instant messengers in the game. Once players have been playing for a certain period, they start building their seniority and respect within the gaming community, as well as their stock of accumulated weapons. As such, fair play becomes very important. Hacking not only demoralizes players but also seems to cause “community unrest” and to threaten the “social order” in the game space. Game operators hire game masters or ‘GMs’ who patrol the game space to check unfair practices, and remove those users who violate the rules. Leaving the game means severing ties with the community, as well as giving up weapons and armors accumulated over time. As such, players have proved to be quite loyal to the games.
A well-run game is therefore very sticky, and the operators’ goal is to make their game stickier. To further increase user loyalty, game operators organize special events in the virtual space, as well as organize offline promotions and parties. One good example is Lineage in Korea, which was launched in Korea about six years ago and remains one of the top games in the country.
Any Piracy Issues in Online Games? Online games are designed to get around the piracy issue. There are two sets of software – server software and client software. Server software is installed inside game companies’ servers. The game server is designed to protect against hackers trying to copy or alter the server software. Client software is distributed free of charge and can be downloaded from a game operator's site at any time. Since client
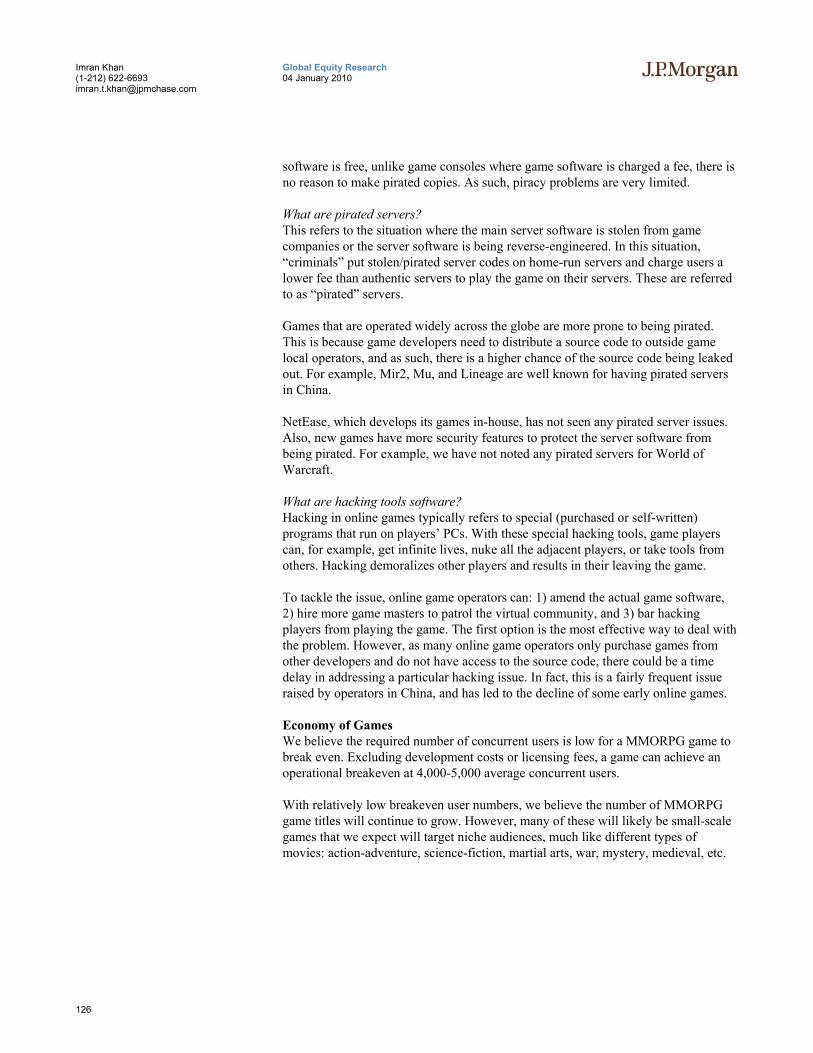
126
Global Equity Research 04 January 2010
Imran Khan (1-212) 622-6693 [email protected]
software is free, unlike game consoles where game software is charged a fee, there is no reason to make pirated copies. As such, piracy problems are very limited.
What are pirated servers? This refers to the situation where the main server software is stolen from game companies or the server software is being reverse-engineered. In this situation, “criminals” put stolen/pirated server codes on home-run servers and charge users a lower fee than authentic servers to play the game on their servers. These are referred to as “pirated” servers.
Games that are operated widely across the globe are more prone to being pirated. This is because game developers need to distribute a source code to outside game local operators, and as such, there is a higher chance of the source code being leaked out. For example, Mir2, Mu, and Lineage are well known for having pirated servers in China.
NetEase, which develops its games in-house, has not seen any pirated server issues. Also, new games have more security features to protect the server software from being pirated. For example, we have not noted any pirated servers for World of Warcraft.
What are hacking tools software? Hacking in online games typically refers to special (purchased or self-written) programs that run on players’ PCs. With these special hacking tools, game players can, for example, get infinite lives, nuke all the adjacent players, or take tools from others. Hacking demoralizes other players and results in their leaving the game.
To tackle the issue, online game operators can: 1) amend the actual game software, 2) hire more game masters to patrol the virtual community, and 3) bar hacking players from playing the game. The first option is the most effective way to deal with the problem. However, as many online game operators only purchase games from other developers and do not have access to the source code, there could be a time delay in addressing a particular hacking issue. In fact, this is a fairly frequent issue raised by operators in China, and has led to the decline of some early online games.
Economy of Games We believe the required number of concurrent users is low for a MMORPG game to break even. Excluding development costs or licensing fees, a game can achieve an operational breakeven at 4,000-5,000 average concurrent users.
With relatively low breakeven user numbers, we believe the number of MMORPG game titles will continue to grow. However, many of these will likely be small-scale games that we expect will target niche audiences, much like different types of movies: action-adventure, science-fiction, martial arts, war, mystery, medieval, etc.
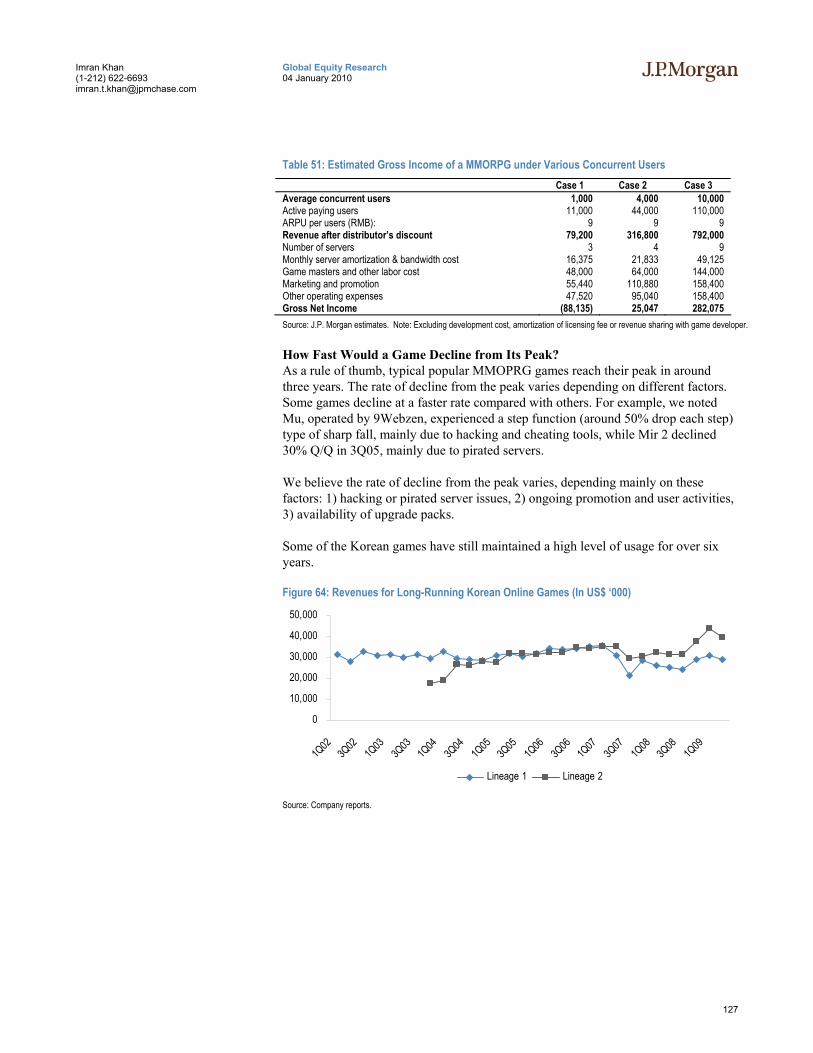
127
Global Equity Research 04 January 2010
Imran Khan (1-212) 622-6693 [email protected]
Table 51: Estimated Gross Income of a MMORPG under Various Concurrent Users Case 1 Case 2 Case 3
Average concurrent users 1,000 4,000 10,000 Active paying users 11,000 44,000 110,000 ARPU per users (RMB): 9 9 9 Revenue after distributor’s discount 79,200 316,800 792,000 Number of servers 3 4 9 Monthly server amortization & bandwidth cost 16,375 21,833 49,125 Game masters and other labor cost 48,000 64,000 144,000 Marketing and promotion 55,440 110,880 158,400 Other operating expenses 47,520 95,040 158,400 Gross Net Income (88,135) 25,047 282,075 Source: J.P. Morgan estimates. Note: Excluding development cost, amortization of licensing fee or revenue sharing with game developer.
How Fast Would a Game Decline from Its Peak? As a rule of thumb, typical popular MMOPRG games reach their peak in around three years. The rate of decline from the peak varies depending on different factors. Some games decline at a faster rate compared with others. For example, we noted Mu, operated by 9Webzen, experienced a step function (around 50% drop each step) type of sharp fall, mainly due to hacking and cheating tools, while Mir 2 declined 30% Q/Q in 3Q05, mainly due to pirated servers.
We believe the rate of decline from the peak varies, depending mainly on these factors: 1) hacking or pirated server issues, 2) ongoing promotion and user activities, 3) availability of upgrade packs.
Some of the Korean games have still maintained a high level of usage for over six years.
Figure 64: Revenues for Long-Running Korean Online Games (In US$ ‘000)
0
10,000
20,000
30,000
40,000
50,000
1Q02
3Q02
1Q03
3Q03
1Q04
3Q04
1Q05
3Q05
1Q06
3Q06
1Q07
3Q07
1Q08
3Q08
1Q09
Lineage 1 Lineage 2
Source: Company reports.
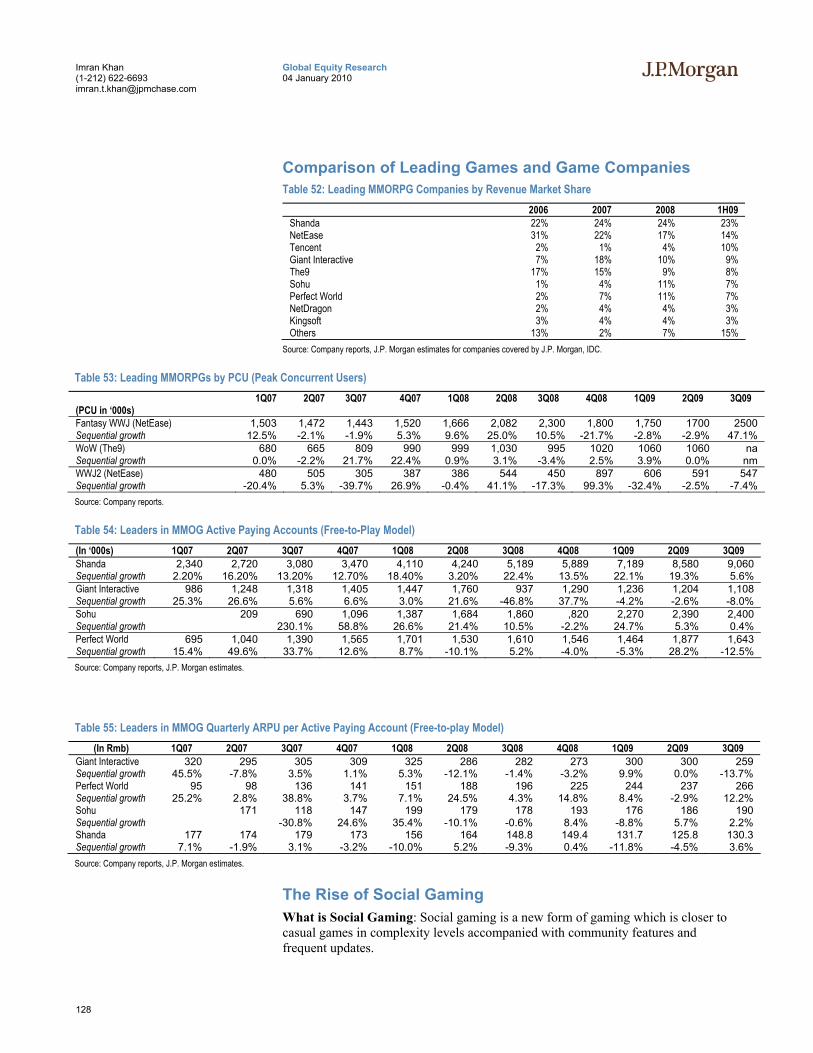
128
Global Equity Research 04 January 2010
Imran Khan (1-212) 622-6693 [email protected]
Comparison of Leading Games and Game Companies Table 52: Leading MMORPG Companies by Revenue Market Share
2006 2007 2008 1H09 Shanda 22% 24% 24% 23% NetEase 31% 22% 17% 14% Tencent 2% 1% 4% 10% Giant Interactive 7% 18% 10% 9% The9 17% 15% 9% 8% Sohu 1% 4% 11% 7% Perfect World 2% 7% 11% 7% NetDragon 2% 4% 4% 3% Kingsoft 3% 4% 4% 3% Others 13% 2% 7% 15%
Source: Company reports, J.P. Morgan estimates for companies covered by J.P. Morgan, IDC.
Table 53: Leading MMORPGs by PCU (Peak Concurrent Users) (PCU in ‘000s)
1Q07 2Q07 3Q07 4Q07 1Q08 2Q08 3Q08 4Q08 1Q09 2Q09 3Q09
Fantasy WWJ (NetEase) 1,503 1,472 1,443 1,520 1,666 2,082 2,300 1,800 1,750 1700 2500 Sequential growth 12.5% -2.1% -1.9% 5.3% 9.6% 25.0% 10.5% -21.7% -2.8% -2.9% 47.1% WoW (The9) 680 665 809 990 999 1,030 995 1020 1060 1060 na Sequential growth 0.0% -2.2% 21.7% 22.4% 0.9% 3.1% -3.4% 2.5% 3.9% 0.0% nm WWJ2 (NetEase) 480 505 305 387 386 544 450 897 606 591 547 Sequential growth -20.4% 5.3% -39.7% 26.9% -0.4% 41.1% -17.3% 99.3% -32.4% -2.5% -7.4% Source: Company reports.
Table 54: Leaders in MMOG Active Paying Accounts (Free-to-Play Model) (In ‘000s) 1Q07 2Q07 3Q07 4Q07 1Q08 2Q08 3Q08 4Q08 1Q09 2Q09 3Q09 Shanda 2,340 2,720 3,080 3,470 4,110 4,240 5,189 5,889 7,189 8,580 9,060 Sequential growth 2.20% 16.20% 13.20% 12.70% 18.40% 3.20% 22.4% 13.5% 22.1% 19.3% 5.6% Giant Interactive 986 1,248 1,318 1,405 1,447 1,760 937 1,290 1,236 1,204 1,108 Sequential growth 25.3% 26.6% 5.6% 6.6% 3.0% 21.6% -46.8% 37.7% -4.2% -2.6% -8.0% Sohu 209 690 1,096 1,387 1,684 1,860 ,820 2,270 2,390 2,400 Sequential growth 230.1% 58.8% 26.6% 21.4% 10.5% -2.2% 24.7% 5.3% 0.4% Perfect World 695 1,040 1,390 1,565 1,701 1,530 1,610 1,546 1,464 1,877 1,643 Sequential growth 15.4% 49.6% 33.7% 12.6% 8.7% -10.1% 5.2% -4.0% -5.3% 28.2% -12.5% Source: Company reports, J.P. Morgan estimates.
Table 55: Leaders in MMOG Quarterly ARPU per Active Paying Account (Free-to-play Model) (In Rmb) 1Q07 2Q07 3Q07 4Q07 1Q08 2Q08 3Q08 4Q08 1Q09 2Q09 3Q09
Giant Interactive 320 295 305 309 325 286 282 273 300 300 259 Sequential growth 45.5% -7.8% 3.5% 1.1% 5.3% -12.1% -1.4% -3.2% 9.9% 0.0% -13.7% Perfect World 95 98 136 141 151 188 196 225 244 237 266 Sequential growth 25.2% 2.8% 38.8% 3.7% 7.1% 24.5% 4.3% 14.8% 8.4% -2.9% 12.2% Sohu 171 118 147 199 179 178 193 176 186 190 Sequential growth -30.8% 24.6% 35.4% -10.1% -0.6% 8.4% -8.8% 5.7% 2.2% Shanda 177 174 179 173 156 164 148.8 149.4 131.7 125.8 130.3 Sequential growth 7.1% -1.9% 3.1% -3.2% -10.0% 5.2% -9.3% 0.4% -11.8% -4.5% 3.6% Source: Company reports, J.P. Morgan estimates.
The Rise of Social Gaming What is Social Gaming: Social gaming is a new form of gaming which is closer to casual games in complexity levels accompanied with community features and frequent updates.

129
Global Equity Research 04 January 2010
Imran Khan (1-212) 622-6693 [email protected]
Sticky Platform: What really makes social games sticky is the amount of user-engagement that these games have. Users start engaging in a virtual life with the game. For ex: Many users playing Farmville actually start feeling like farmers, they are involved right from choosing crop, sowing seeds, providing nutrients, and then harvesting at the right time. Many users often put up alarms to wake up at the right time for harvesting. Game companies keep adding new items making users' farming better, which keeps the user interested in the game continuously.
Social games are quite different from traditional MMORPG games in the sense that they are not heavy on strategy, do not have heavy graphics and have no high hardware requirements. They differ from casual games in the aspect that they have more community-based features and are more frequently updated.
Increasingly, social games find their popularity amongst advanced gamers, casual gamers and people who have traditionally been non-gamers.
How social gaming is different from casual gaming? 1) Social gaming has community features: a) people can track the progress of their friends trough SNS platform, b) can be played with both online and offline friends.
2) The development team is continuously involved to put updates frequently. As social games do not have a lot of graphic interface, their updates are more frequent than MMORPGs.
3) The SNS platform assists in doing viral marketing for the game. Members are aware of actions of other friends in the game, which again gives birth to a sense of competitiveness and makes the platform stickier.
What’s Unique about Social Gaming in China? Social games in China are quite similar to the popular ones on Facebook. For most of the popular games in China such as farm and aquarium games, the concept has been adapted from Facebook and other English-based social networking websites. However, Chinese social games are supposed to be more competitive and have some added features like stealing.
We believe the social gaming trend will continue to pick up in China because 1) community features add to the stickiness of social games, 2) social games attract new sets of users who were traditionally non-gamers or did not have time to do heavier games (such as housewives), 3) better stickiness and monetization vs. casual games.
Social Gaming Proves to Be a Goldmine for Tencent With the rising popularity of social games on Facebook and other Chinese websites like RenRen and Kaixin001, Tencent introduced many new social gaming applications with more interactive functionalities such as farming, aquarium, etc. to increase user stickiness. The company has adopted a mixed content sourcing strategy where it is sourcing the popular games like social farm from third-party vendors while also working in-house to keep the game launch pipeline green. As social games are simple, they are expected to have smaller life cycle and continuous churn of new games become necessary.
The success of social games on Qzone led to a rise in the number of users from 183MM in 4Q08 to 305MM in 3Q09. The revenues have also gone up to 56.2% QoQ
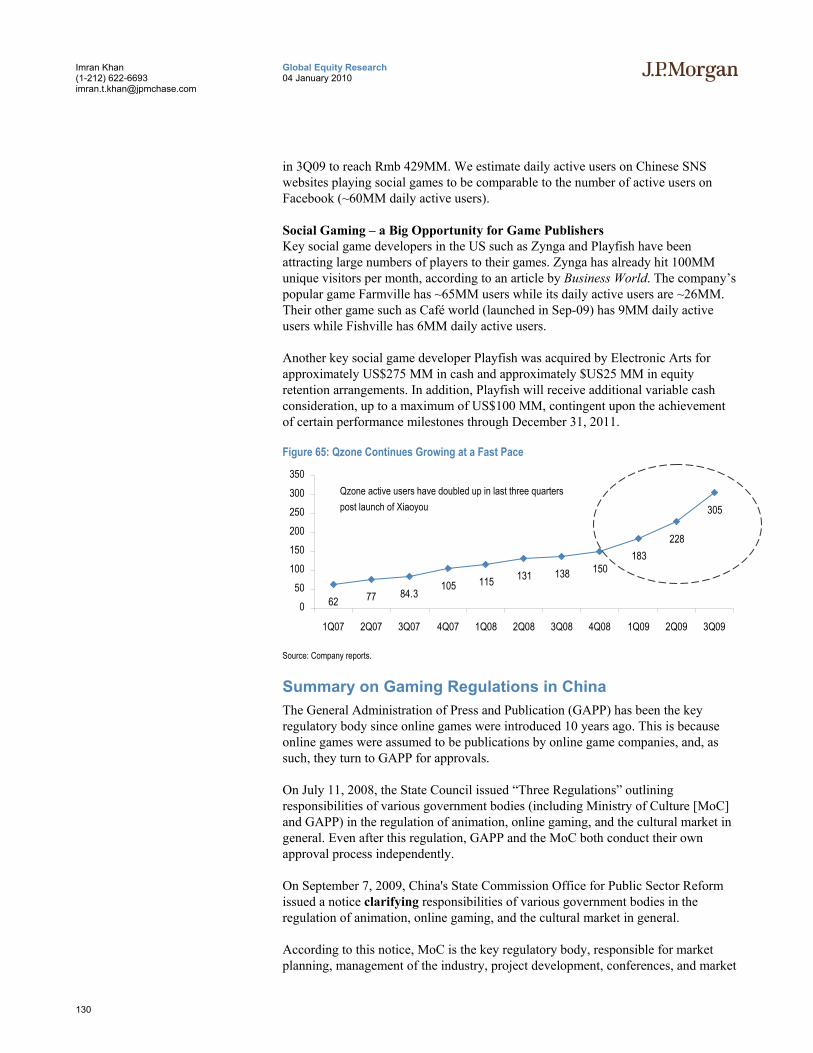
130
Global Equity Research 04 January 2010
Imran Khan (1-212) 622-6693 [email protected]
in 3Q09 to reach Rmb 429MM. We estimate daily active users on Chinese SNS websites playing social games to be comparable to the number of active users on Facebook (~60MM daily active users).
Social Gaming – a Big Opportunity for Game Publishers Key social game developers in the US such as Zynga and Playfish have been attracting large numbers of players to their games. Zynga has already hit 100MM unique visitors per month, according to an article by Business World. The company’s popular game Farmville has ~65MM users while its daily active users are ~26MM. Their other game such as Café world (launched in Sep-09) has 9MM daily active users while Fishville has 6MM daily active users.
Another key social game developer Playfish was acquired by Electronic Arts for approximately US$275 MM in cash and approximately $US25 MM in equity retention arrangements. In addition, Playfish will receive additional variable cash consideration, up to a maximum of US$100 MM, contingent upon the achievement of certain performance milestones through December 31, 2011.
Figure 65: Qzone Continues Growing at a Fast Pace
62 77 84.3105 115 131 138 150
183228
305
050
100150200250300350
1Q07 2Q07 3Q07 4Q07 1Q08 2Q08 3Q08 4Q08 1Q09 2Q09 3Q09
Source: Company reports.
Summary on Gaming Regulations in China The General Administration of Press and Publication (GAPP) has been the key regulatory body since online games were introduced 10 years ago. This is because online games were assumed to be publications by online game companies, and, as such, they turn to GAPP for approvals.
On July 11, 2008, the State Council issued “Three Regulations” outlining responsibilities of various government bodies (including Ministry of Culture [MoC] and GAPP) in the regulation of animation, online gaming, and the cultural market in general. Even after this regulation, GAPP and the MoC both conduct their own approval process independently.
On September 7, 2009, China's State Commission Office for Public Sector Reform issued a notice clarifying responsibilities of various government bodies in the regulation of animation, online gaming, and the cultural market in general.
According to this notice, MoC is the key regulatory body, responsible for market planning, management of the industry, project development, conferences, and market
Qzone active users have doubled up in last three quarters post launch of Xiaoyou

131
Global Equity Research 04 January 2010
Imran Khan (1-212) 622-6693 [email protected]
oversight for the animation and online gaming industries. By the end of 2009, all the transition in responsibility should be complete.
In late September 2009, MoC held a meeting with leading games companies stating that MoC will be the key regulatory body.
GAAP interpretation of the “Three Regulations” On September 28, 2009, GAPP issued its own interpretation of “Three Regulations”. News about this regulation was reported on Sina.com on Oct. 9. The key points are:
- All games need to obtain a GAPP license, otherwise GAPP will notify telecom operators to shut down servers and notify the Department of Commerce to cancel its business registration.
- Once a game has been approved by GAPP, no other departments should review the games (including MoC and telecom departments).
- All foreign games need to be approved by GAPP.
- Foreign companies are banned from investing in China online game companies as a sole owner, joint venture, or cooperative partner.
- Foreign companies cannot operate online games in China. In particular, indirect controls of China game companies through the following are also not allowed: investment companies, supplying technical support, joint networks for user registration, account supervision, or game card systems.
- If a foreign game changes operators, new operator needs to get GAPP approvals before launching the game. And before obtaining a license, game operations need to be stopped.
- Any upgrades or updates from prior approved versions of games need to be re-approved by GAPP. Otherwise telecom departments will be notified to shut down servers.
Our View on Regulatory Changes - Central government is supportive of online games and software industry. If the situation remains unclear, central government would likely step in and provide a resolution that is beneficial to the industry.
- NetEase’s in-house games should not be impacted. We believe there is a chance that WoW could be shut down temporarily. However, with MoC support, the chance of a shutdown is very low.
- Do not expect other games (both imported and in-house developed) to be impacted by the regulatory changes. There is some near-term uncertainty regarding the approval process, and there could be some slight delays. We remain positive on the overall online game sector.
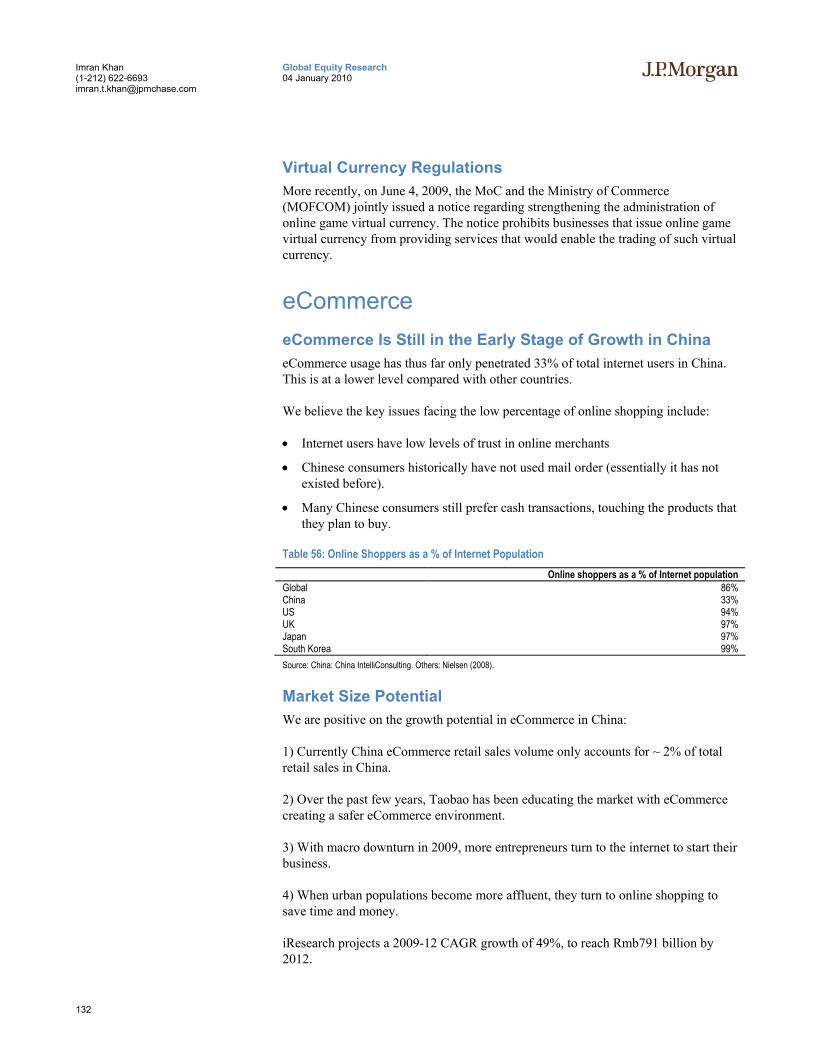
132
Global Equity Research 04 January 2010
Imran Khan (1-212) 622-6693 [email protected]
Virtual Currency Regulations More recently, on June 4, 2009, the MoC and the Ministry of Commerce (MOFCOM) jointly issued a notice regarding strengthening the administration of online game virtual currency. The notice prohibits businesses that issue online game virtual currency from providing services that would enable the trading of such virtual currency.
eCommerce eCommerce Is Still in the Early Stage of Growth in China eCommerce usage has thus far only penetrated 33% of total internet users in China. This is at a lower level compared with other countries.
We believe the key issues facing the low percentage of online shopping include:
• Internet users have low levels of trust in online merchants
• Chinese consumers historically have not used mail order (essentially it has not existed before).
• Many Chinese consumers still prefer cash transactions, touching the products that they plan to buy.
Table 56: Online Shoppers as a % of Internet Population Online shoppers as a % of Internet population
Global 86% China 33% US 94% UK 97% Japan 97% South Korea 99% Source: China: China IntelliConsulting. Others: Nielsen (2008).
Market Size Potential We are positive on the growth potential in eCommerce in China:
1) Currently China eCommerce retail sales volume only accounts for ~ 2% of total retail sales in China.
2) Over the past few years, Taobao has been educating the market with eCommerce creating a safer eCommerce environment.
3) With macro downturn in 2009, more entrepreneurs turn to the internet to start their business.
4) When urban populations become more affluent, they turn to online shopping to save time and money.
iResearch projects a 2009-12 CAGR growth of 49%, to reach Rmb791 billion by 2012.
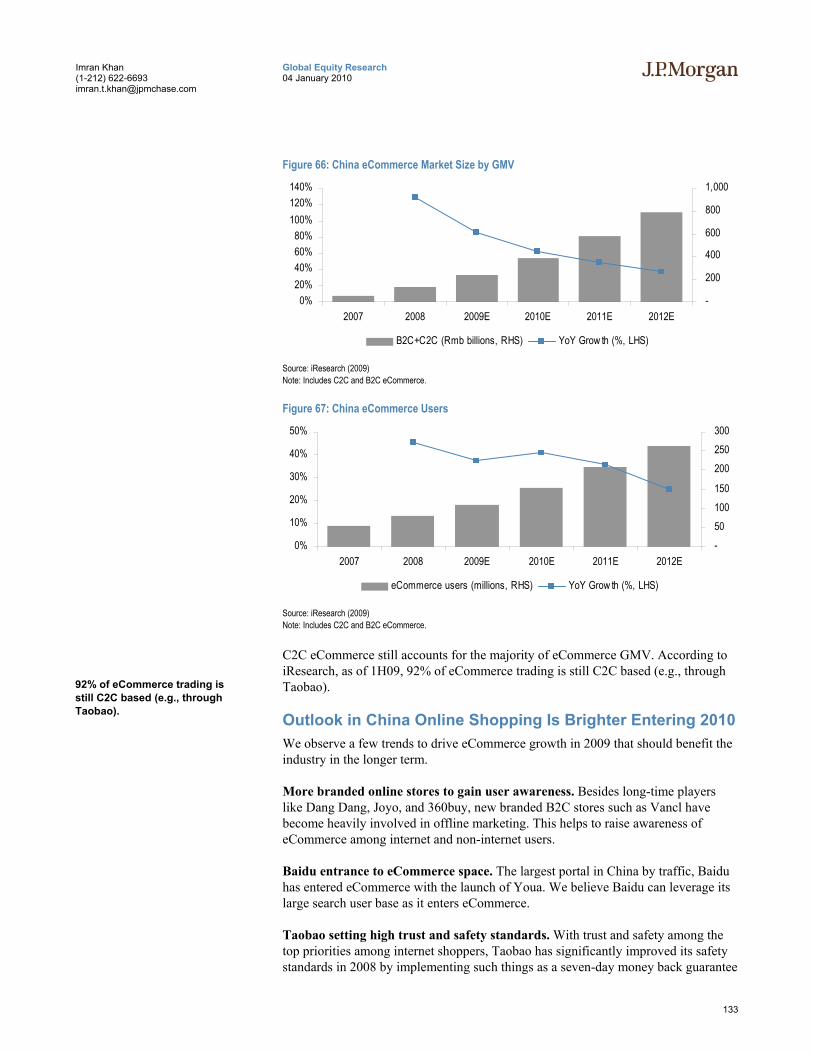
133
Global Equity Research 04 January 2010
Imran Khan (1-212) 622-6693 [email protected]
Figure 66: China eCommerce Market Size by GMV
0%20%40%60%80%
100%120%140%
2007 2008 2009E 2010E 2011E 2012E-
200
400
600
800
1,000
B2C+C2C (Rmb billions, RHS) YoY Grow th (%, LHS)
Source: iResearch (2009) Note: Includes C2C and B2C eCommerce.
Figure 67: China eCommerce Users
0%
10%
20%
30%
40%
50%
2007 2008 2009E 2010E 2011E 2012E-50100150
200250300
eCommerce users (millions, RHS) YoY Grow th (%, LHS)
Source: iResearch (2009) Note: Includes C2C and B2C eCommerce.
C2C eCommerce still accounts for the majority of eCommerce GMV. According to iResearch, as of 1H09, 92% of eCommerce trading is still C2C based (e.g., through Taobao).
Outlook in China Online Shopping Is Brighter Entering 2010 We observe a few trends to drive eCommerce growth in 2009 that should benefit the industry in the longer term.
More branded online stores to gain user awareness. Besides long-time players like Dang Dang, Joyo, and 360buy, new branded B2C stores such as Vancl have become heavily involved in offline marketing. This helps to raise awareness of eCommerce among internet and non-internet users.
Baidu entrance to eCommerce space. The largest portal in China by traffic, Baidu has entered eCommerce with the launch of Youa. We believe Baidu can leverage its large search user base as it enters eCommerce.
Taobao setting high trust and safety standards. With trust and safety among the top priorities among internet shoppers, Taobao has significantly improved its safety standards in 2008 by implementing such things as a seven-day money back guarantee
92% of eCommerce trading is still C2C based (e.g., through Taobao).
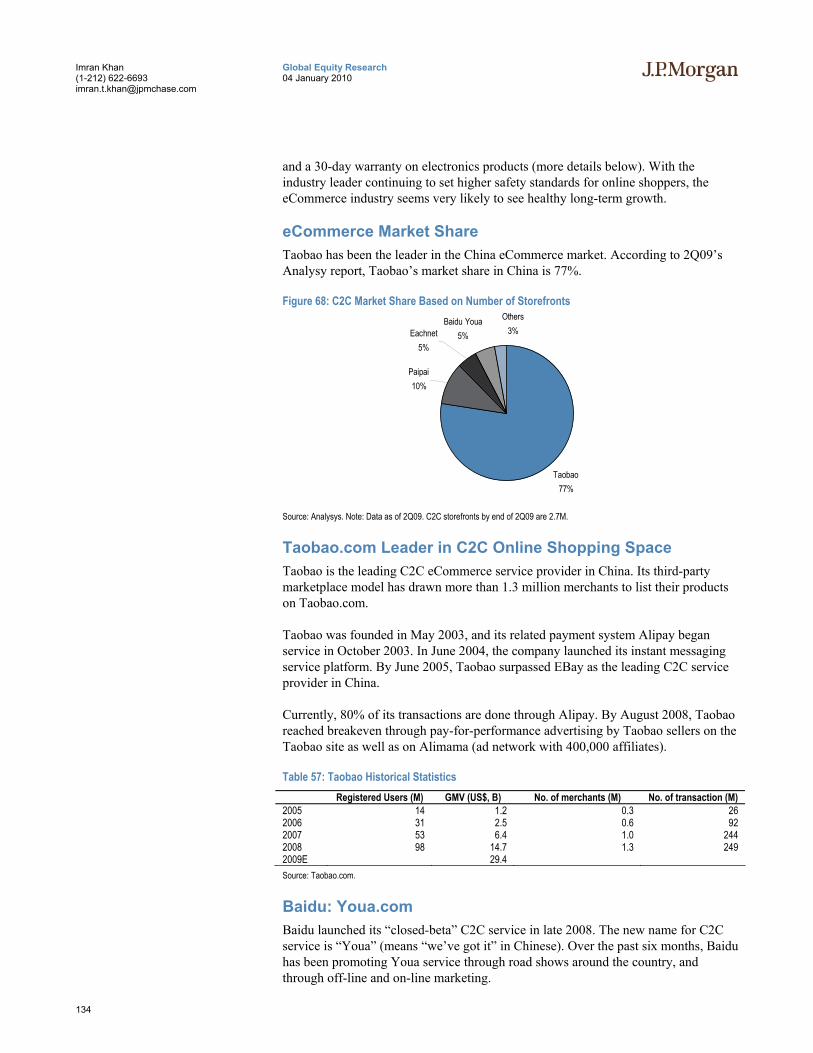
134
Global Equity Research 04 January 2010
Imran Khan (1-212) 622-6693 [email protected]
and a 30-day warranty on electronics products (more details below). With the industry leader continuing to set higher safety standards for online shoppers, the eCommerce industry seems very likely to see healthy long-term growth.
eCommerce Market Share Taobao has been the leader in the China eCommerce market. According to 2Q09’s Analysy report, Taobao’s market share in China is 77%.
Figure 68: C2C Market Share Based on Number of Storefronts
Taobao77%
Baidu Youa5%
Others3%Eachnet
5%
Paipai10%
Source: Analysys. Note: Data as of 2Q09. C2C storefronts by end of 2Q09 are 2.7M. Taobao.com Leader in C2C Online Shopping Space Taobao is the leading C2C eCommerce service provider in China. Its third-party marketplace model has drawn more than 1.3 million merchants to list their products on Taobao.com.
Taobao was founded in May 2003, and its related payment system Alipay began service in October 2003. In June 2004, the company launched its instant messaging service platform. By June 2005, Taobao surpassed EBay as the leading C2C service provider in China.
Currently, 80% of its transactions are done through Alipay. By August 2008, Taobao reached breakeven through pay-for-performance advertising by Taobao sellers on the Taobao site as well as on Alimama (ad network with 400,000 affiliates).
Table 57: Taobao Historical Statistics Registered Users (M) GMV (US$, B) No. of merchants (M) No. of transaction (M)
2005 14 1.2 0.3 26 2006 31 2.5 0.6 92 2007 53 6.4 1.0 244 2008 98 14.7 1.3 249 2009E 29.4 Source: Taobao.com.
Baidu: Youa.com Baidu launched its “closed-beta” C2C service in late 2008. The new name for C2C service is “Youa” (means “we’ve got it” in Chinese). Over the past six months, Baidu has been promoting Youa service through road shows around the country, and through off-line and on-line marketing.
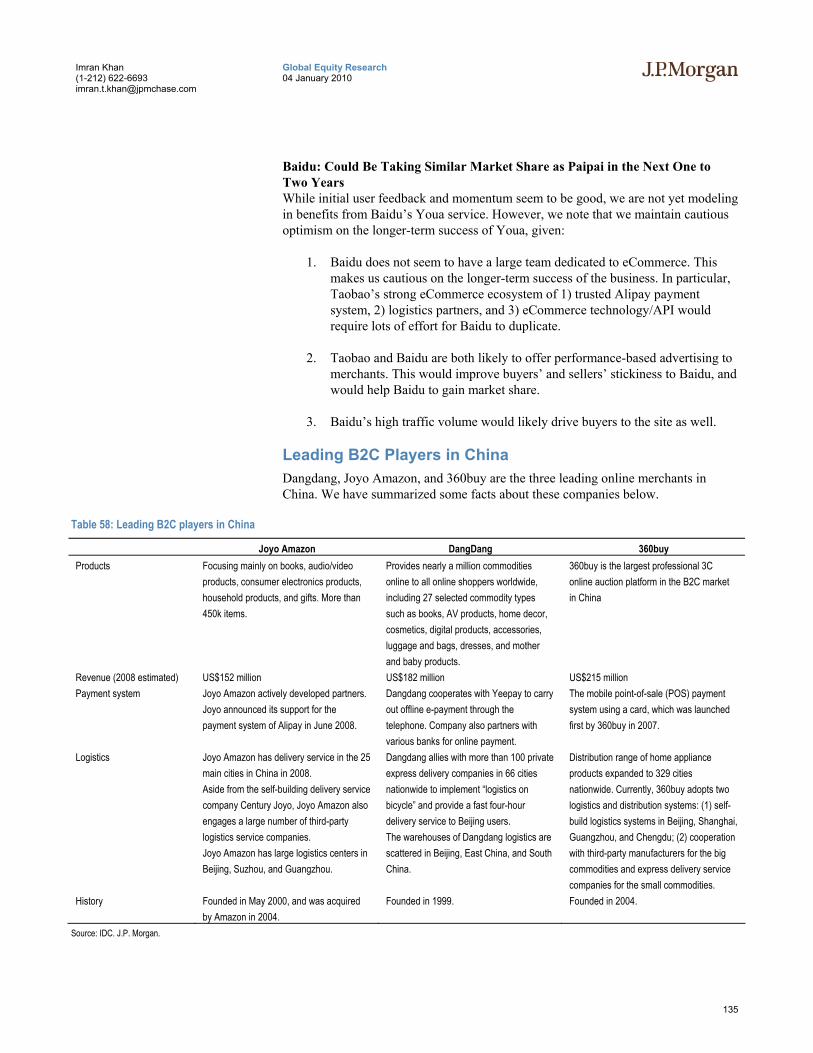
135
Global Equity Research 04 January 2010
Imran Khan (1-212) 622-6693 [email protected]
Baidu: Could Be Taking Similar Market Share as Paipai in the Next One to Two Years While initial user feedback and momentum seem to be good, we are not yet modeling in benefits from Baidu’s Youa service. However, we note that we maintain cautious optimism on the longer-term success of Youa, given:
1. Baidu does not seem to have a large team dedicated to eCommerce. This makes us cautious on the longer-term success of the business. In particular, Taobao’s strong eCommerce ecosystem of 1) trusted Alipay payment system, 2) logistics partners, and 3) eCommerce technology/API would require lots of effort for Baidu to duplicate.
2. Taobao and Baidu are both likely to offer performance-based advertising to merchants. This would improve buyers’ and sellers’ stickiness to Baidu, and would help Baidu to gain market share.
3. Baidu’s high traffic volume would likely drive buyers to the site as well.
Leading B2C Players in China Dangdang, Joyo Amazon, and 360buy are the three leading online merchants in China. We have summarized some facts about these companies below.
Table 58: Leading B2C players in China
Joyo Amazon DangDang 360buy Products Focusing mainly on books, audio/video
products, consumer electronics products, household products, and gifts. More than 450k items.
Provides nearly a million commodities online to all online shoppers worldwide, including 27 selected commodity types such as books, AV products, home decor, cosmetics, digital products, accessories, luggage and bags, dresses, and mother and baby products.
360buy is the largest professional 3C online auction platform in the B2C market in China
Revenue (2008 estimated) US$152 million US$182 million US$215 million Payment system Joyo Amazon actively developed partners.
Joyo announced its support for the payment system of Alipay in June 2008.
Dangdang cooperates with Yeepay to carry out offline e-payment through the telephone. Company also partners with various banks for online payment.
The mobile point-of-sale (POS) payment system using a card, which was launched first by 360buy in 2007.
Logistics Joyo Amazon has delivery service in the 25 main cities in China in 2008. Aside from the self-building delivery service company Century Joyo, Joyo Amazon also engages a large number of third-party logistics service companies. Joyo Amazon has large logistics centers in Beijing, Suzhou, and Guangzhou.
Dangdang allies with more than 100 private express delivery companies in 66 cities nationwide to implement “logistics on bicycle” and provide a fast four-hour delivery service to Beijing users. The warehouses of Dangdang logistics are scattered in Beijing, East China, and South China.
Distribution range of home appliance products expanded to 329 cities nationwide. Currently, 360buy adopts two logistics and distribution systems: (1) self-build logistics systems in Beijing, Shanghai, Guangzhou, and Chengdu; (2) cooperation with third-party manufacturers for the big commodities and express delivery service companies for the small commodities.
History Founded in May 2000, and was acquired by Amazon in 2004.
Founded in 1999. Founded in 2004.
Source: IDC. J.P. Morgan.
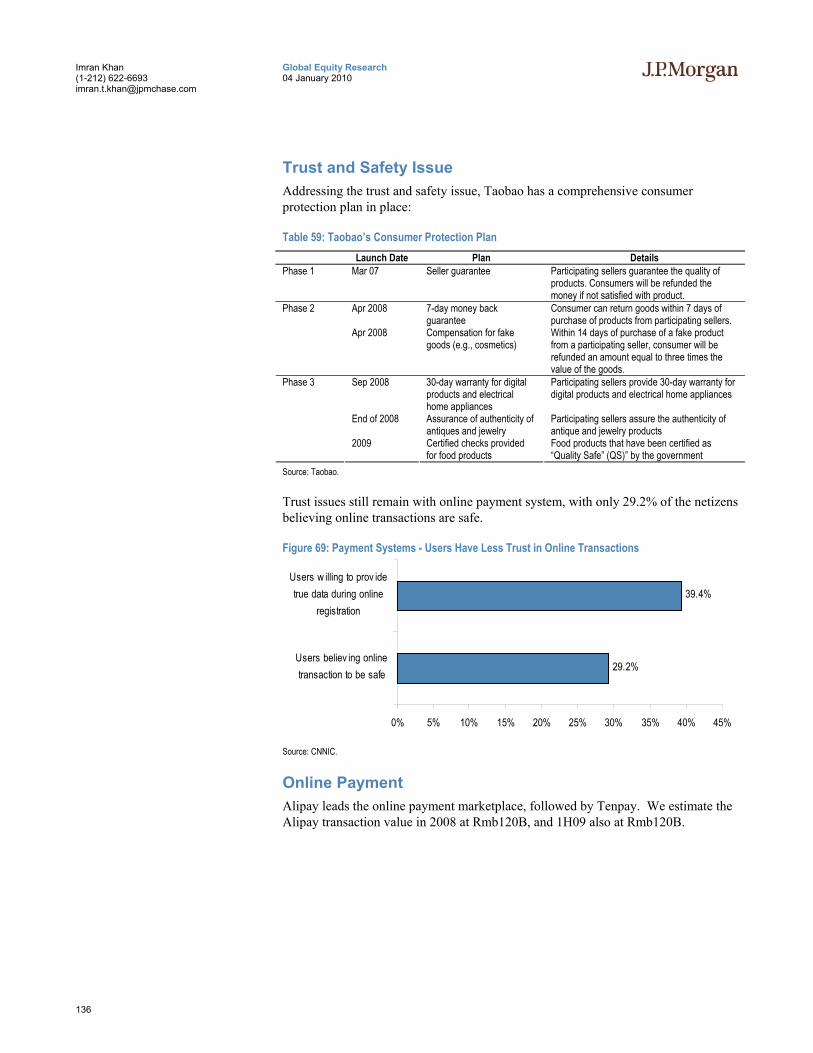
136
Global Equity Research 04 January 2010
Imran Khan (1-212) 622-6693 [email protected]
Trust and Safety Issue Addressing the trust and safety issue, Taobao has a comprehensive consumer protection plan in place:
Table 59: Taobao’s Consumer Protection Plan Launch Date Plan Details
Phase 1 Mar 07 Seller guarantee Participating sellers guarantee the quality of products. Consumers will be refunded the money if not satisfied with product.
Apr 2008 7-day money back guarantee
Consumer can return goods within 7 days of purchase of products from participating sellers.
Phase 2
Apr 2008 Compensation for fake goods (e.g., cosmetics)
Within 14 days of purchase of a fake product from a participating seller, consumer will be refunded an amount equal to three times the value of the goods.
Sep 2008 30-day warranty for digital products and electrical home appliances
Participating sellers provide 30-day warranty for digital products and electrical home appliances
End of 2008 Assurance of authenticity of antiques and jewelry
Participating sellers assure the authenticity of antique and jewelry products
Phase 3
2009 Certified checks provided for food products
Food products that have been certified as “Quality Safe” (QS)” by the government
Source: Taobao.
Trust issues still remain with online payment system, with only 29.2% of the netizens believing online transactions are safe.
Figure 69: Payment Systems - Users Have Less Trust in Online Transactions
29.2%
39.4%
0% 5% 10% 15% 20% 25% 30% 35% 40% 45%
Users believ ing onlinetransaction to be safe
Users w illing to prov idetrue data during online
registration
Source: CNNIC.
Online Payment Alipay leads the online payment marketplace, followed by Tenpay. We estimate the Alipay transaction value in 2008 at Rmb120B, and 1H09 also at Rmb120B.
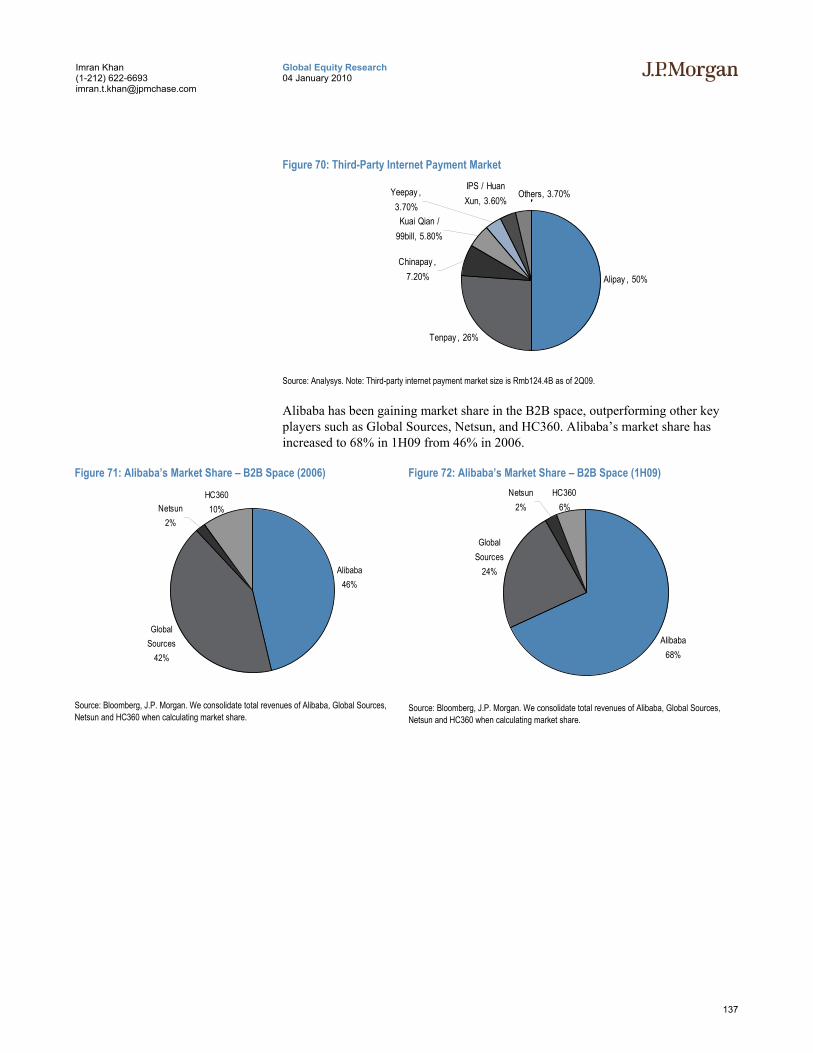
137
Global Equity Research 04 January 2010
Imran Khan (1-212) 622-6693 [email protected]
Figure 70: Third-Party Internet Payment Market
Alipay , 50%
Tenpay , 26%
, , , , Yeepay , 3.70%
IPS / Huan Xun, 3.60%
Kuai Qian / 99bill, 5.80%
Chinapay , 7.20%
Others, 3.70%
Source: Analysys. Note: Third-party internet payment market size is Rmb124.4B as of 2Q09.
Alibaba has been gaining market share in the B2B space, outperforming other key players such as Global Sources, Netsun, and HC360. Alibaba’s market share has increased to 68% in 1H09 from 46% in 2006.
Figure 71: Alibaba’s Market Share – B2B Space (2006)
Alibaba46%
Global Sources
42%
HC36010%Netsun
2%
Source: Bloomberg, J.P. Morgan. We consolidate total revenues of Alibaba, Global Sources, Netsun and HC360 when calculating market share.
Figure 72: Alibaba’s Market Share – B2B Space (1H09)
Alibaba68%
Global Sources
24%
Netsun2%
HC3606%
Source: Bloomberg, J.P. Morgan. We consolidate total revenues of Alibaba, Global Sources, Netsun and HC360 when calculating market share.

139
Global Equity Research 04 January 2010
Imran Khan (1-212) 622-6693 [email protected]
U.S. Company Previews
U.S
. Com
pany
Pre
view
s
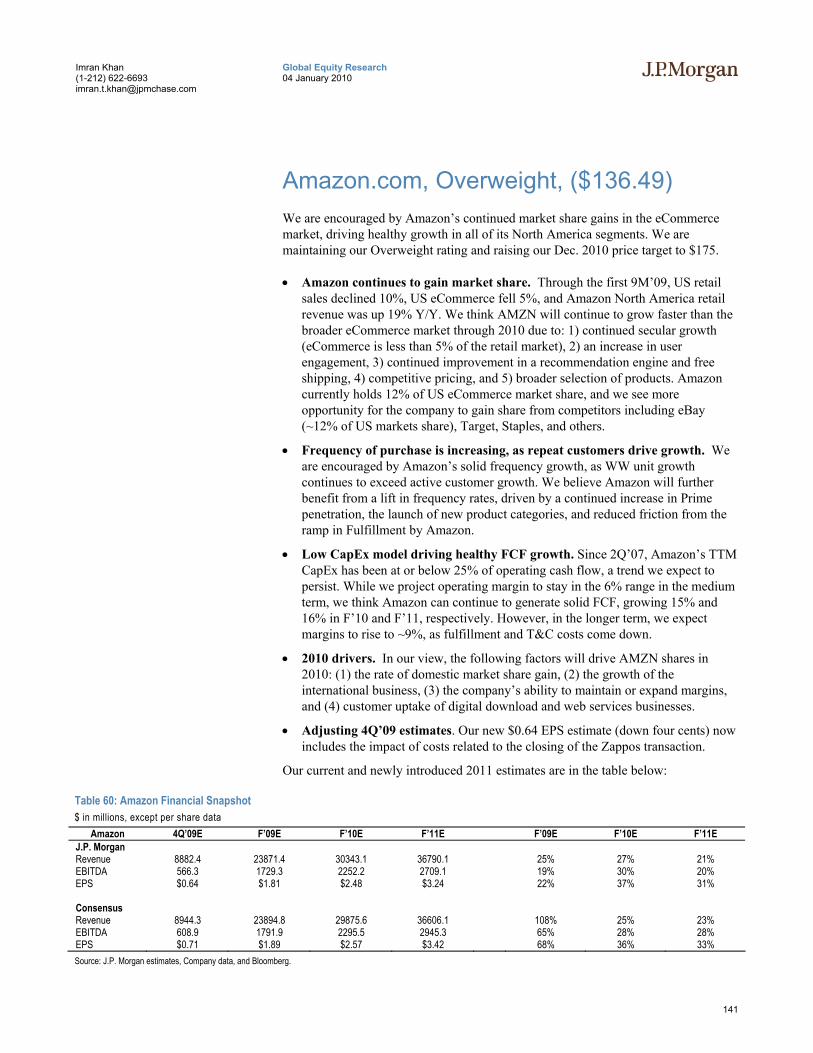
141
Global Equity Research 04 January 2010
Imran Khan (1-212) 622-6693 [email protected]
Amazon.com, Overweight, ($136.49) We are encouraged by Amazon’s continued market share gains in the eCommerce market, driving healthy growth in all of its North America segments. We are maintaining our Overweight rating and raising our Dec. 2010 price target to $175.
• Amazon continues to gain market share. Through the first 9M’09, US retail sales declined 10%, US eCommerce fell 5%, and Amazon North America retail revenue was up 19% Y/Y. We think AMZN will continue to grow faster than the broader eCommerce market through 2010 due to: 1) continued secular growth (eCommerce is less than 5% of the retail market), 2) an increase in user engagement, 3) continued improvement in a recommendation engine and free shipping, 4) competitive pricing, and 5) broader selection of products. Amazon currently holds 12% of US eCommerce market share, and we see more opportunity for the company to gain share from competitors including eBay (~12% of US markets share), Target, Staples, and others.
• Frequency of purchase is increasing, as repeat customers drive growth. We are encouraged by Amazon’s solid frequency growth, as WW unit growth continues to exceed active customer growth. We believe Amazon will further benefit from a lift in frequency rates, driven by a continued increase in Prime penetration, the launch of new product categories, and reduced friction from the ramp in Fulfillment by Amazon.
• Low CapEx model driving healthy FCF growth. Since 2Q’07, Amazon’s TTM CapEx has been at or below 25% of operating cash flow, a trend we expect to persist. While we project operating margin to stay in the 6% range in the medium term, we think Amazon can continue to generate solid FCF, growing 15% and 16% in F’10 and F’11, respectively. However, in the longer term, we expect margins to rise to ~9%, as fulfillment and T&C costs come down.
• 2010 drivers. In our view, the following factors will drive AMZN shares in 2010: (1) the rate of domestic market share gain, (2) the growth of the international business, (3) the company’s ability to maintain or expand margins, and (4) customer uptake of digital download and web services businesses.
• Adjusting 4Q’09 estimates. Our new $0.64 EPS estimate (down four cents) now includes the impact of costs related to the closing of the Zappos transaction.
Our current and newly introduced 2011 estimates are in the table below:
Table 60: Amazon Financial Snapshot $ in millions, except per share data
Amazon 4Q’09E F’09E F’10E F’11E F’09E F’10E F’11E J.P. Morgan Revenue 8882.4 23871.4 30343.1 36790.1 25% 27% 21% EBITDA 566.3 1729.3 2252.2 2709.1 19% 30% 20% EPS $0.64 $1.81 $2.48 $3.24 22% 37% 31%
Consensus Revenue 8944.3 23894.8 29875.6 36606.1 108% 25% 23% EBITDA 608.9 1791.9 2295.5 2945.3 65% 28% 28% EPS $0.71 $1.89 $2.57 $3.42 68% 36% 33% Source: J.P. Morgan estimates, Company data, and Bloomberg.
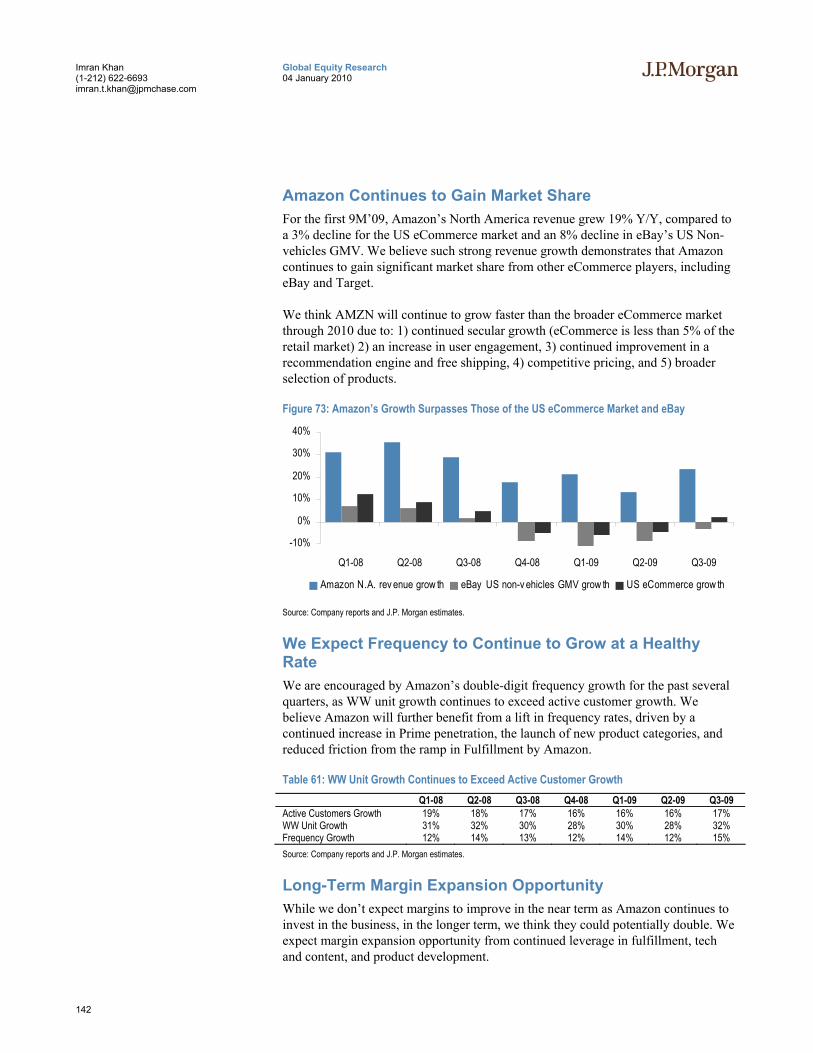
142
Global Equity Research 04 January 2010
Imran Khan (1-212) 622-6693 [email protected]
Amazon Continues to Gain Market Share For the first 9M’09, Amazon’s North America revenue grew 19% Y/Y, compared to a 3% decline for the US eCommerce market and an 8% decline in eBay’s US Non-vehicles GMV. We believe such strong revenue growth demonstrates that Amazon continues to gain significant market share from other eCommerce players, including eBay and Target.
We think AMZN will continue to grow faster than the broader eCommerce market through 2010 due to: 1) continued secular growth (eCommerce is less than 5% of the retail market) 2) an increase in user engagement, 3) continued improvement in a recommendation engine and free shipping, 4) competitive pricing, and 5) broader selection of products.
Figure 73: Amazon’s Growth Surpasses Those of the US eCommerce Market and eBay
-10%
0%
10%
20%
30%
40%
Q1-08 Q2-08 Q3-08 Q4-08 Q1-09 Q2-09 Q3-09
Amazon N.A. rev enue grow th eBay US non-v ehicles GMV grow th US eCommerce grow th
Source: Company reports and J.P. Morgan estimates.
We Expect Frequency to Continue to Grow at a Healthy Rate We are encouraged by Amazon’s double-digit frequency growth for the past several quarters, as WW unit growth continues to exceed active customer growth. We believe Amazon will further benefit from a lift in frequency rates, driven by a continued increase in Prime penetration, the launch of new product categories, and reduced friction from the ramp in Fulfillment by Amazon.
Table 61: WW Unit Growth Continues to Exceed Active Customer Growth Q1-08 Q2-08 Q3-08 Q4-08 Q1-09 Q2-09 Q3-09
Active Customers Growth 19% 18% 17% 16% 16% 16% 17% WW Unit Growth 31% 32% 30% 28% 30% 28% 32% Frequency Growth 12% 14% 13% 12% 14% 12% 15% Source: Company reports and J.P. Morgan estimates.
Long-Term Margin Expansion Opportunity While we don’t expect margins to improve in the near term as Amazon continues to invest in the business, in the longer term, we think they could potentially double. We expect margin expansion opportunity from continued leverage in fulfillment, tech and content, and product development.
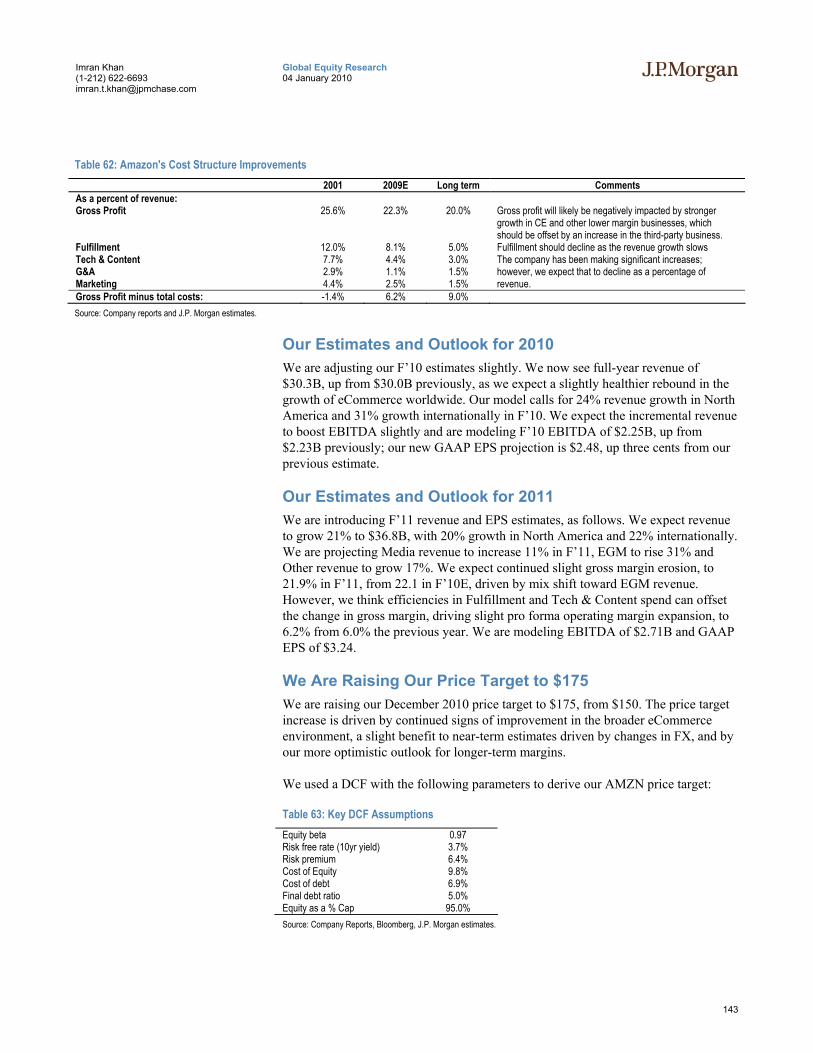
143
Global Equity Research 04 January 2010
Imran Khan (1-212) 622-6693 [email protected]
Table 62: Amazon's Cost Structure Improvements 2001 2009E Long term Comments
As a percent of revenue: Gross Profit 25.6% 22.3% 20.0% Gross profit will likely be negatively impacted by stronger
growth in CE and other lower margin businesses, which should be offset by an increase in the third-party business.
Fulfillment 12.0% 8.1% 5.0% Fulfillment should decline as the revenue growth slows Tech & Content 7.7% 4.4% 3.0% G&A 2.9% 1.1% 1.5% Marketing 4.4% 2.5% 1.5%
The company has been making significant increases; however, we expect that to decline as a percentage of revenue.
Gross Profit minus total costs: -1.4% 6.2% 9.0% Source: Company reports and J.P. Morgan estimates.
Our Estimates and Outlook for 2010 We are adjusting our F’10 estimates slightly. We now see full-year revenue of $30.3B, up from $30.0B previously, as we expect a slightly healthier rebound in the growth of eCommerce worldwide. Our model calls for 24% revenue growth in North America and 31% growth internationally in F’10. We expect the incremental revenue to boost EBITDA slightly and are modeling F’10 EBITDA of $2.25B, up from $2.23B previously; our new GAAP EPS projection is $2.48, up three cents from our previous estimate.
Our Estimates and Outlook for 2011 We are introducing F’11 revenue and EPS estimates, as follows. We expect revenue to grow 21% to $36.8B, with 20% growth in North America and 22% internationally. We are projecting Media revenue to increase 11% in F’11, EGM to rise 31% and Other revenue to grow 17%. We expect continued slight gross margin erosion, to 21.9% in F’11, from 22.1 in F’10E, driven by mix shift toward EGM revenue. However, we think efficiencies in Fulfillment and Tech & Content spend can offset the change in gross margin, driving slight pro forma operating margin expansion, to 6.2% from 6.0% the previous year. We are modeling EBITDA of $2.71B and GAAP EPS of $3.24.
We Are Raising Our Price Target to $175 We are raising our December 2010 price target to $175, from $150. The price target increase is driven by continued signs of improvement in the broader eCommerce environment, a slight benefit to near-term estimates driven by changes in FX, and by our more optimistic outlook for longer-term margins.
We used a DCF with the following parameters to derive our AMZN price target:
Table 63: Key DCF Assumptions Equity beta 0.97 Risk free rate (10yr yield) 3.7% Risk premium 6.4% Cost of Equity 9.8% Cost of debt 6.9% Final debt ratio 5.0% Equity as a % Cap 95.0% Source: Company Reports, Bloomberg, J.P. Morgan estimates.
144
Global Equity Research 04 January 2010
Imran Khan (1-212) 622-6693 [email protected]
Valuation and Rating Analysis AMZN trades at a premium to its peers. Our F’10 assumptions yield a 2010E EV/EBITDA multiple of 25.4x our F’10 EBITDA estimate of $2.25B, versus the eCommerce group at 13.5x and its large-cap peers at 14.0x. Given the rapid revenue growth and superior industry position, we believe the stock has capacity to see further multiple expansion and thus rate AMZN Overweight.
Risks to Our Rating AMZN could underperform if it encounters difficulties in its international expansion, including regulatory hurdles that make the business climate less hospitable or less profitable than the markets where it currently operates. Amazon may have difficulty growing revenues while maintaining its current operating margins. Amazon could suffer if consumer spending continues weakening or remains depressed longer than we expect. Amazon faces competition from a variety of online and offline retailers, and improved offerings from these competitors could hamper Amazon’s growth.
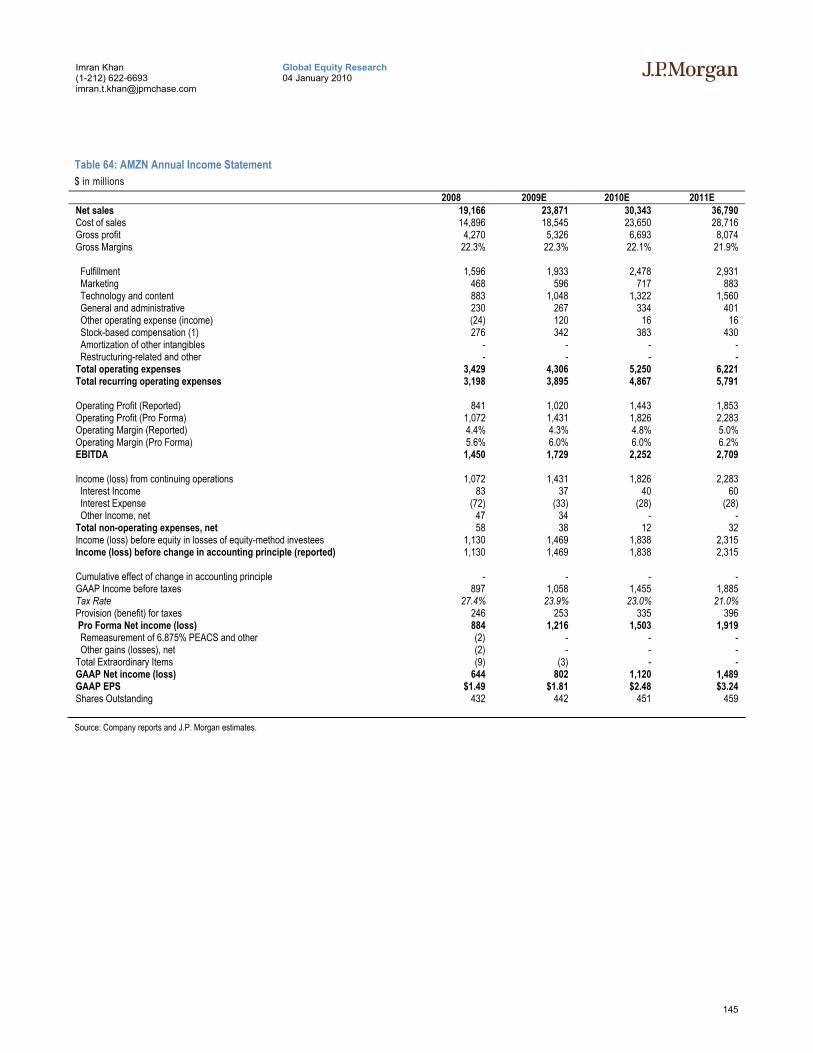
145
Global Equity Research 04 January 2010
Imran Khan (1-212) 622-6693 [email protected]
Table 64: AMZN Annual Income Statement $ in millions
2008 2009E 2010E 2011E Net sales 19,166 23,871 30,343 36,790 Cost of sales 14,896 18,545 23,650 28,716 Gross profit 4,270 5,326 6,693 8,074 Gross Margins 22.3% 22.3% 22.1% 21.9% Fulfillment 1,596 1,933 2,478 2,931 Marketing 468 596 717 883 Technology and content 883 1,048 1,322 1,560 General and administrative 230 267 334 401 Other operating expense (income) (24) 120 16 16 Stock-based compensation (1) 276 342 383 430 Amortization of other intangibles - - - - Restructuring-related and other - - - - Total operating expenses 3,429 4,306 5,250 6,221 Total recurring operating expenses 3,198 3,895 4,867 5,791 Operating Profit (Reported) 841 1,020 1,443 1,853 Operating Profit (Pro Forma) 1,072 1,431 1,826 2,283 Operating Margin (Reported) 4.4% 4.3% 4.8% 5.0% Operating Margin (Pro Forma) 5.6% 6.0% 6.0% 6.2% EBITDA 1,450 1,729 2,252 2,709 Income (loss) from continuing operations 1,072 1,431 1,826 2,283 Interest Income 83 37 40 60 Interest Expense (72) (33) (28) (28) Other Income, net 47 34 - - Total non-operating expenses, net 58 38 12 32 Income (loss) before equity in losses of equity-method investees 1,130 1,469 1,838 2,315 Income (loss) before change in accounting principle (reported) 1,130 1,469 1,838 2,315 Cumulative effect of change in accounting principle - - - - GAAP Income before taxes 897 1,058 1,455 1,885 Tax Rate 27.4% 23.9% 23.0% 21.0% Provision (benefit) for taxes 246 253 335 396 Pro Forma Net income (loss) 884 1,216 1,503 1,919 Remeasurement of 6.875% PEACS and other (2) - - - Other gains (losses), net (2) - - - Total Extraordinary Items (9) (3) - - GAAP Net income (loss) 644 802 1,120 1,489 GAAP EPS $1.49 $1.81 $2.48 $3.24 Shares Outstanding 432 442 451 459 Source: Company reports and J.P. Morgan estimates.
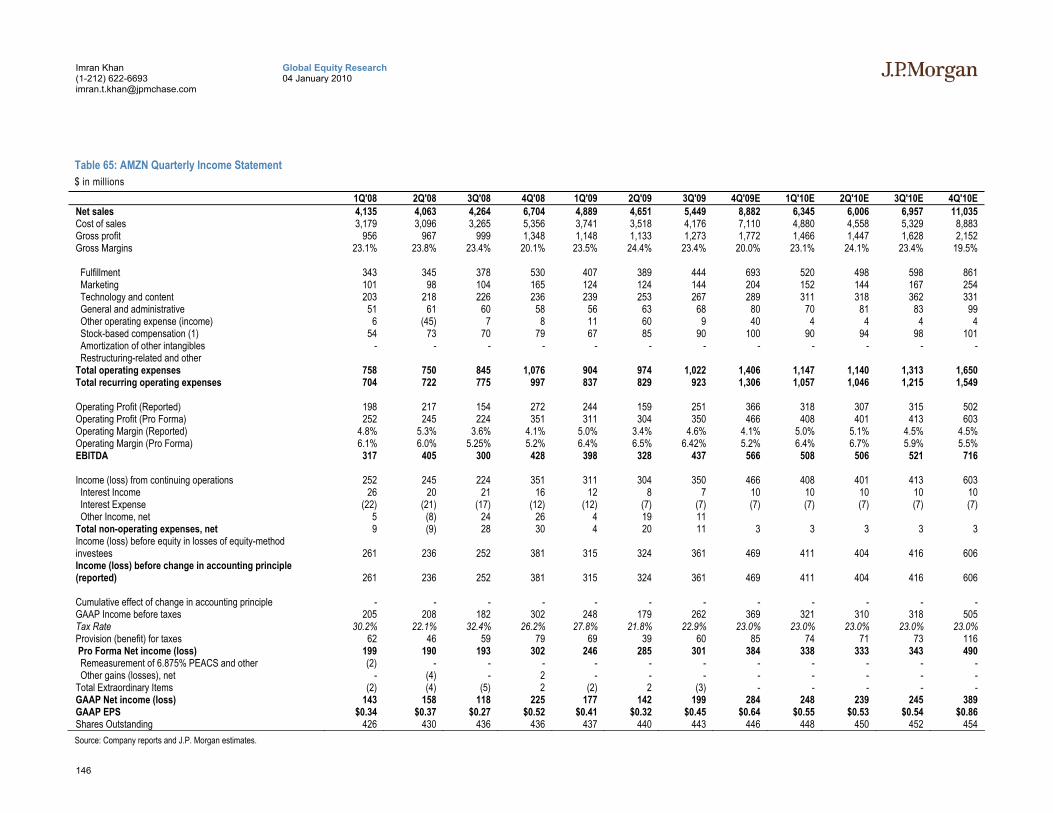
146
Global Equity Research 04 January 2010
Imran Khan (1-212) 622-6693 [email protected]
Table 65: AMZN Quarterly Income Statement $ in millions
1Q'08 2Q'08 3Q'08 4Q'08 1Q'09 2Q'09 3Q'09 4Q'09E 1Q'10E 2Q'10E 3Q'10E 4Q'10E Net sales 4,135 4,063 4,264 6,704 4,889 4,651 5,449 8,882 6,345 6,006 6,957 11,035 Cost of sales 3,179 3,096 3,265 5,356 3,741 3,518 4,176 7,110 4,880 4,558 5,329 8,883 Gross profit 956 967 999 1,348 1,148 1,133 1,273 1,772 1,466 1,447 1,628 2,152 Gross Margins 23.1% 23.8% 23.4% 20.1% 23.5% 24.4% 23.4% 20.0% 23.1% 24.1% 23.4% 19.5% Fulfillment 343 345 378 530 407 389 444 693 520 498 598 861 Marketing 101 98 104 165 124 124 144 204 152 144 167 254 Technology and content 203 218 226 236 239 253 267 289 311 318 362 331 General and administrative 51 61 60 58 56 63 68 80 70 81 83 99 Other operating expense (income) 6 (45) 7 8 11 60 9 40 4 4 4 4 Stock-based compensation (1) 54 73 70 79 67 85 90 100 90 94 98 101 Amortization of other intangibles - - - - - - - - - - - - Restructuring-related and other Total operating expenses 758 750 845 1,076 904 974 1,022 1,406 1,147 1,140 1,313 1,650 Total recurring operating expenses 704 722 775 997 837 829 923 1,306 1,057 1,046 1,215 1,549 Operating Profit (Reported) 198 217 154 272 244 159 251 366 318 307 315 502 Operating Profit (Pro Forma) 252 245 224 351 311 304 350 466 408 401 413 603 Operating Margin (Reported) 4.8% 5.3% 3.6% 4.1% 5.0% 3.4% 4.6% 4.1% 5.0% 5.1% 4.5% 4.5% Operating Margin (Pro Forma) 6.1% 6.0% 5.25% 5.2% 6.4% 6.5% 6.42% 5.2% 6.4% 6.7% 5.9% 5.5% EBITDA 317 405 300 428 398 328 437 566 508 506 521 716 Income (loss) from continuing operations 252 245 224 351 311 304 350 466 408 401 413 603 Interest Income 26 20 21 16 12 8 7 10 10 10 10 10 Interest Expense (22) (21) (17) (12) (12) (7) (7) (7) (7) (7) (7) (7) Other Income, net 5 (8) 24 26 4 19 11 Total non-operating expenses, net 9 (9) 28 30 4 20 11 3 3 3 3 3 Income (loss) before equity in losses of equity-method investees 261 236 252 381 315 324 361 469 411 404 416 606 Income (loss) before change in accounting principle (reported) 261 236 252 381 315 324 361 469 411 404 416 606 Cumulative effect of change in accounting principle - - - - - - - - - - - - GAAP Income before taxes 205 208 182 302 248 179 262 369 321 310 318 505 Tax Rate 30.2% 22.1% 32.4% 26.2% 27.8% 21.8% 22.9% 23.0% 23.0% 23.0% 23.0% 23.0% Provision (benefit) for taxes 62 46 59 79 69 39 60 85 74 71 73 116 Pro Forma Net income (loss) 199 190 193 302 246 285 301 384 338 333 343 490 Remeasurement of 6.875% PEACS and other (2) - - - - - - - - - - - Other gains (losses), net - (4) - 2 - - - - - - - - Total Extraordinary Items (2) (4) (5) 2 (2) 2 (3) - - - - - GAAP Net income (loss) 143 158 118 225 177 142 199 284 248 239 245 389 GAAP EPS $0.34 $0.37 $0.27 $0.52 $0.41 $0.32 $0.45 $0.64 $0.55 $0.53 $0.54 $0.86 Shares Outstanding 426 430 436 436 437 440 443 446 448 450 452 454 Source: Company reports and J.P. Morgan estimates.
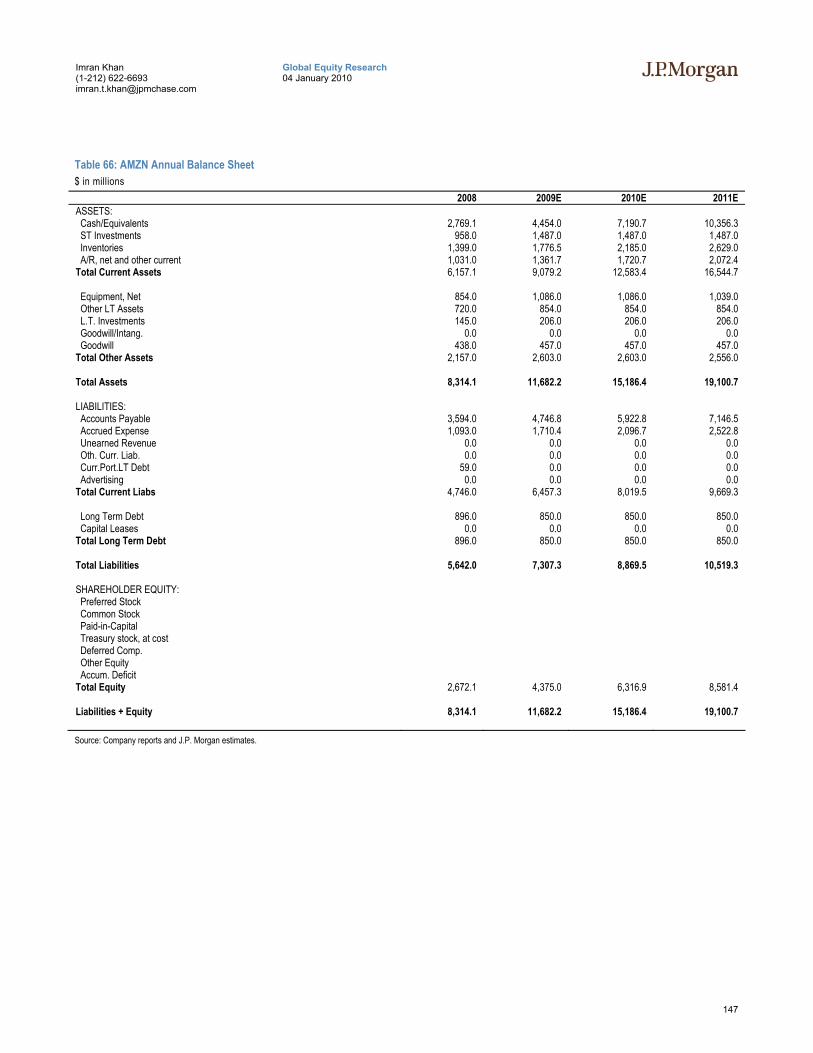
147
Global Equity Research 04 January 2010
Imran Khan (1-212) 622-6693 [email protected]
Table 66: AMZN Annual Balance Sheet $ in millions
2008 2009E 2010E 2011E ASSETS: Cash/Equivalents 2,769.1 4,454.0 7,190.7 10,356.3 ST Investments 958.0 1,487.0 1,487.0 1,487.0 Inventories 1,399.0 1,776.5 2,185.0 2,629.0 A/R, net and other current 1,031.0 1,361.7 1,720.7 2,072.4 Total Current Assets 6,157.1 9,079.2 12,583.4 16,544.7 Equipment, Net 854.0 1,086.0 1,086.0 1,039.0 Other LT Assets 720.0 854.0 854.0 854.0 L.T. Investments 145.0 206.0 206.0 206.0 Goodwill/Intang. 0.0 0.0 0.0 0.0 Goodwill 438.0 457.0 457.0 457.0 Total Other Assets 2,157.0 2,603.0 2,603.0 2,556.0 Total Assets 8,314.1 11,682.2 15,186.4 19,100.7 LIABILITIES: Accounts Payable 3,594.0 4,746.8 5,922.8 7,146.5 Accrued Expense 1,093.0 1,710.4 2,096.7 2,522.8 Unearned Revenue 0.0 0.0 0.0 0.0 Oth. Curr. Liab. 0.0 0.0 0.0 0.0 Curr.Port.LT Debt 59.0 0.0 0.0 0.0 Advertising 0.0 0.0 0.0 0.0 Total Current Liabs 4,746.0 6,457.3 8,019.5 9,669.3 Long Term Debt 896.0 850.0 850.0 850.0 Capital Leases 0.0 0.0 0.0 0.0 Total Long Term Debt 896.0 850.0 850.0 850.0 Total Liabilities 5,642.0 7,307.3 8,869.5 10,519.3 SHAREHOLDER EQUITY: Preferred Stock Common Stock Paid-in-Capital Treasury stock, at cost Deferred Comp. Other Equity Accum. Deficit Total Equity 2,672.1 4,375.0 6,316.9 8,581.4 Liabilities + Equity 8,314.1 11,682.2 15,186.4 19,100.7 Source: Company reports and J.P. Morgan estimates.
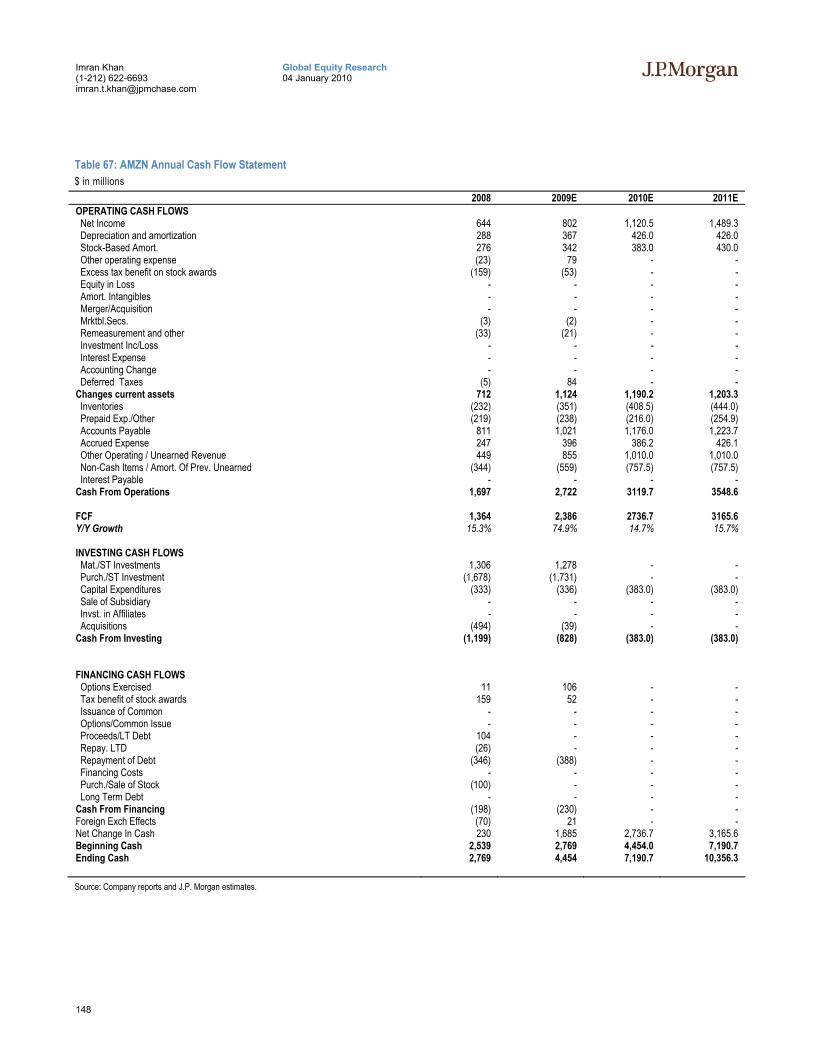
148
Global Equity Research 04 January 2010
Imran Khan (1-212) 622-6693 [email protected]
Table 67: AMZN Annual Cash Flow Statement $ in millions
2008 2009E 2010E 2011E OPERATING CASH FLOWS Net Income 644 802 1,120.5 1,489.3 Depreciation and amortization 288 367 426.0 426.0 Stock-Based Amort. 276 342 383.0 430.0 Other operating expense (23) 79 - - Excess tax benefit on stock awards (159) (53) - - Equity in Loss - - - - Amort. Intangibles - - - - Merger/Acquisition - - - - Mrktbl.Secs. (3) (2) - - Remeasurement and other (33) (21) - - Investment Inc/Loss - - - - Interest Expense - - - - Accounting Change - - - - Deferred Taxes (5) 84 - - Changes current assets 712 1,124 1,190.2 1,203.3 Inventories (232) (351) (408.5) (444.0) Prepaid Exp./Other (219) (238) (216.0) (254.9) Accounts Payable 811 1,021 1,176.0 1,223.7 Accrued Expense 247 396 386.2 426.1 Other Operating / Unearned Revenue 449 855 1,010.0 1,010.0 Non-Cash Items / Amort. Of Prev. Unearned (344) (559) (757.5) (757.5) Interest Payable - - - - Cash From Operations 1,697 2,722 3119.7 3548.6 FCF 1,364 2,386 2736.7 3165.6 Y/Y Growth 15.3% 74.9% 14.7% 15.7% INVESTING CASH FLOWS Mat./ST Investments 1,306 1,278 - - Purch./ST Investment (1,678) (1,731) - - Capital Expenditures (333) (336) (383.0) (383.0) Sale of Subsidiary - - - - Invst. in Affiliates - - - - Acquisitions (494) (39) - - Cash From Investing (1,199) (828) (383.0) (383.0) FINANCING CASH FLOWS Options Exercised 11 106 - - Tax benefit of stock awards 159 52 - - Issuance of Common - - - - Options/Common Issue - - - - Proceeds/LT Debt 104 - - - Repay. LTD (26) - - - Repayment of Debt (346) (388) - - Financing Costs - - - - Purch./Sale of Stock (100) - - - Long Term Debt - - - - Cash From Financing (198) (230) - - Foreign Exch Effects (70) 21 - - Net Change In Cash 230 1,685 2,736.7 3,165.6 Beginning Cash 2,539 2,769 4,454.0 7,190.7 Ending Cash 2,769 4,454 7,190.7 10,356.3 Source: Company reports and J.P. Morgan estimates.
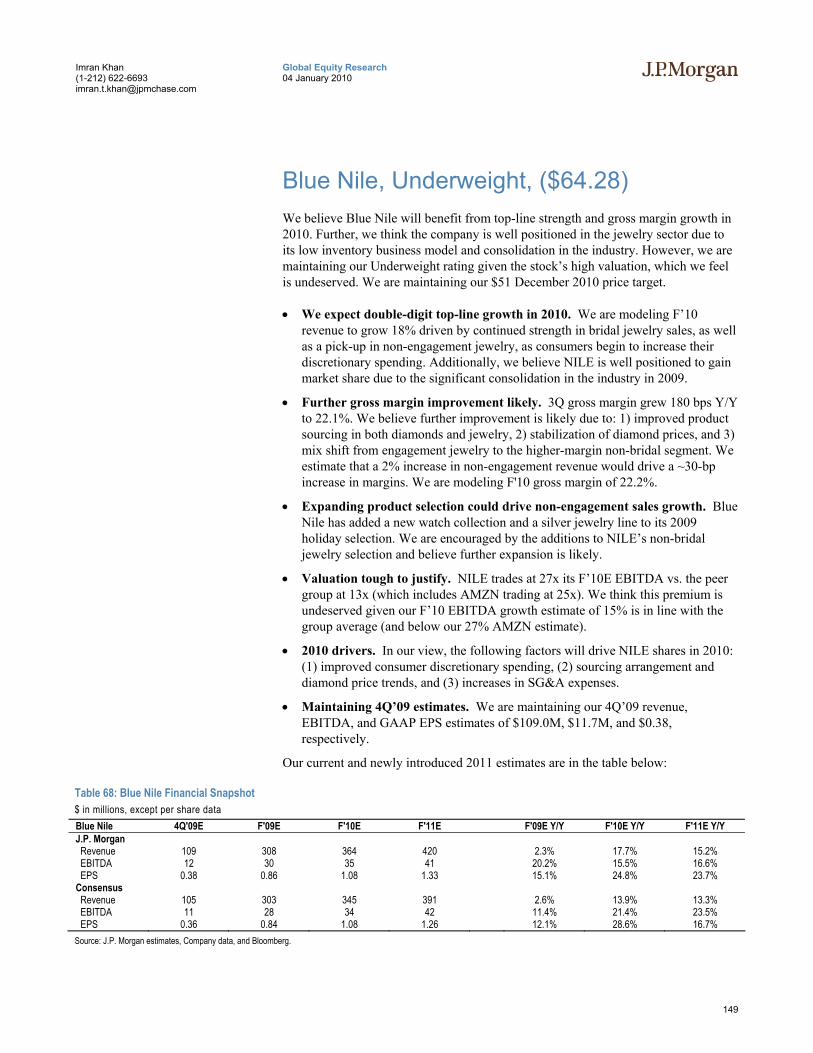
149
Global Equity Research 04 January 2010
Imran Khan (1-212) 622-6693 [email protected]
Blue Nile, Underweight, ($64.28) We believe Blue Nile will benefit from top-line strength and gross margin growth in 2010. Further, we think the company is well positioned in the jewelry sector due to its low inventory business model and consolidation in the industry. However, we are maintaining our Underweight rating given the stock’s high valuation, which we feel is undeserved. We are maintaining our $51 December 2010 price target.
• We expect double-digit top-line growth in 2010. We are modeling F’10 revenue to grow 18% driven by continued strength in bridal jewelry sales, as well as a pick-up in non-engagement jewelry, as consumers begin to increase their discretionary spending. Additionally, we believe NILE is well positioned to gain market share due to the significant consolidation in the industry in 2009.
• Further gross margin improvement likely. 3Q gross margin grew 180 bps Y/Y to 22.1%. We believe further improvement is likely due to: 1) improved product sourcing in both diamonds and jewelry, 2) stabilization of diamond prices, and 3) mix shift from engagement jewelry to the higher-margin non-bridal segment. We estimate that a 2% increase in non-engagement revenue would drive a ~30-bp increase in margins. We are modeling F'10 gross margin of 22.2%.
• Expanding product selection could drive non-engagement sales growth. Blue Nile has added a new watch collection and a silver jewelry line to its 2009 holiday selection. We are encouraged by the additions to NILE’s non-bridal jewelry selection and believe further expansion is likely.
• Valuation tough to justify. NILE trades at 27x its F’10E EBITDA vs. the peer group at 13x (which includes AMZN trading at 25x). We think this premium is undeserved given our F’10 EBITDA growth estimate of 15% is in line with the group average (and below our 27% AMZN estimate).
• 2010 drivers. In our view, the following factors will drive NILE shares in 2010: (1) improved consumer discretionary spending, (2) sourcing arrangement and diamond price trends, and (3) increases in SG&A expenses.
• Maintaining 4Q’09 estimates. We are maintaining our 4Q’09 revenue, EBITDA, and GAAP EPS estimates of $109.0M, $11.7M, and $0.38, respectively.
Our current and newly introduced 2011 estimates are in the table below:
Table 68: Blue Nile Financial Snapshot $ in millions, except per share data Blue Nile 4Q'09E F'09E F'10E F'11E F'09E Y/Y F'10E Y/Y F'11E Y/Y J.P. Morgan Revenue 109 308 364 420 2.3% 17.7% 15.2% EBITDA 12 30 35 41 20.2% 15.5% 16.6% EPS 0.38 0.86 1.08 1.33 15.1% 24.8% 23.7% Consensus Revenue 105 303 345 391 2.6% 13.9% 13.3% EBITDA 11 28 34 42 11.4% 21.4% 23.5% EPS 0.36 0.84 1.08 1.26 12.1% 28.6% 16.7% Source: J.P. Morgan estimates, Company data, and Bloomberg.
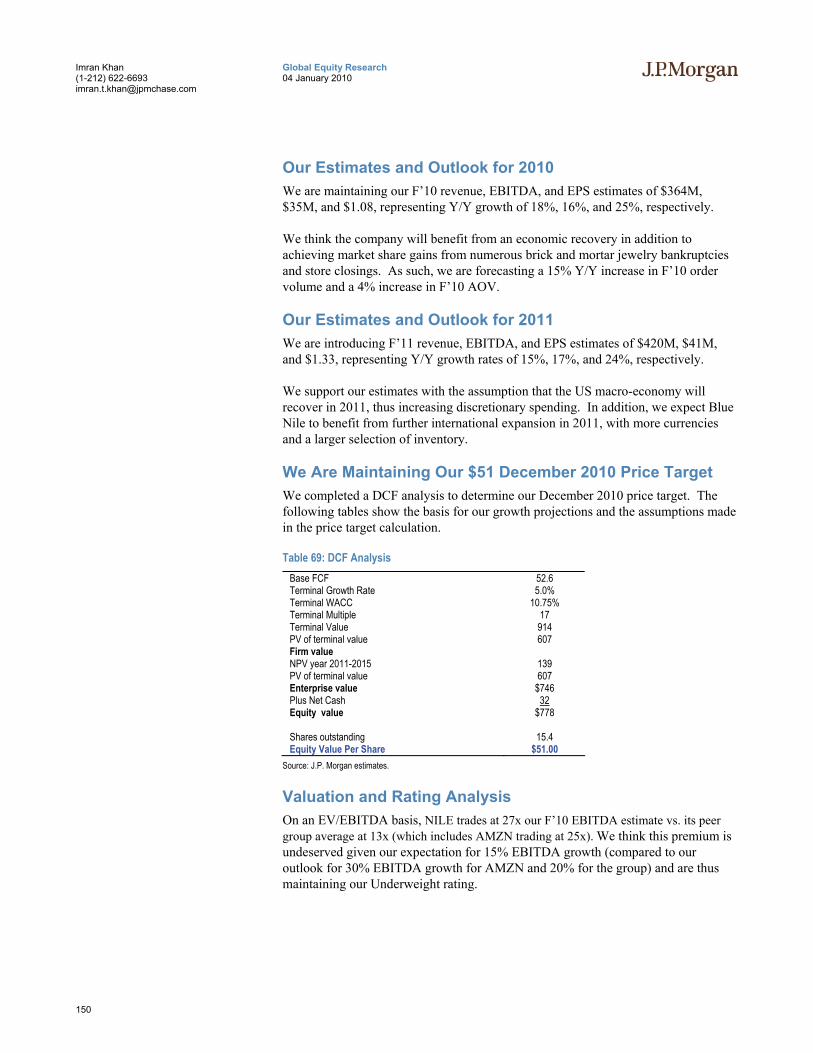
150
Global Equity Research 04 January 2010
Imran Khan (1-212) 622-6693 [email protected]
Our Estimates and Outlook for 2010 We are maintaining our F’10 revenue, EBITDA, and EPS estimates of $364M, $35M, and $1.08, representing Y/Y growth of 18%, 16%, and 25%, respectively.
We think the company will benefit from an economic recovery in addition to achieving market share gains from numerous brick and mortar jewelry bankruptcies and store closings. As such, we are forecasting a 15% Y/Y increase in F’10 order volume and a 4% increase in F’10 AOV.
Our Estimates and Outlook for 2011 We are introducing F’11 revenue, EBITDA, and EPS estimates of $420M, $41M, and $1.33, representing Y/Y growth rates of 15%, 17%, and 24%, respectively.
We support our estimates with the assumption that the US macro-economy will recover in 2011, thus increasing discretionary spending. In addition, we expect Blue Nile to benefit from further international expansion in 2011, with more currencies and a larger selection of inventory.
We Are Maintaining Our $51 December 2010 Price Target We completed a DCF analysis to determine our December 2010 price target. The following tables show the basis for our growth projections and the assumptions made in the price target calculation.
Table 69: DCF Analysis Base FCF 52.6 Terminal Growth Rate 5.0% Terminal WACC 10.75% Terminal Multiple 17 Terminal Value 914 PV of terminal value 607 Firm value NPV year 2011-2015 139 PV of terminal value 607 Enterprise value $746 Plus Net Cash 32 Equity value $778 Shares outstanding 15.4 Equity Value Per Share $51.00
Source: J.P. Morgan estimates.
Valuation and Rating Analysis On an EV/EBITDA basis, NILE trades at 27x our F’10 EBITDA estimate vs. its peer group average at 13x (which includes AMZN trading at 25x). We think this premium is undeserved given our expectation for 15% EBITDA growth (compared to our outlook for 30% EBITDA growth for AMZN and 20% for the group) and are thus maintaining our Underweight rating.
151
Global Equity Research 04 January 2010
Imran Khan (1-212) 622-6693 [email protected]
Risks to Our Rating Blue Nile is highly dependent on its diamond and jewelry suppliers, and it would be difficult for the company’s business model to tolerate large price fluctuations to acquire diamonds and jewelry. Blue Nile faces competition from both offline and online competitors, which operate in different spaces in the jewelry market. Online competitors include: diamond.com, amazon.com, walmart.com, mondera.com, and Ashford. If the company successfully executes its international business strategy or gains market share in the US from traditional retailers, our estimates could prove to be too conservative. Further, if the economy and consumer spending turn around more quickly than we expect, the stock could outperform.
152
Global Equity Research 04 January 2010
Imran Khan (1-212) 622-6693 [email protected]
Table 70: NILE Annual Income Statement $ in millions INCOME STATEMENT 2008 2009E 2010E 2011E Total Revenue 295.3 308.2 364.2 419.7 Cost of Revenue 235.3 240.7 283.4 326.5 Gross Profit (Rpt) 60.0 67.4 80.9 93.2 Gross Margin (Rpt) 20.3% 21.9% 22.2% 22.2% SG&A 44.0 47.5 56.6 63.7 Restructuring FAS 123R Stock based compensation 7.1 7.6 8.0 8.0 Total Expenses 44.0 47.5 56.6 63.7 Pro Forma Expense 37.0 39.9 48.6 55.7 Operating Profit (Reported) 16.0 19.9 24.3 29.4 Operating Profit (Pro Forma) 23.0 27.5 32.3 37.4 Operating Margin (Reported) 5.4% 6.5% 6.7% 7.0% Operating Margin (Pro Forma) 7.8% 8.9% 8.9% 8.9% EBITDA 25.1 30.2 34.9 40.6 EBITDA Margin 8.5% 9.8% 9.6% 9.7% Y/Y EBITDA Growth -16.2% 20.2% 15.5% 16.6% Other Income (Expense) 1.9 0.3 1.2 1.2 Total Other 1.9 0.3 1.2 1.2 Income Before Taxes (Reported) 17.9 20.2 25.5 30.6 Income Before Taxes (Pro Forma) 24.9 27.8 33.5 38.6 Income Taxes (Rpt) 6.2 7.1 8.9 10.7 Income Taxes (Pforma) 8.7 9.7 11.7 13.5 Tax Rate 34.8% 35.0% 35.0% 35.0% Pforma Tax Rate Inc From Ops After Taxes (Rpt) 11.6 13.2 16.6 19.9 Inc From Ops After Taxes (PF) 16.2 18.1 21.8 25.1 Reported Net Income 11.6 13.2 16.6 19.9 Reported EPS 0.75 0.86 1.08 1.33 Diluted Shares 15.6 15.2 15.4 15.0 Source: Company reports and J.P. Morgan estimates.
153
Global Equity Research 04 January 2010
Imran Khan (1-212) 622-6693 [email protected]
Table 71: NILE Quarterly Income Statement $ in millions
Q1-08 Q2-08 Q3-08 Q4-08 Q1-09 Q2-09 Q3-09 Q4-09E Q1-10E Q2-10E Q3-10E Q4-10E Total Revenue 70.5 73.7 65.4 85.8 62.4 69.9 66.9 109.0 77.1 83.6 77.8 125.7 Cost of Revenue 56.5 58.6 52.1 68.1 49.2 54.8 52.1 84.6 60.0 65.0 60.5 97.8 Gross Profit (Rpt) 13.9 15.1 13.3 17.7 13.2 15.0 14.8 24.4 17.1 18.6 17.3 27.9 Gross Margin (Rpt) 19.8% 20.5% 20.3% 20.6% 21.2% 21.5% 22.1% 22.4% 22.2% 22.2% 22.2% 22.2% SG&A 10.9 10.8 10.0 12.4 10.3 10.7 10.9 15.6 12.7 13.0 12.7 18.2 Restructuring FAS 123R Stock based compensation 1.8 1.9 1.6 1.8 1.8 1.9 1.8 2.1 2.0 2.0 2.0 2.0 Total Expenses 10.9 10.8 10.0 12.4 10.3 10.7 10.9 15.6 12.7 13.0 12.7 18.2 Pro Forma Expense 9.1 8.9 8.4 10.6 8.5 8.8 9.1 13.5 10.7 11.0 10.7 16.2 Operating Profit (Reported) 3.0 4.4 3.3 5.3 2.9 4.3 3.9 8.8 4.4 5.6 4.6 9.7 Operating Profit (Pro Forma) 4.8 6.3 4.9 7.1 4.7 6.2 5.7 10.9 6.4 7.6 6.6 11.7 Operating Margin (Reported) 4.3% 5.9% 5.0% 6.2% 4.6% 6.2% 5.8% 8.1% 5.7% 6.7% 5.9% 7.7% Operating Margin (Pro Forma) 6.8% 8.5% 7.5% 8.3% 7.5% 8.9% 8.5% 10.0% 8.3% 9.1% 8.5% 9.3% EBITDA 5.2 6.8 5.4 7.7 5.3 6.8 6.3 11.7 6.9 8.2 7.3 12.5 EBITDA Margin 7.4% 9.2% 8.3% 9.0% 8.5% 9.8% 9.5% 10.8% 8.9% 9.8% 9.4% 9.9% Y/Y EBITDA Growth -3.6% -0.2% 0.4% -37.7% 1.7% 0.6% 16.6% 52.5% 30.7% 19.8% 14.9% 6.4% Other Income (Expense) 0.9 0.6 0.3 0.1 0.1 0.0 0.1 0.1 0.3 0.3 0.3 0.3 Total Other 0.9 0.6 0.3 0.1 0.1 0.0 0.1 0.1 0.3 0.3 0.3 0.3 Income Before Taxes (Reported) 4.0 4.9 3.6 5.4 3.0 4.4 4.0 8.9 4.7 5.9 4.9 10.0 Income Before Taxes (Pro Forma) 5.7 6.8 5.2 7.2 4.8 6.3 5.8 11.0 6.7 7.9 6.9 12.0 Income Taxes (Rpt) 1.4 1.7 1.2 1.9 1.0 1.5 1.4 3.1 1.6 2.1 1.7 3.5 Income Taxes (Pforma) 2.0 2.4 1.8 2.5 1.7 2.2 2.0 3.9 2.3 2.8 2.4 4.2 Tax Rate 34.9% 35.0% 34.4% 35.0% 35.0% 35.0% 35.0% 35.0% 35.0% 35.0% 35.0% 35.0% Pforma Tax Rate 34.9% 35.0% 35.0% 35.0% 35.0% 35.0% 35.0% 35.0% 35.0% 35.0% 35.0% 35.0% Inc From Ops After Taxes (Rpt) 2.6 3.2 2.3 3.5 1.9 2.8 2.6 5.8 3.1 3.8 3.2 6.5 Inc From Ops After Taxes (PF) 3.7 4.4 3.4 4.7 3.1 4.1 3.8 7.2 4.4 5.1 4.5 7.8 Reported Net Income 2.6 3.2 2.3 3.5 1.9 2.8 2.6 5.8 3.1 3.8 3.2 6.5 Reported EPS 0.16 0.20 0.15 0.24 0.13 0.19 0.17 0.38 0.20 0.25 0.21 0.42 Diluted Shares 16.3 16.0 15.2 14.8 14.8 15.2 15.4 15.4 15.4 15.4 15.4 15.4 Source: Company reports and J.P. Morgan estimates.

154
Global Equity Research 04 January 2010
Imran Khan (1-212) 622-6693 [email protected]
Table 72: NILE Annual Balance Sheet $ in millions
2008 2009E 2010E 2011E Assets Cash and cash equivalents 54.5 62.1 83.0 92.4 Restricted cash - - - - Marketable securities - 15.0 15.0 15.0 Accounts receivable 1.7 2.5 2.7 2.8 Inventories 18.8 18.8 20.6 22.4 Deferred income taxes 0.7 0.2 0.2 0.2 Prepaids and other current assets 1.1 1.6 2.6 3.8 Total Current Assets 76.7 100.3 124.2 136.6 Property and equipment, net 7.6 7.5 10.4 8.3 Intangible assets, net 0.3 0.3 0.3 0.3 Deferred income taxes, net 5.0 6.2 2.0 2.0 Other assets 0.1 0.1 0.1 0.1 Total Long Term Assets 12.9 14.3 12.9 10.8 Total Assets 89.7 114.5 137.1 147.4 Liabilities Accounts payable 62.3 62.3 59.7 56.7 Accrued liabilities 6.6 9.3 12.7 16.7 Accrued marketing - - - - Current portion of deferred rent 0.2 0.3 0.4 0.4 Current portion of note payable to related party - - - - Current portion of subordinated notes payable - - - - Current portion of capital lease obligations 0.0 - - - Total Current Liabilities 69.1 72.0 72.7 73.8 Deferred rent, less current portion 0.4 0.2 0.2 0.2 Note payable to related party, less current portion - - - - Capital lease obligations, less current portion 0.8 - - - Redeemable convertible preferred stock - - - - Total Long Term Liabilities 1.2 0.2 0.2 0.2 Total Liabilities 70.4 72.2 73.0 74.0 Shareholder Equity Preferred stock - - - - Common Stock 0.0 - - - Additional Paid in Capital 144.9 - - - Deferred compensation - - - - Accumulated deficit 36.4 - - - Treasury stock (161.8) - - - Total Equity 19.3 42.3 64.1 73.4 Total Liabilities + Equity 89.7 114.5 137.1 147.4 Source: Company reports and J.P. Morgan estimates.
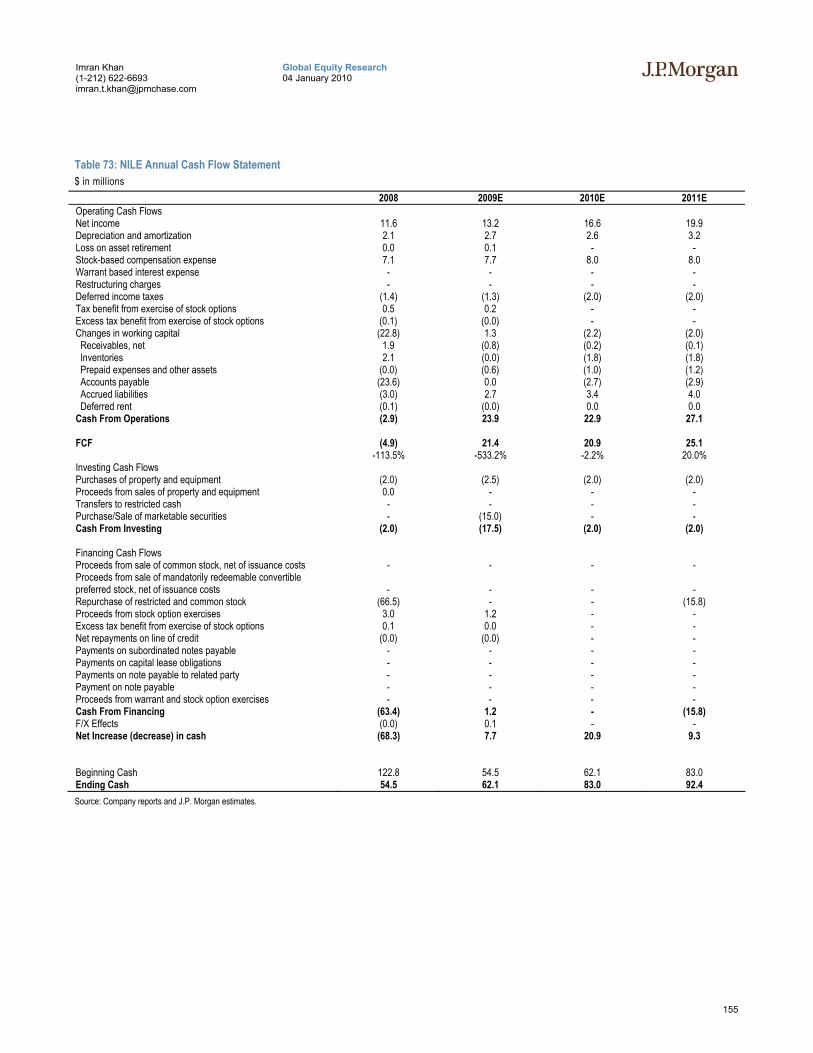
155
Global Equity Research 04 January 2010
Imran Khan (1-212) 622-6693 [email protected]
Table 73: NILE Annual Cash Flow Statement $ in millions
2008 2009E 2010E 2011E Operating Cash Flows Net income 11.6 13.2 16.6 19.9 Depreciation and amortization 2.1 2.7 2.6 3.2 Loss on asset retirement 0.0 0.1 - - Stock-based compensation expense 7.1 7.7 8.0 8.0 Warrant based interest expense - - - - Restructuring charges - - - - Deferred income taxes (1.4) (1.3) (2.0) (2.0) Tax benefit from exercise of stock options 0.5 0.2 - - Excess tax benefit from exercise of stock options (0.1) (0.0) - - Changes in working capital (22.8) 1.3 (2.2) (2.0) Receivables, net 1.9 (0.8) (0.2) (0.1) Inventories 2.1 (0.0) (1.8) (1.8) Prepaid expenses and other assets (0.0) (0.6) (1.0) (1.2) Accounts payable (23.6) 0.0 (2.7) (2.9) Accrued liabilities (3.0) 2.7 3.4 4.0 Deferred rent (0.1) (0.0) 0.0 0.0 Cash From Operations (2.9) 23.9 22.9 27.1 FCF (4.9) 21.4 20.9 25.1 -113.5% -533.2% -2.2% 20.0% Investing Cash Flows Purchases of property and equipment (2.0) (2.5) (2.0) (2.0) Proceeds from sales of property and equipment 0.0 - - - Transfers to restricted cash - - - - Purchase/Sale of marketable securities - (15.0) - - Cash From Investing (2.0) (17.5) (2.0) (2.0) Financing Cash Flows Proceeds from sale of common stock, net of issuance costs - - - - Proceeds from sale of mandatorily redeemable convertible preferred stock, net of issuance costs - - - - Repurchase of restricted and common stock (66.5) - - (15.8) Proceeds from stock option exercises 3.0 1.2 - - Excess tax benefit from exercise of stock options 0.1 0.0 - - Net repayments on line of credit (0.0) (0.0) - - Payments on subordinated notes payable - - - - Payments on capital lease obligations - - - - Payments on note payable to related party - - - - Payment on note payable - - - - Proceeds from warrant and stock option exercises - - - - Cash From Financing (63.4) 1.2 - (15.8) F/X Effects (0.0) 0.1 - - Net Increase (decrease) in cash (68.3) 7.7 20.9 9.3 Beginning Cash 122.8 54.5 62.1 83.0 Ending Cash 54.5 62.1 83.0 92.4 Source: Company reports and J.P. Morgan estimates.

156
Global Equity Research 04 January 2010
Imran Khan (1-212) 622-6693 [email protected]
Dice Holdings, Neutral, ($6.62) We are maintaining our Neutral rating on Dice. Though we have seen signs of stabilization in the business, we believe the recruitment market remains tough and do not foresee a full recovery in the near future. We are maintaining our $7 December 2010 price target.
• Employment market expected to be challenging during 1H’10. The US unemployment rate stood at 10% as of November. While we think the economy will further improve in 2010, we expect a hiring recovery to lag the broader economy. Thus, we believe DCS Online will continue to face pressures in growing its recruitment package customer count. However, we expect growth to improve in 2H’10 as the economy improves and comps become easier. We are modeling F’10 revenue to decline 3% Y/Y, vs. our F’09E of a 30% decline.
• eFC pressured by weak international markets. Through the first 9M’09, eFC revenue declined 42% Y/Y. Though management noted that the U.K. had seen a gradual improvement in recruitment activity in 3Q’09, continental Europe and the Middle East continue to face headwinds. Additionally, we do not expect any significant impact from the Asia-Pacific region in the near future. However, we expect easier FX comps to help eFC growth in 2010.
• Solid cost control in the tough environment, but increased investment likely. We are encouraged by management’s tight cost control, as sales and marketing as a percentage of revenue has declined for the past five quarters. However, we expect margins to contract slightly in 2010 due to increased investments in marketing and product development.
• 2010 drivers. In our view, the following factors will drive DHX shares in 2010: (1) the employment outlook in the US and internationally, (2) sales and marketing trends, and (3) the health of the financial industry and hiring trends within finance.
• Maintaining 4Q’09 estimates. We are maintaining our 4Q’09 estimates for revenue, EBITDA and EPS for Dice of $25.3M, $10M and $0.04, respectively.
Our current and newly introduced 2011 estimates are in the table below:
Table 74: Dice Holdings Financial Snapshot $ in millions, except per share data
Dice Holdings 4Q’09E F’09E F’10E F’11E F’08E F’09E F’10E J.P. Morgan Revenue 25 109 105 119 -30% -3% 13% EBITDA 10 48 43 49 -29% -11% 13% EPS 0.04 0.19 0.13 0.17 -19% -30% 29% Consensus Revenue 25 109 106 126 -30% -3% 19% EBITDA 10 47 43 51 -31% -9% 18% EPS 0.04 0.19 0.21 0.36 -18% 11% 70% Source: J.P. Morgan estimates, Company data, and Bloomberg.
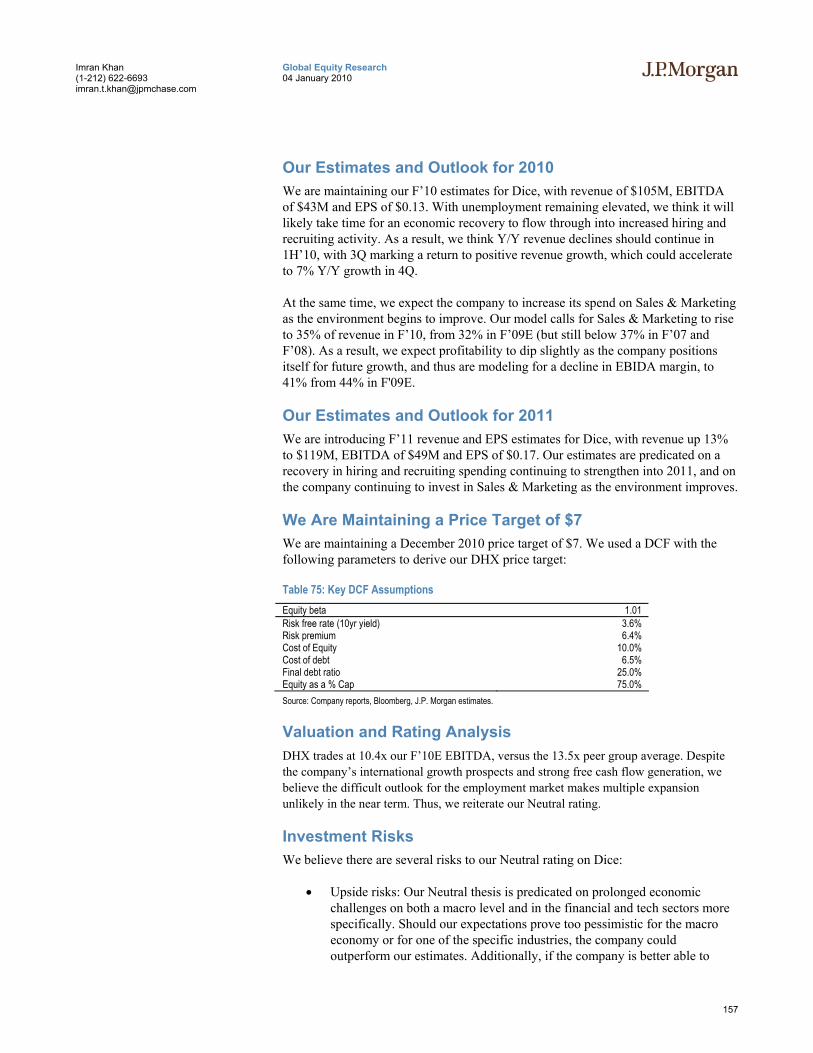
157
Global Equity Research 04 January 2010
Imran Khan (1-212) 622-6693 [email protected]
Our Estimates and Outlook for 2010 We are maintaining our F’10 estimates for Dice, with revenue of $105M, EBITDA of $43M and EPS of $0.13. With unemployment remaining elevated, we think it will likely take time for an economic recovery to flow through into increased hiring and recruiting activity. As a result, we think Y/Y revenue declines should continue in 1H’10, with 3Q marking a return to positive revenue growth, which could accelerate to 7% Y/Y growth in 4Q.
At the same time, we expect the company to increase its spend on Sales & Marketing as the environment begins to improve. Our model calls for Sales & Marketing to rise to 35% of revenue in F’10, from 32% in F’09E (but still below 37% in F’07 and F’08). As a result, we expect profitability to dip slightly as the company positions itself for future growth, and thus are modeling for a decline in EBIDA margin, to 41% from 44% in F'09E.
Our Estimates and Outlook for 2011 We are introducing F’11 revenue and EPS estimates for Dice, with revenue up 13% to $119M, EBITDA of $49M and EPS of $0.17. Our estimates are predicated on a recovery in hiring and recruiting spending continuing to strengthen into 2011, and on the company continuing to invest in Sales & Marketing as the environment improves.
We Are Maintaining a Price Target of $7 We are maintaining a December 2010 price target of $7. We used a DCF with the following parameters to derive our DHX price target:
Table 75: Key DCF Assumptions Equity beta 1.01 Risk free rate (10yr yield) 3.6% Risk premium 6.4% Cost of Equity 10.0% Cost of debt 6.5% Final debt ratio 25.0% Equity as a % Cap 75.0% Source: Company reports, Bloomberg, J.P. Morgan estimates.
Valuation and Rating Analysis DHX trades at 10.4x our F’10E EBITDA, versus the 13.5x peer group average. Despite the company’s international growth prospects and strong free cash flow generation, we believe the difficult outlook for the employment market makes multiple expansion unlikely in the near term. Thus, we reiterate our Neutral rating.
Investment Risks We believe there are several risks to our Neutral rating on Dice:
• Upside risks: Our Neutral thesis is predicated on prolonged economic challenges on both a macro level and in the financial and tech sectors more specifically. Should our expectations prove too pessimistic for the macro economy or for one of the specific industries, the company could outperform our estimates. Additionally, if the company is better able to
158
Global Equity Research 04 January 2010
Imran Khan (1-212) 622-6693 [email protected]
retain clients than we expect in this environment, results could exceed our expectations.
• Downside risks: should the economic challenges persist longer than we expect (either broadly or in one of the two verticals on which Dice is focused), or should the company have trouble managing costs against declining revenue, the stock could see further weakness. Additionally, Dice operates in a highly competitive landscape, with over 1,000 websites offering job postings, including some, such as Monster, CareerBuilder and HotJobs, with significantly more financial resources than Dice. In addition, social networking sites, such as Facebook and LinkedIn, have been generating significant traffic growth and are looking at job listings as a way to monetize traffic, while online classified companies, such as Craigslist, offer job listings for free or a small fee. Success of any of Dice’s competitors in the technology and financial verticals could negatively impact our growth expectations.
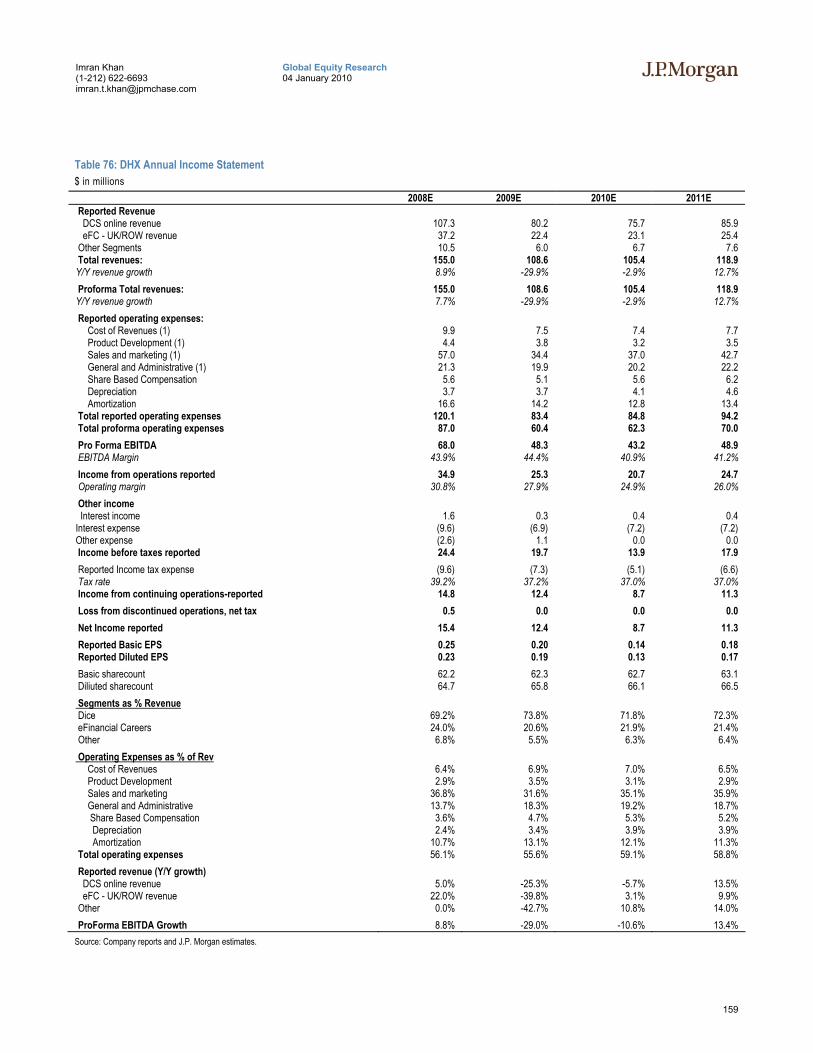
159
Global Equity Research 04 January 2010
Imran Khan (1-212) 622-6693 [email protected]
Table 76: DHX Annual Income Statement $ in millions
2008E 2009E 2010E 2011E Reported Revenue DCS online revenue 107.3 80.2 75.7 85.9 eFC - UK/ROW revenue 37.2 22.4 23.1 25.4 Other Segments 10.5 6.0 6.7 7.6 Total revenues: 155.0 108.6 105.4 118.9 Y/Y revenue growth 8.9% -29.9% -2.9% 12.7%
Proforma Total revenues: 155.0 108.6 105.4 118.9 Y/Y revenue growth 7.7% -29.9% -2.9% 12.7%
Reported operating expenses: Cost of Revenues (1) 9.9 7.5 7.4 7.7 Product Development (1) 4.4 3.8 3.2 3.5 Sales and marketing (1) 57.0 34.4 37.0 42.7 General and Administrative (1) 21.3 19.9 20.2 22.2 Share Based Compensation 5.6 5.1 5.6 6.2 Depreciation 3.7 3.7 4.1 4.6 Amortization 16.6 14.2 12.8 13.4 Total reported operating expenses 120.1 83.4 84.8 94.2 Total proforma operating expenses 87.0 60.4 62.3 70.0
Pro Forma EBITDA 68.0 48.3 43.2 48.9 EBITDA Margin 43.9% 44.4% 40.9% 41.2%
Income from operations reported 34.9 25.3 20.7 24.7 Operating margin 30.8% 27.9% 24.9% 26.0%
Other income Interest income 1.6 0.3 0.4 0.4 Interest expense (9.6) (6.9) (7.2) (7.2) Other expense (2.6) 1.1 0.0 0.0 Income before taxes reported 24.4 19.7 13.9 17.9
Reported Income tax expense (9.6) (7.3) (5.1) (6.6) Tax rate 39.2% 37.2% 37.0% 37.0% Income from continuing operations-reported 14.8 12.4 8.7 11.3
Loss from discontinued operations, net tax 0.5 0.0 0.0 0.0 Net Income reported 15.4 12.4 8.7 11.3 Reported Basic EPS 0.25 0.20 0.14 0.18
Reported Diluted EPS 0.23 0.19 0.13 0.17 Basic sharecount 62.2 62.3 62.7 63.1
Diliuted sharecount 64.7 65.8 66.1 66.5 Segments as % Revenue
Dice 69.2% 73.8% 71.8% 72.3% eFinancial Careers 24.0% 20.6% 21.9% 21.4% Other 6.8% 5.5% 6.3% 6.4%
Operating Expenses as % of Rev Cost of Revenues 6.4% 6.9% 7.0% 6.5% Product Development 2.9% 3.5% 3.1% 2.9% Sales and marketing 36.8% 31.6% 35.1% 35.9% General and Administrative 13.7% 18.3% 19.2% 18.7% Share Based Compensation 3.6% 4.7% 5.3% 5.2% Depreciation 2.4% 3.4% 3.9% 3.9% Amortization 10.7% 13.1% 12.1% 11.3% Total operating expenses 56.1% 55.6% 59.1% 58.8%
Reported revenue (Y/Y growth) DCS online revenue 5.0% -25.3% -5.7% 13.5% eFC - UK/ROW revenue 22.0% -39.8% 3.1% 9.9% Other 0.0% -42.7% 10.8% 14.0%
ProForma EBITDA Growth 8.8% -29.0% -10.6% 13.4% Source: Company reports and J.P. Morgan estimates.
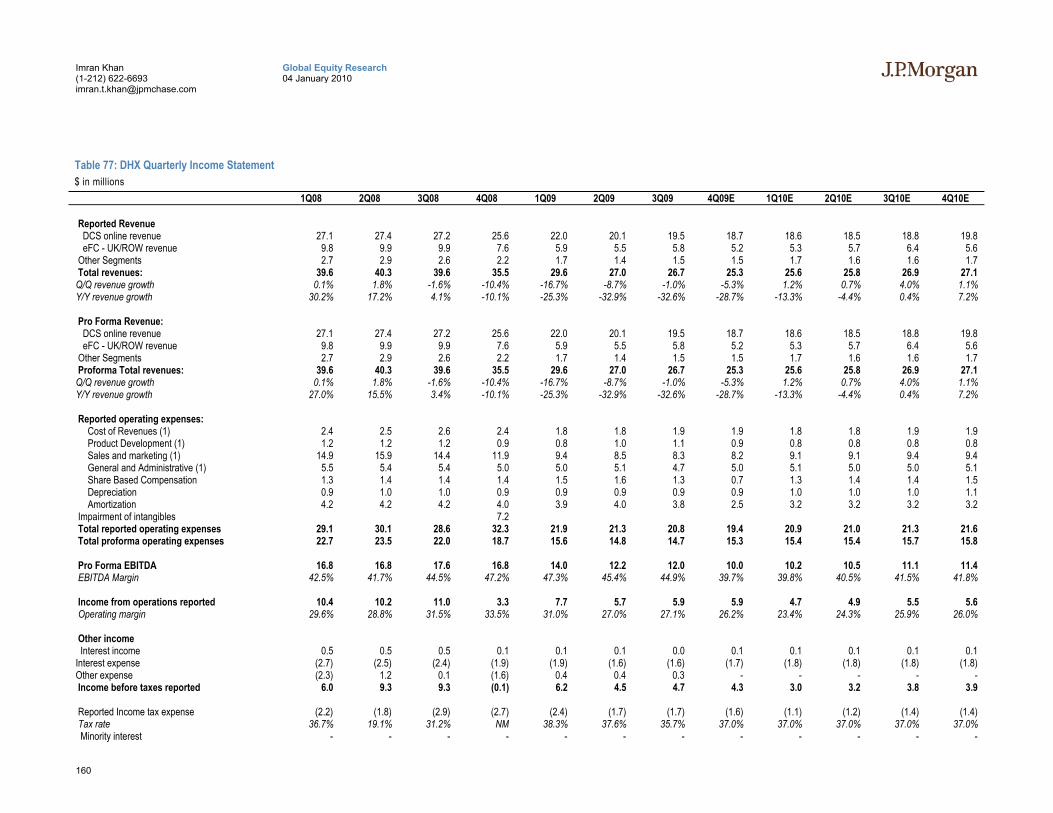
160
Global Equity Research 04 January 2010
Imran Khan (1-212) 622-6693 [email protected]
Table 77: DHX Quarterly Income Statement $ in millions
1Q08 2Q08 3Q08 4Q08 1Q09 2Q09 3Q09 4Q09E 1Q10E 2Q10E 3Q10E 4Q10E
Reported Revenue DCS online revenue 27.1 27.4 27.2 25.6 22.0 20.1 19.5 18.7 18.6 18.5 18.8 19.8 eFC - UK/ROW revenue 9.8 9.9 9.9 7.6 5.9 5.5 5.8 5.2 5.3 5.7 6.4 5.6 Other Segments 2.7 2.9 2.6 2.2 1.7 1.4 1.5 1.5 1.7 1.6 1.6 1.7 Total revenues: 39.6 40.3 39.6 35.5 29.6 27.0 26.7 25.3 25.6 25.8 26.9 27.1 Q/Q revenue growth 0.1% 1.8% -1.6% -10.4% -16.7% -8.7% -1.0% -5.3% 1.2% 0.7% 4.0% 1.1% Y/Y revenue growth 30.2% 17.2% 4.1% -10.1% -25.3% -32.9% -32.6% -28.7% -13.3% -4.4% 0.4% 7.2% Pro Forma Revenue: DCS online revenue 27.1 27.4 27.2 25.6 22.0 20.1 19.5 18.7 18.6 18.5 18.8 19.8 eFC - UK/ROW revenue 9.8 9.9 9.9 7.6 5.9 5.5 5.8 5.2 5.3 5.7 6.4 5.6 Other Segments 2.7 2.9 2.6 2.2 1.7 1.4 1.5 1.5 1.7 1.6 1.6 1.7 Proforma Total revenues: 39.6 40.3 39.6 35.5 29.6 27.0 26.7 25.3 25.6 25.8 26.9 27.1 Q/Q revenue growth 0.1% 1.8% -1.6% -10.4% -16.7% -8.7% -1.0% -5.3% 1.2% 0.7% 4.0% 1.1% Y/Y revenue growth 27.0% 15.5% 3.4% -10.1% -25.3% -32.9% -32.6% -28.7% -13.3% -4.4% 0.4% 7.2% Reported operating expenses: Cost of Revenues (1) 2.4 2.5 2.6 2.4 1.8 1.8 1.9 1.9 1.8 1.8 1.9 1.9 Product Development (1) 1.2 1.2 1.2 0.9 0.8 1.0 1.1 0.9 0.8 0.8 0.8 0.8 Sales and marketing (1) 14.9 15.9 14.4 11.9 9.4 8.5 8.3 8.2 9.1 9.1 9.4 9.4 General and Administrative (1) 5.5 5.4 5.4 5.0 5.0 5.1 4.7 5.0 5.1 5.0 5.0 5.1 Share Based Compensation 1.3 1.4 1.4 1.4 1.5 1.6 1.3 0.7 1.3 1.4 1.4 1.5 Depreciation 0.9 1.0 1.0 0.9 0.9 0.9 0.9 0.9 1.0 1.0 1.0 1.1 Amortization 4.2 4.2 4.2 4.0 3.9 4.0 3.8 2.5 3.2 3.2 3.2 3.2 Impairment of intangibles 7.2 Total reported operating expenses 29.1 30.1 28.6 32.3 21.9 21.3 20.8 19.4 20.9 21.0 21.3 21.6 Total proforma operating expenses 22.7 23.5 22.0 18.7 15.6 14.8 14.7 15.3 15.4 15.4 15.7 15.8 Pro Forma EBITDA 16.8 16.8 17.6 16.8 14.0 12.2 12.0 10.0 10.2 10.5 11.1 11.4 EBITDA Margin 42.5% 41.7% 44.5% 47.2% 47.3% 45.4% 44.9% 39.7% 39.8% 40.5% 41.5% 41.8% Income from operations reported 10.4 10.2 11.0 3.3 7.7 5.7 5.9 5.9 4.7 4.9 5.5 5.6 Operating margin 29.6% 28.8% 31.5% 33.5% 31.0% 27.0% 27.1% 26.2% 23.4% 24.3% 25.9% 26.0% Other income Interest income 0.5 0.5 0.5 0.1 0.1 0.1 0.0 0.1 0.1 0.1 0.1 0.1 Interest expense (2.7) (2.5) (2.4) (1.9) (1.9) (1.6) (1.6) (1.7) (1.8) (1.8) (1.8) (1.8) Other expense (2.3) 1.2 0.1 (1.6) 0.4 0.4 0.3 - - - - - Income before taxes reported 6.0 9.3 9.3 (0.1) 6.2 4.5 4.7 4.3 3.0 3.2 3.8 3.9 Reported Income tax expense (2.2) (1.8) (2.9) (2.7) (2.4) (1.7) (1.7) (1.6) (1.1) (1.2) (1.4) (1.4) Tax rate 36.7% 19.1% 31.2% NM 38.3% 37.6% 35.7% 37.0% 37.0% 37.0% 37.0% 37.0% Minority interest - - - - - - - - - - - -
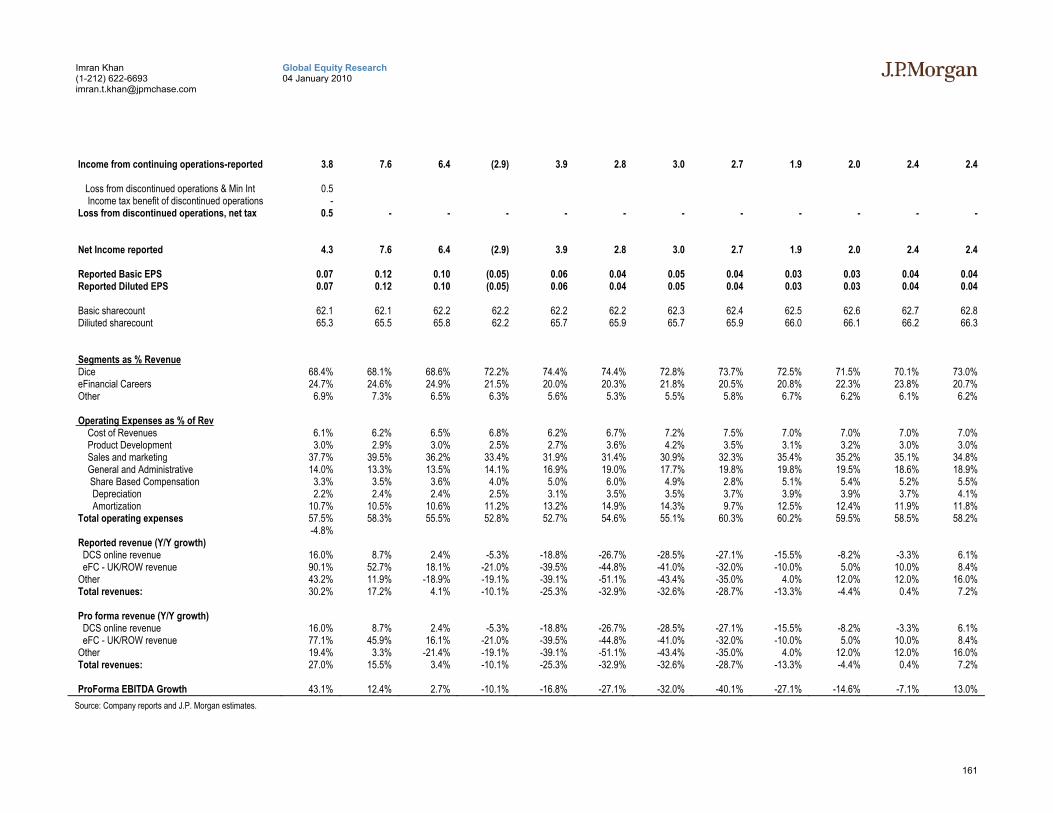
161
Global Equity Research 04 January 2010
Imran Khan (1-212) 622-6693 [email protected]
Income from continuing operations-reported 3.8 7.6 6.4 (2.9) 3.9 2.8 3.0 2.7 1.9 2.0 2.4 2.4 Loss from discontinued operations & Min Int 0.5 Income tax benefit of discontinued operations - Loss from discontinued operations, net tax 0.5 - - - - - - - - - - - Net Income reported 4.3 7.6 6.4 (2.9) 3.9 2.8 3.0 2.7 1.9 2.0 2.4 2.4 Reported Basic EPS 0.07 0.12 0.10 (0.05) 0.06 0.04 0.05 0.04 0.03 0.03 0.04 0.04 Reported Diluted EPS 0.07 0.12 0.10 (0.05) 0.06 0.04 0.05 0.04 0.03 0.03 0.04 0.04 Basic sharecount 62.1 62.1 62.2 62.2 62.2 62.2 62.3 62.4 62.5 62.6 62.7 62.8 Diliuted sharecount 65.3 65.5 65.8 62.2 65.7 65.9 65.7 65.9 66.0 66.1 66.2 66.3 Segments as % Revenue Dice 68.4% 68.1% 68.6% 72.2% 74.4% 74.4% 72.8% 73.7% 72.5% 71.5% 70.1% 73.0% eFinancial Careers 24.7% 24.6% 24.9% 21.5% 20.0% 20.3% 21.8% 20.5% 20.8% 22.3% 23.8% 20.7% Other 6.9% 7.3% 6.5% 6.3% 5.6% 5.3% 5.5% 5.8% 6.7% 6.2% 6.1% 6.2% Operating Expenses as % of Rev Cost of Revenues 6.1% 6.2% 6.5% 6.8% 6.2% 6.7% 7.2% 7.5% 7.0% 7.0% 7.0% 7.0% Product Development 3.0% 2.9% 3.0% 2.5% 2.7% 3.6% 4.2% 3.5% 3.1% 3.2% 3.0% 3.0% Sales and marketing 37.7% 39.5% 36.2% 33.4% 31.9% 31.4% 30.9% 32.3% 35.4% 35.2% 35.1% 34.8% General and Administrative 14.0% 13.3% 13.5% 14.1% 16.9% 19.0% 17.7% 19.8% 19.8% 19.5% 18.6% 18.9% Share Based Compensation 3.3% 3.5% 3.6% 4.0% 5.0% 6.0% 4.9% 2.8% 5.1% 5.4% 5.2% 5.5% Depreciation 2.2% 2.4% 2.4% 2.5% 3.1% 3.5% 3.5% 3.7% 3.9% 3.9% 3.7% 4.1% Amortization 10.7% 10.5% 10.6% 11.2% 13.2% 14.9% 14.3% 9.7% 12.5% 12.4% 11.9% 11.8% Total operating expenses 57.5% 58.3% 55.5% 52.8% 52.7% 54.6% 55.1% 60.3% 60.2% 59.5% 58.5% 58.2% -4.8% Reported revenue (Y/Y growth) DCS online revenue 16.0% 8.7% 2.4% -5.3% -18.8% -26.7% -28.5% -27.1% -15.5% -8.2% -3.3% 6.1% eFC - UK/ROW revenue 90.1% 52.7% 18.1% -21.0% -39.5% -44.8% -41.0% -32.0% -10.0% 5.0% 10.0% 8.4% Other 43.2% 11.9% -18.9% -19.1% -39.1% -51.1% -43.4% -35.0% 4.0% 12.0% 12.0% 16.0% Total revenues: 30.2% 17.2% 4.1% -10.1% -25.3% -32.9% -32.6% -28.7% -13.3% -4.4% 0.4% 7.2% Pro forma revenue (Y/Y growth) DCS online revenue 16.0% 8.7% 2.4% -5.3% -18.8% -26.7% -28.5% -27.1% -15.5% -8.2% -3.3% 6.1% eFC - UK/ROW revenue 77.1% 45.9% 16.1% -21.0% -39.5% -44.8% -41.0% -32.0% -10.0% 5.0% 10.0% 8.4% Other 19.4% 3.3% -21.4% -19.1% -39.1% -51.1% -43.4% -35.0% 4.0% 12.0% 12.0% 16.0% Total revenues: 27.0% 15.5% 3.4% -10.1% -25.3% -32.9% -32.6% -28.7% -13.3% -4.4% 0.4% 7.2% ProForma EBITDA Growth 43.1% 12.4% 2.7% -10.1% -16.8% -27.1% -32.0% -40.1% -27.1% -14.6% -7.1% 13.0% Source: Company reports and J.P. Morgan estimates.
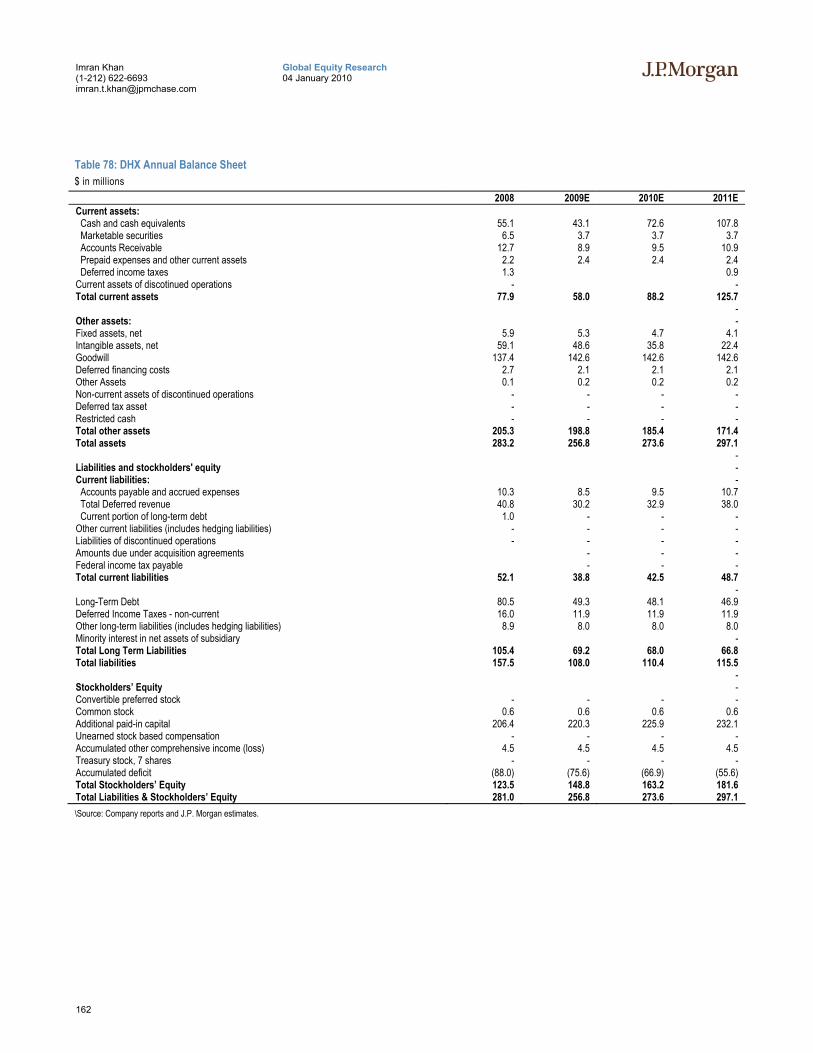
162
Global Equity Research 04 January 2010
Imran Khan (1-212) 622-6693 [email protected]
Table 78: DHX Annual Balance Sheet $ in millions
2008 2009E 2010E 2011E Current assets: Cash and cash equivalents 55.1 43.1 72.6 107.8 Marketable securities 6.5 3.7 3.7 3.7 Accounts Receivable 12.7 8.9 9.5 10.9 Prepaid expenses and other current assets 2.2 2.4 2.4 2.4 Deferred income taxes 1.3 0.9 Current assets of discotinued operations - - Total current assets 77.9 58.0 88.2 125.7 - Other assets: - Fixed assets, net 5.9 5.3 4.7 4.1 Intangible assets, net 59.1 48.6 35.8 22.4 Goodwill 137.4 142.6 142.6 142.6 Deferred financing costs 2.7 2.1 2.1 2.1 Other Assets 0.1 0.2 0.2 0.2 Non-current assets of discontinued operations - - - - Deferred tax asset - - - - Restricted cash - - - - Total other assets 205.3 198.8 185.4 171.4 Total assets 283.2 256.8 273.6 297.1 - Liabilities and stockholders' equity - Current liabilities: - Accounts payable and accrued expenses 10.3 8.5 9.5 10.7 Total Deferred revenue 40.8 30.2 32.9 38.0 Current portion of long-term debt 1.0 - - - Other current liabilities (includes hedging liabilities) - - - - Liabilities of discontinued operations - - - - Amounts due under acquisition agreements - - - Federal income tax payable - - - Total current liabilities 52.1 38.8 42.5 48.7 - Long-Term Debt 80.5 49.3 48.1 46.9 Deferred Income Taxes - non-current 16.0 11.9 11.9 11.9 Other long-term liabilities (includes hedging liabilities) 8.9 8.0 8.0 8.0 Minority interest in net assets of subsidiary - Total Long Term Liabilities 105.4 69.2 68.0 66.8 Total liabilities 157.5 108.0 110.4 115.5 - Stockholders’ Equity - Convertible preferred stock - - - - Common stock 0.6 0.6 0.6 0.6 Additional paid-in capital 206.4 220.3 225.9 232.1 Unearned stock based compensation - - - - Accumulated other comprehensive income (loss) 4.5 4.5 4.5 4.5 Treasury stock, 7 shares - - - - Accumulated deficit (88.0) (75.6) (66.9) (55.6) Total Stockholders’ Equity 123.5 148.8 163.2 181.6 Total Liabilities & Stockholders’ Equity 281.0 256.8 273.6 297.1 \Source: Company reports and J.P. Morgan estimates.
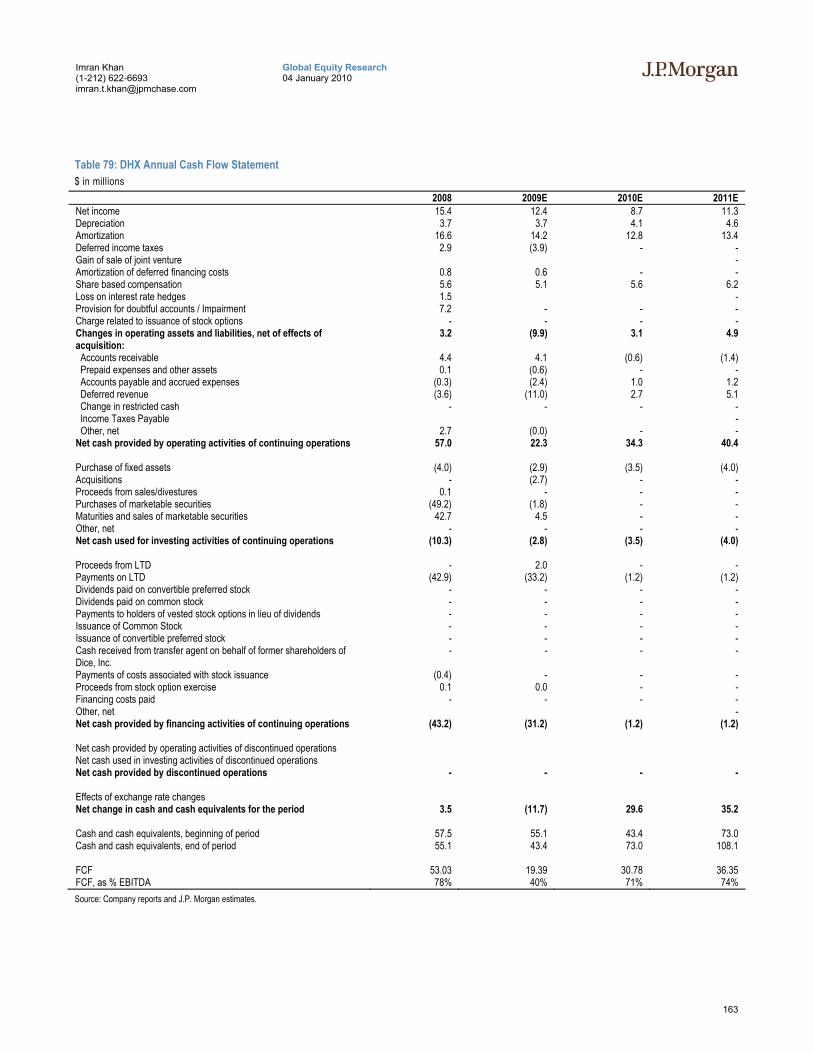
163
Global Equity Research 04 January 2010
Imran Khan (1-212) 622-6693 [email protected]
Table 79: DHX Annual Cash Flow Statement $ in millions
2008 2009E 2010E 2011E Net income 15.4 12.4 8.7 11.3 Depreciation 3.7 3.7 4.1 4.6 Amortization 16.6 14.2 12.8 13.4 Deferred income taxes 2.9 (3.9) - - Gain of sale of joint venture - Amortization of deferred financing costs 0.8 0.6 - - Share based compensation 5.6 5.1 5.6 6.2 Loss on interest rate hedges 1.5 - Provision for doubtful accounts / Impairment 7.2 - - - Charge related to issuance of stock options - - - - Changes in operating assets and liabilities, net of effects of acquisition:
3.2 (9.9) 3.1 4.9
Accounts receivable 4.4 4.1 (0.6) (1.4) Prepaid expenses and other assets 0.1 (0.6) - - Accounts payable and accrued expenses (0.3) (2.4) 1.0 1.2 Deferred revenue (3.6) (11.0) 2.7 5.1 Change in restricted cash - - - - Income Taxes Payable - Other, net 2.7 (0.0) - - Net cash provided by operating activities of continuing operations 57.0 22.3 34.3 40.4 Purchase of fixed assets (4.0) (2.9) (3.5) (4.0) Acquisitions - (2.7) - - Proceeds from sales/divestures 0.1 - - - Purchases of marketable securities (49.2) (1.8) - - Maturities and sales of marketable securities 42.7 4.5 - - Other, net - - - - Net cash used for investing activities of continuing operations (10.3) (2.8) (3.5) (4.0) Proceeds from LTD - 2.0 - - Payments on LTD (42.9) (33.2) (1.2) (1.2) Dividends paid on convertible preferred stock - - - - Dividends paid on common stock - - - - Payments to holders of vested stock options in lieu of dividends - - - - Issuance of Common Stock - - - - Issuance of convertible preferred stock - - - - Cash received from transfer agent on behalf of former shareholders of Dice, Inc.
- - - -
Payments of costs associated with stock issuance (0.4) - - - Proceeds from stock option exercise 0.1 0.0 - - Financing costs paid - - - - Other, net - Net cash provided by financing activities of continuing operations (43.2) (31.2) (1.2) (1.2) Net cash provided by operating activities of discontinued operations Net cash used in investing activities of discontinued operations Net cash provided by discontinued operations - - - - Effects of exchange rate changes Net change in cash and cash equivalents for the period 3.5 (11.7) 29.6 35.2 Cash and cash equivalents, beginning of period 57.5 55.1 43.4 73.0 Cash and cash equivalents, end of period 55.1 43.4 73.0 108.1 FCF 53.03 19.39 30.78 36.35 FCF, as % EBITDA 78% 40% 71% 74% Source: Company reports and J.P. Morgan estimates.
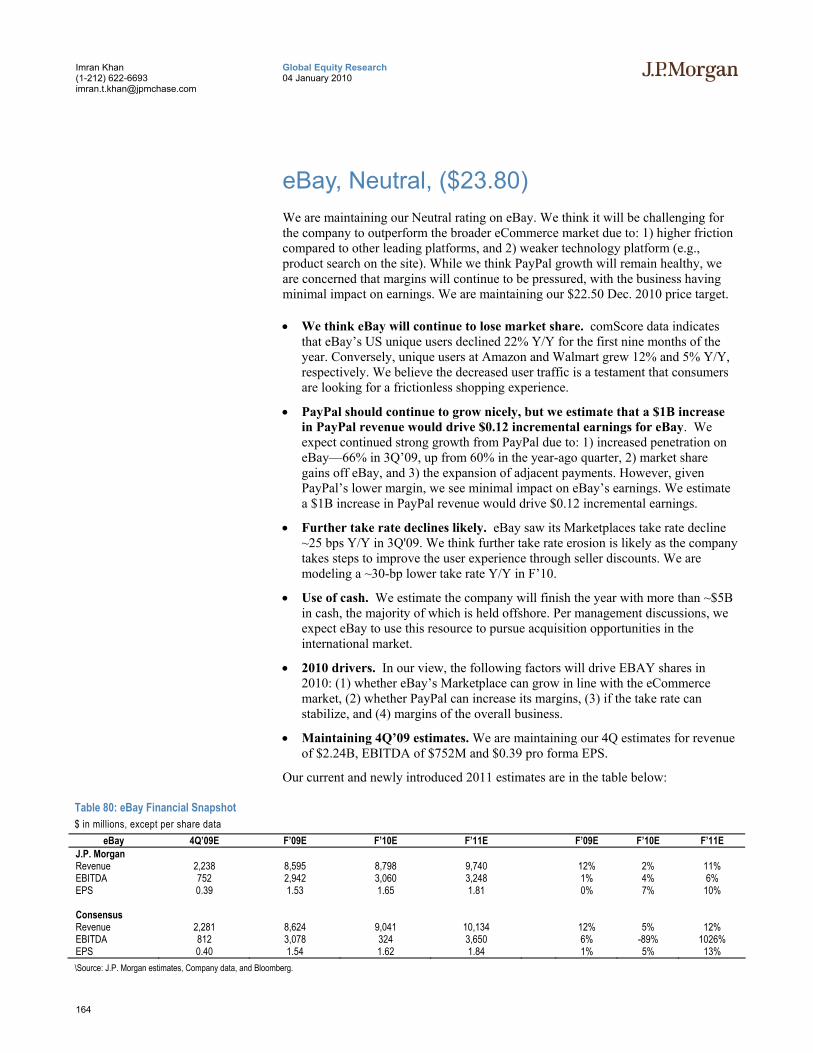
164
Global Equity Research 04 January 2010
Imran Khan (1-212) 622-6693 [email protected]
eBay, Neutral, ($23.80) We are maintaining our Neutral rating on eBay. We think it will be challenging for the company to outperform the broader eCommerce market due to: 1) higher friction compared to other leading platforms, and 2) weaker technology platform (e.g., product search on the site). While we think PayPal growth will remain healthy, we are concerned that margins will continue to be pressured, with the business having minimal impact on earnings. We are maintaining our $22.50 Dec. 2010 price target.
• We think eBay will continue to lose market share. comScore data indicates that eBay’s US unique users declined 22% Y/Y for the first nine months of the year. Conversely, unique users at Amazon and Walmart grew 12% and 5% Y/Y, respectively. We believe the decreased user traffic is a testament that consumers are looking for a frictionless shopping experience.
• PayPal should continue to grow nicely, but we estimate that a $1B increase in PayPal revenue would drive $0.12 incremental earnings for eBay. We expect continued strong growth from PayPal due to: 1) increased penetration on eBay—66% in 3Q’09, up from 60% in the year-ago quarter, 2) market share gains off eBay, and 3) the expansion of adjacent payments. However, given PayPal’s lower margin, we see minimal impact on eBay’s earnings. We estimate a $1B increase in PayPal revenue would drive $0.12 incremental earnings.
• Further take rate declines likely. eBay saw its Marketplaces take rate decline ~25 bps Y/Y in 3Q'09. We think further take rate erosion is likely as the company takes steps to improve the user experience through seller discounts. We are modeling a ~30-bp lower take rate Y/Y in F’10.
• Use of cash. We estimate the company will finish the year with more than ~$5B in cash, the majority of which is held offshore. Per management discussions, we expect eBay to use this resource to pursue acquisition opportunities in the international market.
• 2010 drivers. In our view, the following factors will drive EBAY shares in 2010: (1) whether eBay’s Marketplace can grow in line with the eCommerce market, (2) whether PayPal can increase its margins, (3) if the take rate can stabilize, and (4) margins of the overall business.
• Maintaining 4Q’09 estimates. We are maintaining our 4Q estimates for revenue of $2.24B, EBITDA of $752M and $0.39 pro forma EPS.
Our current and newly introduced 2011 estimates are in the table below:
Table 80: eBay Financial Snapshot $ in millions, except per share data
eBay 4Q’09E F’09E F’10E F’11E F’09E F’10E F’11E J.P. Morgan Revenue 2,238 8,595 8,798 9,740 12% 2% 11% EBITDA 752 2,942 3,060 3,248 1% 4% 6% EPS 0.39 1.53 1.65 1.81 0% 7% 10%
Consensus Revenue 2,281 8,624 9,041 10,134 12% 5% 12% EBITDA 812 3,078 324 3,650 6% -89% 1026% EPS 0.40 1.54 1.62 1.84 1% 5% 13% \Source: J.P. Morgan estimates, Company data, and Bloomberg.
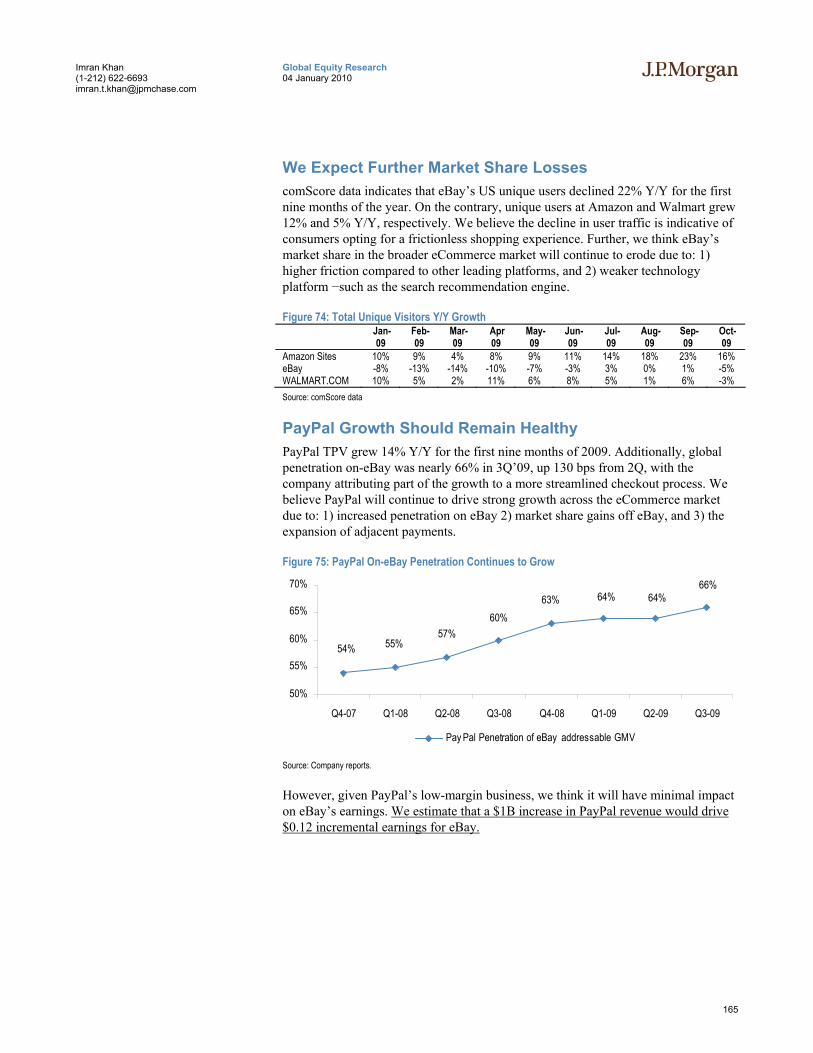
165
Global Equity Research 04 January 2010
Imran Khan (1-212) 622-6693 [email protected]
We Expect Further Market Share Losses comScore data indicates that eBay’s US unique users declined 22% Y/Y for the first nine months of the year. On the contrary, unique users at Amazon and Walmart grew 12% and 5% Y/Y, respectively. We believe the decline in user traffic is indicative of consumers opting for a frictionless shopping experience. Further, we think eBay’s market share in the broader eCommerce market will continue to erode due to: 1) higher friction compared to other leading platforms, and 2) weaker technology platform −such as the search recommendation engine.
Figure 74: Total Unique Visitors Y/Y Growth Jan-
09 Feb-
09 Mar-
09 Apr 09
May-09
Jun-09
Jul-09
Aug-09
Sep-09
Oct-09
Amazon Sites 10% 9% 4% 8% 9% 11% 14% 18% 23% 16% eBay -8% -13% -14% -10% -7% -3% 3% 0% 1% -5% WALMART.COM 10% 5% 2% 11% 6% 8% 5% 1% 6% -3% Source: comScore data
PayPal Growth Should Remain Healthy PayPal TPV grew 14% Y/Y for the first nine months of 2009. Additionally, global penetration on-eBay was nearly 66% in 3Q’09, up 130 bps from 2Q, with the company attributing part of the growth to a more streamlined checkout process. We believe PayPal will continue to drive strong growth across the eCommerce market due to: 1) increased penetration on eBay 2) market share gains off eBay, and 3) the expansion of adjacent payments.
Figure 75: PayPal On-eBay Penetration Continues to Grow
66%64%64%63%
60%57%
55%54%
50%
55%
60%
65%
70%
Q4-07 Q1-08 Q2-08 Q3-08 Q4-08 Q1-09 Q2-09 Q3-09
Pay Pal Penetration of eBay addressable GMV
Source: Company reports.
However, given PayPal’s low-margin business, we think it will have minimal impact on eBay’s earnings. We estimate that a $1B increase in PayPal revenue would drive $0.12 incremental earnings for eBay.
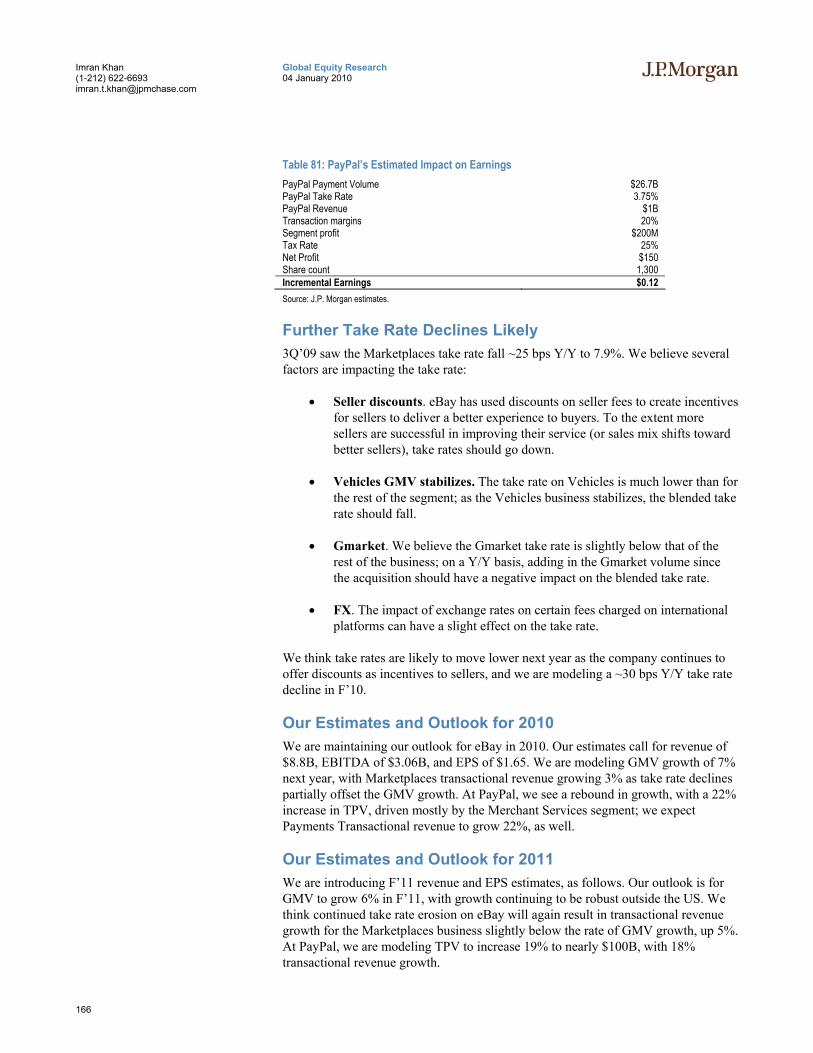
166
Global Equity Research 04 January 2010
Imran Khan (1-212) 622-6693 [email protected]
Table 81: PayPal’s Estimated Impact on Earnings PayPal Payment Volume $26.7B PayPal Take Rate 3.75% PayPal Revenue $1B Transaction margins 20% Segment profit $200M Tax Rate 25% Net Profit $150 Share count 1,300 Incremental Earnings $0.12 Source: J.P. Morgan estimates.
Further Take Rate Declines Likely 3Q’09 saw the Marketplaces take rate fall ~25 bps Y/Y to 7.9%. We believe several factors are impacting the take rate:
• Seller discounts. eBay has used discounts on seller fees to create incentives for sellers to deliver a better experience to buyers. To the extent more sellers are successful in improving their service (or sales mix shifts toward better sellers), take rates should go down.
• Vehicles GMV stabilizes. The take rate on Vehicles is much lower than for the rest of the segment; as the Vehicles business stabilizes, the blended take rate should fall.
• Gmarket. We believe the Gmarket take rate is slightly below that of the rest of the business; on a Y/Y basis, adding in the Gmarket volume since the acquisition should have a negative impact on the blended take rate.
• FX. The impact of exchange rates on certain fees charged on international platforms can have a slight effect on the take rate.
We think take rates are likely to move lower next year as the company continues to offer discounts as incentives to sellers, and we are modeling a ~30 bps Y/Y take rate decline in F’10.
Our Estimates and Outlook for 2010 We are maintaining our outlook for eBay in 2010. Our estimates call for revenue of $8.8B, EBITDA of $3.06B, and EPS of $1.65. We are modeling GMV growth of 7% next year, with Marketplaces transactional revenue growing 3% as take rate declines partially offset the GMV growth. At PayPal, we see a rebound in growth, with a 22% increase in TPV, driven mostly by the Merchant Services segment; we expect Payments Transactional revenue to grow 22%, as well.
Our Estimates and Outlook for 2011 We are introducing F’11 revenue and EPS estimates, as follows. Our outlook is for GMV to grow 6% in F’11, with growth continuing to be robust outside the US. We think continued take rate erosion on eBay will again result in transactional revenue growth for the Marketplaces business slightly below the rate of GMV growth, up 5%. At PayPal, we are modeling TPV to increase 19% to nearly $100B, with 18% transactional revenue growth.
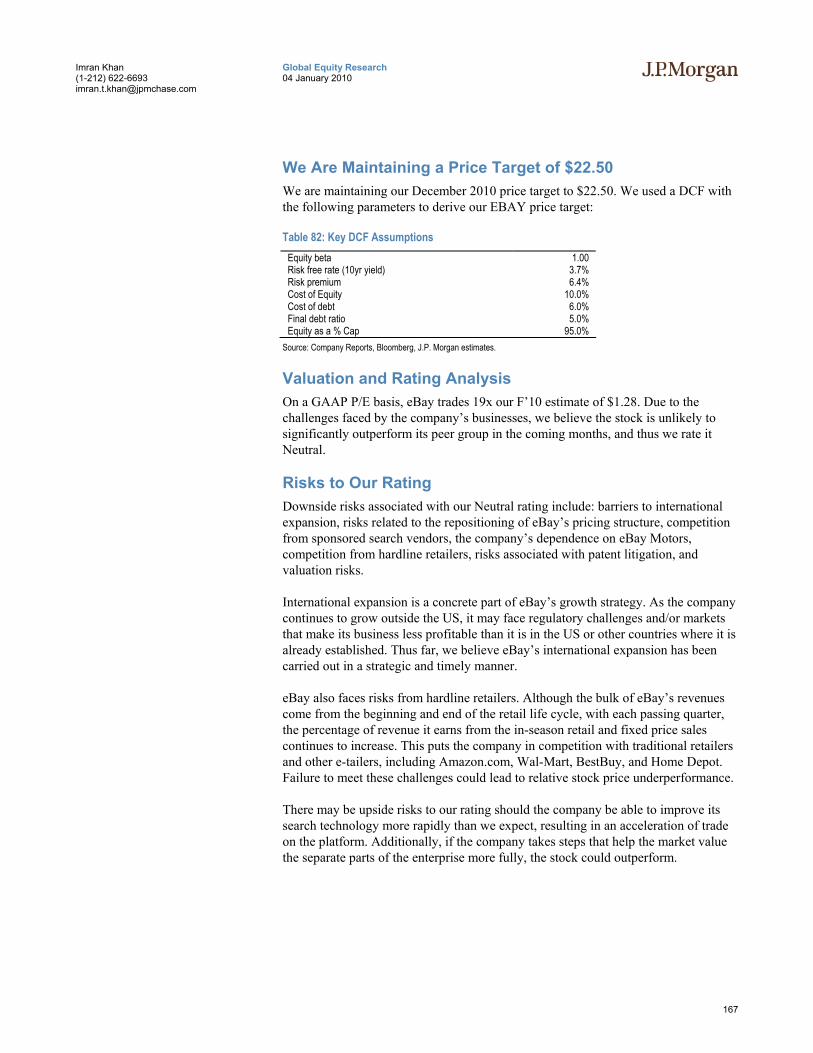
167
Global Equity Research 04 January 2010
Imran Khan (1-212) 622-6693 [email protected]
We Are Maintaining a Price Target of $22.50 We are maintaining our December 2010 price target to $22.50. We used a DCF with the following parameters to derive our EBAY price target:
Table 82: Key DCF Assumptions Equity beta 1.00 Risk free rate (10yr yield) 3.7% Risk premium 6.4% Cost of Equity 10.0% Cost of debt 6.0% Final debt ratio 5.0% Equity as a % Cap 95.0%
Source: Company Reports, Bloomberg, J.P. Morgan estimates.
Valuation and Rating Analysis On a GAAP P/E basis, eBay trades 19x our F’10 estimate of $1.28. Due to the challenges faced by the company’s businesses, we believe the stock is unlikely to significantly outperform its peer group in the coming months, and thus we rate it Neutral.
Risks to Our Rating Downside risks associated with our Neutral rating include: barriers to international expansion, risks related to the repositioning of eBay’s pricing structure, competition from sponsored search vendors, the company’s dependence on eBay Motors, competition from hardline retailers, risks associated with patent litigation, and valuation risks.
International expansion is a concrete part of eBay’s growth strategy. As the company continues to grow outside the US, it may face regulatory challenges and/or markets that make its business less profitable than it is in the US or other countries where it is already established. Thus far, we believe eBay’s international expansion has been carried out in a strategic and timely manner.
eBay also faces risks from hardline retailers. Although the bulk of eBay’s revenues come from the beginning and end of the retail life cycle, with each passing quarter, the percentage of revenue it earns from the in-season retail and fixed price sales continues to increase. This puts the company in competition with traditional retailers and other e-tailers, including Amazon.com, Wal-Mart, BestBuy, and Home Depot. Failure to meet these challenges could lead to relative stock price underperformance.
There may be upside risks to our rating should the company be able to improve its search technology more rapidly than we expect, resulting in an acceleration of trade on the platform. Additionally, if the company takes steps that help the market value the separate parts of the enterprise more fully, the stock could outperform.
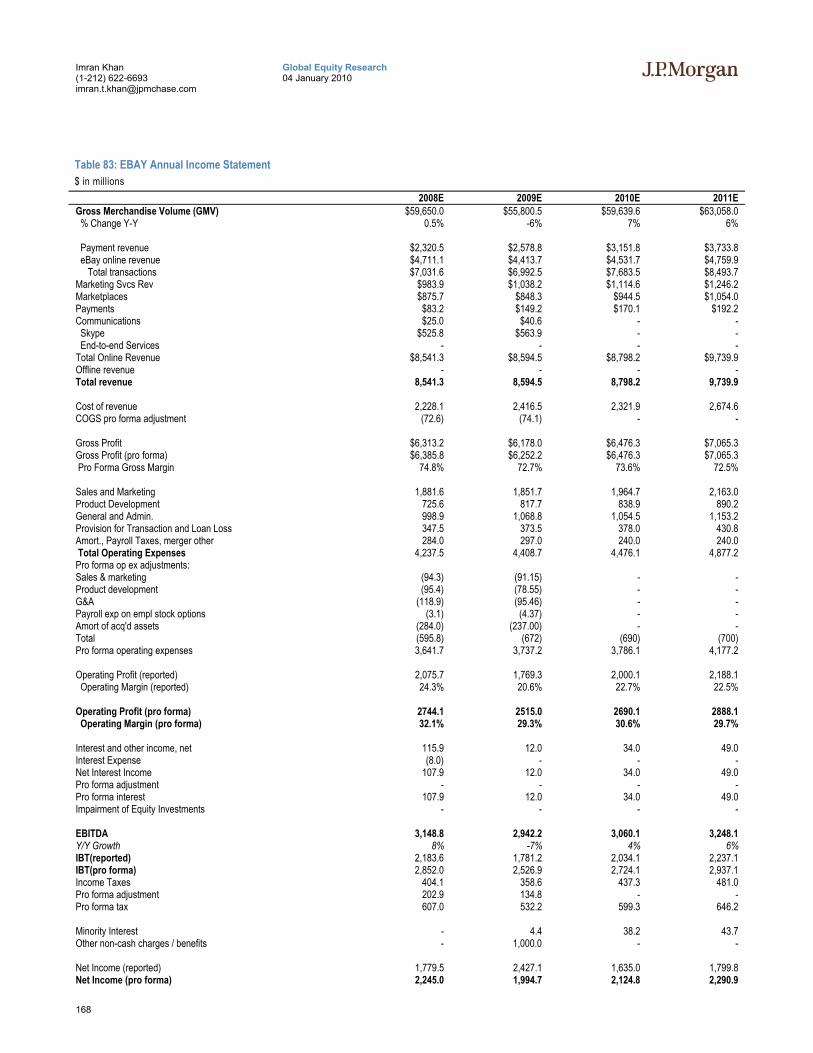
168
Global Equity Research 04 January 2010
Imran Khan (1-212) 622-6693 [email protected]
Table 83: EBAY Annual Income Statement $ in millions
2008E 2009E 2010E 2011E Gross Merchandise Volume (GMV) $59,650.0 $55,800.5 $59,639.6 $63,058.0 % Change Y-Y 0.5% -6% 7% 6%
Payment revenue $2,320.5 $2,578.8 $3,151.8 $3,733.8 eBay online revenue $4,711.1 $4,413.7 $4,531.7 $4,759.9 Total transactions $7,031.6 $6,992.5 $7,683.5 $8,493.7 Marketing Svcs Rev $983.9 $1,038.2 $1,114.6 $1,246.2 Marketplaces $875.7 $848.3 $944.5 $1,054.0 Payments $83.2 $149.2 $170.1 $192.2 Communications $25.0 $40.6 - - Skype $525.8 $563.9 - - End-to-end Services - - - - Total Online Revenue $8,541.3 $8,594.5 $8,798.2 $9,739.9 Offline revenue - - - - Total revenue 8,541.3 8,594.5 8,798.2 9,739.9 Cost of revenue 2,228.1 2,416.5 2,321.9 2,674.6 COGS pro forma adjustment (72.6) (74.1) - - Gross Profit $6,313.2 $6,178.0 $6,476.3 $7,065.3 Gross Profit (pro forma) $6,385.8 $6,252.2 $6,476.3 $7,065.3 Pro Forma Gross Margin 74.8% 72.7% 73.6% 72.5% Sales and Marketing 1,881.6 1,851.7 1,964.7 2,163.0 Product Development 725.6 817.7 838.9 890.2 General and Admin. 998.9 1,068.8 1,054.5 1,153.2 Provision for Transaction and Loan Loss 347.5 373.5 378.0 430.8 Amort., Payroll Taxes, merger other 284.0 297.0 240.0 240.0 Total Operating Expenses 4,237.5 4,408.7 4,476.1 4,877.2 Pro forma op ex adjustments: Sales & marketing (94.3) (91.15) - - Product development (95.4) (78.55) - - G&A (118.9) (95.46) - - Payroll exp on empl stock options (3.1) (4.37) - - Amort of acq'd assets (284.0) (237.00) - - Total (595.8) (672) (690) (700) Pro forma operating expenses 3,641.7 3,737.2 3,786.1 4,177.2 Operating Profit (reported) 2,075.7 1,769.3 2,000.1 2,188.1 Operating Margin (reported) 24.3% 20.6% 22.7% 22.5% Operating Profit (pro forma) 2744.1 2515.0 2690.1 2888.1 Operating Margin (pro forma) 32.1% 29.3% 30.6% 29.7% Interest and other income, net 115.9 12.0 34.0 49.0 Interest Expense (8.0) - - - Net Interest Income 107.9 12.0 34.0 49.0 Pro forma adjustment - - - - Pro forma interest 107.9 12.0 34.0 49.0 Impairment of Equity Investments - - - - EBITDA 3,148.8 2,942.2 3,060.1 3,248.1 Y/Y Growth 8% -7% 4% 6% IBT(reported) 2,183.6 1,781.2 2,034.1 2,237.1 IBT(pro forma) 2,852.0 2,526.9 2,724.1 2,937.1 Income Taxes 404.1 358.6 437.3 481.0 Pro forma adjustment 202.9 134.8 - - Pro forma tax 607.0 532.2 599.3 646.2 Minority Interest - 4.4 38.2 43.7 Other non-cash charges / benefits - 1,000.0 - - Net Income (reported) 1,779.5 2,427.1 1,635.0 1,799.8 Net Income (pro forma) 2,245.0 1,994.7 2,124.8 2,290.9
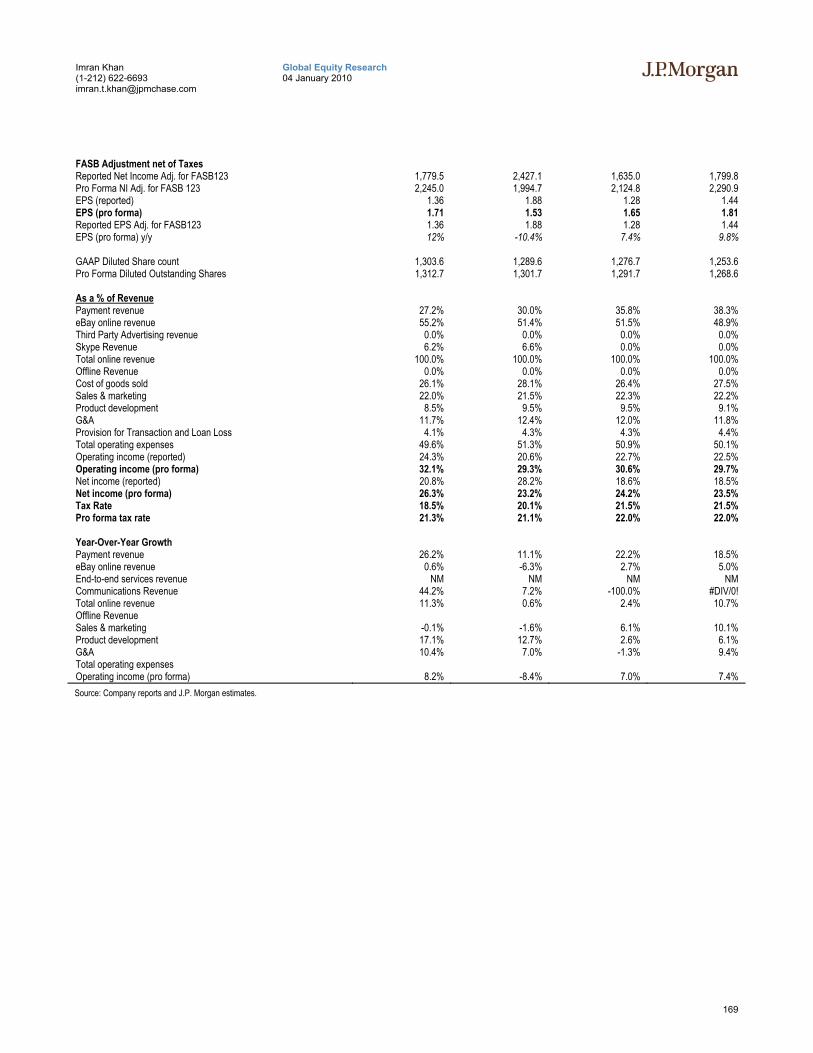
169
Global Equity Research 04 January 2010
Imran Khan (1-212) 622-6693 [email protected]
FASB Adjustment net of Taxes Reported Net Income Adj. for FASB123 1,779.5 2,427.1 1,635.0 1,799.8 Pro Forma NI Adj. for FASB 123 2,245.0 1,994.7 2,124.8 2,290.9 EPS (reported) 1.36 1.88 1.28 1.44 EPS (pro forma) 1.71 1.53 1.65 1.81 Reported EPS Adj. for FASB123 1.36 1.88 1.28 1.44 EPS (pro forma) y/y 12% -10.4% 7.4% 9.8% GAAP Diluted Share count 1,303.6 1,289.6 1,276.7 1,253.6 Pro Forma Diluted Outstanding Shares 1,312.7 1,301.7 1,291.7 1,268.6
2 As a % of Revenue Payment revenue 27.2% 30.0% 35.8% 38.3% eBay online revenue 55.2% 51.4% 51.5% 48.9% Third Party Advertising revenue 0.0% 0.0% 0.0% 0.0% Skype Revenue 6.2% 6.6% 0.0% 0.0% Total online revenue 100.0% 100.0% 100.0% 100.0% Offline Revenue 0.0% 0.0% 0.0% 0.0% Cost of goods sold 26.1% 28.1% 26.4% 27.5% Sales & marketing 22.0% 21.5% 22.3% 22.2% Product development 8.5% 9.5% 9.5% 9.1% G&A 11.7% 12.4% 12.0% 11.8% Provision for Transaction and Loan Loss 4.1% 4.3% 4.3% 4.4% Total operating expenses 49.6% 51.3% 50.9% 50.1% Operating income (reported) 24.3% 20.6% 22.7% 22.5% Operating income (pro forma) 32.1% 29.3% 30.6% 29.7% Net income (reported) 20.8% 28.2% 18.6% 18.5% Net income (pro forma) 26.3% 23.2% 24.2% 23.5% Tax Rate 18.5% 20.1% 21.5% 21.5% Pro forma tax rate 21.3% 21.1% 22.0% 22.0% Year-Over-Year Growth Payment revenue 26.2% 11.1% 22.2% 18.5% eBay online revenue 0.6% -6.3% 2.7% 5.0% End-to-end services revenue NM NM NM NM Communications Revenue 44.2% 7.2% -100.0% #DIV/0! Total online revenue 11.3% 0.6% 2.4% 10.7% Offline Revenue Sales & marketing -0.1% -1.6% 6.1% 10.1% Product development 17.1% 12.7% 2.6% 6.1% G&A 10.4% 7.0% -1.3% 9.4% Total operating expenses Operating income (pro forma) 8.2% -8.4% 7.0% 7.4% Source: Company reports and J.P. Morgan estimates.
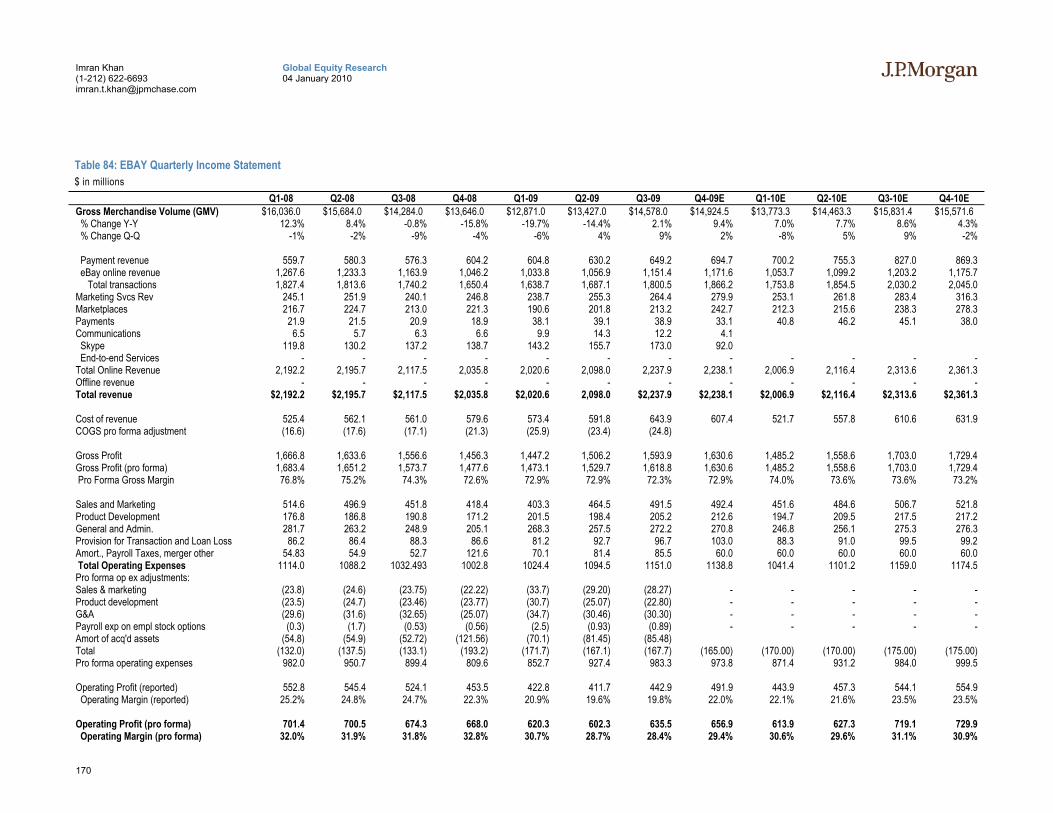
170
Global Equity Research 04 January 2010
Imran Khan (1-212) 622-6693 [email protected]
Table 84: EBAY Quarterly Income Statement $ in millions
Q1-08 Q2-08 Q3-08 Q4-08 Q1-09 Q2-09 Q3-09 Q4-09E Q1-10E Q2-10E Q3-10E Q4-10E Gross Merchandise Volume (GMV) $16,036.0 $15,684.0 $14,284.0 $13,646.0 $12,871.0 $13,427.0 $14,578.0 $14,924.5 $13,773.3 $14,463.3 $15,831.4 $15,571.6 % Change Y-Y 12.3% 8.4% -0.8% -15.8% -19.7% -14.4% 2.1% 9.4% 7.0% 7.7% 8.6% 4.3% % Change Q-Q -1% -2% -9% -4% -6% 4% 9% 2% -8% 5% 9% -2%
Payment revenue 559.7 580.3 576.3 604.2 604.8 630.2 649.2 694.7 700.2 755.3 827.0 869.3 eBay online revenue 1,267.6 1,233.3 1,163.9 1,046.2 1,033.8 1,056.9 1,151.4 1,171.6 1,053.7 1,099.2 1,203.2 1,175.7 Total transactions 1,827.4 1,813.6 1,740.2 1,650.4 1,638.7 1,687.1 1,800.5 1,866.2 1,753.8 1,854.5 2,030.2 2,045.0 Marketing Svcs Rev 245.1 251.9 240.1 246.8 238.7 255.3 264.4 279.9 253.1 261.8 283.4 316.3 Marketplaces 216.7 224.7 213.0 221.3 190.6 201.8 213.2 242.7 212.3 215.6 238.3 278.3 Payments 21.9 21.5 20.9 18.9 38.1 39.1 38.9 33.1 40.8 46.2 45.1 38.0 Communications 6.5 5.7 6.3 6.6 9.9 14.3 12.2 4.1 Skype 119.8 130.2 137.2 138.7 143.2 155.7 173.0 92.0 End-to-end Services - - - - - - - - - - - - Total Online Revenue 2,192.2 2,195.7 2,117.5 2,035.8 2,020.6 2,098.0 2,237.9 2,238.1 2,006.9 2,116.4 2,313.6 2,361.3 Offline revenue - - - - - - - - - - - - Total revenue $2,192.2 $2,195.7 $2,117.5 $2,035.8 $2,020.6 2,098.0 $2,237.9 $2,238.1 $2,006.9 $2,116.4 $2,313.6 $2,361.3 Cost of revenue 525.4 562.1 561.0 579.6 573.4 591.8 643.9 607.4 521.7 557.8 610.6 631.9 COGS pro forma adjustment (16.6) (17.6) (17.1) (21.3) (25.9) (23.4) (24.8) Gross Profit 1,666.8 1,633.6 1,556.6 1,456.3 1,447.2 1,506.2 1,593.9 1,630.6 1,485.2 1,558.6 1,703.0 1,729.4 Gross Profit (pro forma) 1,683.4 1,651.2 1,573.7 1,477.6 1,473.1 1,529.7 1,618.8 1,630.6 1,485.2 1,558.6 1,703.0 1,729.4 Pro Forma Gross Margin 76.8% 75.2% 74.3% 72.6% 72.9% 72.9% 72.3% 72.9% 74.0% 73.6% 73.6% 73.2% Sales and Marketing 514.6 496.9 451.8 418.4 403.3 464.5 491.5 492.4 451.6 484.6 506.7 521.8 Product Development 176.8 186.8 190.8 171.2 201.5 198.4 205.2 212.6 194.7 209.5 217.5 217.2 General and Admin. 281.7 263.2 248.9 205.1 268.3 257.5 272.2 270.8 246.8 256.1 275.3 276.3 Provision for Transaction and Loan Loss 86.2 86.4 88.3 86.6 81.2 92.7 96.7 103.0 88.3 91.0 99.5 99.2 Amort., Payroll Taxes, merger other 54.83 54.9 52.7 121.6 70.1 81.4 85.5 60.0 60.0 60.0 60.0 60.0 Total Operating Expenses 1114.0 1088.2 1032.493 1002.8 1024.4 1094.5 1151.0 1138.8 1041.4 1101.2 1159.0 1174.5 Pro forma op ex adjustments: Sales & marketing (23.8) (24.6) (23.75) (22.22) (33.7) (29.20) (28.27) - - - - - Product development (23.5) (24.7) (23.46) (23.77) (30.7) (25.07) (22.80) - - - - - G&A (29.6) (31.6) (32.65) (25.07) (34.7) (30.46) (30.30) - - - - - Payroll exp on empl stock options (0.3) (1.7) (0.53) (0.56) (2.5) (0.93) (0.89) - - - - - Amort of acq'd assets (54.8) (54.9) (52.72) (121.56) (70.1) (81.45) (85.48) Total (132.0) (137.5) (133.1) (193.2) (171.7) (167.1) (167.7) (165.00) (170.00) (170.00) (175.00) (175.00) Pro forma operating expenses 982.0 950.7 899.4 809.6 852.7 927.4 983.3 973.8 871.4 931.2 984.0 999.5 Operating Profit (reported) 552.8 545.4 524.1 453.5 422.8 411.7 442.9 491.9 443.9 457.3 544.1 554.9 Operating Margin (reported) 25.2% 24.8% 24.7% 22.3% 20.9% 19.6% 19.8% 22.0% 22.1% 21.6% 23.5% 23.5% Operating Profit (pro forma) 701.4 700.5 674.3 668.0 620.3 602.3 635.5 656.9 613.9 627.3 719.1 729.9 Operating Margin (pro forma) 32.0% 31.9% 31.8% 32.8% 30.7% 28.7% 28.4% 29.4% 30.6% 29.6% 31.1% 30.9%
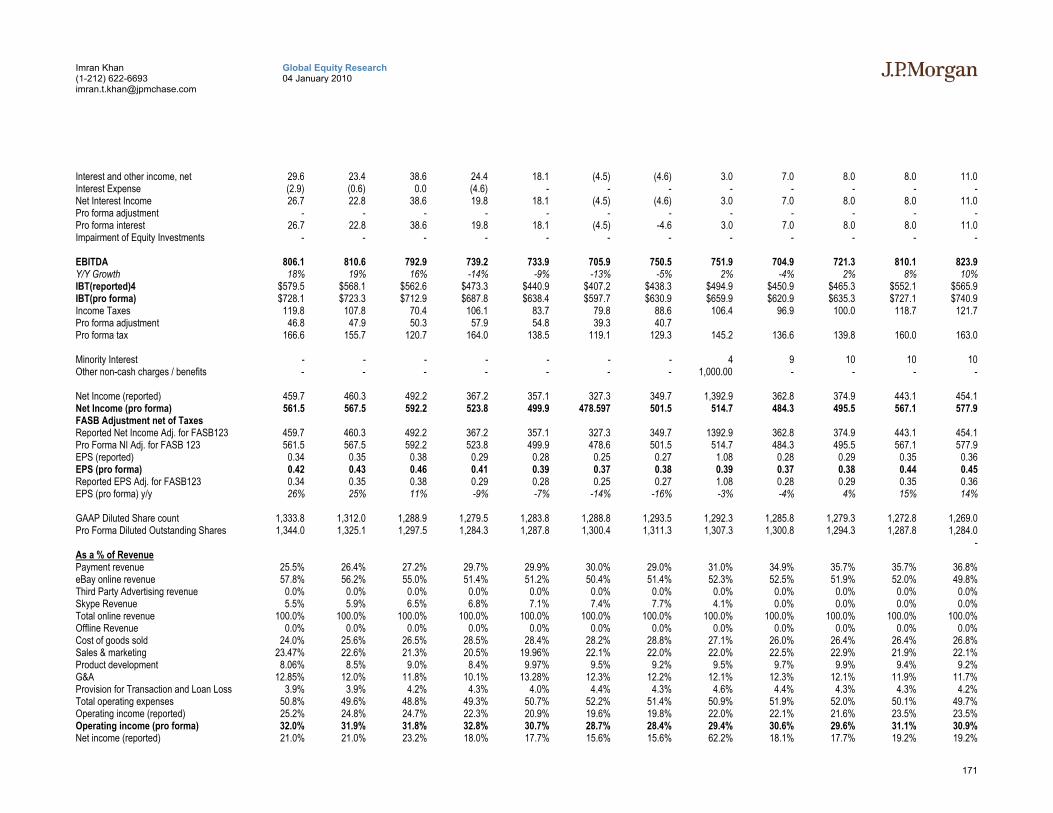
171
Global Equity Research 04 January 2010
Imran Khan (1-212) 622-6693 [email protected]
Interest and other income, net 29.6 23.4 38.6 24.4 18.1 (4.5) (4.6) 3.0 7.0 8.0 8.0 11.0 Interest Expense (2.9) (0.6) 0.0 (4.6) - - - - - - - - Net Interest Income 26.7 22.8 38.6 19.8 18.1 (4.5) (4.6) 3.0 7.0 8.0 8.0 11.0 Pro forma adjustment - - - - - - - - - - - - Pro forma interest 26.7 22.8 38.6 19.8 18.1 (4.5) -4.6 3.0 7.0 8.0 8.0 11.0 Impairment of Equity Investments - - - - - - - - - - - - EBITDA 806.1 810.6 792.9 739.2 733.9 705.9 750.5 751.9 704.9 721.3 810.1 823.9 Y/Y Growth 18% 19% 16% -14% -9% -13% -5% 2% -4% 2% 8% 10% IBT(reported)4 $579.5 $568.1 $562.6 $473.3 $440.9 $407.2 $438.3 $494.9 $450.9 $465.3 $552.1 $565.9 IBT(pro forma) $728.1 $723.3 $712.9 $687.8 $638.4 $597.7 $630.9 $659.9 $620.9 $635.3 $727.1 $740.9 Income Taxes 119.8 107.8 70.4 106.1 83.7 79.8 88.6 106.4 96.9 100.0 118.7 121.7 Pro forma adjustment 46.8 47.9 50.3 57.9 54.8 39.3 40.7 Pro forma tax 166.6 155.7 120.7 164.0 138.5 119.1 129.3 145.2 136.6 139.8 160.0 163.0 Minority Interest - - - - - - - 4 9 10 10 10 Other non-cash charges / benefits - - - - - - - 1,000.00 - - - - Net Income (reported) 459.7 460.3 492.2 367.2 357.1 327.3 349.7 1,392.9 362.8 374.9 443.1 454.1 Net Income (pro forma) 561.5 567.5 592.2 523.8 499.9 478.597 501.5 514.7 484.3 495.5 567.1 577.9 FASB Adjustment net of Taxes Reported Net Income Adj. for FASB123 459.7 460.3 492.2 367.2 357.1 327.3 349.7 1392.9 362.8 374.9 443.1 454.1 Pro Forma NI Adj. for FASB 123 561.5 567.5 592.2 523.8 499.9 478.6 501.5 514.7 484.3 495.5 567.1 577.9 EPS (reported) 0.34 0.35 0.38 0.29 0.28 0.25 0.27 1.08 0.28 0.29 0.35 0.36 EPS (pro forma) 0.42 0.43 0.46 0.41 0.39 0.37 0.38 0.39 0.37 0.38 0.44 0.45 Reported EPS Adj. for FASB123 0.34 0.35 0.38 0.29 0.28 0.25 0.27 1.08 0.28 0.29 0.35 0.36 EPS (pro forma) y/y 26% 25% 11% -9% -7% -14% -16% -3% -4% 4% 15% 14% GAAP Diluted Share count 1,333.8 1,312.0 1,288.9 1,279.5 1,283.8 1,288.8 1,293.5 1,292.3 1,285.8 1,279.3 1,272.8 1,269.0 Pro Forma Diluted Outstanding Shares 1,344.0 1,325.1 1,297.5 1,284.3 1,287.8 1,300.4 1,311.3 1,307.3 1,300.8 1,294.3 1,287.8 1,284.0
2 - As a % of Revenue Payment revenue 25.5% 26.4% 27.2% 29.7% 29.9% 30.0% 29.0% 31.0% 34.9% 35.7% 35.7% 36.8% eBay online revenue 57.8% 56.2% 55.0% 51.4% 51.2% 50.4% 51.4% 52.3% 52.5% 51.9% 52.0% 49.8% Third Party Advertising revenue 0.0% 0.0% 0.0% 0.0% 0.0% 0.0% 0.0% 0.0% 0.0% 0.0% 0.0% 0.0% Skype Revenue 5.5% 5.9% 6.5% 6.8% 7.1% 7.4% 7.7% 4.1% 0.0% 0.0% 0.0% 0.0% Total online revenue 100.0% 100.0% 100.0% 100.0% 100.0% 100.0% 100.0% 100.0% 100.0% 100.0% 100.0% 100.0% Offline Revenue 0.0% 0.0% 0.0% 0.0% 0.0% 0.0% 0.0% 0.0% 0.0% 0.0% 0.0% 0.0% Cost of goods sold 24.0% 25.6% 26.5% 28.5% 28.4% 28.2% 28.8% 27.1% 26.0% 26.4% 26.4% 26.8% Sales & marketing 23.47% 22.6% 21.3% 20.5% 19.96% 22.1% 22.0% 22.0% 22.5% 22.9% 21.9% 22.1% Product development 8.06% 8.5% 9.0% 8.4% 9.97% 9.5% 9.2% 9.5% 9.7% 9.9% 9.4% 9.2% G&A 12.85% 12.0% 11.8% 10.1% 13.28% 12.3% 12.2% 12.1% 12.3% 12.1% 11.9% 11.7% Provision for Transaction and Loan Loss 3.9% 3.9% 4.2% 4.3% 4.0% 4.4% 4.3% 4.6% 4.4% 4.3% 4.3% 4.2% Total operating expenses 50.8% 49.6% 48.8% 49.3% 50.7% 52.2% 51.4% 50.9% 51.9% 52.0% 50.1% 49.7% Operating income (reported) 25.2% 24.8% 24.7% 22.3% 20.9% 19.6% 19.8% 22.0% 22.1% 21.6% 23.5% 23.5% Operating income (pro forma) 32.0% 31.9% 31.8% 32.8% 30.7% 28.7% 28.4% 29.4% 30.6% 29.6% 31.1% 30.9% Net income (reported) 21.0% 21.0% 23.2% 18.0% 17.7% 15.6% 15.6% 62.2% 18.1% 17.7% 19.2% 19.2%
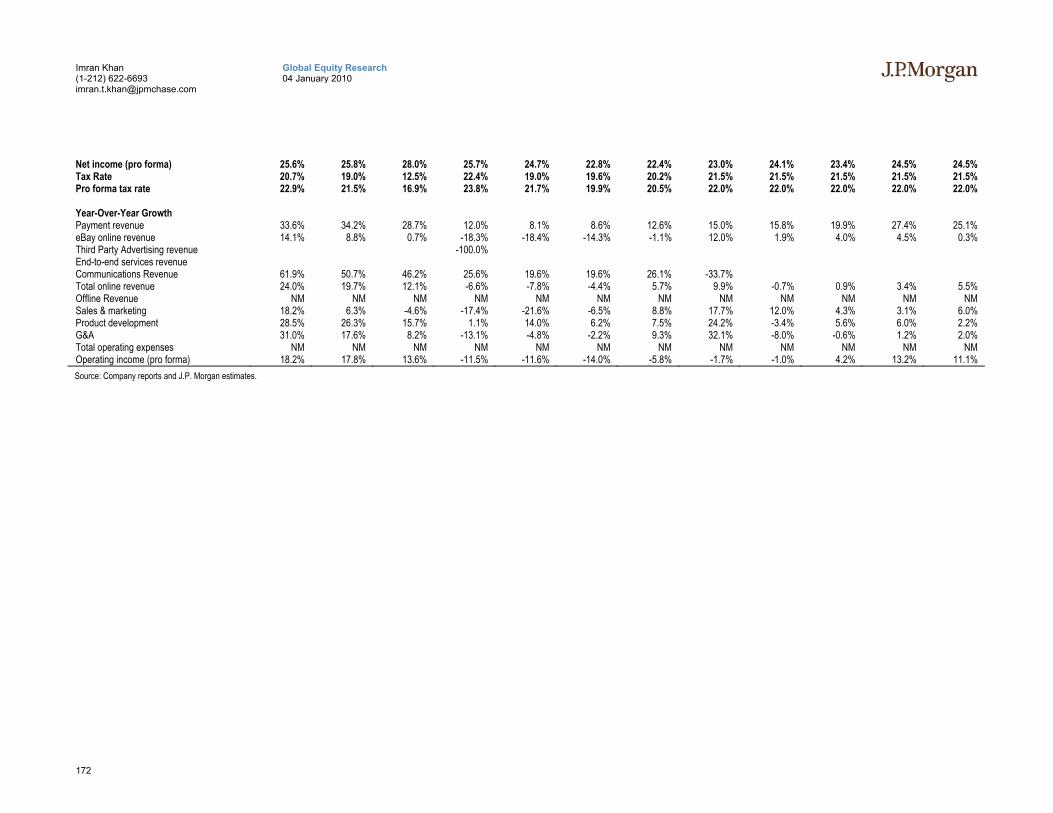
172
Global Equity Research 04 January 2010
Imran Khan (1-212) 622-6693 [email protected]
Net income (pro forma) 25.6% 25.8% 28.0% 25.7% 24.7% 22.8% 22.4% 23.0% 24.1% 23.4% 24.5% 24.5% Tax Rate 20.7% 19.0% 12.5% 22.4% 19.0% 19.6% 20.2% 21.5% 21.5% 21.5% 21.5% 21.5% Pro forma tax rate 22.9% 21.5% 16.9% 23.8% 21.7% 19.9% 20.5% 22.0% 22.0% 22.0% 22.0% 22.0% Year-Over-Year Growth Payment revenue 33.6% 34.2% 28.7% 12.0% 8.1% 8.6% 12.6% 15.0% 15.8% 19.9% 27.4% 25.1% eBay online revenue 14.1% 8.8% 0.7% -18.3% -18.4% -14.3% -1.1% 12.0% 1.9% 4.0% 4.5% 0.3% Third Party Advertising revenue -100.0% End-to-end services revenue Communications Revenue 61.9% 50.7% 46.2% 25.6% 19.6% 19.6% 26.1% -33.7% Total online revenue 24.0% 19.7% 12.1% -6.6% -7.8% -4.4% 5.7% 9.9% -0.7% 0.9% 3.4% 5.5% Offline Revenue NM NM NM NM NM NM NM NM NM NM NM NM Sales & marketing 18.2% 6.3% -4.6% -17.4% -21.6% -6.5% 8.8% 17.7% 12.0% 4.3% 3.1% 6.0% Product development 28.5% 26.3% 15.7% 1.1% 14.0% 6.2% 7.5% 24.2% -3.4% 5.6% 6.0% 2.2% G&A 31.0% 17.6% 8.2% -13.1% -4.8% -2.2% 9.3% 32.1% -8.0% -0.6% 1.2% 2.0% Total operating expenses NM NM NM NM NM NM NM NM NM NM NM NM Operating income (pro forma) 18.2% 17.8% 13.6% -11.5% -11.6% -14.0% -5.8% -1.7% -1.0% 4.2% 13.2% 11.1% Source: Company reports and J.P. Morgan estimates.
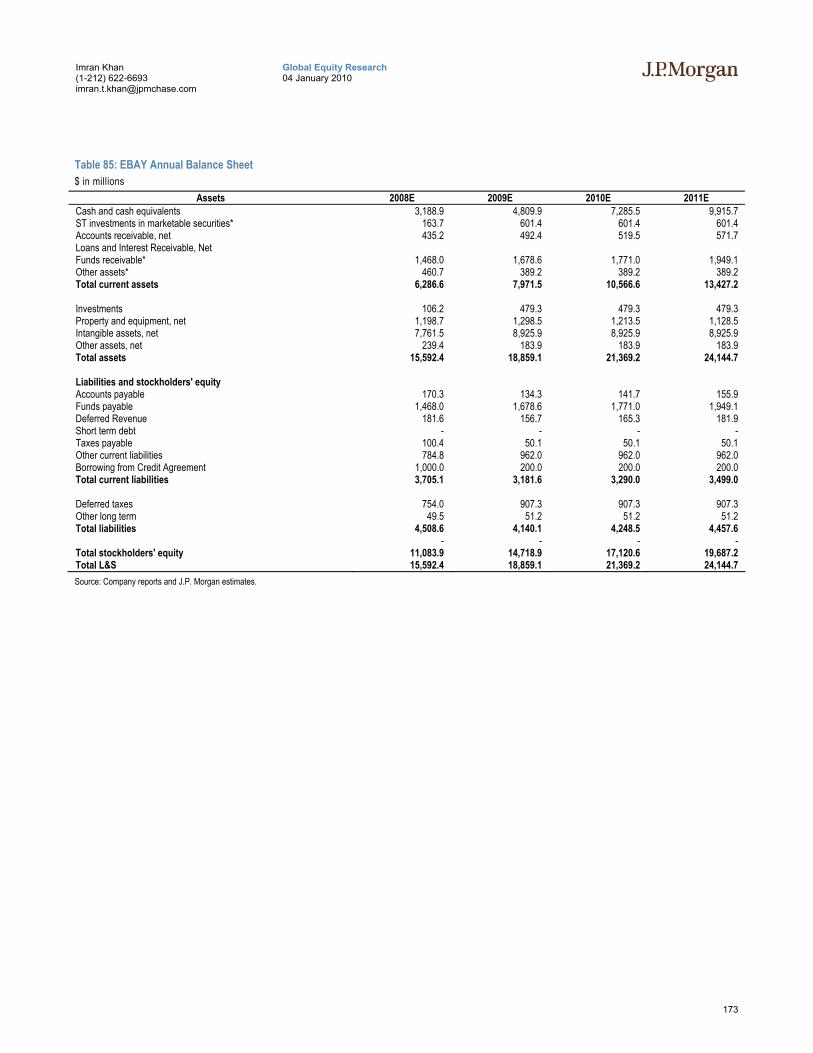
173
Global Equity Research 04 January 2010
Imran Khan (1-212) 622-6693 [email protected]
Table 85: EBAY Annual Balance Sheet $ in millions
Assets 2008E 2009E 2010E 2011E Cash and cash equivalents 3,188.9 4,809.9 7,285.5 9,915.7 ST investments in marketable securities* 163.7 601.4 601.4 601.4 Accounts receivable, net 435.2 492.4 519.5 571.7 Loans and Interest Receivable, Net Funds receivable* 1,468.0 1,678.6 1,771.0 1,949.1 Other assets* 460.7 389.2 389.2 389.2 Total current assets 6,286.6 7,971.5 10,566.6 13,427.2 Investments 106.2 479.3 479.3 479.3 Property and equipment, net 1,198.7 1,298.5 1,213.5 1,128.5 Intangible assets, net 7,761.5 8,925.9 8,925.9 8,925.9 Other assets, net 239.4 183.9 183.9 183.9 Total assets 15,592.4 18,859.1 21,369.2 24,144.7 Liabilities and stockholders' equity Accounts payable 170.3 134.3 141.7 155.9 Funds payable 1,468.0 1,678.6 1,771.0 1,949.1 Deferred Revenue 181.6 156.7 165.3 181.9 Short term debt - - - - Taxes payable 100.4 50.1 50.1 50.1 Other current liabilities 784.8 962.0 962.0 962.0 Borrowing from Credit Agreement 1,000.0 200.0 200.0 200.0 Total current liabilities 3,705.1 3,181.6 3,290.0 3,499.0 Deferred taxes 754.0 907.3 907.3 907.3 Other long term 49.5 51.2 51.2 51.2 Total liabilities 4,508.6 4,140.1 4,248.5 4,457.6 - - - - Total stockholders' equity 11,083.9 14,718.9 17,120.6 19,687.2 Total L&S 15,592.4 18,859.1 21,369.2 24,144.7 Source: Company reports and J.P. Morgan estimates.
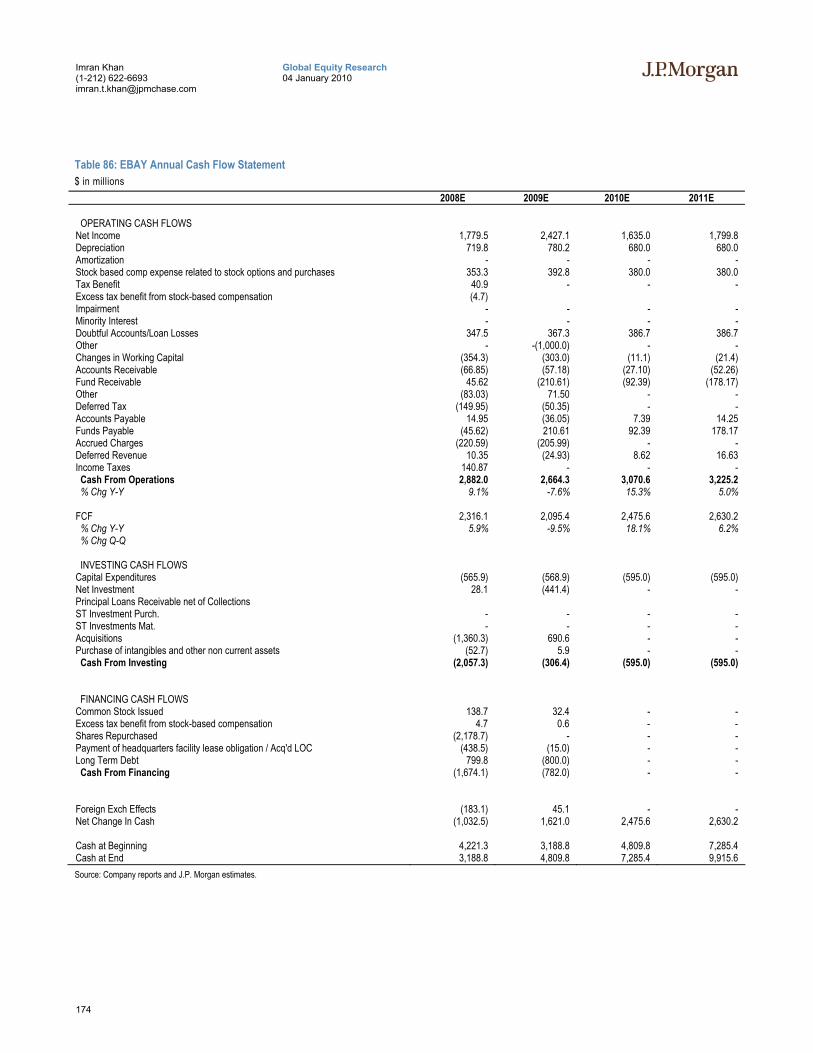
174
Global Equity Research 04 January 2010
Imran Khan (1-212) 622-6693 [email protected]
Table 86: EBAY Annual Cash Flow Statement $ in millions
2008E 2009E 2010E 2011E
OPERATING CASH FLOWS Net Income 1,779.5 2,427.1 1,635.0 1,799.8 Depreciation 719.8 780.2 680.0 680.0 Amortization - - - - Stock based comp expense related to stock options and purchases 353.3 392.8 380.0 380.0 Tax Benefit 40.9 - - - Excess tax benefit from stock-based compensation (4.7) Impairment - - - - Minority Interest - - - - Doubtful Accounts/Loan Losses 347.5 367.3 386.7 386.7 Other - -(1,000.0) - - Changes in Working Capital (354.3) (303.0) (11.1) (21.4) Accounts Receivable (66.85) (57.18) (27.10) (52.26) Fund Receivable 45.62 (210.61) (92.39) (178.17) Other (83.03) 71.50 - - Deferred Tax (149.95) (50.35) - - Accounts Payable 14.95 (36.05) 7.39 14.25 Funds Payable (45.62) 210.61 92.39 178.17 Accrued Charges (220.59) (205.99) - - Deferred Revenue 10.35 (24.93) 8.62 16.63 Income Taxes 140.87 - - - Cash From Operations 2,882.0 2,664.3 3,070.6 3,225.2 % Chg Y-Y 9.1% -7.6% 15.3% 5.0% FCF 2,316.1 2,095.4 2,475.6 2,630.2 % Chg Y-Y 5.9% -9.5% 18.1% 6.2% % Chg Q-Q INVESTING CASH FLOWS Capital Expenditures (565.9) (568.9) (595.0) (595.0) Net Investment 28.1 (441.4) - - Principal Loans Receivable net of Collections ST Investment Purch. - - - - ST Investments Mat. - - - - Acquisitions (1,360.3) 690.6 - - Purchase of intangibles and other non current assets (52.7) 5.9 - - Cash From Investing (2,057.3) (306.4) (595.0) (595.0) FINANCING CASH FLOWS Common Stock Issued 138.7 32.4 - - Excess tax benefit from stock-based compensation 4.7 0.6 - - Shares Repurchased (2,178.7) - - - Payment of headquarters facility lease obligation / Acq'd LOC (438.5) (15.0) - - Long Term Debt 799.8 (800.0) - - Cash From Financing (1,674.1) (782.0) - - Foreign Exch Effects (183.1) 45.1 - - Net Change In Cash (1,032.5) 1,621.0 2,475.6 2,630.2 Cash at Beginning 4,221.3 3,188.8 4,809.8 7,285.4 Cash at End 3,188.8 4,809.8 7,285.4 9,915.6 Source: Company reports and J.P. Morgan estimates.
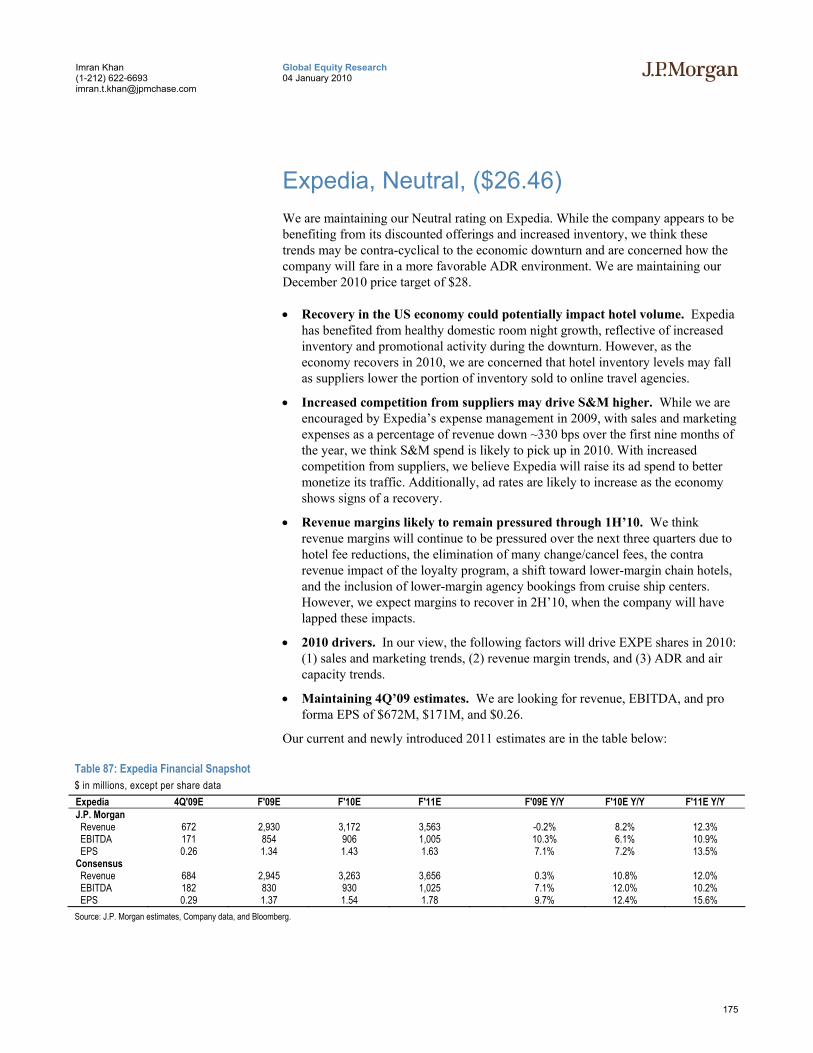
175
Global Equity Research 04 January 2010
Imran Khan (1-212) 622-6693 [email protected]
Expedia, Neutral, ($26.46) We are maintaining our Neutral rating on Expedia. While the company appears to be benefiting from its discounted offerings and increased inventory, we think these trends may be contra-cyclical to the economic downturn and are concerned how the company will fare in a more favorable ADR environment. We are maintaining our December 2010 price target of $28.
• Recovery in the US economy could potentially impact hotel volume. Expedia has benefited from healthy domestic room night growth, reflective of increased inventory and promotional activity during the downturn. However, as the economy recovers in 2010, we are concerned that hotel inventory levels may fall as suppliers lower the portion of inventory sold to online travel agencies.
• Increased competition from suppliers may drive S&M higher. While we are encouraged by Expedia’s expense management in 2009, with sales and marketing expenses as a percentage of revenue down ~330 bps over the first nine months of the year, we think S&M spend is likely to pick up in 2010. With increased competition from suppliers, we believe Expedia will raise its ad spend to better monetize its traffic. Additionally, ad rates are likely to increase as the economy shows signs of a recovery.
• Revenue margins likely to remain pressured through 1H’10. We think revenue margins will continue to be pressured over the next three quarters due to hotel fee reductions, the elimination of many change/cancel fees, the contra revenue impact of the loyalty program, a shift toward lower-margin chain hotels, and the inclusion of lower-margin agency bookings from cruise ship centers. However, we expect margins to recover in 2H’10, when the company will have lapped these impacts.
• 2010 drivers. In our view, the following factors will drive EXPE shares in 2010: (1) sales and marketing trends, (2) revenue margin trends, and (3) ADR and air capacity trends.
• Maintaining 4Q’09 estimates. We are looking for revenue, EBITDA, and pro forma EPS of $672M, $171M, and $0.26.
Our current and newly introduced 2011 estimates are in the table below:
Table 87: Expedia Financial Snapshot $ in millions, except per share data Expedia 4Q'09E F'09E F'10E F'11E F'09E Y/Y F'10E Y/Y F'11E Y/Y J.P. Morgan Revenue 672 2,930 3,172 3,563 -0.2% 8.2% 12.3% EBITDA 171 854 906 1,005 10.3% 6.1% 10.9% EPS 0.26 1.34 1.43 1.63 7.1% 7.2% 13.5% Consensus Revenue 684 2,945 3,263 3,656 0.3% 10.8% 12.0% EBITDA 182 830 930 1,025 7.1% 12.0% 10.2% EPS 0.29 1.37 1.54 1.78 9.7% 12.4% 15.6% Source: J.P. Morgan estimates, Company data, and Bloomberg.
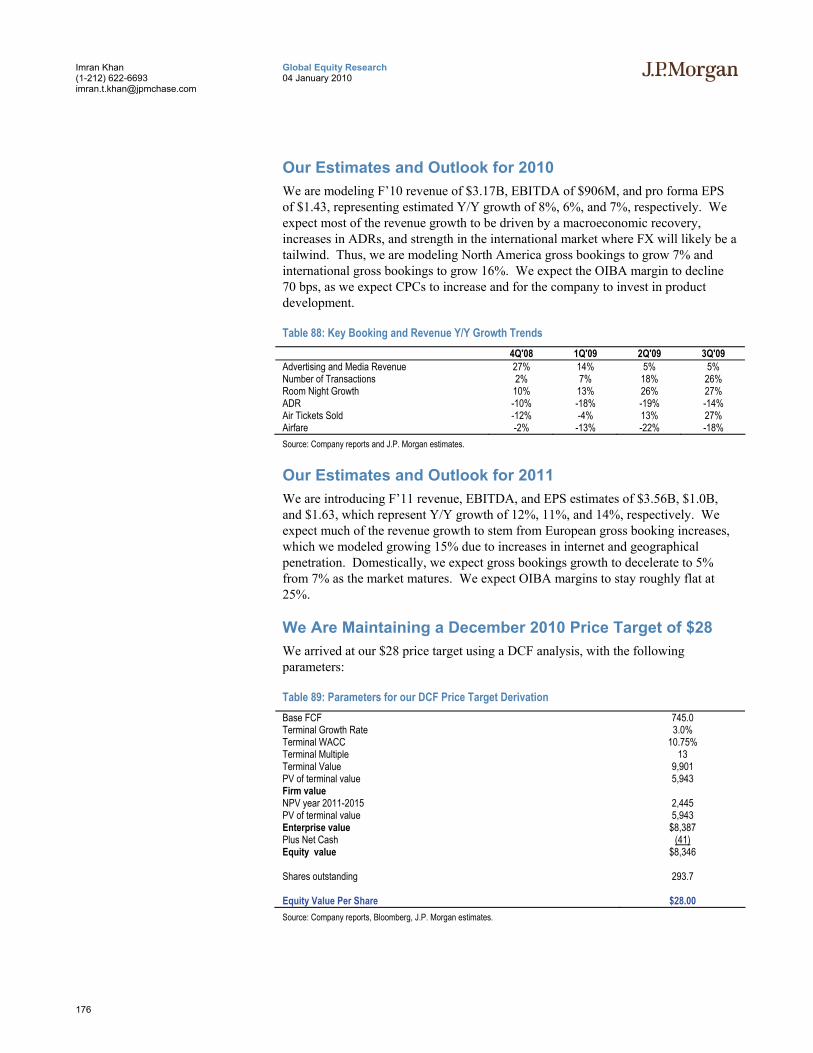
176
Global Equity Research 04 January 2010
Imran Khan (1-212) 622-6693 [email protected]
Our Estimates and Outlook for 2010 We are modeling F’10 revenue of $3.17B, EBITDA of $906M, and pro forma EPS of $1.43, representing estimated Y/Y growth of 8%, 6%, and 7%, respectively. We expect most of the revenue growth to be driven by a macroeconomic recovery, increases in ADRs, and strength in the international market where FX will likely be a tailwind. Thus, we are modeling North America gross bookings to grow 7% and international gross bookings to grow 16%. We expect the OIBA margin to decline 70 bps, as we expect CPCs to increase and for the company to invest in product development.
Table 88: Key Booking and Revenue Y/Y Growth Trends 4Q'08 1Q'09 2Q'09 3Q'09
Advertising and Media Revenue 27% 14% 5% 5% Number of Transactions 2% 7% 18% 26% Room Night Growth 10% 13% 26% 27% ADR -10% -18% -19% -14% Air Tickets Sold -12% -4% 13% 27% Airfare -2% -13% -22% -18% Source: Company reports and J.P. Morgan estimates.
Our Estimates and Outlook for 2011 We are introducing F’11 revenue, EBITDA, and EPS estimates of $3.56B, $1.0B, and $1.63, which represent Y/Y growth of 12%, 11%, and 14%, respectively. We expect much of the revenue growth to stem from European gross booking increases, which we modeled growing 15% due to increases in internet and geographical penetration. Domestically, we expect gross bookings growth to decelerate to 5% from 7% as the market matures. We expect OIBA margins to stay roughly flat at 25%.
We Are Maintaining a December 2010 Price Target of $28 We arrived at our $28 price target using a DCF analysis, with the following parameters:
Table 89: Parameters for our DCF Price Target Derivation Base FCF 745.0 Terminal Growth Rate 3.0% Terminal WACC 10.75% Terminal Multiple 13 Terminal Value 9,901 PV of terminal value 5,943 Firm value NPV year 2011-2015 2,445 PV of terminal value 5,943 Enterprise value $8,387 Plus Net Cash (41) Equity value $8,346 Shares outstanding 293.7 Equity Value Per Share $28.00 Source: Company reports, Bloomberg, J.P. Morgan estimates.
177
Global Equity Research 04 January 2010
Imran Khan (1-212) 622-6693 [email protected]
Valuation and Rating Analysis On an EV/EBITDA basis, Expedia trades at 9x our F’10 EBITDA estimate, versus its peers at 13x. We think this valuation accurately reflects the cyclical challenges the company faces in addition to new pricing pressure in the industry. As we see better upside opportunities in other stocks in our coverage universe, we rate Expedia Neutral.
Risks to Our Rating The company’s shares could outperform if the company (1) achieves significant market share gains to offset pricing decreases, (2) eliminates pricing promotions, or (3) makes significant market share gains in the international markets.
The company’s shares could underperform if the company is unable to (1) withstand the competitive threat that the travel suppliers and travel search engines pose, (2) achieve a high ROI on selling and marketing investments, (3) achieve strong gross bookings growth in a weak economy, and (4) achieve further expansion into international markets.
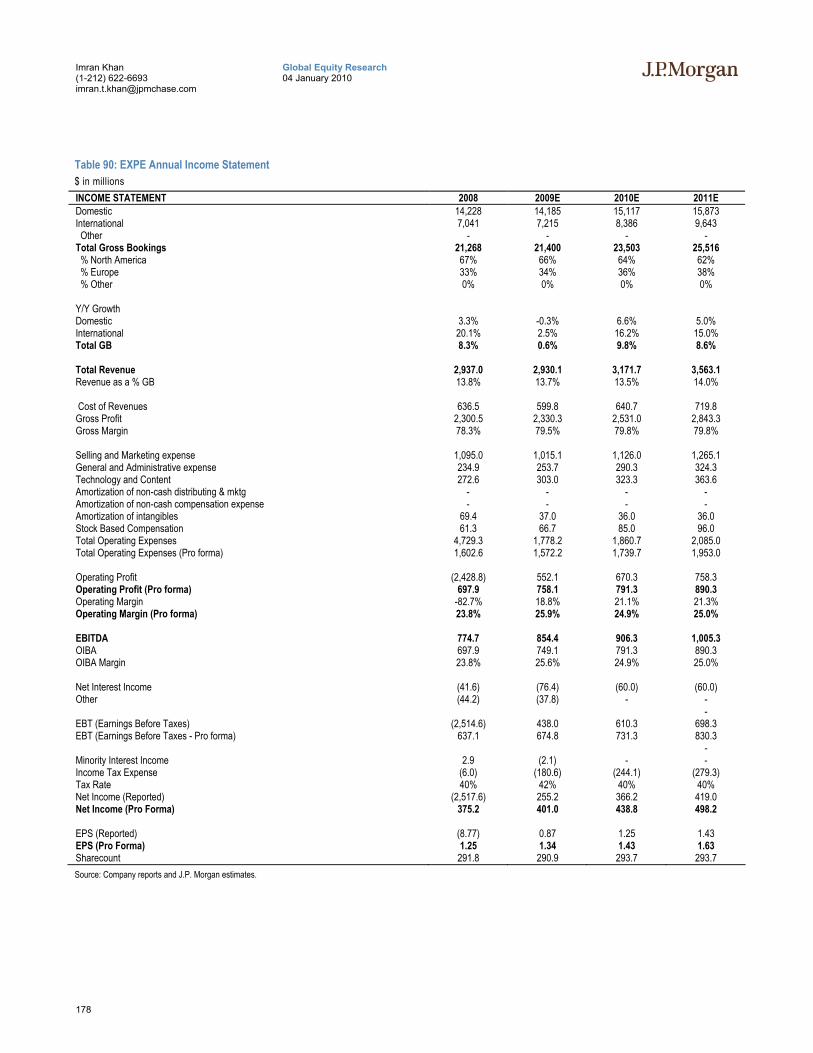
178
Global Equity Research 04 January 2010
Imran Khan (1-212) 622-6693 [email protected]
Table 90: EXPE Annual Income Statement $ in millions INCOME STATEMENT 2008 2009E 2010E 2011E Domestic 14,228 14,185 15,117 15,873 International 7,041 7,215 8,386 9,643 Other - - - - Total Gross Bookings 21,268 21,400 23,503 25,516 % North America 67% 66% 64% 62% % Europe 33% 34% 36% 38% % Other 0% 0% 0% 0% Y/Y Growth Domestic 3.3% -0.3% 6.6% 5.0% International 20.1% 2.5% 16.2% 15.0% Total GB 8.3% 0.6% 9.8% 8.6% Total Revenue 2,937.0 2,930.1 3,171.7 3,563.1 Revenue as a % GB 13.8% 13.7% 13.5% 14.0% Cost of Revenues 636.5 599.8 640.7 719.8 Gross Profit 2,300.5 2,330.3 2,531.0 2,843.3 Gross Margin 78.3% 79.5% 79.8% 79.8% Selling and Marketing expense 1,095.0 1,015.1 1,126.0 1,265.1 General and Administrative expense 234.9 253.7 290.3 324.3 Technology and Content 272.6 303.0 323.3 363.6 Amortization of non-cash distributing & mktg - - - - Amortization of non-cash compensation expense - - - - Amortization of intangibles 69.4 37.0 36.0 36.0 Stock Based Compensation 61.3 66.7 85.0 96.0 Total Operating Expenses 4,729.3 1,778.2 1,860.7 2,085.0 Total Operating Expenses (Pro forma) 1,602.6 1,572.2 1,739.7 1,953.0 Operating Profit (2,428.8) 552.1 670.3 758.3 Operating Profit (Pro forma) 697.9 758.1 791.3 890.3 Operating Margin -82.7% 18.8% 21.1% 21.3% Operating Margin (Pro forma) 23.8% 25.9% 24.9% 25.0% EBITDA 774.7 854.4 906.3 1,005.3 OIBA 697.9 749.1 791.3 890.3 OIBA Margin 23.8% 25.6% 24.9% 25.0% Net Interest Income (41.6) (76.4) (60.0) (60.0) Other (44.2) (37.8) - - - EBT (Earnings Before Taxes) (2,514.6) 438.0 610.3 698.3 EBT (Earnings Before Taxes - Pro forma) 637.1 674.8 731.3 830.3 - Minority Interest Income 2.9 (2.1) - - Income Tax Expense (6.0) (180.6) (244.1) (279.3) Tax Rate 40% 42% 40% 40% Net Income (Reported) (2,517.6) 255.2 366.2 419.0 Net Income (Pro Forma) 375.2 401.0 438.8 498.2 EPS (Reported) (8.77) 0.87 1.25 1.43 EPS (Pro Forma) 1.25 1.34 1.43 1.63 Sharecount 291.8 290.9 293.7 293.7 Source: Company reports and J.P. Morgan estimates.

179
Global Equity Research 04 January 2010
Imran Khan (1-212) 622-6693 [email protected]
Table 91: EXPE Quarterly Income Statement $ in millions INCOME STATEMENT 1Q'08 2Q'08 3Q'08 4Q'08 1Q'09 2Q'09 3Q'09 4Q'09E 1Q'10E 2Q'10E 3Q'10E 4Q'10E Domestic 4,000 4,058 3,497 2,673 3,562 3,890 3,793 2,940 3,847 4,162 4,021 3,087 International 1,903 1,875 1,916 1,347 1,663 1,734 2,121 1,697 1,946 2,011 2,460 1,969 Total Gross Bookings 5,902 5,933 5,413 4,020 5,225 5,623 5,914 4,638 5,793 6,173 6,481 5,056 Total Revenue 687.8 795.0 833.3 620.8 635.7 769.8 852.4 672.2 683.4 789.3 940.2 758.7 Revenue as a % GB 11.7% 13.4% 15.4% 15.4% 12.2% 13.7% 14.4% 14.5% 11.8% 12.8% 14.5% 15.0% Cost of Revenues 151.7 169.4 177.2 138.2 142.8 148.2 168.9 139.8 149.0 151.5 189.9 150.2 Gross Profit 536.1 625.6 656.1 482.6 492.9 621.5 683.5 532.4 534.5 637.7 750.3 608.5 Gross Margin 77.9% 78.7% 78.7% 77.7% 77.5% 80.7% 80.2% 79.2% 78.2% 80.8% 79.8% 80.2% Selling and Marketing expense 284.2 297.6 297.4 215.8 231.9 268.7 281.9 232.6 243.3 288.1 329.1 265.6 General and Administrative expense 58.9 55.8 59.0 61.2 59.2 60.5 65.4 68.6 71.8 71.8 72.4 74.4 Technology and Content 67.1 68.1 68.9 68.5 72.5 74.5 75.3 80.7 77.9 77.3 84.6 83.5 Amortization of intangibles 18.1 18.7 15.8 16.9 9.1 9.3 9.6 9.0 9.0 9.0 9.0 9.0 Stock Based Compensation 17.8 14.9 15.4 13.3 18.6 13.6 14.5 20.0 20.0 20.0 22.0 23.0 Extraordinary Items - - - 2,996.0 8.7 80.3 13.8 - - - - - Total Operating Expenses 446.1 455.0 456.5 3,371.7 400.0 506.9 460.5 410.8 422.0 466.3 517.1 455.4 Total Operating Expenses (Pro forma) 410.3 421.5 425.3 345.5 364.1 403.7 422.6 381.8 393.0 437.3 486.1 423.4 Operating Profit 90.0 170.6 199.6 (2,889.1) 92.9 114.6 223.0 121.6 112.5 171.5 233.2 153.1 Operating Profit (Pro forma) 125.9 204.1 230.8 137.1 128.9 217.8 260.9 150.6 141.5 200.5 264.2 185.1 Operating Margin 13.1% 21.5% 24.0% -465.4% 14.6% 14.9% 26.2% 18.1% 16.5% 21.7% 24.8% 20.2% Operating Margin (Pro forma) 18.3% 25.7% 27.7% 22.1% 20.3% 28.3% 30.6% 22.4% 20.7% 25.4% 28.1% 24.4% EBITDA 142.9 222.4 250.4 159.0 154.4 242.6 286.8 170.6 168.5 228.5 293.2 216.1 OIBA 125.9 204.1 230.8 137.1 129.8 212.4 256.4 150.6 141.5 200.5 264.2 185.1 OIBA Margin 18.3% 25.7% 27.7% 22.1% 20.4% 27.6% 30.1% 22.4% 20.7% 25.4% 28.1% 24.4% Net Interest Income (7.6) (4.3) (12.6) (17.1) (19.0) (19.4) (20.0) (18.0) (15.0) (15.0) (15.0) (15.0) Other (3.7) (5.1) (23.2) (12.2) (6.9) (19.1) (4.7) (7.0) EBT (Earnings Before Taxes) 78.7 161.2 163.8 (2,918.3) 67.0 76.2 198.2 96.6 97.5 156.5 218.2 138.1 EBT (Earnings Before Taxes - Pro forma) 118.3 199.8 198.0 121.1 102.9 198.4 240.8 132.6 126.5 185.5 249.2 170.1 Minority Interest Income 1.5 0.9 0.3 0.2 (0.4) (0.9) (0.8) - - - - - Income Tax Expense (29.0) (65.9) (69.2) 158.2 (27.3) (34.3) (80.4) (38.6) (39.0) (62.6) (87.3) (55.3) Tax Rate 37% 41% 42% NA 41% 45% 41% 40% 40% 40% 40% 40% Net Income (Reported) 51.3 96.1 94.9 (2,760.0) 39.4 40.9 117.0 57.9 58.5 93.9 130.9 82.9 Net Income (Pro Forma) 71.0 120.9 118.4 64.9 62.8 113.7 144.9 79.5 75.9 111.3 149.5 102.1 EPS (Reported) 0.17 0.33 0.33 (9.60) 0.14 0.14 0.40 0.20 0.20 0.32 0.45 0.28 EPS (Pro Forma) 0.24 0.40 0.39 0.22 0.21 0.38 0.48 0.26 0.25 0.36 0.49 0.33 Sharecount 294.0 294.0 291.7 287.5 287.9 288.2 293.7 293.7 293.7 293.7 293.7 293.7 Source: Company reports and J.P. Morgan estimates.
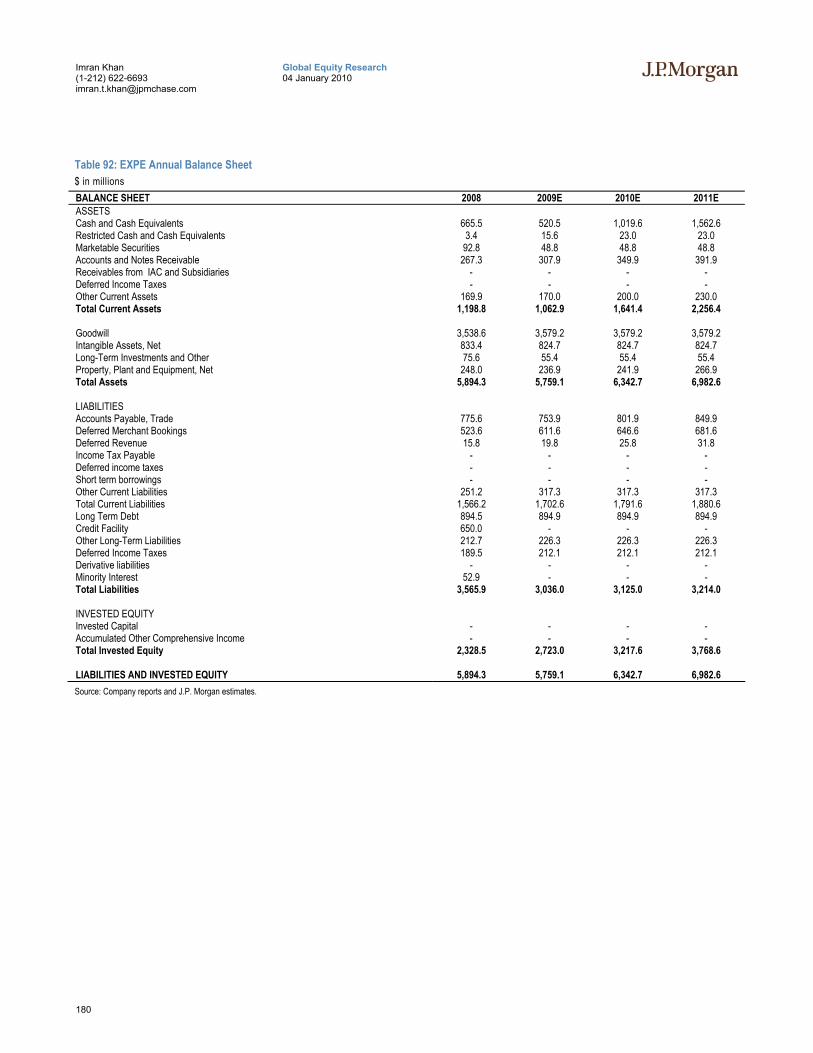
180
Global Equity Research 04 January 2010
Imran Khan (1-212) 622-6693 [email protected]
Table 92: EXPE Annual Balance Sheet $ in millions BALANCE SHEET 2008 2009E 2010E 2011E ASSETS Cash and Cash Equivalents 665.5 520.5 1,019.6 1,562.6 Restricted Cash and Cash Equivalents 3.4 15.6 23.0 23.0 Marketable Securities 92.8 48.8 48.8 48.8 Accounts and Notes Receivable 267.3 307.9 349.9 391.9 Receivables from IAC and Subsidiaries - - - - Deferred Income Taxes - - - - Other Current Assets 169.9 170.0 200.0 230.0 Total Current Assets 1,198.8 1,062.9 1,641.4 2,256.4 Goodwill 3,538.6 3,579.2 3,579.2 3,579.2 Intangible Assets, Net 833.4 824.7 824.7 824.7 Long-Term Investments and Other 75.6 55.4 55.4 55.4 Property, Plant and Equipment, Net 248.0 236.9 241.9 266.9 Total Assets 5,894.3 5,759.1 6,342.7 6,982.6 LIABILITIES Accounts Payable, Trade 775.6 753.9 801.9 849.9 Deferred Merchant Bookings 523.6 611.6 646.6 681.6 Deferred Revenue 15.8 19.8 25.8 31.8 Income Tax Payable - - - - Deferred income taxes - - - - Short term borrowings - - - - Other Current Liabilities 251.2 317.3 317.3 317.3 Total Current Liabilities 1,566.2 1,702.6 1,791.6 1,880.6 Long Term Debt 894.5 894.9 894.9 894.9 Credit Facility 650.0 - - - Other Long-Term Liabilities 212.7 226.3 226.3 226.3 Deferred Income Taxes 189.5 212.1 212.1 212.1 Derivative liabilities - - - - Minority Interest 52.9 - - - Total Liabilities 3,565.9 3,036.0 3,125.0 3,214.0 INVESTED EQUITY Invested Capital - - - - Accumulated Other Comprehensive Income - - - - Total Invested Equity 2,328.5 2,723.0 3,217.6 3,768.6 LIABILITIES AND INVESTED EQUITY 5,894.3 5,759.1 6,342.7 6,982.6 Source: Company reports and J.P. Morgan estimates.
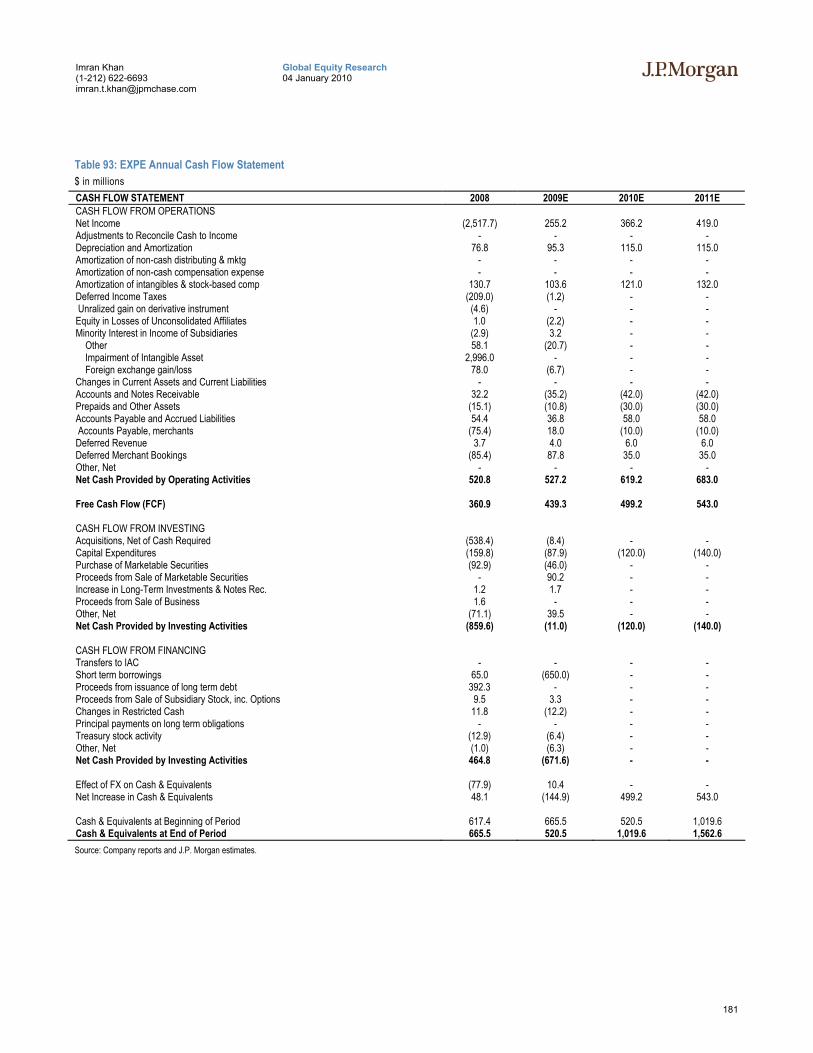
181
Global Equity Research 04 January 2010
Imran Khan (1-212) 622-6693 [email protected]
Table 93: EXPE Annual Cash Flow Statement $ in millions CASH FLOW STATEMENT 2008 2009E 2010E 2011E CASH FLOW FROM OPERATIONS Net Income (2,517.7) 255.2 366.2 419.0 Adjustments to Reconcile Cash to Income - - - - Depreciation and Amortization 76.8 95.3 115.0 115.0 Amortization of non-cash distributing & mktg - - - - Amortization of non-cash compensation expense - - - - Amortization of intangibles & stock-based comp 130.7 103.6 121.0 132.0 Deferred Income Taxes (209.0) (1.2) - - Unralized gain on derivative instrument (4.6) - - - Equity in Losses of Unconsolidated Affiliates 1.0 (2.2) - - Minority Interest in Income of Subsidiaries (2.9) 3.2 - - Other 58.1 (20.7) - - Impairment of Intangible Asset 2,996.0 - - - Foreign exchange gain/loss 78.0 (6.7) - - Changes in Current Assets and Current Liabilities - - - - Accounts and Notes Receivable 32.2 (35.2) (42.0) (42.0) Prepaids and Other Assets (15.1) (10.8) (30.0) (30.0) Accounts Payable and Accrued Liabilities 54.4 36.8 58.0 58.0 Accounts Payable, merchants (75.4) 18.0 (10.0) (10.0) Deferred Revenue 3.7 4.0 6.0 6.0 Deferred Merchant Bookings (85.4) 87.8 35.0 35.0 Other, Net - - - - Net Cash Provided by Operating Activities 520.8 527.2 619.2 683.0 Free Cash Flow (FCF) 360.9 439.3 499.2 543.0 CASH FLOW FROM INVESTING Acquisitions, Net of Cash Required (538.4) (8.4) - - Capital Expenditures (159.8) (87.9) (120.0) (140.0) Purchase of Marketable Securities (92.9) (46.0) - - Proceeds from Sale of Marketable Securities - 90.2 - - Increase in Long-Term Investments & Notes Rec. 1.2 1.7 - - Proceeds from Sale of Business 1.6 - - - Other, Net (71.1) 39.5 - - Net Cash Provided by Investing Activities (859.6) (11.0) (120.0) (140.0) CASH FLOW FROM FINANCING Transfers to IAC - - - - Short term borrowings 65.0 (650.0) - - Proceeds from issuance of long term debt 392.3 - - - Proceeds from Sale of Subsidiary Stock, inc. Options 9.5 3.3 - - Changes in Restricted Cash 11.8 (12.2) - - Principal payments on long term obligations - - - - Treasury stock activity (12.9) (6.4) - - Other, Net (1.0) (6.3) - - Net Cash Provided by Investing Activities 464.8 (671.6) - - Effect of FX on Cash & Equivalents (77.9) 10.4 - - Net Increase in Cash & Equivalents 48.1 (144.9) 499.2 543.0 Cash & Equivalents at Beginning of Period 617.4 665.5 520.5 1,019.6 Cash & Equivalents at End of Period 665.5 520.5 1,019.6 1,562.6 Source: Company reports and J.P. Morgan estimates.
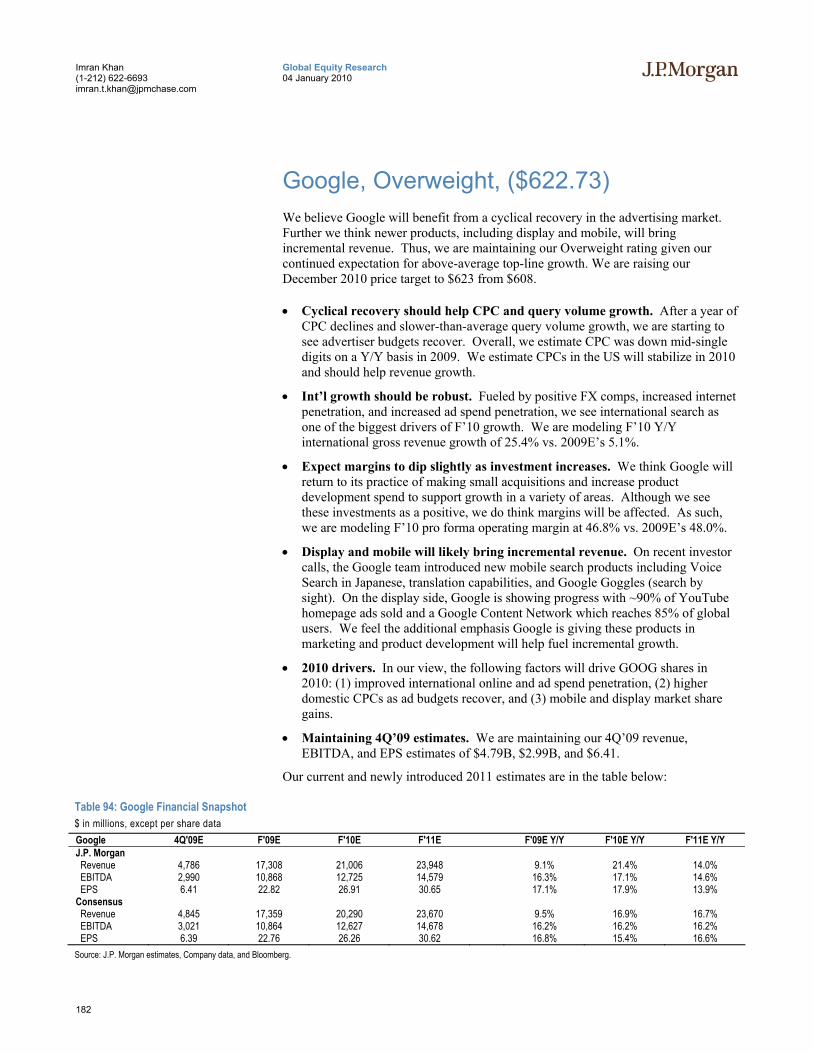
182
Global Equity Research 04 January 2010
Imran Khan (1-212) 622-6693 [email protected]
Google, Overweight, ($622.73) We believe Google will benefit from a cyclical recovery in the advertising market. Further we think newer products, including display and mobile, will bring incremental revenue. Thus, we are maintaining our Overweight rating given our continued expectation for above-average top-line growth. We are raising our December 2010 price target to $623 from $608.
• Cyclical recovery should help CPC and query volume growth. After a year of CPC declines and slower-than-average query volume growth, we are starting to see advertiser budgets recover. Overall, we estimate CPC was down mid-single digits on a Y/Y basis in 2009. We estimate CPCs in the US will stabilize in 2010 and should help revenue growth.
• Int’l growth should be robust. Fueled by positive FX comps, increased internet penetration, and increased ad spend penetration, we see international search as one of the biggest drivers of F’10 growth. We are modeling F’10 Y/Y international gross revenue growth of 25.4% vs. 2009E’s 5.1%.
• Expect margins to dip slightly as investment increases. We think Google will return to its practice of making small acquisitions and increase product development spend to support growth in a variety of areas. Although we see these investments as a positive, we do think margins will be affected. As such, we are modeling F’10 pro forma operating margin at 46.8% vs. 2009E’s 48.0%.
• Display and mobile will likely bring incremental revenue. On recent investor calls, the Google team introduced new mobile search products including Voice Search in Japanese, translation capabilities, and Google Goggles (search by sight). On the display side, Google is showing progress with ~90% of YouTube homepage ads sold and a Google Content Network which reaches 85% of global users. We feel the additional emphasis Google is giving these products in marketing and product development will help fuel incremental growth.
• 2010 drivers. In our view, the following factors will drive GOOG shares in 2010: (1) improved international online and ad spend penetration, (2) higher domestic CPCs as ad budgets recover, and (3) mobile and display market share gains.
• Maintaining 4Q’09 estimates. We are maintaining our 4Q’09 revenue, EBITDA, and EPS estimates of $4.79B, $2.99B, and $6.41.
Our current and newly introduced 2011 estimates are in the table below:
Table 94: Google Financial Snapshot $ in millions, except per share data Google 4Q'09E F'09E F'10E F'11E F'09E Y/Y F'10E Y/Y F'11E Y/Y J.P. Morgan Revenue 4,786 17,308 21,006 23,948 9.1% 21.4% 14.0% EBITDA 2,990 10,868 12,725 14,579 16.3% 17.1% 14.6% EPS 6.41 22.82 26.91 30.65 17.1% 17.9% 13.9% Consensus Revenue 4,845 17,359 20,290 23,670 9.5% 16.9% 16.7% EBITDA 3,021 10,864 12,627 14,678 16.2% 16.2% 16.2% EPS 6.39 22.76 26.26 30.62 16.8% 15.4% 16.6% Source: J.P. Morgan estimates, Company data, and Bloomberg.
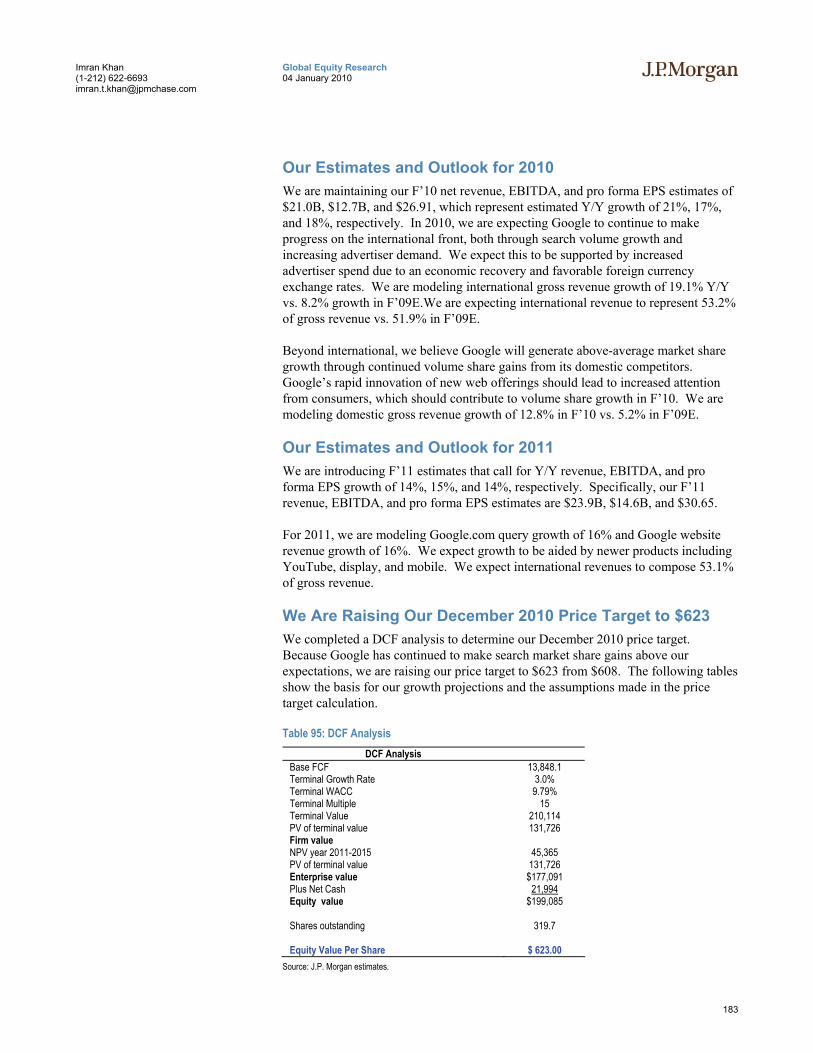
183
Global Equity Research 04 January 2010
Imran Khan (1-212) 622-6693 [email protected]
Our Estimates and Outlook for 2010 We are maintaining our F’10 net revenue, EBITDA, and pro forma EPS estimates of $21.0B, $12.7B, and $26.91, which represent estimated Y/Y growth of 21%, 17%, and 18%, respectively. In 2010, we are expecting Google to continue to make progress on the international front, both through search volume growth and increasing advertiser demand. We expect this to be supported by increased advertiser spend due to an economic recovery and favorable foreign currency exchange rates. We are modeling international gross revenue growth of 19.1% Y/Y vs. 8.2% growth in F’09E.We are expecting international revenue to represent 53.2% of gross revenue vs. 51.9% in F’09E.
Beyond international, we believe Google will generate above-average market share growth through continued volume share gains from its domestic competitors. Google’s rapid innovation of new web offerings should lead to increased attention from consumers, which should contribute to volume share growth in F’10. We are modeling domestic gross revenue growth of 12.8% in F’10 vs. 5.2% in F’09E.
Our Estimates and Outlook for 2011 We are introducing F’11 estimates that call for Y/Y revenue, EBITDA, and pro forma EPS growth of 14%, 15%, and 14%, respectively. Specifically, our F’11 revenue, EBITDA, and pro forma EPS estimates are $23.9B, $14.6B, and $30.65.
For 2011, we are modeling Google.com query growth of 16% and Google website revenue growth of 16%. We expect growth to be aided by newer products including YouTube, display, and mobile. We expect international revenues to compose 53.1% of gross revenue.
We Are Raising Our December 2010 Price Target to $623 We completed a DCF analysis to determine our December 2010 price target. Because Google has continued to make search market share gains above our expectations, we are raising our price target to $623 from $608. The following tables show the basis for our growth projections and the assumptions made in the price target calculation.
Table 95: DCF Analysis DCF Analysis
Base FCF 13,848.1 Terminal Growth Rate 3.0% Terminal WACC 9.79% Terminal Multiple 15 Terminal Value 210,114 PV of terminal value 131,726 Firm value NPV year 2011-2015 45,365 PV of terminal value 131,726 Enterprise value $177,091 Plus Net Cash 21,994 Equity value $199,085 Shares outstanding 319.7 Equity Value Per Share $ 623.00
Source: J.P. Morgan estimates.
184
Global Equity Research 04 January 2010
Imran Khan (1-212) 622-6693 [email protected]
Valuation and Ratings Analysis We believe GOOG shares are fundamentally attractive due to secular industry growth trends, improving fundamentals in the international market, and expansion of new product categories such as contextual ads and local search. Google trades at 14x its F’10E EBITDA vs. its large-cap internet peers at 14x. Given Google’s higher growth rate, we think it deserves a premium; hence, our OW rating.
Risks to Our Rating Google has experienced very fast revenue growth over the past few years. Our Overweight rating is based on the assumption that Google will continue to be the market leader in the paid search space and will continue to enjoy strong revenue growth. If the content publishers like Yahoo! and Microsoft are able to gain market share through user defection from Google’s user base, then our rating could be too optimistic. However, we have not seen any trends that would support this argument thus far.
Our Overweight rating is also predicated on the company’s success in the international market. If the company cannot successfully build out a larger international advertising base, the company will not be able to increase its monetization rate abroad. Additionally, as Google continues to expand its business internationally, it may face regulatory hurdles that make the business climate less hospitable and potentially less profitable than the markets where it currently operates.
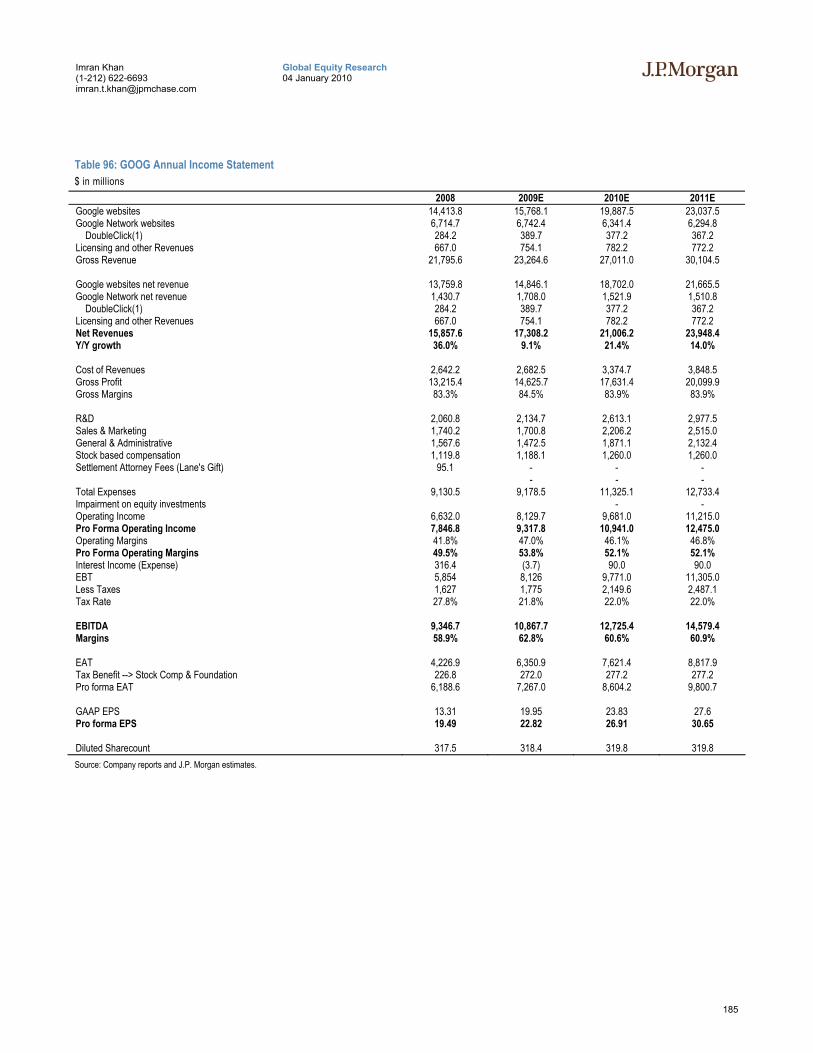
185
Global Equity Research 04 January 2010
Imran Khan (1-212) 622-6693 [email protected]
Table 96: GOOG Annual Income Statement $ in millions
2008 2009E 2010E 2011E Google websites 14,413.8 15,768.1 19,887.5 23,037.5 Google Network websites 6,714.7 6,742.4 6,341.4 6,294.8 DoubleClick(1) 284.2 389.7 377.2 367.2 Licensing and other Revenues 667.0 754.1 782.2 772.2 Gross Revenue 21,795.6 23,264.6 27,011.0 30,104.5 Google websites net revenue 13,759.8 14,846.1 18,702.0 21,665.5 Google Network net revenue 1,430.7 1,708.0 1,521.9 1,510.8 DoubleClick(1) 284.2 389.7 377.2 367.2 Licensing and other Revenues 667.0 754.1 782.2 772.2 Net Revenues 15,857.6 17,308.2 21,006.2 23,948.4 Y/Y growth 36.0% 9.1% 21.4% 14.0% Cost of Revenues 2,642.2 2,682.5 3,374.7 3,848.5 Gross Profit 13,215.4 14,625.7 17,631.4 20,099.9 Gross Margins 83.3% 84.5% 83.9% 83.9% R&D 2,060.8 2,134.7 2,613.1 2,977.5 Sales & Marketing 1,740.2 1,700.8 2,206.2 2,515.0 General & Administrative 1,567.6 1,472.5 1,871.1 2,132.4 Stock based compensation 1,119.8 1,188.1 1,260.0 1,260.0 Settlement Attorney Fees (Lane's Gift) 95.1 - - - - - - Total Expenses 9,130.5 9,178.5 11,325.1 12,733.4 Impairment on equity investments - - Operating Income 6,632.0 8,129.7 9,681.0 11,215.0 Pro Forma Operating Income 7,846.8 9,317.8 10,941.0 12,475.0 Operating Margins 41.8% 47.0% 46.1% 46.8% Pro Forma Operating Margins 49.5% 53.8% 52.1% 52.1% Interest Income (Expense) 316.4 (3.7) 90.0 90.0 EBT 5,854 8,126 9,771.0 11,305.0 Less Taxes 1,627 1,775 2,149.6 2,487.1 Tax Rate 27.8% 21.8% 22.0% 22.0% EBITDA 9,346.7 10,867.7 12,725.4 14,579.4 Margins 58.9% 62.8% 60.6% 60.9% EAT 4,226.9 6,350.9 7,621.4 8,817.9 Tax Benefit --> Stock Comp & Foundation 226.8 272.0 277.2 277.2 Pro forma EAT 6,188.6 7,267.0 8,604.2 9,800.7 GAAP EPS 13.31 19.95 23.83 27.6 Pro forma EPS 19.49 22.82 26.91 30.65 Diluted Sharecount 317.5 318.4 319.8 319.8 Source: Company reports and J.P. Morgan estimates.
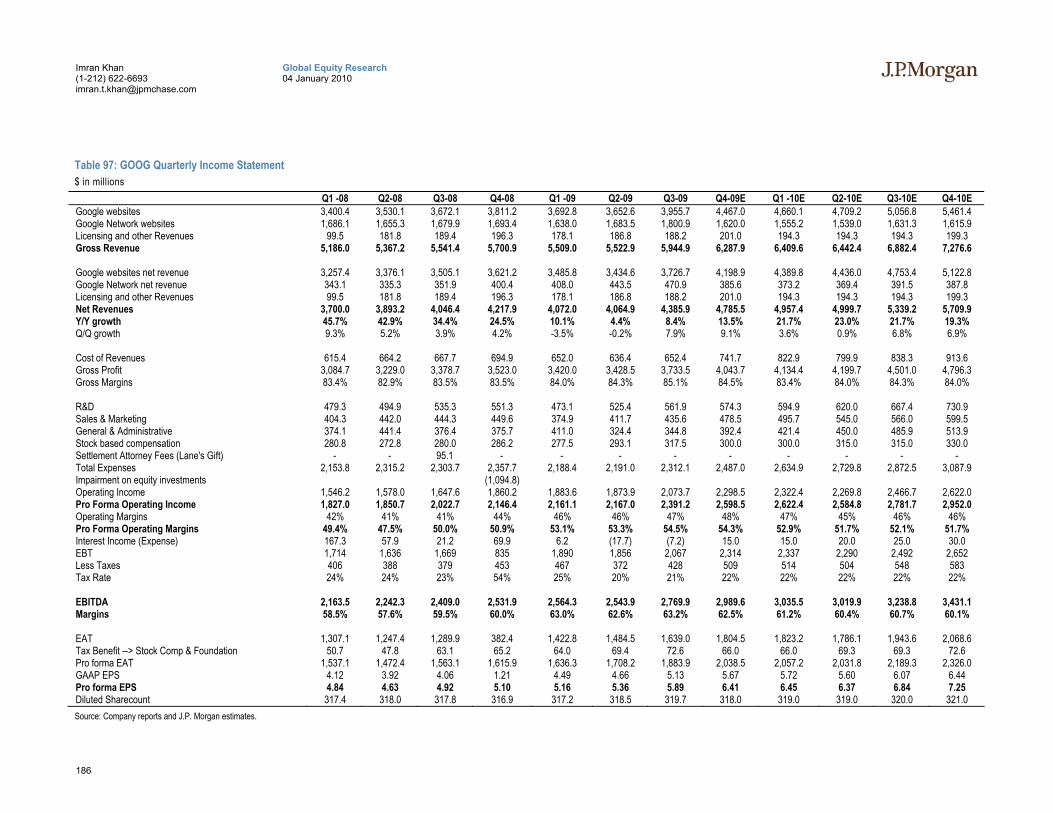
186
Global Equity Research 04 January 2010
Imran Khan (1-212) 622-6693 [email protected]
Table 97: GOOG Quarterly Income Statement $ in millions
Q1 -08 Q2-08 Q3-08 Q4-08 Q1 -09 Q2-09 Q3-09 Q4-09E Q1 -10E Q2-10E Q3-10E Q4-10E Google websites 3,400.4 3,530.1 3,672.1 3,811.2 3,692.8 3,652.6 3,955.7 4,467.0 4,660.1 4,709.2 5,056.8 5,461.4 Google Network websites 1,686.1 1,655.3 1,679.9 1,693.4 1,638.0 1,683.5 1,800.9 1,620.0 1,555.2 1,539.0 1,631.3 1,615.9 Licensing and other Revenues 99.5 181.8 189.4 196.3 178.1 186.8 188.2 201.0 194.3 194.3 194.3 199.3 Gross Revenue 5,186.0 5,367.2 5,541.4 5,700.9 5,509.0 5,522.9 5,944.9 6,287.9 6,409.6 6,442.4 6,882.4 7,276.6 Google websites net revenue 3,257.4 3,376.1 3,505.1 3,621.2 3,485.8 3,434.6 3,726.7 4,198.9 4,389.8 4,436.0 4,753.4 5,122.8 Google Network net revenue 343.1 335.3 351.9 400.4 408.0 443.5 470.9 385.6 373.2 369.4 391.5 387.8 Licensing and other Revenues 99.5 181.8 189.4 196.3 178.1 186.8 188.2 201.0 194.3 194.3 194.3 199.3 Net Revenues 3,700.0 3,893.2 4,046.4 4,217.9 4,072.0 4,064.9 4,385.9 4,785.5 4,957.4 4,999.7 5,339.2 5,709.9 Y/Y growth 45.7% 42.9% 34.4% 24.5% 10.1% 4.4% 8.4% 13.5% 21.7% 23.0% 21.7% 19.3% Q/Q growth 9.3% 5.2% 3.9% 4.2% -3.5% -0.2% 7.9% 9.1% 3.6% 0.9% 6.8% 6.9% Cost of Revenues 615.4 664.2 667.7 694.9 652.0 636.4 652.4 741.7 822.9 799.9 838.3 913.6 Gross Profit 3,084.7 3,229.0 3,378.7 3,523.0 3,420.0 3,428.5 3,733.5 4,043.7 4,134.4 4,199.7 4,501.0 4,796.3 Gross Margins 83.4% 82.9% 83.5% 83.5% 84.0% 84.3% 85.1% 84.5% 83.4% 84.0% 84.3% 84.0% R&D 479.3 494.9 535.3 551.3 473.1 525.4 561.9 574.3 594.9 620.0 667.4 730.9 Sales & Marketing 404.3 442.0 444.3 449.6 374.9 411.7 435.6 478.5 495.7 545.0 566.0 599.5 General & Administrative 374.1 441.4 376.4 375.7 411.0 324.4 344.8 392.4 421.4 450.0 485.9 513.9 Stock based compensation 280.8 272.8 280.0 286.2 277.5 293.1 317.5 300.0 300.0 315.0 315.0 330.0 Settlement Attorney Fees (Lane's Gift) - - 95.1 - - - - - - - - - Total Expenses 2,153.8 2,315.2 2,303.7 2,357.7 2,188.4 2,191.0 2,312.1 2,487.0 2,634.9 2,729.8 2,872.5 3,087.9 Impairment on equity investments (1,094.8) Operating Income 1,546.2 1,578.0 1,647.6 1,860.2 1,883.6 1,873.9 2,073.7 2,298.5 2,322.4 2,269.8 2,466.7 2,622.0 Pro Forma Operating Income 1,827.0 1,850.7 2,022.7 2,146.4 2,161.1 2,167.0 2,391.2 2,598.5 2,622.4 2,584.8 2,781.7 2,952.0 Operating Margins 42% 41% 41% 44% 46% 46% 47% 48% 47% 45% 46% 46% Pro Forma Operating Margins 49.4% 47.5% 50.0% 50.9% 53.1% 53.3% 54.5% 54.3% 52.9% 51.7% 52.1% 51.7% Interest Income (Expense) 167.3 57.9 21.2 69.9 6.2 (17.7) (7.2) 15.0 15.0 20.0 25.0 30.0 EBT 1,714 1,636 1,669 835 1,890 1,856 2,067 2,314 2,337 2,290 2,492 2,652 Less Taxes 406 388 379 453 467 372 428 509 514 504 548 583 Tax Rate 24% 24% 23% 54% 25% 20% 21% 22% 22% 22% 22% 22% EBITDA 2,163.5 2,242.3 2,409.0 2,531.9 2,564.3 2,543.9 2,769.9 2,989.6 3,035.5 3,019.9 3,238.8 3,431.1 Margins 58.5% 57.6% 59.5% 60.0% 63.0% 62.6% 63.2% 62.5% 61.2% 60.4% 60.7% 60.1% EAT 1,307.1 1,247.4 1,289.9 382.4 1,422.8 1,484.5 1,639.0 1,804.5 1,823.2 1,786.1 1,943.6 2,068.6 Tax Benefit --> Stock Comp & Foundation 50.7 47.8 63.1 65.2 64.0 69.4 72.6 66.0 66.0 69.3 69.3 72.6 Pro forma EAT 1,537.1 1,472.4 1,563.1 1,615.9 1,636.3 1,708.2 1,883.9 2,038.5 2,057.2 2,031.8 2,189.3 2,326.0 GAAP EPS 4.12 3.92 4.06 1.21 4.49 4.66 5.13 5.67 5.72 5.60 6.07 6.44 Pro forma EPS 4.84 4.63 4.92 5.10 5.16 5.36 5.89 6.41 6.45 6.37 6.84 7.25 Diluted Sharecount 317.4 318.0 317.8 316.9 317.2 318.5 319.7 318.0 319.0 319.0 320.0 321.0 Source: Company reports and J.P. Morgan estimates.
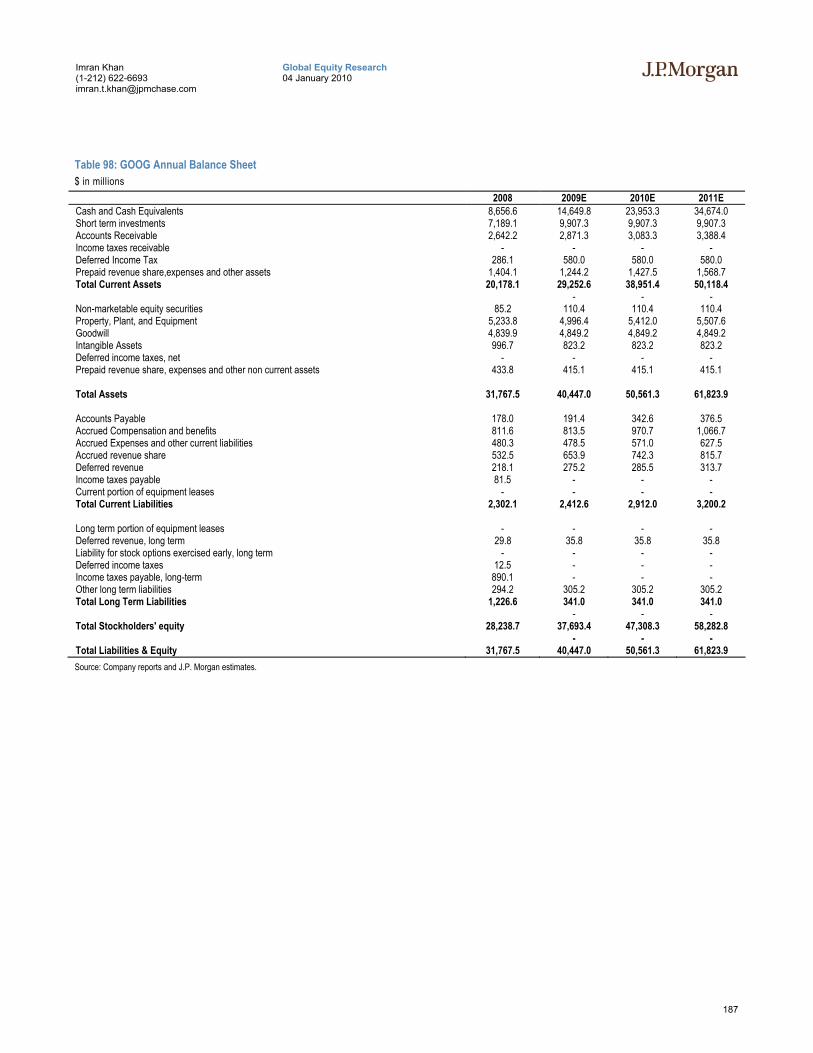
187
Global Equity Research 04 January 2010
Imran Khan (1-212) 622-6693 [email protected]
Table 98: GOOG Annual Balance Sheet $ in millions
2008 2009E 2010E 2011E Cash and Cash Equivalents 8,656.6 14,649.8 23,953.3 34,674.0 Short term investments 7,189.1 9,907.3 9,907.3 9,907.3 Accounts Receivable 2,642.2 2,871.3 3,083.3 3,388.4 Income taxes receivable - - - - Deferred Income Tax 286.1 580.0 580.0 580.0 Prepaid revenue share,expenses and other assets 1,404.1 1,244.2 1,427.5 1,568.7 Total Current Assets 20,178.1 29,252.6 38,951.4 50,118.4 - - - Non-marketable equity securities 85.2 110.4 110.4 110.4 Property, Plant, and Equipment 5,233.8 4,996.4 5,412.0 5,507.6 Goodwill 4,839.9 4,849.2 4,849.2 4,849.2 Intangible Assets 996.7 823.2 823.2 823.2 Deferred income taxes, net - - - - Prepaid revenue share, expenses and other non current assets 433.8 415.1 415.1 415.1 Total Assets 31,767.5 40,447.0 50,561.3 61,823.9 Accounts Payable 178.0 191.4 342.6 376.5 Accrued Compensation and benefits 811.6 813.5 970.7 1,066.7 Accrued Expenses and other current liabilities 480.3 478.5 571.0 627.5 Accrued revenue share 532.5 653.9 742.3 815.7 Deferred revenue 218.1 275.2 285.5 313.7 Income taxes payable 81.5 - - - Current portion of equipment leases - - - - Total Current Liabilities 2,302.1 2,412.6 2,912.0 3,200.2 Long term portion of equipment leases - - - - Deferred revenue, long term 29.8 35.8 35.8 35.8 Liability for stock options exercised early, long term - - - - Deferred income taxes 12.5 - - - Income taxes payable, long-term 890.1 - - - Other long term liabilities 294.2 305.2 305.2 305.2 Total Long Term Liabilities 1,226.6 341.0 341.0 341.0 - - - Total Stockholders' equity 28,238.7 37,693.4 47,308.3 58,282.8 - - - Total Liabilities & Equity 31,767.5 40,447.0 50,561.3 61,823.9 Source: Company reports and J.P. Morgan estimates.
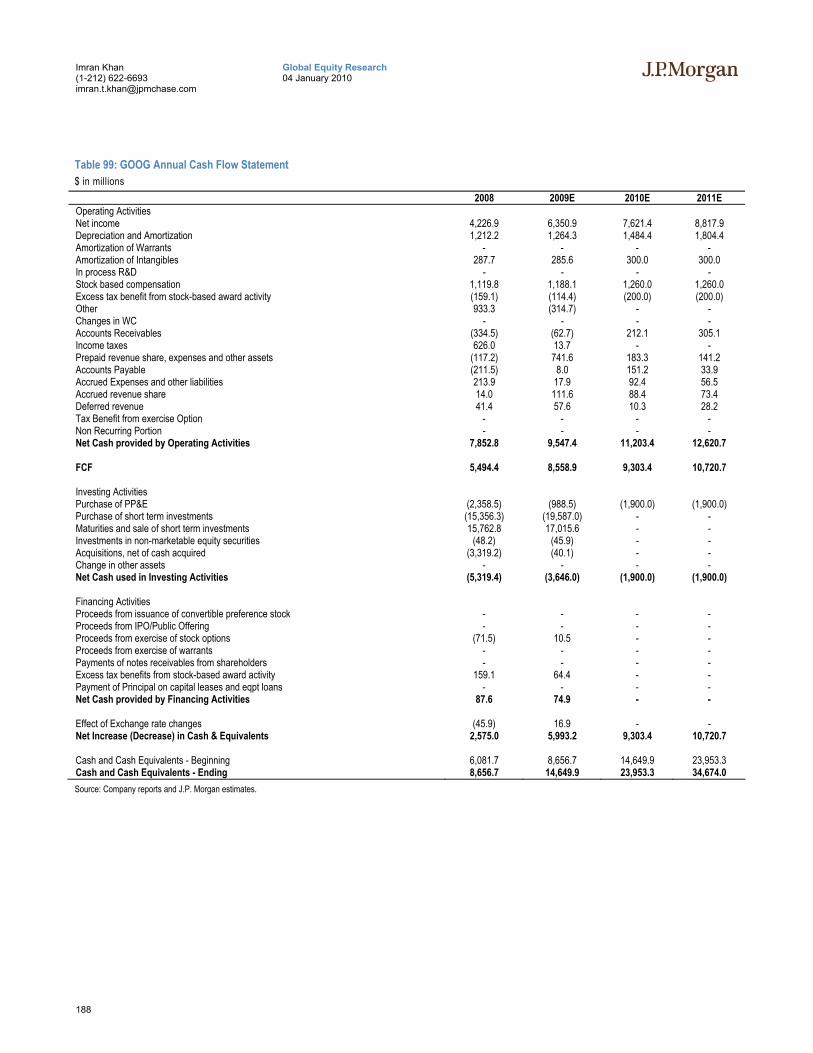
188
Global Equity Research 04 January 2010
Imran Khan (1-212) 622-6693 [email protected]
Table 99: GOOG Annual Cash Flow Statement $ in millions
2008 2009E 2010E 2011E Operating Activities Net income 4,226.9 6,350.9 7,621.4 8,817.9 Depreciation and Amortization 1,212.2 1,264.3 1,484.4 1,804.4 Amortization of Warrants - - - - Amortization of Intangibles 287.7 285.6 300.0 300.0 In process R&D - - - - Stock based compensation 1,119.8 1,188.1 1,260.0 1,260.0 Excess tax benefit from stock-based award activity (159.1) (114.4) (200.0) (200.0) Other 933.3 (314.7) - - Changes in WC - - - - Accounts Receivables (334.5) (62.7) 212.1 305.1 Income taxes 626.0 13.7 - - Prepaid revenue share, expenses and other assets (117.2) 741.6 183.3 141.2 Accounts Payable (211.5) 8.0 151.2 33.9 Accrued Expenses and other liabilities 213.9 17.9 92.4 56.5 Accrued revenue share 14.0 111.6 88.4 73.4 Deferred revenue 41.4 57.6 10.3 28.2 Tax Benefit from exercise Option - - - - Non Recurring Portion - - - - Net Cash provided by Operating Activities 7,852.8 9,547.4 11,203.4 12,620.7 FCF 5,494.4 8,558.9 9,303.4 10,720.7 Investing Activities Purchase of PP&E (2,358.5) (988.5) (1,900.0) (1,900.0) Purchase of short term investments (15,356.3) (19,587.0) - - Maturities and sale of short term investments 15,762.8 17,015.6 - - Investments in non-marketable equity securities (48.2) (45.9) - - Acquisitions, net of cash acquired (3,319.2) (40.1) - - Change in other assets - - - - Net Cash used in Investing Activities (5,319.4) (3,646.0) (1,900.0) (1,900.0) Financing Activities Proceeds from issuance of convertible preference stock - - - - Proceeds from IPO/Public Offering - - - - Proceeds from exercise of stock options (71.5) 10.5 - - Proceeds from exercise of warrants - - - - Payments of notes receivables from shareholders - - - - Excess tax benefits from stock-based award activity 159.1 64.4 - - Payment of Principal on capital leases and eqpt loans - - - - Net Cash provided by Financing Activities 87.6 74.9 - - Effect of Exchange rate changes (45.9) 16.9 - - Net Increase (Decrease) in Cash & Equivalents 2,575.0 5,993.2 9,303.4 10,720.7 Cash and Cash Equivalents - Beginning 6,081.7 8,656.7 14,649.9 23,953.3 Cash and Cash Equivalents - Ending 8,656.7 14,649.9 23,953.3 34,674.0 Source: Company reports and J.P. Morgan estimates.
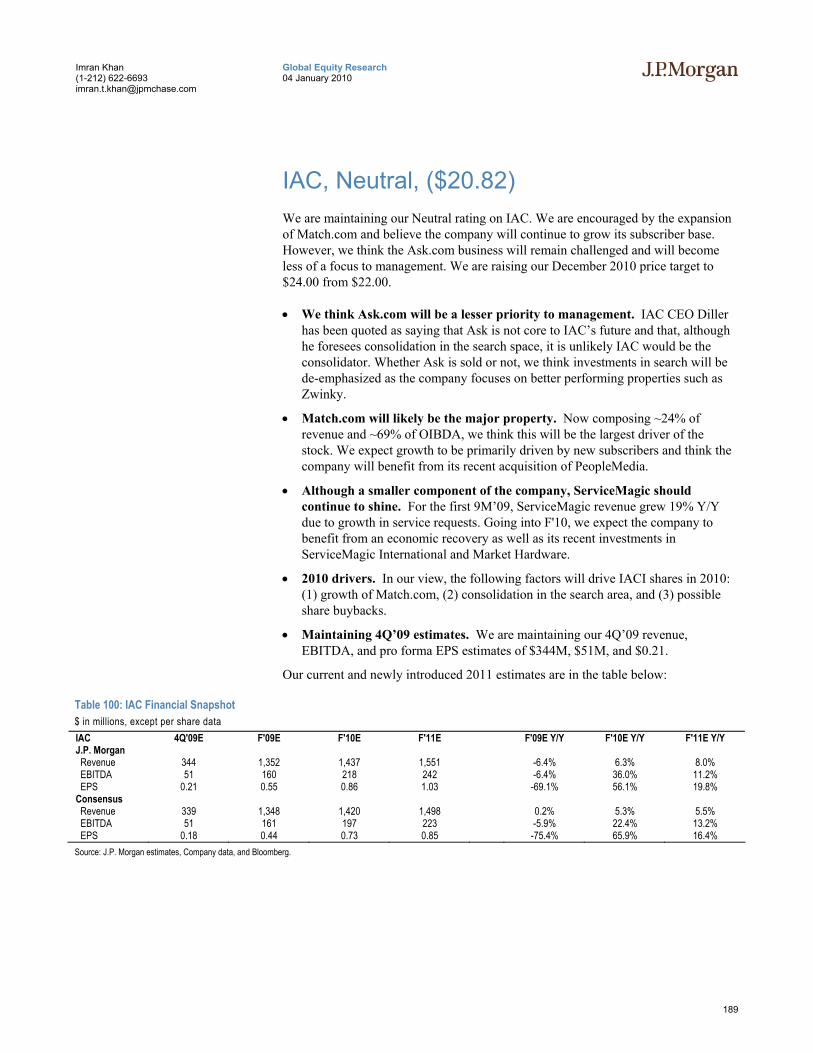
189
Global Equity Research 04 January 2010
Imran Khan (1-212) 622-6693 [email protected]
IAC, Neutral, ($20.82) We are maintaining our Neutral rating on IAC. We are encouraged by the expansion of Match.com and believe the company will continue to grow its subscriber base. However, we think the Ask.com business will remain challenged and will become less of a focus to management. We are raising our December 2010 price target to $24.00 from $22.00.
• We think Ask.com will be a lesser priority to management. IAC CEO Diller has been quoted as saying that Ask is not core to IAC’s future and that, although he foresees consolidation in the search space, it is unlikely IAC would be the consolidator. Whether Ask is sold or not, we think investments in search will be de-emphasized as the company focuses on better performing properties such as Zwinky.
• Match.com will likely be the major property. Now composing ~24% of revenue and ~69% of OIBDA, we think this will be the largest driver of the stock. We expect growth to be primarily driven by new subscribers and think the company will benefit from its recent acquisition of PeopleMedia.
• Although a smaller component of the company, ServiceMagic should continue to shine. For the first 9M’09, ServiceMagic revenue grew 19% Y/Y due to growth in service requests. Going into F'10, we expect the company to benefit from an economic recovery as well as its recent investments in ServiceMagic International and Market Hardware.
• 2010 drivers. In our view, the following factors will drive IACI shares in 2010: (1) growth of Match.com, (2) consolidation in the search area, and (3) possible share buybacks.
• Maintaining 4Q’09 estimates. We are maintaining our 4Q’09 revenue, EBITDA, and pro forma EPS estimates of $344M, $51M, and $0.21.
Our current and newly introduced 2011 estimates are in the table below:
Table 100: IAC Financial Snapshot $ in millions, except per share data IAC 4Q'09E F'09E F'10E F'11E F'09E Y/Y F'10E Y/Y F'11E Y/Y J.P. Morgan Revenue 344 1,352 1,437 1,551 -6.4% 6.3% 8.0% EBITDA 51 160 218 242 -6.4% 36.0% 11.2% EPS 0.21 0.55 0.86 1.03 -69.1% 56.1% 19.8% Consensus Revenue 339 1,348 1,420 1,498 0.2% 5.3% 5.5% EBITDA 51 161 197 223 -5.9% 22.4% 13.2% EPS 0.18 0.44 0.73 0.85 -75.4% 65.9% 16.4% Source: J.P. Morgan estimates, Company data, and Bloomberg.
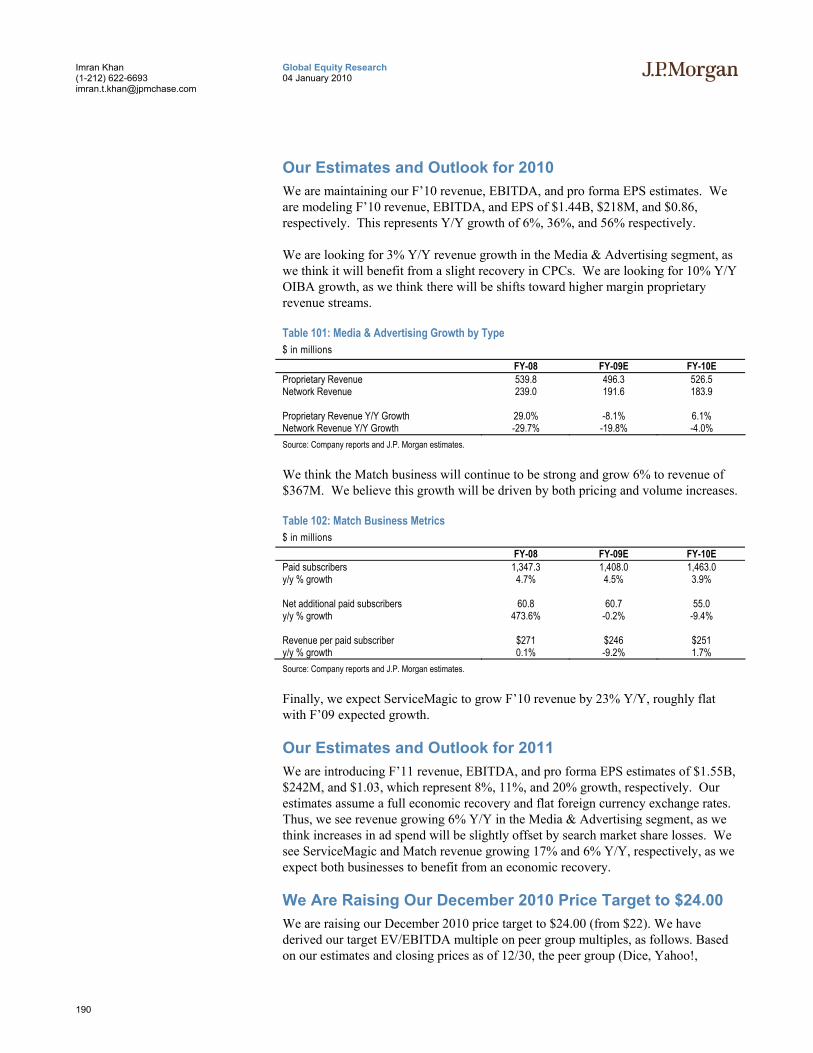
190
Global Equity Research 04 January 2010
Imran Khan (1-212) 622-6693 [email protected]
Our Estimates and Outlook for 2010 We are maintaining our F’10 revenue, EBITDA, and pro forma EPS estimates. We are modeling F’10 revenue, EBITDA, and EPS of $1.44B, $218M, and $0.86, respectively. This represents Y/Y growth of 6%, 36%, and 56% respectively.
We are looking for 3% Y/Y revenue growth in the Media & Advertising segment, as we think it will benefit from a slight recovery in CPCs. We are looking for 10% Y/Y OIBA growth, as we think there will be shifts toward higher margin proprietary revenue streams.
Table 101: Media & Advertising Growth by Type $ in millions
FY-08 FY-09E FY-10E Proprietary Revenue 539.8 496.3 526.5 Network Revenue 239.0 191.6 183.9
Proprietary Revenue Y/Y Growth 29.0% -8.1% 6.1% Network Revenue Y/Y Growth -29.7% -19.8% -4.0% Source: Company reports and J.P. Morgan estimates.
We think the Match business will continue to be strong and grow 6% to revenue of $367M. We believe this growth will be driven by both pricing and volume increases.
Table 102: Match Business Metrics $ in millions
FY-08 FY-09E FY-10E Paid subscribers 1,347.3 1,408.0 1,463.0 y/y % growth 4.7% 4.5% 3.9% Net additional paid subscribers 60.8 60.7 55.0 y/y % growth 473.6% -0.2% -9.4% Revenue per paid subscriber $271 $246 $251 y/y % growth 0.1% -9.2% 1.7% Source: Company reports and J.P. Morgan estimates.
Finally, we expect ServiceMagic to grow F’10 revenue by 23% Y/Y, roughly flat with F’09 expected growth.
Our Estimates and Outlook for 2011 We are introducing F’11 revenue, EBITDA, and pro forma EPS estimates of $1.55B, $242M, and $1.03, which represent 8%, 11%, and 20% growth, respectively. Our estimates assume a full economic recovery and flat foreign currency exchange rates. Thus, we see revenue growing 6% Y/Y in the Media & Advertising segment, as we think increases in ad spend will be slightly offset by search market share losses. We see ServiceMagic and Match revenue growing 17% and 6% Y/Y, respectively, as we expect both businesses to benefit from an economic recovery.
We Are Raising Our December 2010 Price Target to $24.00 We are raising our December 2010 price target to $24.00 (from $22). We have derived our target EV/EBITDA multiple on peer group multiples, as follows. Based on our estimates and closing prices as of 12/30, the peer group (Dice, Yahoo!,
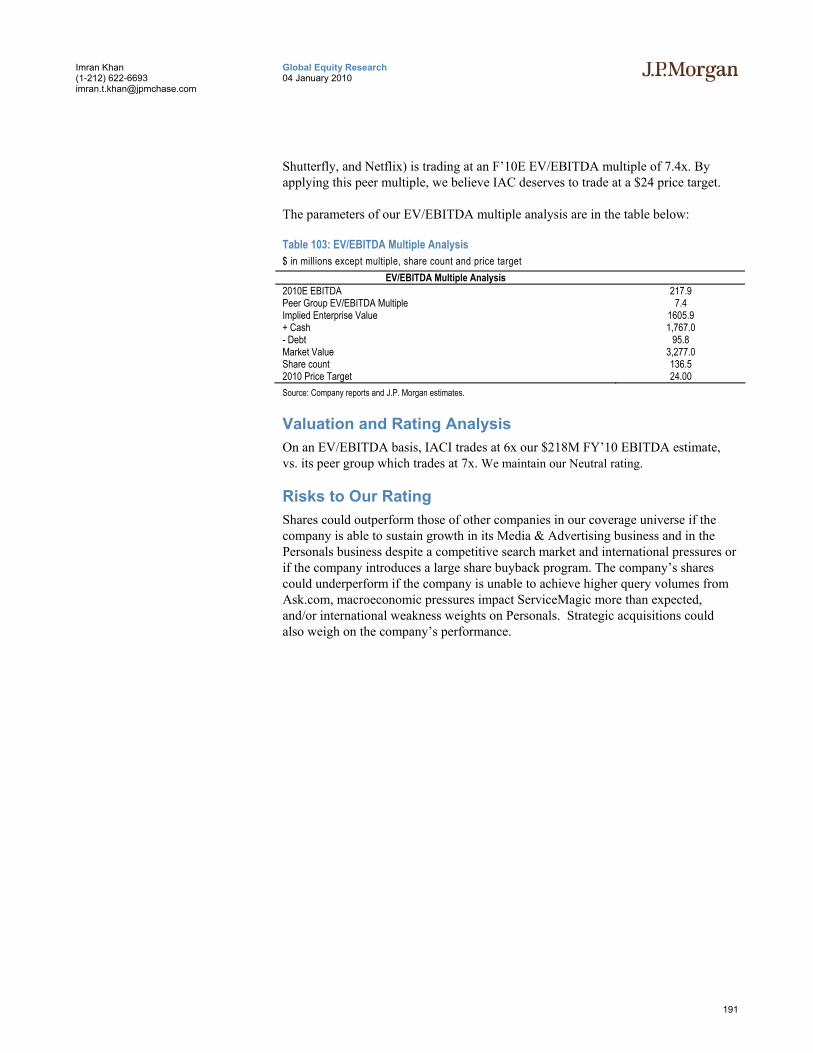
191
Global Equity Research 04 January 2010
Imran Khan (1-212) 622-6693 [email protected]
Shutterfly, and Netflix) is trading at an F’10E EV/EBITDA multiple of 7.4x. By applying this peer multiple, we believe IAC deserves to trade at a $24 price target.
The parameters of our EV/EBITDA multiple analysis are in the table below:
Table 103: EV/EBITDA Multiple Analysis $ in millions except multiple, share count and price target
EV/EBITDA Multiple Analysis 2010E EBITDA 217.9 Peer Group EV/EBITDA Multiple 7.4 Implied Enterprise Value 1605.9 + Cash 1,767.0 - Debt 95.8 Market Value 3,277.0 Share count 136.5 2010 Price Target 24.00 Source: Company reports and J.P. Morgan estimates.
Valuation and Rating Analysis On an EV/EBITDA basis, IACI trades at 6x our $218M FY’10 EBITDA estimate, vs. its peer group which trades at 7x. We maintain our Neutral rating.
Risks to Our Rating Shares could outperform those of other companies in our coverage universe if the company is able to sustain growth in its Media & Advertising business and in the Personals business despite a competitive search market and international pressures or if the company introduces a large share buyback program. The company’s shares could underperform if the company is unable to achieve higher query volumes from Ask.com, macroeconomic pressures impact ServiceMagic more than expected, and/or international weakness weights on Personals. Strategic acquisitions could also weigh on the company’s performance.
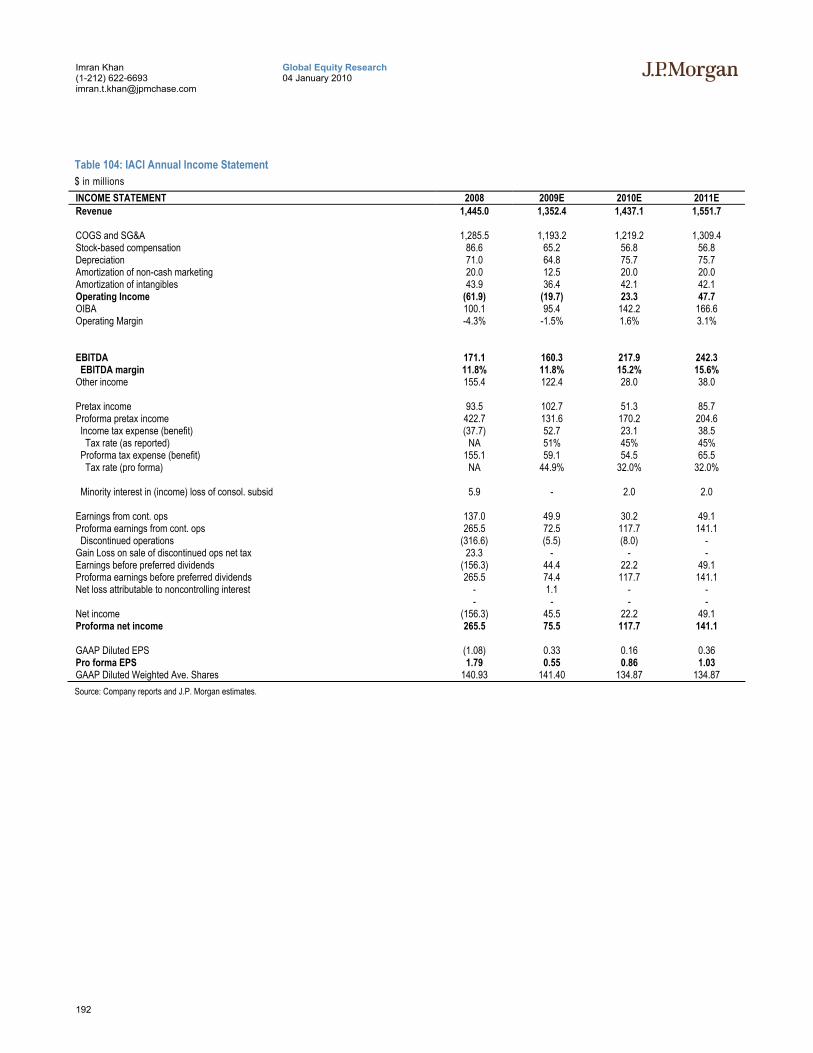
192
Global Equity Research 04 January 2010
Imran Khan (1-212) 622-6693 [email protected]
Table 104: IACI Annual Income Statement $ in millions INCOME STATEMENT 2008 2009E 2010E 2011E Revenue 1,445.0 1,352.4 1,437.1 1,551.7 COGS and SG&A 1,285.5 1,193.2 1,219.2 1,309.4 Stock-based compensation 86.6 65.2 56.8 56.8 Depreciation 71.0 64.8 75.7 75.7 Amortization of non-cash marketing 20.0 12.5 20.0 20.0 Amortization of intangibles 43.9 36.4 42.1 42.1 Operating Income (61.9) (19.7) 23.3 47.7 OIBA 100.1 95.4 142.2 166.6 Operating Margin -4.3% -1.5% 1.6% 3.1% EBITDA 171.1 160.3 217.9 242.3 EBITDA margin 11.8% 11.8% 15.2% 15.6% Other income 155.4 122.4 28.0 38.0 Pretax income 93.5 102.7 51.3 85.7 Proforma pretax income 422.7 131.6 170.2 204.6 Income tax expense (benefit) (37.7) 52.7 23.1 38.5 Tax rate (as reported) NA 51% 45% 45% Proforma tax expense (benefit) 155.1 59.1 54.5 65.5 Tax rate (pro forma) NA 44.9% 32.0% 32.0% Minority interest in (income) loss of consol. subsid 5.9 - 2.0 2.0 Earnings from cont. ops 137.0 49.9 30.2 49.1 Proforma earnings from cont. ops 265.5 72.5 117.7 141.1 Discontinued operations (316.6) (5.5) (8.0) - Gain Loss on sale of discontinued ops net tax 23.3 - - - Earnings before preferred dividends (156.3) 44.4 22.2 49.1 Proforma earnings before preferred dividends 265.5 74.4 117.7 141.1 Net loss attributable to noncontrolling interest - 1.1 - - - - - - Net income (156.3) 45.5 22.2 49.1 Proforma net income 265.5 75.5 117.7 141.1 GAAP Diluted EPS (1.08) 0.33 0.16 0.36 Pro forma EPS 1.79 0.55 0.86 1.03 GAAP Diluted Weighted Ave. Shares 140.93 141.40 134.87 134.87 Source: Company reports and J.P. Morgan estimates.
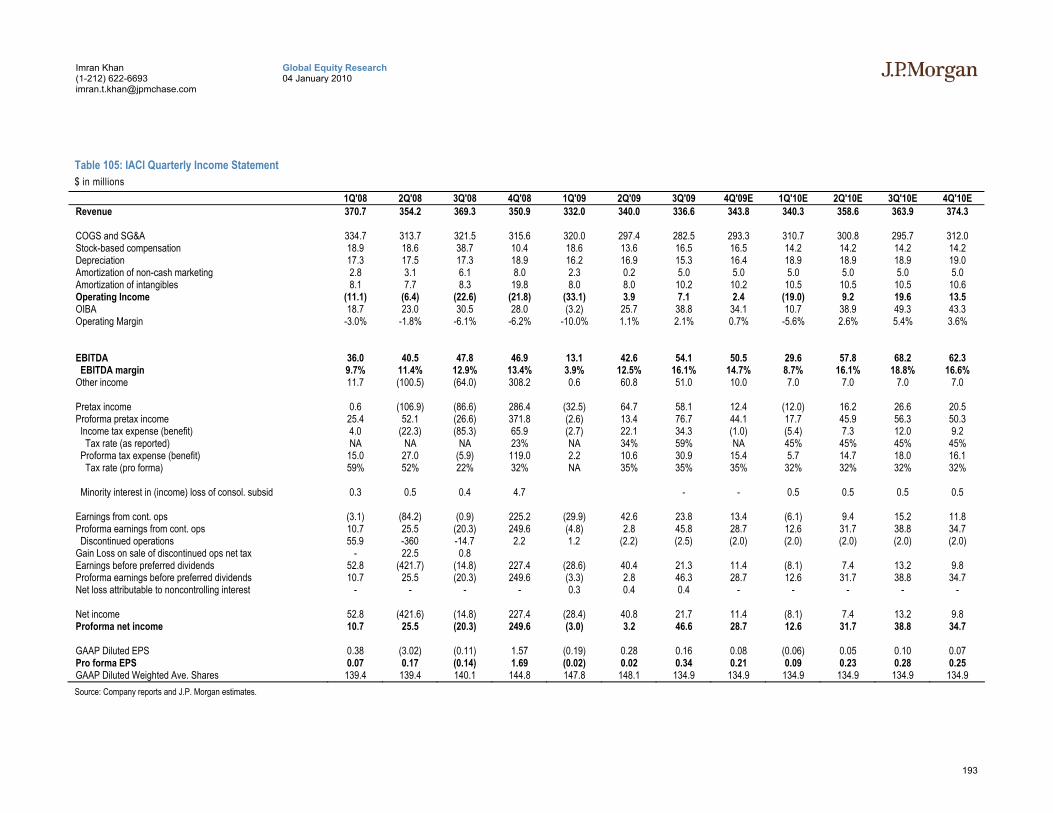
193
Global Equity Research 04 January 2010
Imran Khan (1-212) 622-6693 [email protected]
Table 105: IACI Quarterly Income Statement $ in millions
1Q'08 2Q'08 3Q'08 4Q'08 1Q'09 2Q'09 3Q'09 4Q'09E 1Q'10E 2Q'10E 3Q'10E 4Q'10E Revenue 370.7 354.2 369.3 350.9 332.0 340.0 336.6 343.8 340.3 358.6 363.9 374.3 COGS and SG&A 334.7 313.7 321.5 315.6 320.0 297.4 282.5 293.3 310.7 300.8 295.7 312.0 Stock-based compensation 18.9 18.6 38.7 10.4 18.6 13.6 16.5 16.5 14.2 14.2 14.2 14.2 Depreciation 17.3 17.5 17.3 18.9 16.2 16.9 15.3 16.4 18.9 18.9 18.9 19.0 Amortization of non-cash marketing 2.8 3.1 6.1 8.0 2.3 0.2 5.0 5.0 5.0 5.0 5.0 5.0 Amortization of intangibles 8.1 7.7 8.3 19.8 8.0 8.0 10.2 10.2 10.5 10.5 10.5 10.6 Operating Income (11.1) (6.4) (22.6) (21.8) (33.1) 3.9 7.1 2.4 (19.0) 9.2 19.6 13.5 OIBA 18.7 23.0 30.5 28.0 (3.2) 25.7 38.8 34.1 10.7 38.9 49.3 43.3 Operating Margin -3.0% -1.8% -6.1% -6.2% -10.0% 1.1% 2.1% 0.7% -5.6% 2.6% 5.4% 3.6% EBITDA 36.0 40.5 47.8 46.9 13.1 42.6 54.1 50.5 29.6 57.8 68.2 62.3 EBITDA margin 9.7% 11.4% 12.9% 13.4% 3.9% 12.5% 16.1% 14.7% 8.7% 16.1% 18.8% 16.6% Other income 11.7 (100.5) (64.0) 308.2 0.6 60.8 51.0 10.0 7.0 7.0 7.0 7.0 Pretax income 0.6 (106.9) (86.6) 286.4 (32.5) 64.7 58.1 12.4 (12.0) 16.2 26.6 20.5 Proforma pretax income 25.4 52.1 (26.6) 371.8 (2.6) 13.4 76.7 44.1 17.7 45.9 56.3 50.3 Income tax expense (benefit) 4.0 (22.3) (85.3) 65.9 (2.7) 22.1 34.3 (1.0) (5.4) 7.3 12.0 9.2 Tax rate (as reported) NA NA NA 23% NA 34% 59% NA 45% 45% 45% 45% Proforma tax expense (benefit) 15.0 27.0 (5.9) 119.0 2.2 10.6 30.9 15.4 5.7 14.7 18.0 16.1 Tax rate (pro forma) 59% 52% 22% 32% NA 35% 35% 35% 32% 32% 32% 32% Minority interest in (income) loss of consol. subsid 0.3 0.5 0.4 4.7 - - 0.5 0.5 0.5 0.5 Earnings from cont. ops (3.1) (84.2) (0.9) 225.2 (29.9) 42.6 23.8 13.4 (6.1) 9.4 15.2 11.8 Proforma earnings from cont. ops 10.7 25.5 (20.3) 249.6 (4.8) 2.8 45.8 28.7 12.6 31.7 38.8 34.7 Discontinued operations 55.9 -360 -14.7 2.2 1.2 (2.2) (2.5) (2.0) (2.0) (2.0) (2.0) (2.0) Gain Loss on sale of discontinued ops net tax - 22.5 0.8 Earnings before preferred dividends 52.8 (421.7) (14.8) 227.4 (28.6) 40.4 21.3 11.4 (8.1) 7.4 13.2 9.8 Proforma earnings before preferred dividends 10.7 25.5 (20.3) 249.6 (3.3) 2.8 46.3 28.7 12.6 31.7 38.8 34.7 Net loss attributable to noncontrolling interest - - - - 0.3 0.4 0.4 - - - - - Net income 52.8 (421.6) (14.8) 227.4 (28.4) 40.8 21.7 11.4 (8.1) 7.4 13.2 9.8 Proforma net income 10.7 25.5 (20.3) 249.6 (3.0) 3.2 46.6 28.7 12.6 31.7 38.8 34.7 GAAP Diluted EPS 0.38 (3.02) (0.11) 1.57 (0.19) 0.28 0.16 0.08 (0.06) 0.05 0.10 0.07 Pro forma EPS 0.07 0.17 (0.14) 1.69 (0.02) 0.02 0.34 0.21 0.09 0.23 0.28 0.25 GAAP Diluted Weighted Ave. Shares 139.4 139.4 140.1 144.8 147.8 148.1 134.9 134.9 134.9 134.9 134.9 134.9 Source: Company reports and J.P. Morgan estimates.
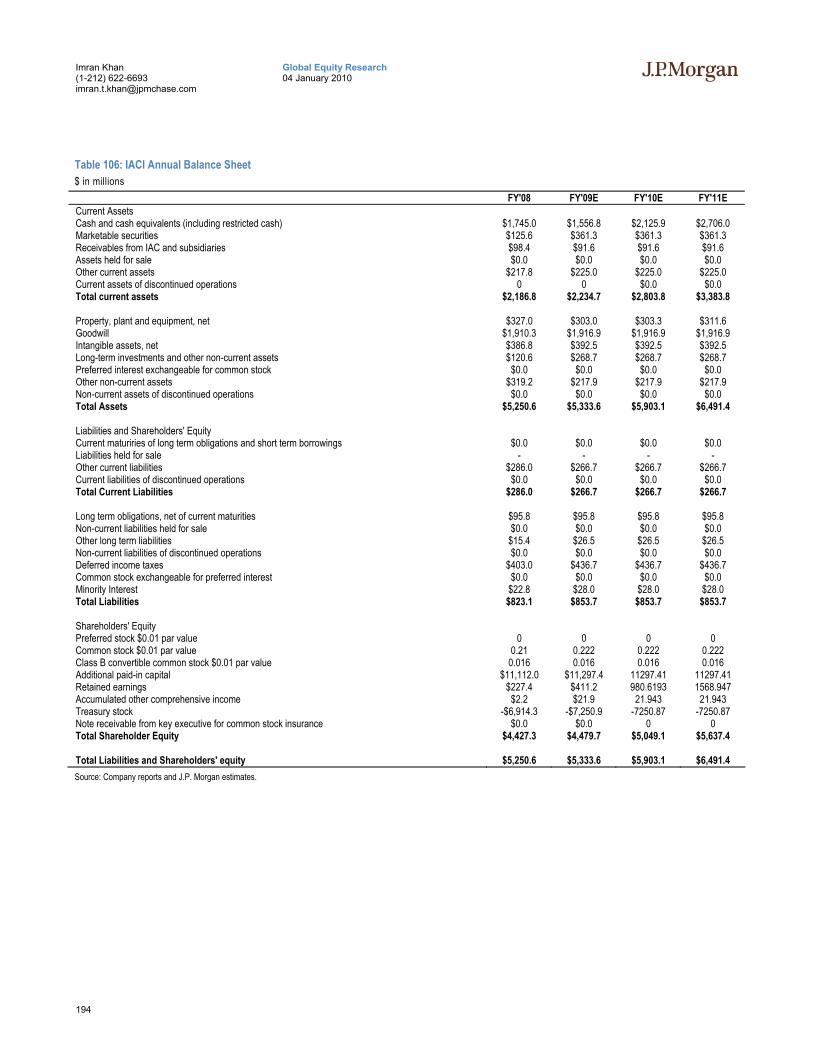
194
Global Equity Research 04 January 2010
Imran Khan (1-212) 622-6693 [email protected]
Table 106: IACI Annual Balance Sheet $ in millions
FY'08 FY'09E FY'10E FY'11E Current Assets Cash and cash equivalents (including restricted cash) $1,745.0 $1,556.8 $2,125.9 $2,706.0 Marketable securities $125.6 $361.3 $361.3 $361.3 Receivables from IAC and subsidiaries $98.4 $91.6 $91.6 $91.6 Assets held for sale $0.0 $0.0 $0.0 $0.0 Other current assets $217.8 $225.0 $225.0 $225.0 Current assets of discontinued operations 0 0 $0.0 $0.0 Total current assets $2,186.8 $2,234.7 $2,803.8 $3,383.8 Property, plant and equipment, net $327.0 $303.0 $303.3 $311.6 Goodwill $1,910.3 $1,916.9 $1,916.9 $1,916.9 Intangible assets, net $386.8 $392.5 $392.5 $392.5 Long-term investments and other non-current assets $120.6 $268.7 $268.7 $268.7 Preferred interest exchangeable for common stock $0.0 $0.0 $0.0 $0.0 Other non-current assets $319.2 $217.9 $217.9 $217.9 Non-current assets of discontinued operations $0.0 $0.0 $0.0 $0.0 Total Assets $5,250.6 $5,333.6 $5,903.1 $6,491.4 Liabilities and Shareholders' Equity Current maturiries of long term obligations and short term borrowings $0.0 $0.0 $0.0 $0.0 Liabilities held for sale - - - - Other current liabilities $286.0 $266.7 $266.7 $266.7 Current liabilities of discontinued operations $0.0 $0.0 $0.0 $0.0 Total Current Liabilities $286.0 $266.7 $266.7 $266.7 Long term obligations, net of current maturities $95.8 $95.8 $95.8 $95.8 Non-current liabilities held for sale $0.0 $0.0 $0.0 $0.0 Other long term liabilities $15.4 $26.5 $26.5 $26.5 Non-current liabilities of discontinued operations $0.0 $0.0 $0.0 $0.0 Deferred income taxes $403.0 $436.7 $436.7 $436.7 Common stock exchangeable for preferred interest $0.0 $0.0 $0.0 $0.0 Minority Interest $22.8 $28.0 $28.0 $28.0 Total Liabilities $823.1 $853.7 $853.7 $853.7 Shareholders' Equity Preferred stock $0.01 par value 0 0 0 0 Common stock $0.01 par value 0.21 0.222 0.222 0.222 Class B convertible common stock $0.01 par value 0.016 0.016 0.016 0.016 Additional paid-in capital $11,112.0 $11,297.4 11297.41 11297.41 Retained earnings $227.4 $411.2 980.6193 1568.947 Accumulated other comprehensive income $2.2 $21.9 21.943 21.943 Treasury stock -$6,914.3 -$7,250.9 -7250.87 -7250.87 Note receivable from key executive for common stock insurance $0.0 $0.0 0 0 Total Shareholder Equity $4,427.3 $4,479.7 $5,049.1 $5,637.4 Total Liabilities and Shareholders' equity $5,250.6 $5,333.6 $5,903.1 $6,491.4 Source: Company reports and J.P. Morgan estimates.
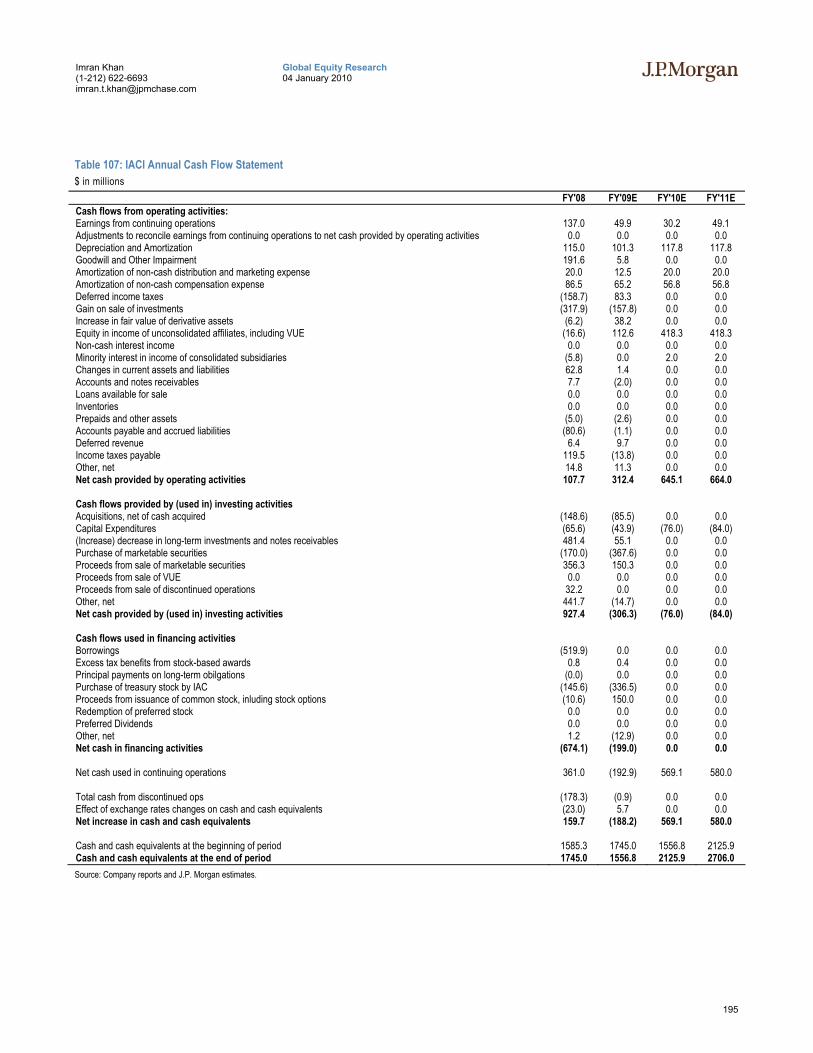
195
Global Equity Research 04 January 2010
Imran Khan (1-212) 622-6693 [email protected]
Table 107: IACI Annual Cash Flow Statement $ in millions
FY'08 FY'09E FY'10E FY'11E Cash flows from operating activities: Earnings from continuing operations 137.0 49.9 30.2 49.1 Adjustments to reconcile earnings from continuing operations to net cash provided by operating activities 0.0 0.0 0.0 0.0 Depreciation and Amortization 115.0 101.3 117.8 117.8 Goodwill and Other Impairment 191.6 5.8 0.0 0.0 Amortization of non-cash distribution and marketing expense 20.0 12.5 20.0 20.0 Amortization of non-cash compensation expense 86.5 65.2 56.8 56.8 Deferred income taxes (158.7) 83.3 0.0 0.0 Gain on sale of investments (317.9) (157.8) 0.0 0.0 Increase in fair value of derivative assets (6.2) 38.2 0.0 0.0 Equity in income of unconsolidated affiliates, including VUE (16.6) 112.6 418.3 418.3 Non-cash interest income 0.0 0.0 0.0 0.0 Minority interest in income of consolidated subsidiaries (5.8) 0.0 2.0 2.0 Changes in current assets and liabilities 62.8 1.4 0.0 0.0 Accounts and notes receivables 7.7 (2.0) 0.0 0.0 Loans available for sale 0.0 0.0 0.0 0.0 Inventories 0.0 0.0 0.0 0.0 Prepaids and other assets (5.0) (2.6) 0.0 0.0 Accounts payable and accrued liabilities (80.6) (1.1) 0.0 0.0 Deferred revenue 6.4 9.7 0.0 0.0 Income taxes payable 119.5 (13.8) 0.0 0.0 Other, net 14.8 11.3 0.0 0.0 Net cash provided by operating activities 107.7 312.4 645.1 664.0 Cash flows provided by (used in) investing activities Acquisitions, net of cash acquired (148.6) (85.5) 0.0 0.0 Capital Expenditures (65.6) (43.9) (76.0) (84.0) (Increase) decrease in long-term investments and notes receivables 481.4 55.1 0.0 0.0 Purchase of marketable securities (170.0) (367.6) 0.0 0.0 Proceeds from sale of marketable securities 356.3 150.3 0.0 0.0 Proceeds from sale of VUE 0.0 0.0 0.0 0.0 Proceeds from sale of discontinued operations 32.2 0.0 0.0 0.0 Other, net 441.7 (14.7) 0.0 0.0 Net cash provided by (used in) investing activities 927.4 (306.3) (76.0) (84.0) Cash flows used in financing activities Borrowings (519.9) 0.0 0.0 0.0 Excess tax benefits from stock-based awards 0.8 0.4 0.0 0.0 Principal payments on long-term obilgations (0.0) 0.0 0.0 0.0 Purchase of treasury stock by IAC (145.6) (336.5) 0.0 0.0 Proceeds from issuance of common stock, inluding stock options (10.6) 150.0 0.0 0.0 Redemption of preferred stock 0.0 0.0 0.0 0.0 Preferred Dividends 0.0 0.0 0.0 0.0 Other, net 1.2 (12.9) 0.0 0.0 Net cash in financing activities (674.1) (199.0) 0.0 0.0 Net cash used in continuing operations 361.0 (192.9) 569.1 580.0 Total cash from discontinued ops (178.3) (0.9) 0.0 0.0 Effect of exchange rates changes on cash and cash equivalents (23.0) 5.7 0.0 0.0 Net increase in cash and cash equivalents 159.7 (188.2) 569.1 580.0 Cash and cash equivalents at the beginning of period 1585.3 1745.0 1556.8 2125.9 Cash and cash equivalents at the end of period 1745.0 1556.8 2125.9 2706.0 Source: Company reports and J.P. Morgan estimates.

196
Global Equity Research 04 January 2010
Imran Khan (1-212) 622-6693 [email protected]
Liberty Interactive, Overweight, ($10.93) We are maintaining our Overweight rating on LINTA, as we believe the company will benefit from an increase in existing customer spending, new customer growth at QVC, and expansion of international and domestic margins. We are raising our December 2010 price target to $14 from $13.
• Existing customer spending will likely recover. Although existing customer retention sits at ~95%, QVC sales slumped in early 2009 as those customers cut back their spending levels. If we look at the period from 4Q’07 – 2Q’08, spending per customer increased 5%, while it fell 3% from 3Q'08 to 2Q'09. We are encouraged to see customer spending already showing signs of recovery, with QVC saying it has experienced the largest Black Friday ever with over $32M in orders, which was a 60% increase Y/Y.
• QVC is driving new customer sales. One of our largest concerns has been about the company attracting a new younger customer base. In 2009, we noticed QVC has added trendier merchandise, including Isaac Mizrahi. We think these merchandising efforts are beginning to pay off, with a 9% increase in the count of new customers joining QVC in 3Q – the highest rate of new customer growth in the last seven years. Total spending of new customers in the quarter increased 18% Y/Y.
• International and domestic OIBDA margins will likely expand in 2010. Both international and domestic margins have benefited from more efficient warehouse operations and freight savings, as well as a reduction in franchise and sales tax expense related to favorable audit settlements in the US and favorable inventory obsolescence provision in the U.K. and Germany. We expect these drivers to continue going forward as well as an added benefit from economies of scale. As such, we are modeling F’10 QVC OIBDA margin of 21.3%, vs. F’09E's 21.0%.
• 2010 drivers. In our view, the following factors will drive LINTA shares in 2010: (1) new customer growth at QVC, (2) cost management, and (3) customer spending.
• Maintaining 4Q’09 estimates. We are maintaining our 4Q’09 revenue, EBITDA, and EPS estimates of $2.48B, $471M, and $0.17. This represents revenue growth of 4% Y/Y and EBITDA growth of 9% Y/Y.
Our current and newly introduced 2011 estimates are in the table below:
Table 108: Liberty Interactive Financial Snapshot $ in millions, except per share data Liberty Interactive 4Q'09E F'09E F'10E F'11E F'09E Y/Y F'10E Y/Y F'11E Y/Y J.P. Morgan Revenue 2,475 8,069 8,515 8,952 -0.1% 5.5% 5.1% EBITDA 471 1,569 1,690 1,792 0.9% 7.7% 6.0% EPS 0.17 0.28 0.71 0.83 -121.3% 154.4% 16.6% Consensus Revenue 2,487 8,089 8,583 8,525 0.1% 6.1% -0.7% EBITDA 465 1,552 1,712 1,785 -0.2% 10.3% 4.3% EPS 0.24 0.35 0.65 0.84 -118.3% 85.7% 29.2% Source: J.P. Morgan estimates, Company data, and Bloomberg.
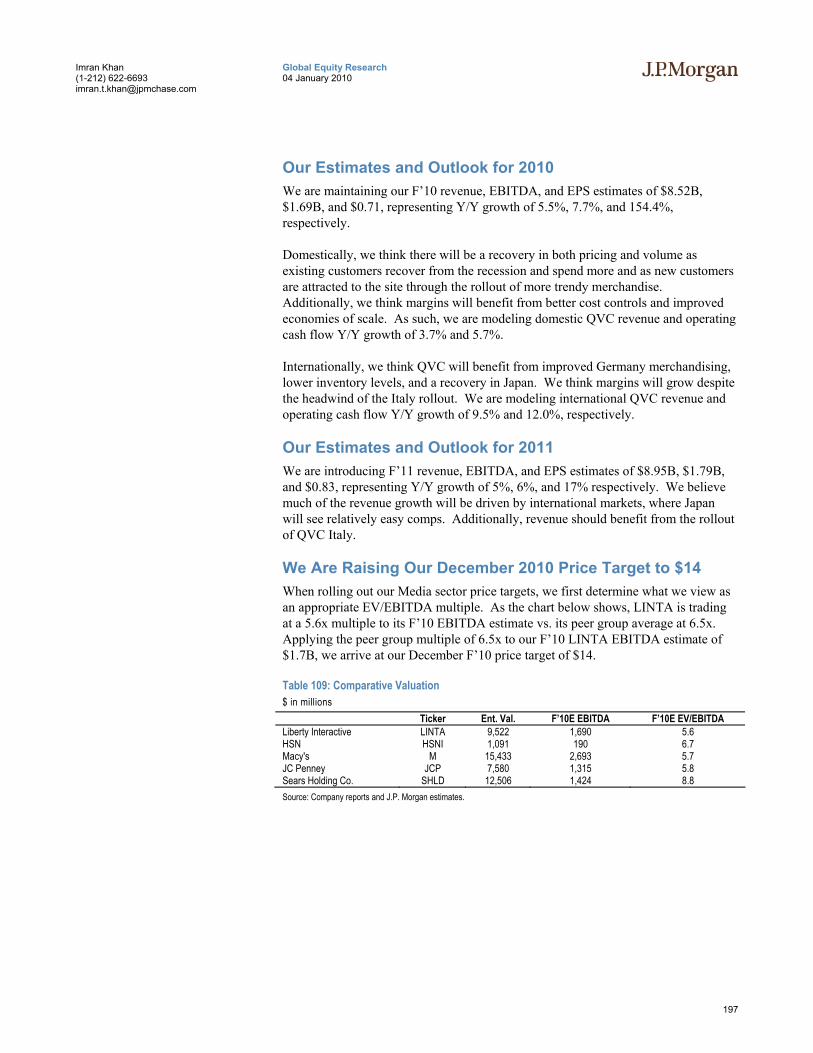
197
Global Equity Research 04 January 2010
Imran Khan (1-212) 622-6693 [email protected]
Our Estimates and Outlook for 2010 We are maintaining our F’10 revenue, EBITDA, and EPS estimates of $8.52B, $1.69B, and $0.71, representing Y/Y growth of 5.5%, 7.7%, and 154.4%, respectively.
Domestically, we think there will be a recovery in both pricing and volume as existing customers recover from the recession and spend more and as new customers are attracted to the site through the rollout of more trendy merchandise. Additionally, we think margins will benefit from better cost controls and improved economies of scale. As such, we are modeling domestic QVC revenue and operating cash flow Y/Y growth of 3.7% and 5.7%.
Internationally, we think QVC will benefit from improved Germany merchandising, lower inventory levels, and a recovery in Japan. We think margins will grow despite the headwind of the Italy rollout. We are modeling international QVC revenue and operating cash flow Y/Y growth of 9.5% and 12.0%, respectively.
Our Estimates and Outlook for 2011 We are introducing F’11 revenue, EBITDA, and EPS estimates of $8.95B, $1.79B, and $0.83, representing Y/Y growth of 5%, 6%, and 17% respectively. We believe much of the revenue growth will be driven by international markets, where Japan will see relatively easy comps. Additionally, revenue should benefit from the rollout of QVC Italy.
We Are Raising Our December 2010 Price Target to $14 When rolling out our Media sector price targets, we first determine what we view as an appropriate EV/EBITDA multiple. As the chart below shows, LINTA is trading at a 5.6x multiple to its F’10 EBITDA estimate vs. its peer group average at 6.5x. Applying the peer group multiple of 6.5x to our F’10 LINTA EBITDA estimate of $1.7B, we arrive at our December F’10 price target of $14.
Table 109: Comparative Valuation $ in millions
Ticker Ent. Val. F’10E EBITDA F’10E EV/EBITDA Liberty Interactive LINTA 9,522 1,690 5.6 HSN HSNI 1,091 190 6.7 Macy's M 15,433 2,693 5.7 JC Penney JCP 7,580 1,315 5.8 Sears Holding Co. SHLD 12,506 1,424 8.8 Source: Company reports and J.P. Morgan estimates.
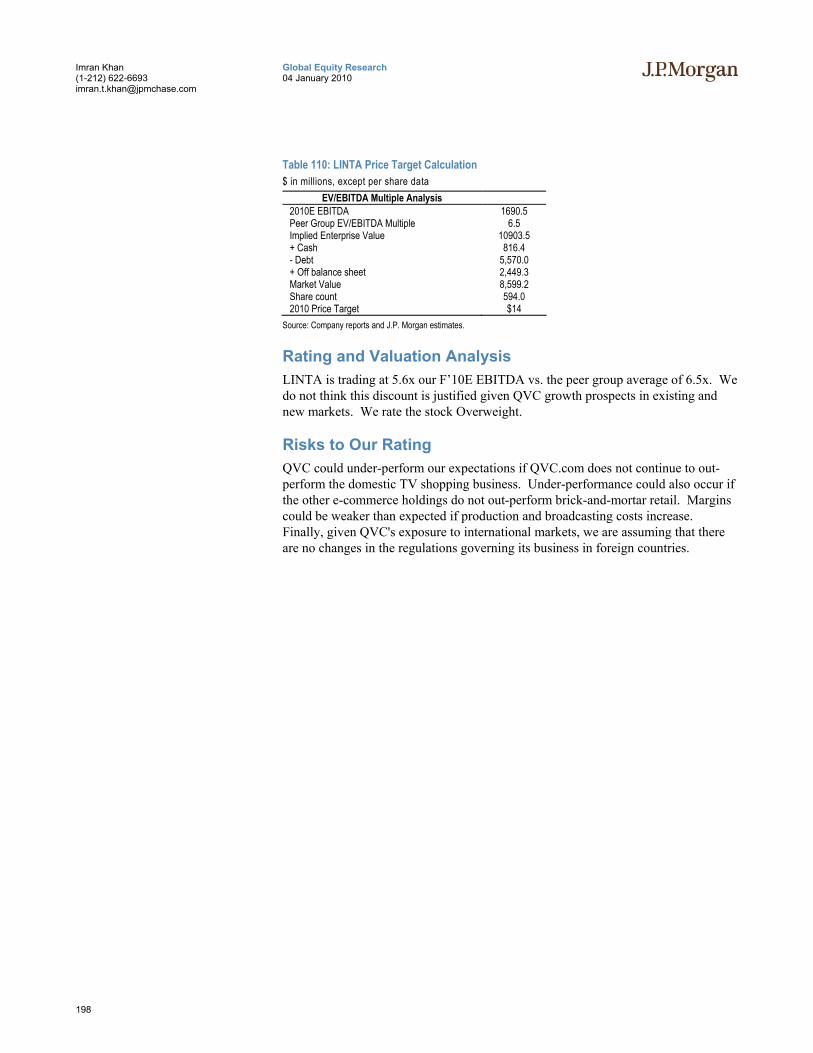
198
Global Equity Research 04 January 2010
Imran Khan (1-212) 622-6693 [email protected]
Table 110: LINTA Price Target Calculation $ in millions, except per share data
EV/EBITDA Multiple Analysis 2010E EBITDA 1690.5 Peer Group EV/EBITDA Multiple 6.5 Implied Enterprise Value 10903.5 + Cash 816.4 - Debt 5,570.0 + Off balance sheet 2,449.3 Market Value 8,599.2 Share count 594.0 2010 Price Target $14
Source: Company reports and J.P. Morgan estimates.
Rating and Valuation Analysis LINTA is trading at 5.6x our F’10E EBITDA vs. the peer group average of 6.5x. We do not think this discount is justified given QVC growth prospects in existing and new markets. We rate the stock Overweight.
Risks to Our Rating QVC could under-perform our expectations if QVC.com does not continue to out-perform the domestic TV shopping business. Under-performance could also occur if the other e-commerce holdings do not out-perform brick-and-mortar retail. Margins could be weaker than expected if production and broadcasting costs increase. Finally, given QVC's exposure to international markets, we are assuming that there are no changes in the regulations governing its business in foreign countries.
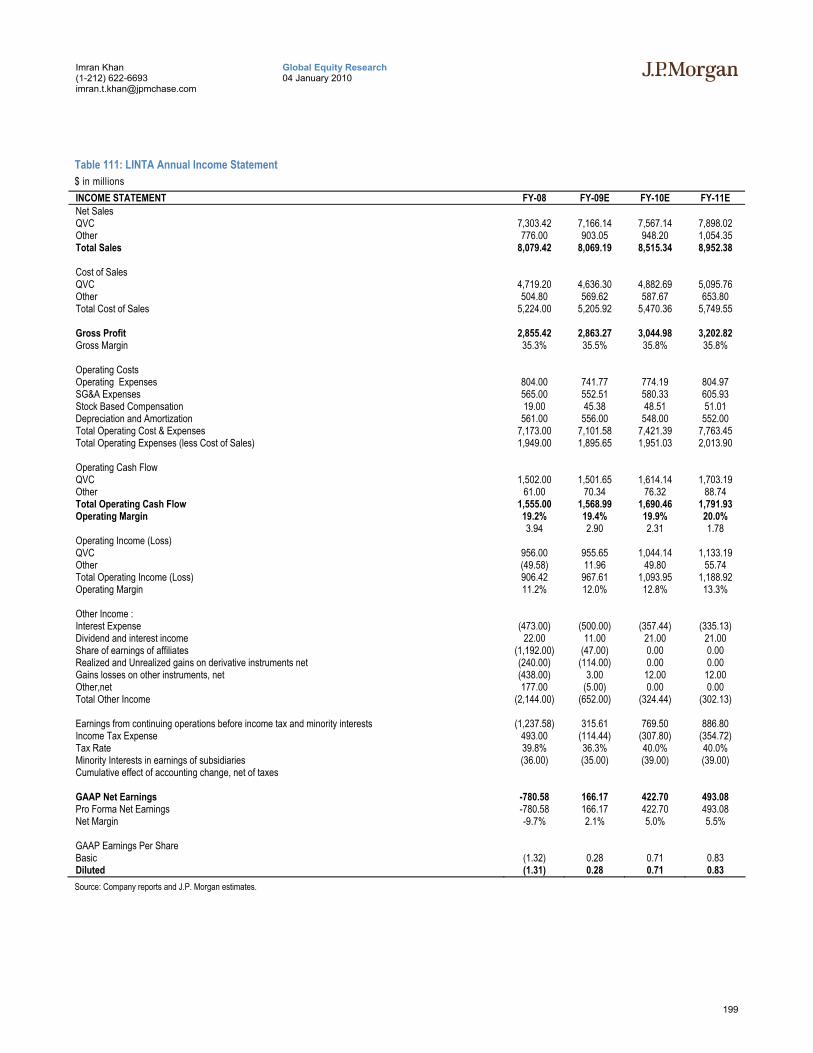
199
Global Equity Research 04 January 2010
Imran Khan (1-212) 622-6693 [email protected]
Table 111: LINTA Annual Income Statement $ in millions INCOME STATEMENT FY-08 FY-09E FY-10E FY-11E Net Sales QVC 7,303.42 7,166.14 7,567.14 7,898.02 Other 776.00 903.05 948.20 1,054.35 Total Sales 8,079.42 8,069.19 8,515.34 8,952.38 Cost of Sales QVC 4,719.20 4,636.30 4,882.69 5,095.76 Other 504.80 569.62 587.67 653.80 Total Cost of Sales 5,224.00 5,205.92 5,470.36 5,749.55 Gross Profit 2,855.42 2,863.27 3,044.98 3,202.82 Gross Margin 35.3% 35.5% 35.8% 35.8% Operating Costs Operating Expenses 804.00 741.77 774.19 804.97 SG&A Expenses 565.00 552.51 580.33 605.93 Stock Based Compensation 19.00 45.38 48.51 51.01 Depreciation and Amortization 561.00 556.00 548.00 552.00 Total Operating Cost & Expenses 7,173.00 7,101.58 7,421.39 7,763.45 Total Operating Expenses (less Cost of Sales) 1,949.00 1,895.65 1,951.03 2,013.90 Operating Cash Flow QVC 1,502.00 1,501.65 1,614.14 1,703.19 Other 61.00 70.34 76.32 88.74 Total Operating Cash Flow 1,555.00 1,568.99 1,690.46 1,791.93 Operating Margin 19.2% 19.4% 19.9% 20.0% 3.94 2.90 2.31 1.78 Operating Income (Loss) QVC 956.00 955.65 1,044.14 1,133.19 Other (49.58) 11.96 49.80 55.74 Total Operating Income (Loss) 906.42 967.61 1,093.95 1,188.92 Operating Margin 11.2% 12.0% 12.8% 13.3% Other Income : Interest Expense (473.00) (500.00) (357.44) (335.13) Dividend and interest income 22.00 11.00 21.00 21.00 Share of earnings of affiliates (1,192.00) (47.00) 0.00 0.00 Realized and Unrealized gains on derivative instruments net (240.00) (114.00) 0.00 0.00 Gains losses on other instruments, net (438.00) 3.00 12.00 12.00 Other,net 177.00 (5.00) 0.00 0.00 Total Other Income (2,144.00) (652.00) (324.44) (302.13) Earnings from continuing operations before income tax and minority interests (1,237.58) 315.61 769.50 886.80 Income Tax Expense 493.00 (114.44) (307.80) (354.72) Tax Rate 39.8% 36.3% 40.0% 40.0% Minority Interests in earnings of subsidiaries (36.00) (35.00) (39.00) (39.00) Cumulative effect of accounting change, net of taxes GAAP Net Earnings -780.58 166.17 422.70 493.08 Pro Forma Net Earnings -780.58 166.17 422.70 493.08 Net Margin -9.7% 2.1% 5.0% 5.5% GAAP Earnings Per Share Basic (1.32) 0.28 0.71 0.83 Diluted (1.31) 0.28 0.71 0.83 Source: Company reports and J.P. Morgan estimates.
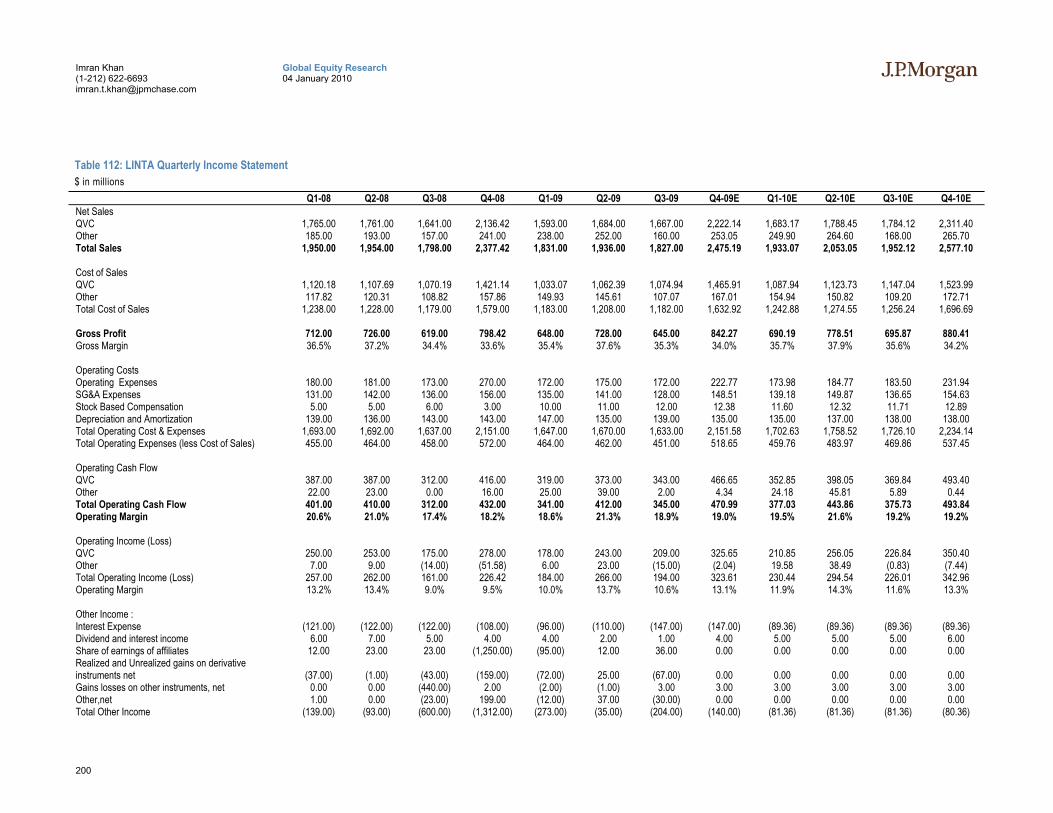
200
Global Equity Research 04 January 2010
Imran Khan (1-212) 622-6693 [email protected]
Table 112: LINTA Quarterly Income Statement $ in millions
Q1-08 Q2-08 Q3-08 Q4-08 Q1-09 Q2-09 Q3-09 Q4-09E Q1-10E Q2-10E Q3-10E Q4-10E Net Sales QVC 1,765.00 1,761.00 1,641.00 2,136.42 1,593.00 1,684.00 1,667.00 2,222.14 1,683.17 1,788.45 1,784.12 2,311.40 Other 185.00 193.00 157.00 241.00 238.00 252.00 160.00 253.05 249.90 264.60 168.00 265.70 Total Sales 1,950.00 1,954.00 1,798.00 2,377.42 1,831.00 1,936.00 1,827.00 2,475.19 1,933.07 2,053.05 1,952.12 2,577.10 Cost of Sales QVC 1,120.18 1,107.69 1,070.19 1,421.14 1,033.07 1,062.39 1,074.94 1,465.91 1,087.94 1,123.73 1,147.04 1,523.99 Other 117.82 120.31 108.82 157.86 149.93 145.61 107.07 167.01 154.94 150.82 109.20 172.71 Total Cost of Sales 1,238.00 1,228.00 1,179.00 1,579.00 1,183.00 1,208.00 1,182.00 1,632.92 1,242.88 1,274.55 1,256.24 1,696.69 Gross Profit 712.00 726.00 619.00 798.42 648.00 728.00 645.00 842.27 690.19 778.51 695.87 880.41 Gross Margin 36.5% 37.2% 34.4% 33.6% 35.4% 37.6% 35.3% 34.0% 35.7% 37.9% 35.6% 34.2% Operating Costs Operating Expenses 180.00 181.00 173.00 270.00 172.00 175.00 172.00 222.77 173.98 184.77 183.50 231.94 SG&A Expenses 131.00 142.00 136.00 156.00 135.00 141.00 128.00 148.51 139.18 149.87 136.65 154.63 Stock Based Compensation 5.00 5.00 6.00 3.00 10.00 11.00 12.00 12.38 11.60 12.32 11.71 12.89 Depreciation and Amortization 139.00 136.00 143.00 143.00 147.00 135.00 139.00 135.00 135.00 137.00 138.00 138.00 Total Operating Cost & Expenses 1,693.00 1,692.00 1,637.00 2,151.00 1,647.00 1,670.00 1,633.00 2,151.58 1,702.63 1,758.52 1,726.10 2,234.14 Total Operating Expenses (less Cost of Sales) 455.00 464.00 458.00 572.00 464.00 462.00 451.00 518.65 459.76 483.97 469.86 537.45 Operating Cash Flow QVC 387.00 387.00 312.00 416.00 319.00 373.00 343.00 466.65 352.85 398.05 369.84 493.40 Other 22.00 23.00 0.00 16.00 25.00 39.00 2.00 4.34 24.18 45.81 5.89 0.44 Total Operating Cash Flow 401.00 410.00 312.00 432.00 341.00 412.00 345.00 470.99 377.03 443.86 375.73 493.84 Operating Margin 20.6% 21.0% 17.4% 18.2% 18.6% 21.3% 18.9% 19.0% 19.5% 21.6% 19.2% 19.2% Operating Income (Loss) QVC 250.00 253.00 175.00 278.00 178.00 243.00 209.00 325.65 210.85 256.05 226.84 350.40 Other 7.00 9.00 (14.00) (51.58) 6.00 23.00 (15.00) (2.04) 19.58 38.49 (0.83) (7.44) Total Operating Income (Loss) 257.00 262.00 161.00 226.42 184.00 266.00 194.00 323.61 230.44 294.54 226.01 342.96 Operating Margin 13.2% 13.4% 9.0% 9.5% 10.0% 13.7% 10.6% 13.1% 11.9% 14.3% 11.6% 13.3% Other Income : Interest Expense (121.00) (122.00) (122.00) (108.00) (96.00) (110.00) (147.00) (147.00) (89.36) (89.36) (89.36) (89.36) Dividend and interest income 6.00 7.00 5.00 4.00 4.00 2.00 1.00 4.00 5.00 5.00 5.00 6.00 Share of earnings of affiliates 12.00 23.00 23.00 (1,250.00) (95.00) 12.00 36.00 0.00 0.00 0.00 0.00 0.00 Realized and Unrealized gains on derivative instruments net (37.00) (1.00) (43.00) (159.00) (72.00) 25.00 (67.00) 0.00 0.00 0.00 0.00 0.00 Gains losses on other instruments, net 0.00 0.00 (440.00) 2.00 (2.00) (1.00) 3.00 3.00 3.00 3.00 3.00 3.00 Other,net 1.00 0.00 (23.00) 199.00 (12.00) 37.00 (30.00) 0.00 0.00 0.00 0.00 0.00 Total Other Income (139.00) (93.00) (600.00) (1,312.00) (273.00) (35.00) (204.00) (140.00) (81.36) (81.36) (81.36) (80.36)
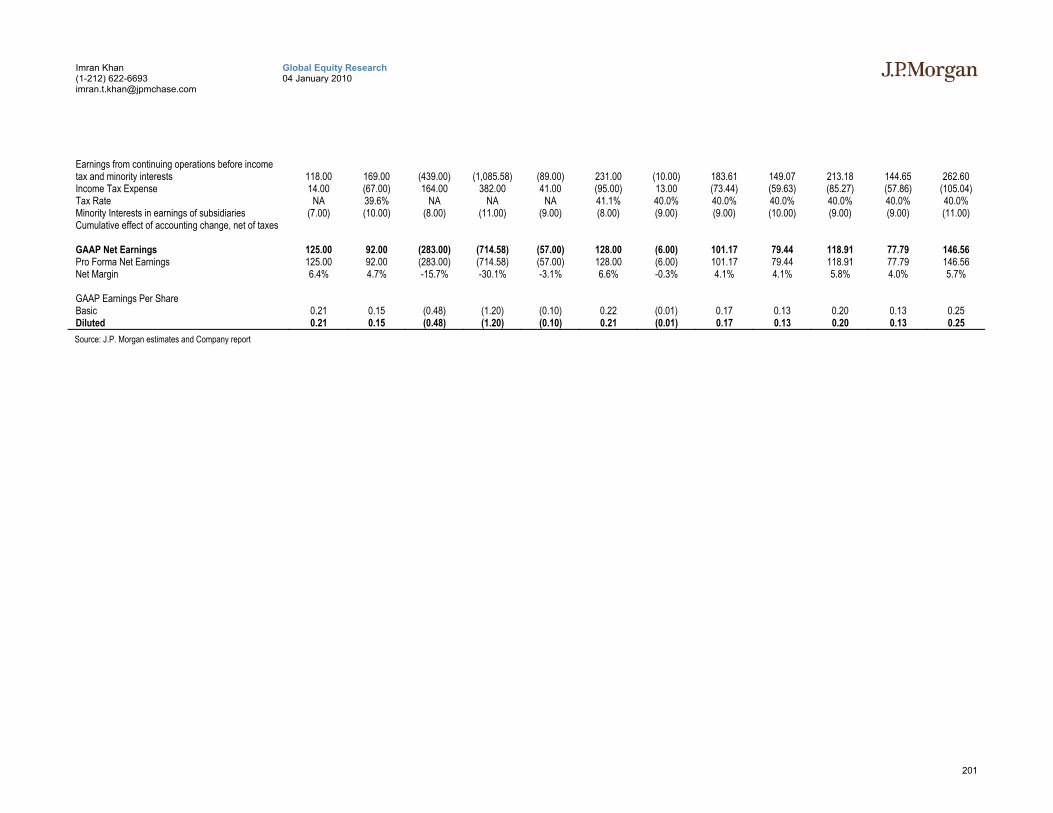
201
Global Equity Research 04 January 2010
Imran Khan (1-212) 622-6693 [email protected]
Earnings from continuing operations before income tax and minority interests 118.00 169.00 (439.00) (1,085.58) (89.00) 231.00 (10.00) 183.61 149.07 213.18 144.65 262.60 Income Tax Expense 14.00 (67.00) 164.00 382.00 41.00 (95.00) 13.00 (73.44) (59.63) (85.27) (57.86) (105.04) Tax Rate NA 39.6% NA NA NA 41.1% 40.0% 40.0% 40.0% 40.0% 40.0% 40.0% Minority Interests in earnings of subsidiaries (7.00) (10.00) (8.00) (11.00) (9.00) (8.00) (9.00) (9.00) (10.00) (9.00) (9.00) (11.00) Cumulative effect of accounting change, net of taxes GAAP Net Earnings 125.00 92.00 (283.00) (714.58) (57.00) 128.00 (6.00) 101.17 79.44 118.91 77.79 146.56 Pro Forma Net Earnings 125.00 92.00 (283.00) (714.58) (57.00) 128.00 (6.00) 101.17 79.44 118.91 77.79 146.56 Net Margin 6.4% 4.7% -15.7% -30.1% -3.1% 6.6% -0.3% 4.1% 4.1% 5.8% 4.0% 5.7% GAAP Earnings Per Share Basic 0.21 0.15 (0.48) (1.20) (0.10) 0.22 (0.01) 0.17 0.13 0.20 0.13 0.25 Diluted 0.21 0.15 (0.48) (1.20) (0.10) 0.21 (0.01) 0.17 0.13 0.20 0.13 0.25 Source: J.P. Morgan estimates and Company report
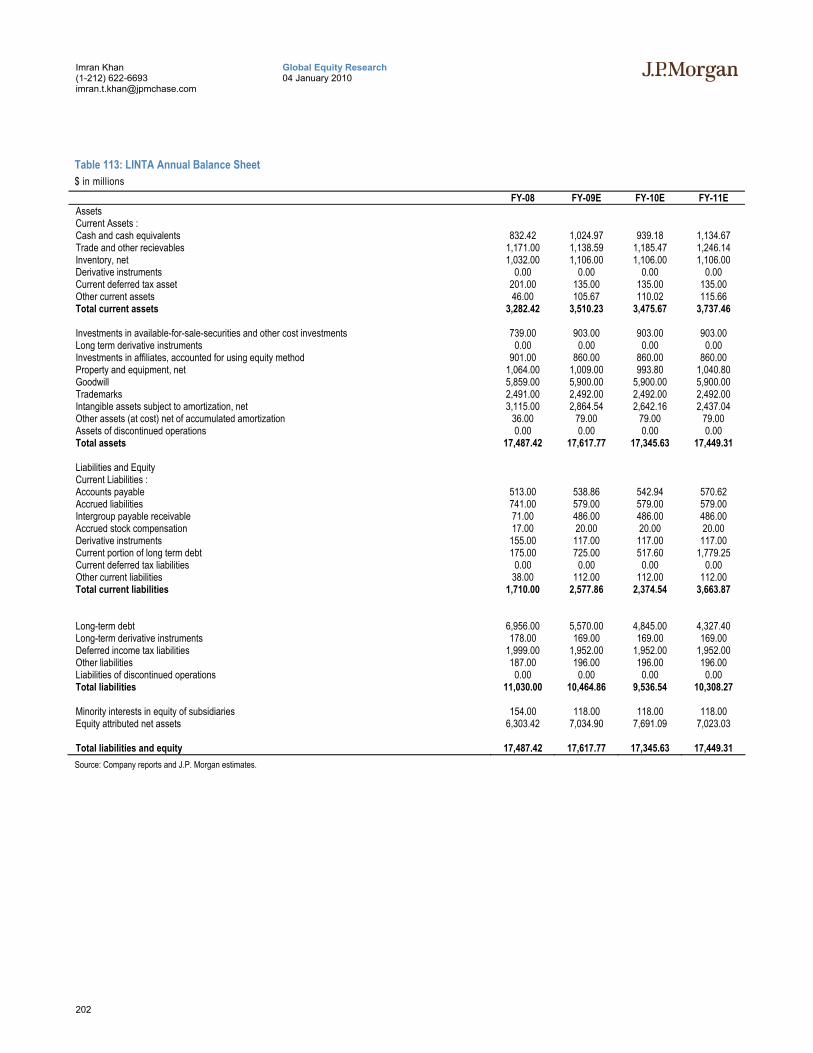
202
Global Equity Research 04 January 2010
Imran Khan (1-212) 622-6693 [email protected]
Table 113: LINTA Annual Balance Sheet $ in millions
FY-08 FY-09E FY-10E FY-11E Assets Current Assets : Cash and cash equivalents 832.42 1,024.97 939.18 1,134.67 Trade and other recievables 1,171.00 1,138.59 1,185.47 1,246.14 Inventory, net 1,032.00 1,106.00 1,106.00 1,106.00 Derivative instruments 0.00 0.00 0.00 0.00 Current deferred tax asset 201.00 135.00 135.00 135.00 Other current assets 46.00 105.67 110.02 115.66 Total current assets 3,282.42 3,510.23 3,475.67 3,737.46 Investments in available-for-sale-securities and other cost investments 739.00 903.00 903.00 903.00 Long term derivative instruments 0.00 0.00 0.00 0.00 Investments in affiliates, accounted for using equity method 901.00 860.00 860.00 860.00 Property and equipment, net 1,064.00 1,009.00 993.80 1,040.80 Goodwill 5,859.00 5,900.00 5,900.00 5,900.00 Trademarks 2,491.00 2,492.00 2,492.00 2,492.00 Intangible assets subject to amortization, net 3,115.00 2,864.54 2,642.16 2,437.04 Other assets (at cost) net of accumulated amortization 36.00 79.00 79.00 79.00 Assets of discontinued operations 0.00 0.00 0.00 0.00 Total assets 17,487.42 17,617.77 17,345.63 17,449.31 Liabilities and Equity Current Liabilities : Accounts payable 513.00 538.86 542.94 570.62 Accrued liabilities 741.00 579.00 579.00 579.00 Intergroup payable receivable 71.00 486.00 486.00 486.00 Accrued stock compensation 17.00 20.00 20.00 20.00 Derivative instruments 155.00 117.00 117.00 117.00 Current portion of long term debt 175.00 725.00 517.60 1,779.25 Current deferred tax liabilities 0.00 0.00 0.00 0.00 Other current liabilities 38.00 112.00 112.00 112.00 Total current liabilities 1,710.00 2,577.86 2,374.54 3,663.87 Long-term debt 6,956.00 5,570.00 4,845.00 4,327.40 Long-term derivative instruments 178.00 169.00 169.00 169.00 Deferred income tax liabilities 1,999.00 1,952.00 1,952.00 1,952.00 Other liabilities 187.00 196.00 196.00 196.00 Liabilities of discontinued operations 0.00 0.00 0.00 0.00 Total liabilities 11,030.00 10,464.86 9,536.54 10,308.27 Minority interests in equity of subsidiaries 154.00 118.00 118.00 118.00 Equity attributed net assets 6,303.42 7,034.90 7,691.09 7,023.03 Total liabilities and equity 17,487.42 17,617.77 17,345.63 17,449.31 Source: Company reports and J.P. Morgan estimates.
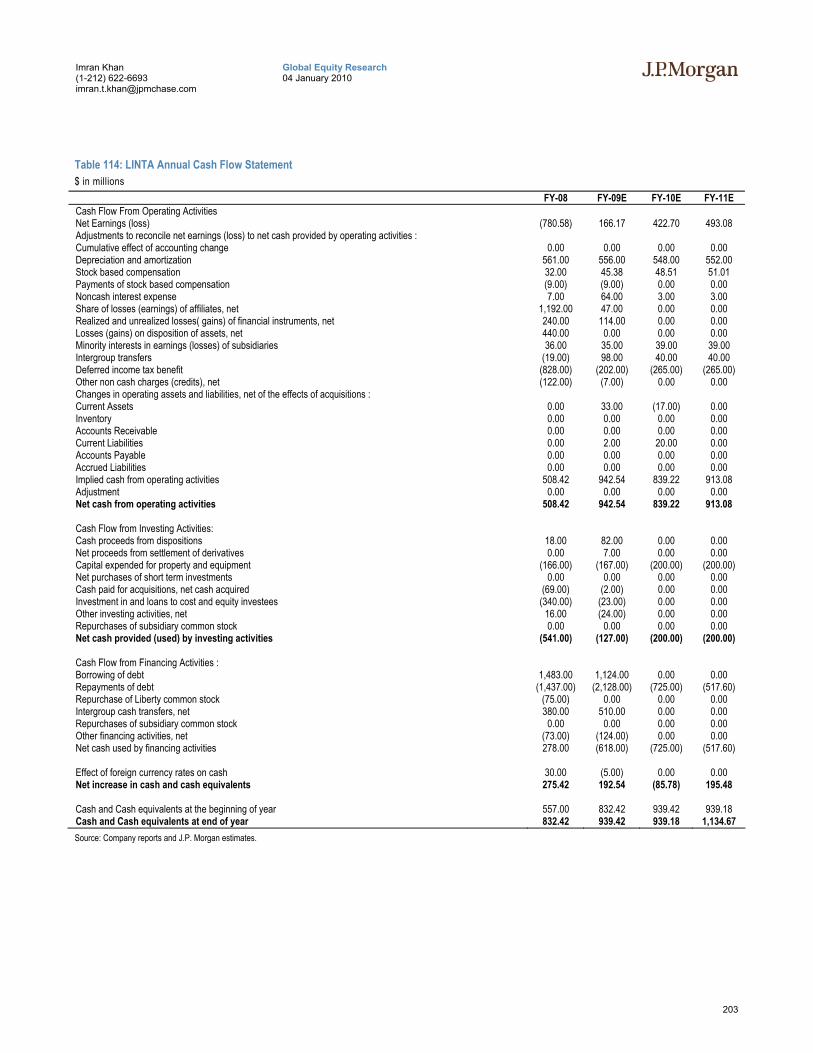
203
Global Equity Research 04 January 2010
Imran Khan (1-212) 622-6693 [email protected]
Table 114: LINTA Annual Cash Flow Statement $ in millions
FY-08 FY-09E FY-10E FY-11E Cash Flow From Operating Activities Net Earnings (loss) (780.58) 166.17 422.70 493.08 Adjustments to reconcile net earnings (loss) to net cash provided by operating activities : Cumulative effect of accounting change 0.00 0.00 0.00 0.00 Depreciation and amortization 561.00 556.00 548.00 552.00 Stock based compensation 32.00 45.38 48.51 51.01 Payments of stock based compensation (9.00) (9.00) 0.00 0.00 Noncash interest expense 7.00 64.00 3.00 3.00 Share of losses (earnings) of affiliates, net 1,192.00 47.00 0.00 0.00 Realized and unrealized losses( gains) of financial instruments, net 240.00 114.00 0.00 0.00 Losses (gains) on disposition of assets, net 440.00 0.00 0.00 0.00 Minority interests in earnings (losses) of subsidiaries 36.00 35.00 39.00 39.00 Intergroup transfers (19.00) 98.00 40.00 40.00 Deferred income tax benefit (828.00) (202.00) (265.00) (265.00) Other non cash charges (credits), net (122.00) (7.00) 0.00 0.00 Changes in operating assets and liabilities, net of the effects of acquisitions : Current Assets 0.00 33.00 (17.00) 0.00 Inventory 0.00 0.00 0.00 0.00 Accounts Receivable 0.00 0.00 0.00 0.00 Current Liabilities 0.00 2.00 20.00 0.00 Accounts Payable 0.00 0.00 0.00 0.00 Accrued Liabilities 0.00 0.00 0.00 0.00 Implied cash from operating activities 508.42 942.54 839.22 913.08 Adjustment 0.00 0.00 0.00 0.00 Net cash from operating activities 508.42 942.54 839.22 913.08 Cash Flow from Investing Activities: Cash proceeds from dispositions 18.00 82.00 0.00 0.00 Net proceeds from settlement of derivatives 0.00 7.00 0.00 0.00 Capital expended for property and equipment (166.00) (167.00) (200.00) (200.00) Net purchases of short term investments 0.00 0.00 0.00 0.00 Cash paid for acquisitions, net cash acquired (69.00) (2.00) 0.00 0.00 Investment in and loans to cost and equity investees (340.00) (23.00) 0.00 0.00 Other investing activities, net 16.00 (24.00) 0.00 0.00 Repurchases of subsidiary common stock 0.00 0.00 0.00 0.00 Net cash provided (used) by investing activities (541.00) (127.00) (200.00) (200.00) Cash Flow from Financing Activities : Borrowing of debt 1,483.00 1,124.00 0.00 0.00 Repayments of debt (1,437.00) (2,128.00) (725.00) (517.60) Repurchase of Liberty common stock (75.00) 0.00 0.00 0.00 Intergroup cash transfers, net 380.00 510.00 0.00 0.00 Repurchases of subsidiary common stock 0.00 0.00 0.00 0.00 Other financing activities, net (73.00) (124.00) 0.00 0.00 Net cash used by financing activities 278.00 (618.00) (725.00) (517.60) Effect of foreign currency rates on cash 30.00 (5.00) 0.00 0.00 Net increase in cash and cash equivalents 275.42 192.54 (85.78) 195.48 Cash and Cash equivalents at the beginning of year 557.00 832.42 939.42 939.18 Cash and Cash equivalents at end of year 832.42 939.42 939.18 1,134.67 Source: Company reports and J.P. Morgan estimates.
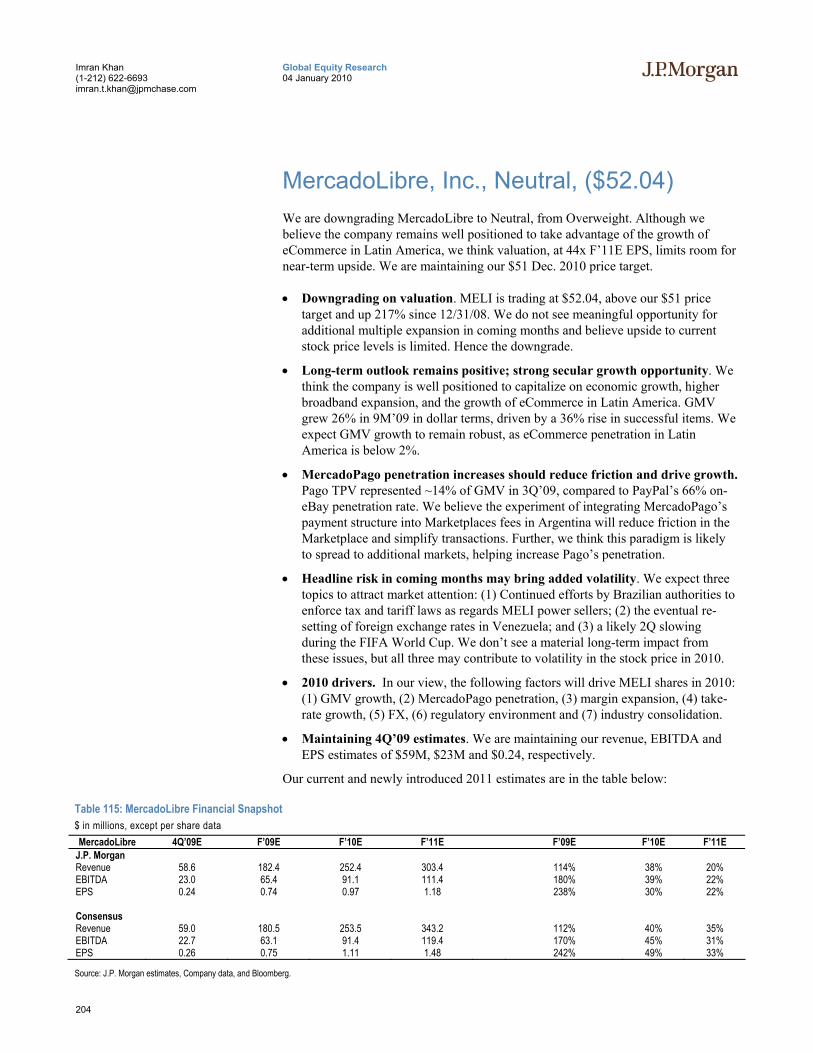
204
Global Equity Research 04 January 2010
Imran Khan (1-212) 622-6693 [email protected]
MercadoLibre, Inc., Neutral, ($52.04) We are downgrading MercadoLibre to Neutral, from Overweight. Although we believe the company remains well positioned to take advantage of the growth of eCommerce in Latin America, we think valuation, at 44x F’11E EPS, limits room for near-term upside. We are maintaining our $51 Dec. 2010 price target.
• Downgrading on valuation. MELI is trading at $52.04, above our $51 price target and up 217% since 12/31/08. We do not see meaningful opportunity for additional multiple expansion in coming months and believe upside to current stock price levels is limited. Hence the downgrade.
• Long-term outlook remains positive; strong secular growth opportunity. We think the company is well positioned to capitalize on economic growth, higher broadband expansion, and the growth of eCommerce in Latin America. GMV grew 26% in 9M’09 in dollar terms, driven by a 36% rise in successful items. We expect GMV growth to remain robust, as eCommerce penetration in Latin America is below 2%.
• MercadoPago penetration increases should reduce friction and drive growth. Pago TPV represented ~14% of GMV in 3Q’09, compared to PayPal’s 66% on-eBay penetration rate. We believe the experiment of integrating MercadoPago’s payment structure into Marketplaces fees in Argentina will reduce friction in the Marketplace and simplify transactions. Further, we think this paradigm is likely to spread to additional markets, helping increase Pago’s penetration.
• Headline risk in coming months may bring added volatility. We expect three topics to attract market attention: (1) Continued efforts by Brazilian authorities to enforce tax and tariff laws as regards MELI power sellers; (2) the eventual re-setting of foreign exchange rates in Venezuela; and (3) a likely 2Q slowing during the FIFA World Cup. We don’t see a material long-term impact from these issues, but all three may contribute to volatility in the stock price in 2010.
• 2010 drivers. In our view, the following factors will drive MELI shares in 2010: (1) GMV growth, (2) MercadoPago penetration, (3) margin expansion, (4) take-rate growth, (5) FX, (6) regulatory environment and (7) industry consolidation.
• Maintaining 4Q’09 estimates. We are maintaining our revenue, EBITDA and EPS estimates of $59M, $23M and $0.24, respectively.
Our current and newly introduced 2011 estimates are in the table below:
Table 115: MercadoLibre Financial Snapshot $ in millions, except per share data MercadoLibre 4Q’09E F’09E F’10E F’11E F’09E F’10E F’11E
J.P. Morgan Revenue 58.6 182.4 252.4 303.4 114% 38% 20% EBITDA 23.0 65.4 91.1 111.4 180% 39% 22% EPS 0.24 0.74 0.97 1.18 238% 30% 22%
Consensus Revenue 59.0 180.5 253.5 343.2 112% 40% 35% EBITDA 22.7 63.1 91.4 119.4 170% 45% 31% EPS 0.26 0.75 1.11 1.48 242% 49% 33%
Source: J.P. Morgan estimates, Company data, and Bloomberg.
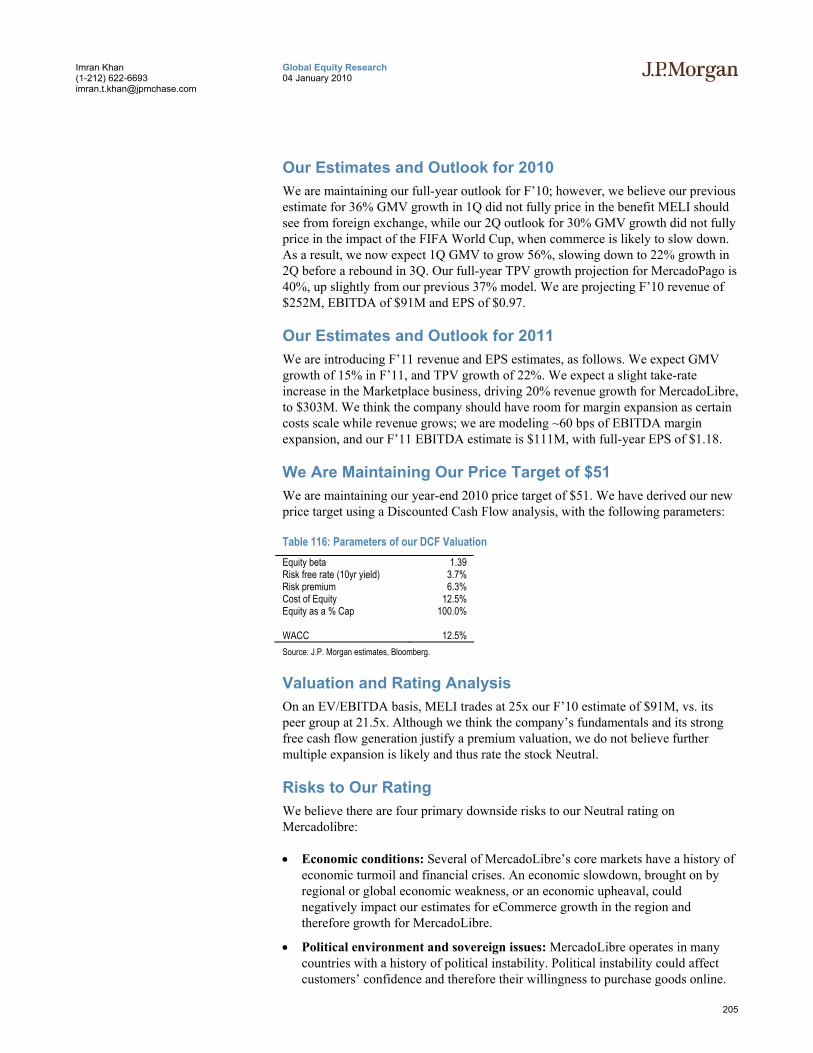
205
Global Equity Research 04 January 2010
Imran Khan (1-212) 622-6693 [email protected]
Our Estimates and Outlook for 2010 We are maintaining our full-year outlook for F’10; however, we believe our previous estimate for 36% GMV growth in 1Q did not fully price in the benefit MELI should see from foreign exchange, while our 2Q outlook for 30% GMV growth did not fully price in the impact of the FIFA World Cup, when commerce is likely to slow down. As a result, we now expect 1Q GMV to grow 56%, slowing down to 22% growth in 2Q before a rebound in 3Q. Our full-year TPV growth projection for MercadoPago is 40%, up slightly from our previous 37% model. We are projecting F’10 revenue of $252M, EBITDA of $91M and EPS of $0.97.
Our Estimates and Outlook for 2011 We are introducing F’11 revenue and EPS estimates, as follows. We expect GMV growth of 15% in F’11, and TPV growth of 22%. We expect a slight take-rate increase in the Marketplace business, driving 20% revenue growth for MercadoLibre, to $303M. We think the company should have room for margin expansion as certain costs scale while revenue grows; we are modeling ~60 bps of EBITDA margin expansion, and our F’11 EBITDA estimate is $111M, with full-year EPS of $1.18.
We Are Maintaining Our Price Target of $51 We are maintaining our year-end 2010 price target of $51. We have derived our new price target using a Discounted Cash Flow analysis, with the following parameters:
Table 116: Parameters of our DCF Valuation Equity beta 1.39 Risk free rate (10yr yield) 3.7% Risk premium 6.3% Cost of Equity 12.5% Equity as a % Cap 100.0%
WACC 12.5% Source: J.P. Morgan estimates, Bloomberg.
Valuation and Rating Analysis On an EV/EBITDA basis, MELI trades at 25x our F’10 estimate of $91M, vs. its peer group at 21.5x. Although we think the company’s fundamentals and its strong free cash flow generation justify a premium valuation, we do not believe further multiple expansion is likely and thus rate the stock Neutral.
Risks to Our Rating We believe there are four primary downside risks to our Neutral rating on Mercadolibre:
• Economic conditions: Several of MercadoLibre’s core markets have a history of economic turmoil and financial crises. An economic slowdown, brought on by regional or global economic weakness, or an economic upheaval, could negatively impact our estimates for eCommerce growth in the region and therefore growth for MercadoLibre.
• Political environment and sovereign issues: MercadoLibre operates in many countries with a history of political instability. Political instability could affect customers’ confidence and therefore their willingness to purchase goods online.
206
Global Equity Research 04 January 2010
Imran Khan (1-212) 622-6693 [email protected]
In addition, governments may limit internet or commerce activities. We believe MercadoLibre’s close work with local governments to monitor sales practices and the ability to track cash flows with MercadoPago mitigates some of this risk.
• Expansion plans could stress resources: MercadoLibre has grown through a number of acquisitions since its inception in 1999. As the company looks to grow into new product offerings and markets, it may look to acquire other companies or be forced to spend substantial cash to develop its own products. Either event could stress MercadoLibre’s financial resources.
• Low cost of entry business model. Creating an online marketplace requires little capital, since the owner does not need to stock merchandise and fulfill orders. In addition, if Latin American e-commerce growth proves to be as attractive as some projections estimate, it might attract the interest of larger players, such as eBay, Google, Yahoo or Amazon, which have greater resources available to them than MercadoLibre. However, we believe both the first mover advantage and the marketplace scale that MercadoLibre has achieved act as barriers to entry for even deep-pocketed competitors.
Upside risks to our Neutral rating include:
• Economic conditions: If the economic performance of the countries where MercadoLibre operates exceeds our expectations, there could be upside to our estimates. Additionally, if internet and eCommerce adoption trends in Latin America accelerate, the company could outperform our forecasts.
• New initiatives. MercadoLibre is developing several new products. We do not forecast a meaningful medium-term contribution from these products, which include advertising as well as products aimed at sellers. Should customer uptake of these products accelerate quickly, the stock could outperform.
• Industry consolidation. MercadoLibre operates in markets with many sizable players. If the company becomes the target of an acquisition, there could be upside to the current valuation.
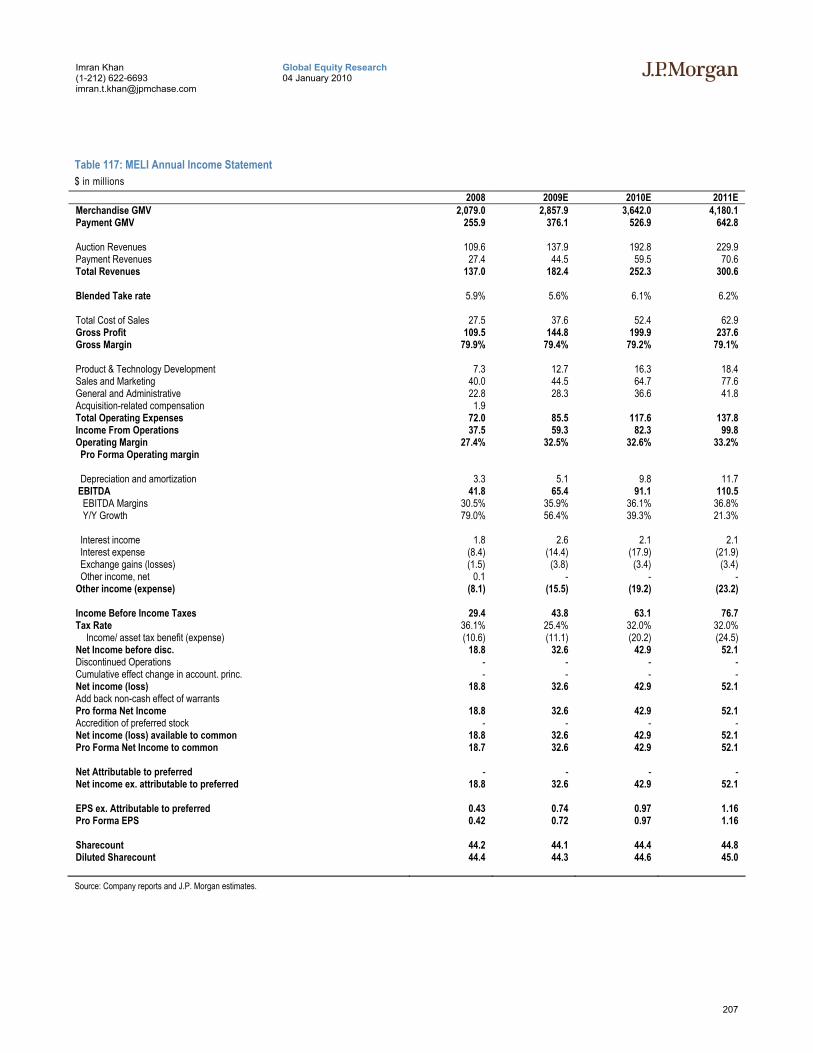
207
Global Equity Research 04 January 2010
Imran Khan (1-212) 622-6693 [email protected]
Table 117: MELI Annual Income Statement $ in millions
2008 2009E 2010E 2011E Merchandise GMV 2,079.0 2,857.9 3,642.0 4,180.1 Payment GMV 255.9 376.1 526.9 642.8 Auction Revenues 109.6 137.9 192.8 229.9 Payment Revenues 27.4 44.5 59.5 70.6 Total Revenues 137.0 182.4 252.3 300.6 Blended Take rate 5.9% 5.6% 6.1% 6.2% Total Cost of Sales 27.5 37.6 52.4 62.9 Gross Profit 109.5 144.8 199.9 237.6 Gross Margin 79.9% 79.4% 79.2% 79.1% Product & Technology Development 7.3 12.7 16.3 18.4 Sales and Marketing 40.0 44.5 64.7 77.6 General and Administrative 22.8 28.3 36.6 41.8 Acquisition-related compensation 1.9 Total Operating Expenses 72.0 85.5 117.6 137.8 Income From Operations 37.5 59.3 82.3 99.8 Operating Margin 27.4% 32.5% 32.6% 33.2% Pro Forma Operating margin Depreciation and amortization 3.3 5.1 9.8 11.7 EBITDA 41.8 65.4 91.1 110.5 EBITDA Margins 30.5% 35.9% 36.1% 36.8% Y/Y Growth 79.0% 56.4% 39.3% 21.3% Interest income 1.8 2.6 2.1 2.1 Interest expense (8.4) (14.4) (17.9) (21.9) Exchange gains (losses) (1.5) (3.8) (3.4) (3.4) Other income, net 0.1 - - - Other income (expense) (8.1) (15.5) (19.2) (23.2) Income Before Income Taxes 29.4 43.8 63.1 76.7 Tax Rate 36.1% 25.4% 32.0% 32.0%
Income/ asset tax benefit (expense) (10.6) (11.1) (20.2) (24.5) Net Income before disc. 18.8 32.6 42.9 52.1 Discontinued Operations - - - - Cumulative effect change in account. princ. - - - - Net income (loss) 18.8 32.6 42.9 52.1 Add back non-cash effect of warrants Pro forma Net Income 18.8 32.6 42.9 52.1 Accredition of preferred stock - - - - Net income (loss) available to common 18.8 32.6 42.9 52.1 Pro Forma Net Income to common 18.7 32.6 42.9 52.1 Net Attributable to preferred - - - - Net income ex. attributable to preferred 18.8 32.6 42.9 52.1 EPS ex. Attributable to preferred 0.43 0.74 0.97 1.16 Pro Forma EPS 0.42 0.72 0.97 1.16 Sharecount 44.2 44.1 44.4 44.8 Diluted Sharecount 44.4 44.3 44.6 45.0 Source: Company reports and J.P. Morgan estimates.
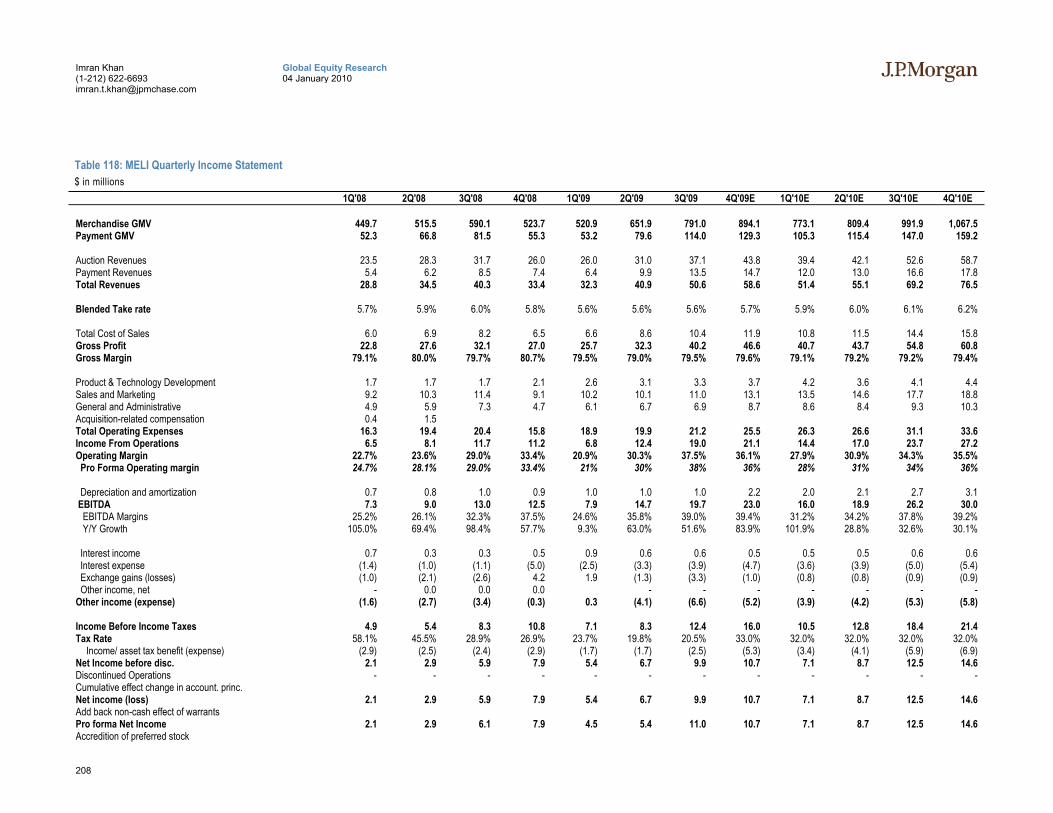
208
Global Equity Research 04 January 2010
Imran Khan (1-212) 622-6693 [email protected]
Table 118: MELI Quarterly Income Statement $ in millions
1Q'08 2Q'08 3Q'08 4Q'08 1Q'09 2Q'09 3Q'09 4Q'09E 1Q'10E 2Q'10E 3Q'10E 4Q'10E Merchandise GMV 449.7 515.5 590.1 523.7 520.9 651.9 791.0 894.1 773.1 809.4 991.9 1,067.5 Payment GMV 52.3 66.8 81.5 55.3 53.2 79.6 114.0 129.3 105.3 115.4 147.0 159.2 Auction Revenues 23.5 28.3 31.7 26.0 26.0 31.0 37.1 43.8 39.4 42.1 52.6 58.7 Payment Revenues 5.4 6.2 8.5 7.4 6.4 9.9 13.5 14.7 12.0 13.0 16.6 17.8 Total Revenues 28.8 34.5 40.3 33.4 32.3 40.9 50.6 58.6 51.4 55.1 69.2 76.5 Blended Take rate 5.7% 5.9% 6.0% 5.8% 5.6% 5.6% 5.6% 5.7% 5.9% 6.0% 6.1% 6.2% Total Cost of Sales 6.0 6.9 8.2 6.5 6.6 8.6 10.4 11.9 10.8 11.5 14.4 15.8 Gross Profit 22.8 27.6 32.1 27.0 25.7 32.3 40.2 46.6 40.7 43.7 54.8 60.8 Gross Margin 79.1% 80.0% 79.7% 80.7% 79.5% 79.0% 79.5% 79.6% 79.1% 79.2% 79.2% 79.4% Product & Technology Development 1.7 1.7 1.7 2.1 2.6 3.1 3.3 3.7 4.2 3.6 4.1 4.4 Sales and Marketing 9.2 10.3 11.4 9.1 10.2 10.1 11.0 13.1 13.5 14.6 17.7 18.8 General and Administrative 4.9 5.9 7.3 4.7 6.1 6.7 6.9 8.7 8.6 8.4 9.3 10.3 Acquisition-related compensation 0.4 1.5 Total Operating Expenses 16.3 19.4 20.4 15.8 18.9 19.9 21.2 25.5 26.3 26.6 31.1 33.6 Income From Operations 6.5 8.1 11.7 11.2 6.8 12.4 19.0 21.1 14.4 17.0 23.7 27.2 Operating Margin 22.7% 23.6% 29.0% 33.4% 20.9% 30.3% 37.5% 36.1% 27.9% 30.9% 34.3% 35.5% Pro Forma Operating margin 24.7% 28.1% 29.0% 33.4% 21% 30% 38% 36% 28% 31% 34% 36%
Depreciation and amortization 0.7 0.8 1.0 0.9 1.0 1.0 1.0 2.2 2.0 2.1 2.7 3.1 EBITDA 7.3 9.0 13.0 12.5 7.9 14.7 19.7 23.0 16.0 18.9 26.2 30.0 EBITDA Margins 25.2% 26.1% 32.3% 37.5% 24.6% 35.8% 39.0% 39.4% 31.2% 34.2% 37.8% 39.2% Y/Y Growth 105.0% 69.4% 98.4% 57.7% 9.3% 63.0% 51.6% 83.9% 101.9% 28.8% 32.6% 30.1% Interest income 0.7 0.3 0.3 0.5 0.9 0.6 0.6 0.5 0.5 0.5 0.6 0.6 Interest expense (1.4) (1.0) (1.1) (5.0) (2.5) (3.3) (3.9) (4.7) (3.6) (3.9) (5.0) (5.4) Exchange gains (losses) (1.0) (2.1) (2.6) 4.2 1.9 (1.3) (3.3) (1.0) (0.8) (0.8) (0.9) (0.9) Other income, net - 0.0 0.0 0.0 - - - - - - - Other income (expense) (1.6) (2.7) (3.4) (0.3) 0.3 (4.1) (6.6) (5.2) (3.9) (4.2) (5.3) (5.8) Income Before Income Taxes 4.9 5.4 8.3 10.8 7.1 8.3 12.4 16.0 10.5 12.8 18.4 21.4 Tax Rate 58.1% 45.5% 28.9% 26.9% 23.7% 19.8% 20.5% 33.0% 32.0% 32.0% 32.0% 32.0%
Income/ asset tax benefit (expense) (2.9) (2.5) (2.4) (2.9) (1.7) (1.7) (2.5) (5.3) (3.4) (4.1) (5.9) (6.9) Net Income before disc. 2.1 2.9 5.9 7.9 5.4 6.7 9.9 10.7 7.1 8.7 12.5 14.6 Discontinued Operations - - - - - - - - - - - - Cumulative effect change in account. princ. Net income (loss) 2.1 2.9 5.9 7.9 5.4 6.7 9.9 10.7 7.1 8.7 12.5 14.6 Add back non-cash effect of warrants Pro forma Net Income 2.1 2.9 6.1 7.9 4.5 5.4 11.0 10.7 7.1 8.7 12.5 14.6 Accredition of preferred stock
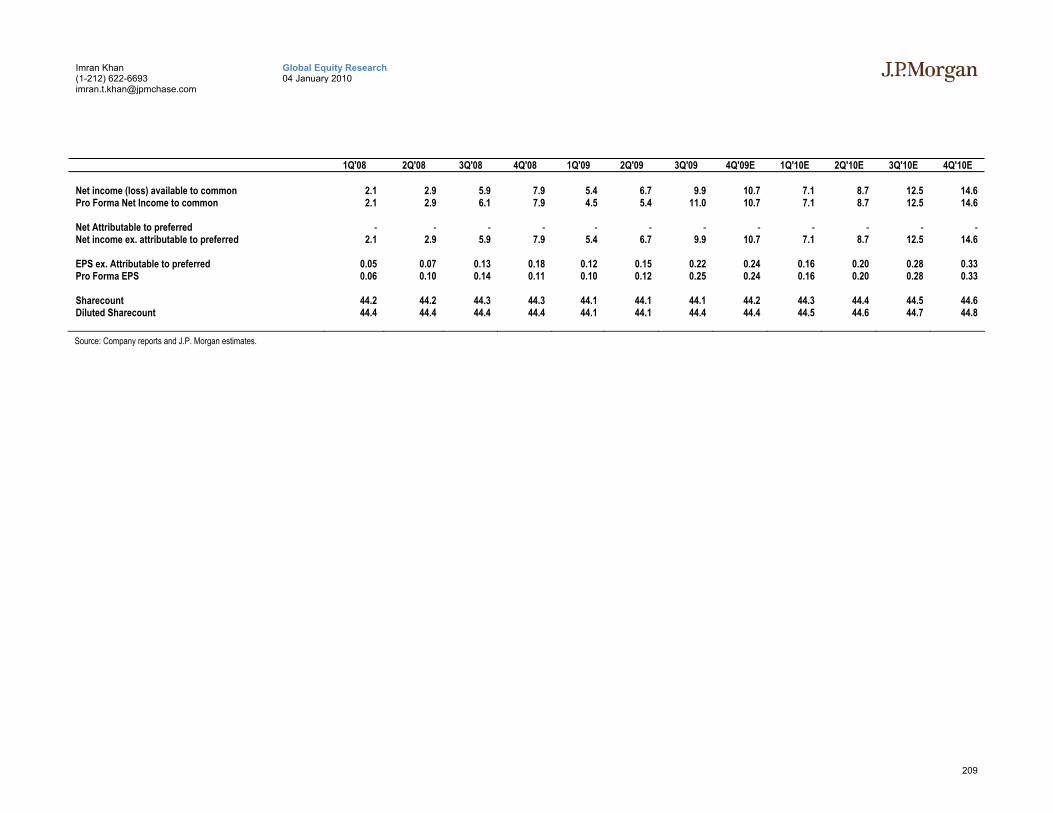
209
Global Equity Research 04 January 2010
Imran Khan (1-212) 622-6693 [email protected]
1Q'08 2Q'08 3Q'08 4Q'08 1Q'09 2Q'09 3Q'09 4Q'09E 1Q'10E 2Q'10E 3Q'10E 4Q'10E Net income (loss) available to common 2.1 2.9 5.9 7.9 5.4 6.7 9.9 10.7 7.1 8.7 12.5 14.6 Pro Forma Net Income to common 2.1 2.9 6.1 7.9 4.5 5.4 11.0 10.7 7.1 8.7 12.5 14.6 Net Attributable to preferred - - - - - - - - - - - - Net income ex. attributable to preferred 2.1 2.9 5.9 7.9 5.4 6.7 9.9 10.7 7.1 8.7 12.5 14.6 EPS ex. Attributable to preferred 0.05 0.07 0.13 0.18 0.12 0.15 0.22 0.24 0.16 0.20 0.28 0.33 Pro Forma EPS 0.06 0.10 0.14 0.11 0.10 0.12 0.25 0.24 0.16 0.20 0.28 0.33 Sharecount 44.2 44.2 44.3 44.3 44.1 44.1 44.1 44.2 44.3 44.4 44.5 44.6 Diluted Sharecount 44.4 44.4 44.4 44.4 44.1 44.1 44.4 44.4 44.5 44.6 44.7 44.8 Source: Company reports and J.P. Morgan estimates.

210
North America Equity Research 04 January 2010
Imran Khan (1-212) 622-6693 [email protected]
Table 119: MELI Annual Balance Sheet $ in millions
2008 2009E 2010E 2011E Assets Current assets
Cash and cash equivalents 17.5 51.9 122.8 206.0 Short-term investments 31.6 19.9 19.9 19.9 Accounts receivable 3.9 6.4 8.2 9.2 Funds receivable from customers 2.3 4.1 5.2 5.9 Prepaid expenses 0.4 1.8 2.3 2.6 Deferred tax assets 1.6 5.2 8.3 10.2 Other current assets 3.0 4.5 5.4 6.0 Total Current Assets 60.3 93.6 172.1 259.7
Non-current assets Long-term investments 9.2 24.3 24.3 24.3 Property & equipment, net 5.9 6.6 7.4 8.2 Gooodwill & intangibles, net 72.9 75.5 75.5 75.5 Deferred tax assets 0.0 2.9 2.9 2.9 Other assets 8.4 11.9 11.9 11.9 Total Non-Current Assets 96.4 121.3 122.1 122.9
Total Assets 156.7 214.9 294.2 382.6 Current liabilities
Accounts payable and accrued expenses 16.9 25.3 30.0 32.6 Funds payable to customers 14.7 26.1 33.8 38.4 Social security payable 4.4 5.9 7.9 8.8 Taxes payable 5.0 8.5 12.4 14.4 Loans payable 15.0 6.3 6.3 6.3 Other liabilities Provisions 0.3 0.1 0.1 0.1 Total Current Liabilities 56.3 72.2 90.6 100.6
Non-current liabilities Loans payable 3.1 0.9 0.9 0.9 Other liabilities 4.0 6.8 8.0 9.2 Total non-current liabilities 7.0 7.7 8.9 10.1
Total Liabilities 63.3 79.9 99.5 110.7 Shareholders equity
Common stock 0.0 0.0 0.0 0.0 Additional paid-in capital 119.8 126.1 142.9 167.4 Accumulated deficit (15.6) 17.1 60.0 112.7 Accumulated other comprehensive income (10.9) (8.2) (8.2) (8.2) Total shareholders' equity (deficit) 93.4 135.0 194.7 271.9
Total Liabilities and shareholders' equity 156.7 214.9 294.2 382.6 Source: Company reports and J.P. Morgan estimates.
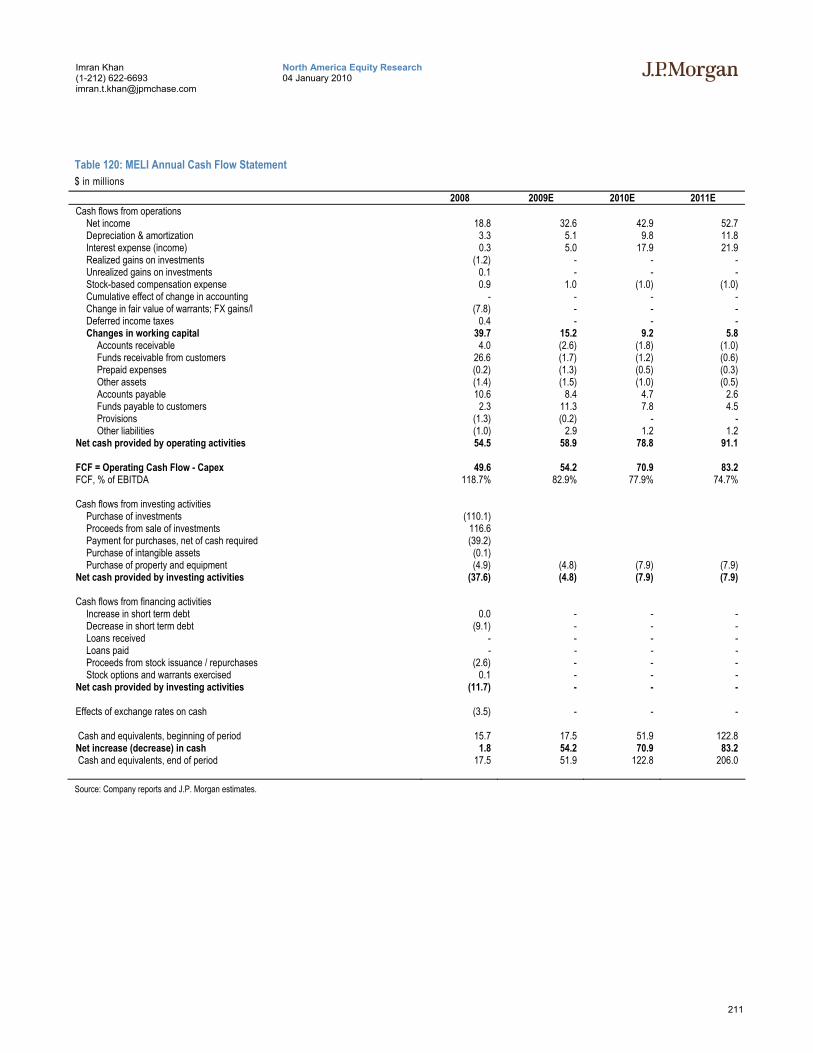
211
North America Equity Research 04 January 2010
Imran Khan (1-212) 622-6693 [email protected]
Table 120: MELI Annual Cash Flow Statement $ in millions
2008 2009E 2010E 2011E Cash flows from operations
Net income 18.8 32.6 42.9 52.7 Depreciation & amortization 3.3 5.1 9.8 11.8 Interest expense (income) 0.3 5.0 17.9 21.9 Realized gains on investments (1.2) - - - Unrealized gains on investments 0.1 - - - Stock-based compensation expense 0.9 1.0 (1.0) (1.0) Cumulative effect of change in accounting - - - - Change in fair value of warrants; FX gains/l (7.8) - - - Deferred income taxes 0.4 - - - Changes in working capital 39.7 15.2 9.2 5.8
Accounts receivable 4.0 (2.6) (1.8) (1.0) Funds receivable from customers 26.6 (1.7) (1.2) (0.6) Prepaid expenses (0.2) (1.3) (0.5) (0.3) Other assets (1.4) (1.5) (1.0) (0.5) Accounts payable 10.6 8.4 4.7 2.6 Funds payable to customers 2.3 11.3 7.8 4.5 Provisions (1.3) (0.2) - - Other liabilities (1.0) 2.9 1.2 1.2
Net cash provided by operating activities 54.5 58.9 78.8 91.1 FCF = Operating Cash Flow - Capex 49.6 54.2 70.9 83.2 FCF, % of EBITDA 118.7% 82.9% 77.9% 74.7% Cash flows from investing activities
Purchase of investments (110.1) Proceeds from sale of investments 116.6 Payment for purchases, net of cash required (39.2) Purchase of intangible assets (0.1) Purchase of property and equipment (4.9) (4.8) (7.9) (7.9)
Net cash provided by investing activities (37.6) (4.8) (7.9) (7.9) Cash flows from financing activities
Increase in short term debt 0.0 - - - Decrease in short term debt (9.1) - - - Loans received - - - - Loans paid - - - - Proceeds from stock issuance / repurchases (2.6) - - - Stock options and warrants exercised 0.1 - - -
Net cash provided by investing activities (11.7) - - - Effects of exchange rates on cash (3.5) - - - Cash and equivalents, beginning of period 15.7 17.5 51.9 122.8 Net increase (decrease) in cash 1.8 54.2 70.9 83.2 Cash and equivalents, end of period 17.5 51.9 122.8 206.0 Source: Company reports and J.P. Morgan estimates.
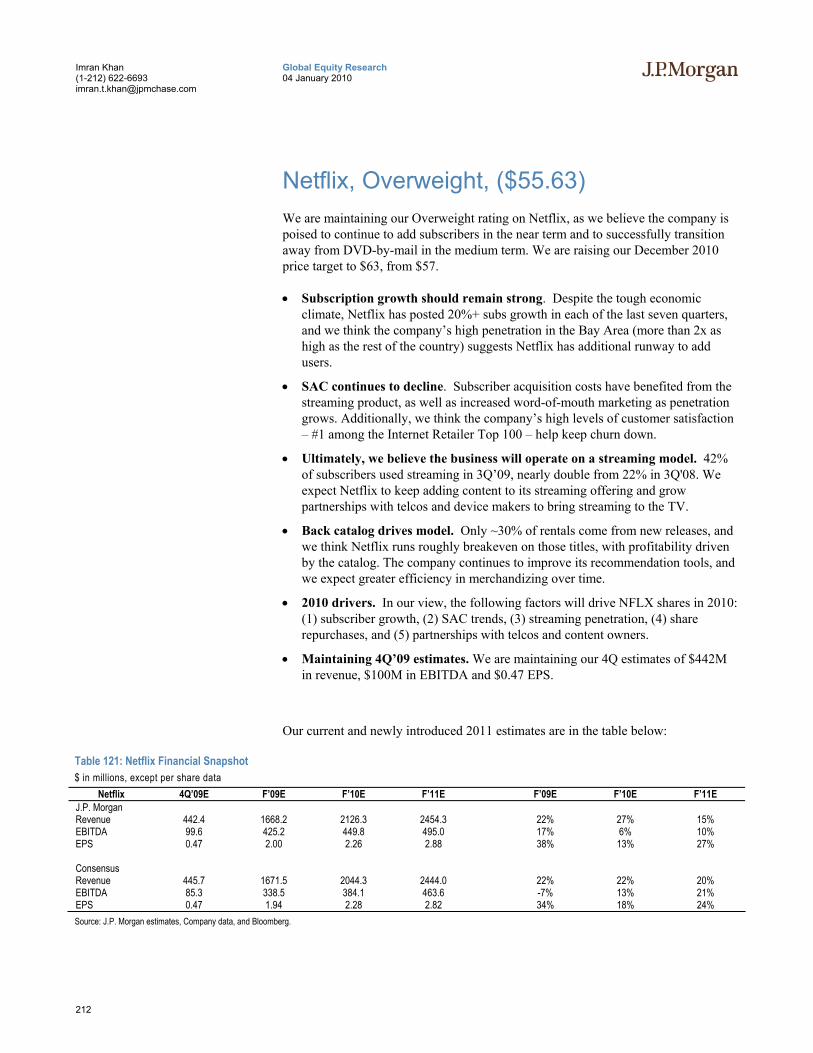
212
Global Equity Research 04 January 2010
Imran Khan (1-212) 622-6693 [email protected]
Netflix, Overweight, ($55.63) We are maintaining our Overweight rating on Netflix, as we believe the company is poised to continue to add subscribers in the near term and to successfully transition away from DVD-by-mail in the medium term. We are raising our December 2010 price target to $63, from $57.
• Subscription growth should remain strong. Despite the tough economic climate, Netflix has posted 20%+ subs growth in each of the last seven quarters, and we think the company’s high penetration in the Bay Area (more than 2x as high as the rest of the country) suggests Netflix has additional runway to add users.
• SAC continues to decline. Subscriber acquisition costs have benefited from the streaming product, as well as increased word-of-mouth marketing as penetration grows. Additionally, we think the company’s high levels of customer satisfaction – #1 among the Internet Retailer Top 100 – help keep churn down.
• Ultimately, we believe the business will operate on a streaming model. 42% of subscribers used streaming in 3Q’09, nearly double from 22% in 3Q'08. We expect Netflix to keep adding content to its streaming offering and grow partnerships with telcos and device makers to bring streaming to the TV.
• Back catalog drives model. Only ~30% of rentals come from new releases, and we think Netflix runs roughly breakeven on those titles, with profitability driven by the catalog. The company continues to improve its recommendation tools, and we expect greater efficiency in merchandizing over time.
• 2010 drivers. In our view, the following factors will drive NFLX shares in 2010: (1) subscriber growth, (2) SAC trends, (3) streaming penetration, (4) share repurchases, and (5) partnerships with telcos and content owners.
• Maintaining 4Q’09 estimates. We are maintaining our 4Q estimates of $442M in revenue, $100M in EBITDA and $0.47 EPS.
Our current and newly introduced 2011 estimates are in the table below:
Table 121: Netflix Financial Snapshot $ in millions, except per share data
Netflix 4Q’09E F’09E F’10E F’11E F’09E F’10E F’11E J.P. Morgan Revenue 442.4 1668.2 2126.3 2454.3 22% 27% 15% EBITDA 99.6 425.2 449.8 495.0 17% 6% 10% EPS 0.47 2.00 2.26 2.88 38% 13% 27%
Consensus Revenue 445.7 1671.5 2044.3 2444.0 22% 22% 20% EBITDA 85.3 338.5 384.1 463.6 -7% 13% 21% EPS 0.47 1.94 2.28 2.82 34% 18% 24% Source: J.P. Morgan estimates, Company data, and Bloomberg.

213
Global Equity Research 04 January 2010
Imran Khan (1-212) 622-6693 [email protected]
Our Estimates and Outlook for 2010 We are maintaining our 2010 estimates for revenue and customer metrics for Netflix. We believe the company’s partnership with Sony should drive some near-term uplift in new subscribers. We are modeling Netflix to close 2010 with ~14.5M subscribers. Our EBITDA estimate for 2010 is $450M.
Due to the recent issuance of $200M in senior notes, we have adjusted our F’10 EPS outlook. We expect Netflix to increase the pace of share buybacks with the proceeds of the debt offering; as such, the higher interest expense going forward is partly offset in its EPS impact by the lower share count; for F’10, we now expect EPS of $2.26, down from $2.36 previously.
Our Estimates and Outlook for 2011 We are introducing F’11 revenue and EPS estimates, as follows. We expect F’11 revenue of $2.45B, up an estimated 15% Y/Y. We believe the pace of customer additions is likely to slow somewhat in 2011. Nevertheless, we are modeling a 13% Y/Y rise, to 16.3M. We are projecting ~60 bps of pro forma operating margin improvement, driven partly by better scale as well as some fulfillment savings from the growth of the streaming product. Our model calls for $495M in EBITDA and $2.88 EPS.
Raising Price Target to $63 As a result of flowing our updated estimates through our DCF model, we are slightly increasing our December 2010 price target to $63, from $57. Our outlook calls for continued strong user growth at Netflix, and we think the company can benefit from lower churn as the economy begins to recover. We used a DCF with the following parameters to derive our NFLX price target:
Table 122: Key DCF Assumptions Equity beta 0.91 Risk free rate (10yr yield) 3.7% Risk premium 6.4% Cost of Equity 9.5% Cost of debt 8.5% Final debt ratio 5.0% Equity as a % Cap 95.0% WACC 9.4%
Source: Company Reports, Bloomberg, J.P. Morgan estimates.
Valuation and Rating Analysis Given the result of the DCF analysis above and our belief that Netflix is well positioned to benefit from trends in the movie rental industry, we rate the company Overweight. On an EV/EBITDA basis, Netflix trades at an 11% discount to peers (subscription businesses and online sellers) based on our F’09 estimate of $425M, and 3% discount to peers based on our F’10 estimate of $450M.
Risks to Our Rating Netflix stock could perform below our expectations if:
• The company is not able to manage future postal price increases effectively;

214
Global Equity Research 04 January 2010
Imran Khan (1-212) 622-6693 [email protected]
• The company is not able to strike deals with content owners to continue to expand its streaming catalog;
• Other competitors, such as Redbox, Blockbuster, Amazon or Apple, or sites like Hulu or YouTube, are able to offer more attractive customer offerings and thus take market share.
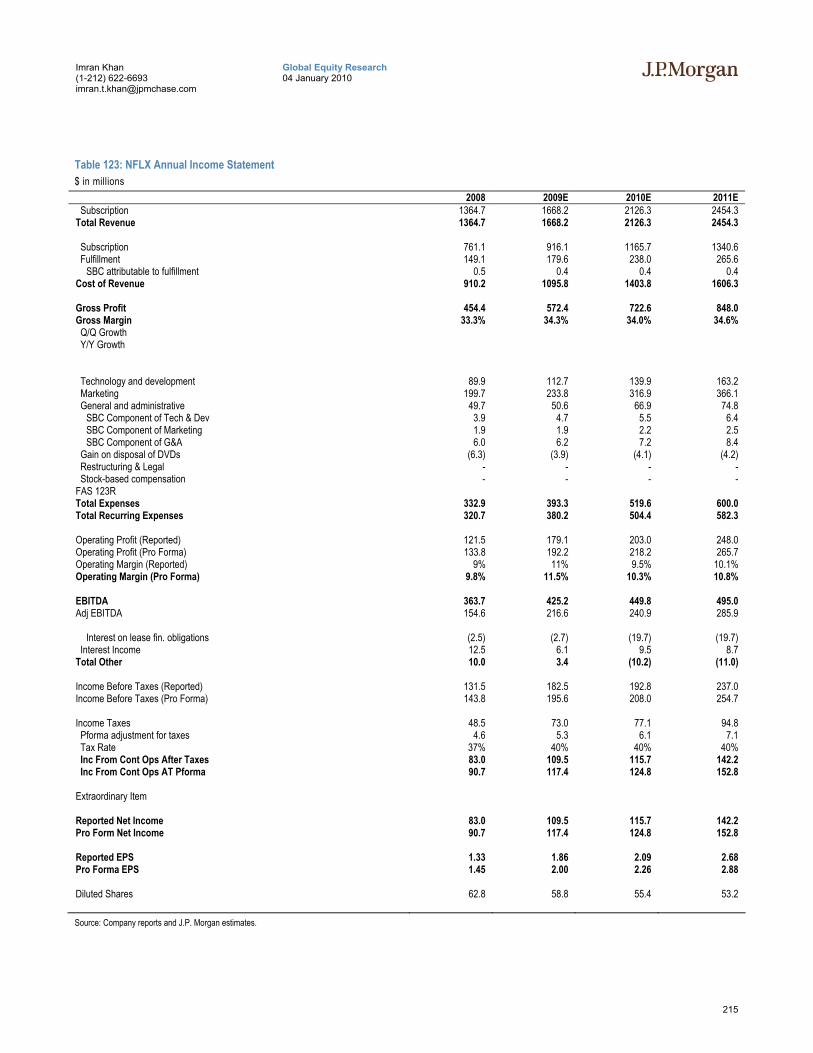
215
Global Equity Research 04 January 2010
Imran Khan (1-212) 622-6693 [email protected]
Table 123: NFLX Annual Income Statement $ in millions
2008 2009E 2010E 2011E Subscription 1364.7 1668.2 2126.3 2454.3 Total Revenue 1364.7 1668.2 2126.3 2454.3 Subscription 761.1 916.1 1165.7 1340.6 Fulfillment 149.1 179.6 238.0 265.6
SBC attributable to fulfillment 0.5 0.4 0.4 0.4 Cost of Revenue 910.2 1095.8 1403.8 1606.3 Gross Profit 454.4 572.4 722.6 848.0 Gross Margin 33.3% 34.3% 34.0% 34.6% Q/Q Growth Y/Y Growth Technology and development 89.9 112.7 139.9 163.2 Marketing 199.7 233.8 316.9 366.1 General and administrative 49.7 50.6 66.9 74.8
SBC Component of Tech & Dev 3.9 4.7 5.5 6.4 SBC Component of Marketing 1.9 1.9 2.2 2.5 SBC Component of G&A 6.0 6.2 7.2 8.4
Gain on disposal of DVDs (6.3) (3.9) (4.1) (4.2) Restructuring & Legal - - - - Stock-based compensation - - - - FAS 123R Total Expenses 332.9 393.3 519.6 600.0 Total Recurring Expenses 320.7 380.2 504.4 582.3 Operating Profit (Reported) 121.5 179.1 203.0 248.0 Operating Profit (Pro Forma) 133.8 192.2 218.2 265.7 Operating Margin (Reported) 9% 11% 9.5% 10.1% Operating Margin (Pro Forma) 9.8% 11.5% 10.3% 10.8% EBITDA 363.7 425.2 449.8 495.0 Adj EBITDA 154.6 216.6 240.9 285.9
Interest on lease fin. obligations (2.5) (2.7) (19.7) (19.7) Interest Income 12.5 6.1 9.5 8.7 Total Other 10.0 3.4 (10.2) (11.0) Income Before Taxes (Reported) 131.5 182.5 192.8 237.0 Income Before Taxes (Pro Forma) 143.8 195.6 208.0 254.7 Income Taxes 48.5 73.0 77.1 94.8 Pforma adjustment for taxes 4.6 5.3 6.1 7.1 Tax Rate 37% 40% 40% 40% Inc From Cont Ops After Taxes 83.0 109.5 115.7 142.2 Inc From Cont Ops AT Pforma 90.7 117.4 124.8 152.8 Extraordinary Item Reported Net Income 83.0 109.5 115.7 142.2 Pro Form Net Income 90.7 117.4 124.8 152.8 Reported EPS 1.33 1.86 2.09 2.68 Pro Forma EPS 1.45 2.00 2.26 2.88 Diluted Shares 62.8 58.8 55.4 53.2 Source: Company reports and J.P. Morgan estimates.
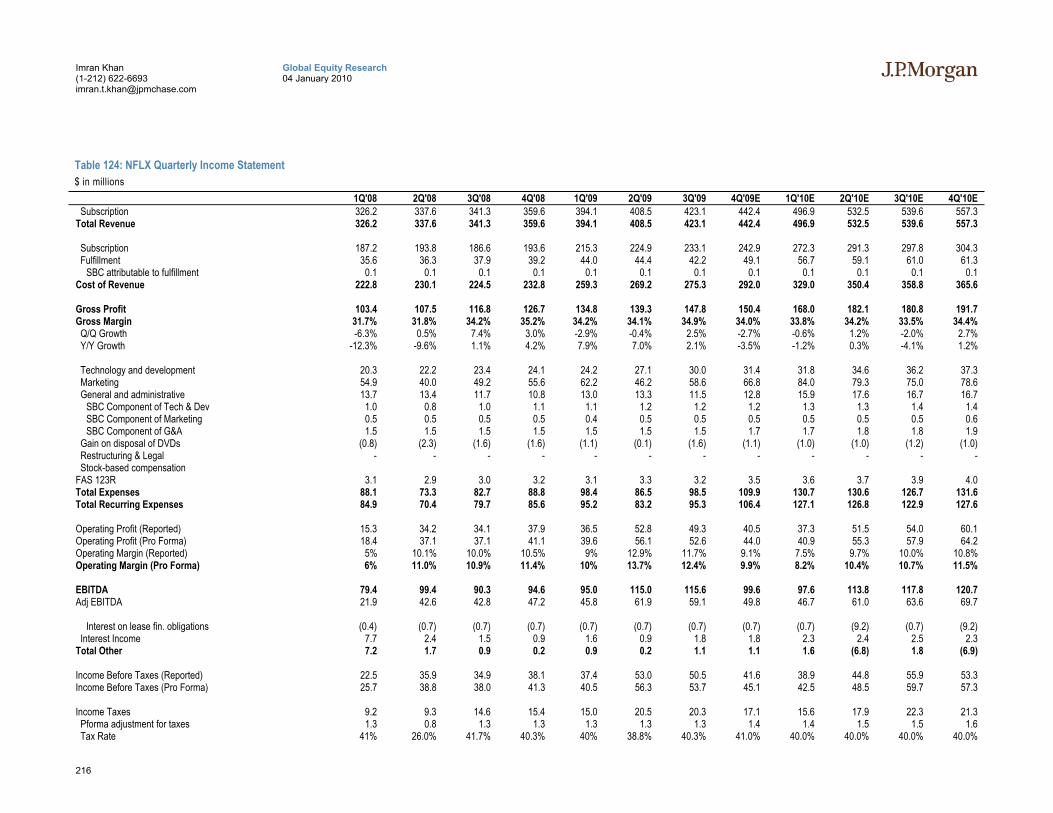
216
Global Equity Research 04 January 2010
Imran Khan (1-212) 622-6693 [email protected]
Table 124: NFLX Quarterly Income Statement $ in millions
1Q'08 2Q'08 3Q'08 4Q'08 1Q'09 2Q'09 3Q'09 4Q'09E 1Q'10E 2Q'10E 3Q'10E 4Q'10E Subscription 326.2 337.6 341.3 359.6 394.1 408.5 423.1 442.4 496.9 532.5 539.6 557.3 Total Revenue 326.2 337.6 341.3 359.6 394.1 408.5 423.1 442.4 496.9 532.5 539.6 557.3 Subscription 187.2 193.8 186.6 193.6 215.3 224.9 233.1 242.9 272.3 291.3 297.8 304.3 Fulfillment 35.6 36.3 37.9 39.2 44.0 44.4 42.2 49.1 56.7 59.1 61.0 61.3
SBC attributable to fulfillment 0.1 0.1 0.1 0.1 0.1 0.1 0.1 0.1 0.1 0.1 0.1 0.1 Cost of Revenue 222.8 230.1 224.5 232.8 259.3 269.2 275.3 292.0 329.0 350.4 358.8 365.6 Gross Profit 103.4 107.5 116.8 126.7 134.8 139.3 147.8 150.4 168.0 182.1 180.8 191.7 Gross Margin 31.7% 31.8% 34.2% 35.2% 34.2% 34.1% 34.9% 34.0% 33.8% 34.2% 33.5% 34.4% Q/Q Growth -6.3% 0.5% 7.4% 3.0% -2.9% -0.4% 2.5% -2.7% -0.6% 1.2% -2.0% 2.7% Y/Y Growth -12.3% -9.6% 1.1% 4.2% 7.9% 7.0% 2.1% -3.5% -1.2% 0.3% -4.1% 1.2% Technology and development 20.3 22.2 23.4 24.1 24.2 27.1 30.0 31.4 31.8 34.6 36.2 37.3 Marketing 54.9 40.0 49.2 55.6 62.2 46.2 58.6 66.8 84.0 79.3 75.0 78.6 General and administrative 13.7 13.4 11.7 10.8 13.0 13.3 11.5 12.8 15.9 17.6 16.7 16.7
SBC Component of Tech & Dev 1.0 0.8 1.0 1.1 1.1 1.2 1.2 1.2 1.3 1.3 1.4 1.4 SBC Component of Marketing 0.5 0.5 0.5 0.5 0.4 0.5 0.5 0.5 0.5 0.5 0.5 0.6 SBC Component of G&A 1.5 1.5 1.5 1.5 1.5 1.5 1.5 1.7 1.7 1.8 1.8 1.9
Gain on disposal of DVDs (0.8) (2.3) (1.6) (1.6) (1.1) (0.1) (1.6) (1.1) (1.0) (1.0) (1.2) (1.0) Restructuring & Legal - - - - - - - - - - - - Stock-based compensation FAS 123R 3.1 2.9 3.0 3.2 3.1 3.3 3.2 3.5 3.6 3.7 3.9 4.0 Total Expenses 88.1 73.3 82.7 88.8 98.4 86.5 98.5 109.9 130.7 130.6 126.7 131.6 Total Recurring Expenses 84.9 70.4 79.7 85.6 95.2 83.2 95.3 106.4 127.1 126.8 122.9 127.6 Operating Profit (Reported) 15.3 34.2 34.1 37.9 36.5 52.8 49.3 40.5 37.3 51.5 54.0 60.1 Operating Profit (Pro Forma) 18.4 37.1 37.1 41.1 39.6 56.1 52.6 44.0 40.9 55.3 57.9 64.2 Operating Margin (Reported) 5% 10.1% 10.0% 10.5% 9% 12.9% 11.7% 9.1% 7.5% 9.7% 10.0% 10.8% Operating Margin (Pro Forma) 6% 11.0% 10.9% 11.4% 10% 13.7% 12.4% 9.9% 8.2% 10.4% 10.7% 11.5% EBITDA 79.4 99.4 90.3 94.6 95.0 115.0 115.6 99.6 97.6 113.8 117.8 120.7 Adj EBITDA 21.9 42.6 42.8 47.2 45.8 61.9 59.1 49.8 46.7 61.0 63.6 69.7
Interest on lease fin. obligations (0.4) (0.7) (0.7) (0.7) (0.7) (0.7) (0.7) (0.7) (0.7) (9.2) (0.7) (9.2) Interest Income 7.7 2.4 1.5 0.9 1.6 0.9 1.8 1.8 2.3 2.4 2.5 2.3 Total Other 7.2 1.7 0.9 0.2 0.9 0.2 1.1 1.1 1.6 (6.8) 1.8 (6.9) Income Before Taxes (Reported) 22.5 35.9 34.9 38.1 37.4 53.0 50.5 41.6 38.9 44.8 55.9 53.3 Income Before Taxes (Pro Forma) 25.7 38.8 38.0 41.3 40.5 56.3 53.7 45.1 42.5 48.5 59.7 57.3 Income Taxes 9.2 9.3 14.6 15.4 15.0 20.5 20.3 17.1 15.6 17.9 22.3 21.3 Pforma adjustment for taxes 1.3 0.8 1.3 1.3 1.3 1.3 1.3 1.4 1.4 1.5 1.5 1.6 Tax Rate 41% 26.0% 41.7% 40.3% 40% 38.8% 40.3% 41.0% 40.0% 40.0% 40.0% 40.0%
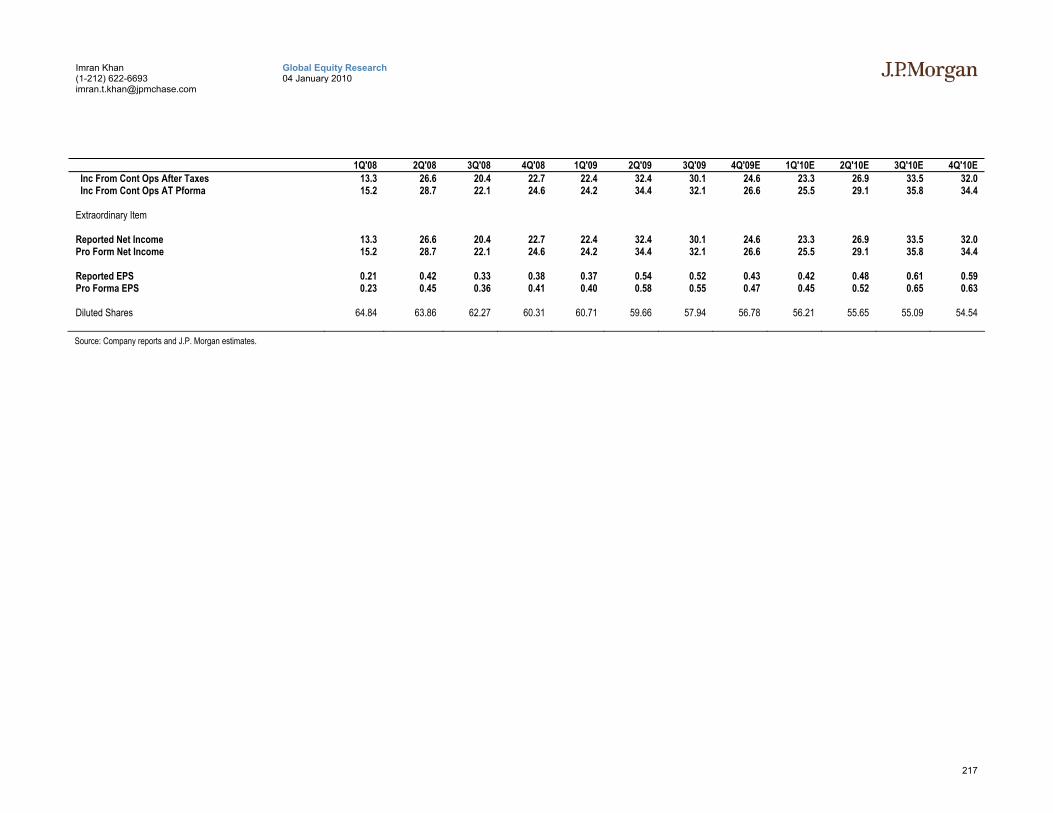
217
Global Equity Research 04 January 2010
Imran Khan (1-212) 622-6693 [email protected]
1Q'08 2Q'08 3Q'08 4Q'08 1Q'09 2Q'09 3Q'09 4Q'09E 1Q'10E 2Q'10E 3Q'10E 4Q'10E Inc From Cont Ops After Taxes 13.3 26.6 20.4 22.7 22.4 32.4 30.1 24.6 23.3 26.9 33.5 32.0 Inc From Cont Ops AT Pforma 15.2 28.7 22.1 24.6 24.2 34.4 32.1 26.6 25.5 29.1 35.8 34.4 Extraordinary Item Reported Net Income 13.3 26.6 20.4 22.7 22.4 32.4 30.1 24.6 23.3 26.9 33.5 32.0 Pro Form Net Income 15.2 28.7 22.1 24.6 24.2 34.4 32.1 26.6 25.5 29.1 35.8 34.4 Reported EPS 0.21 0.42 0.33 0.38 0.37 0.54 0.52 0.43 0.42 0.48 0.61 0.59 Pro Forma EPS 0.23 0.45 0.36 0.41 0.40 0.58 0.55 0.47 0.45 0.52 0.65 0.63 Diluted Shares 64.84 63.86 62.27 60.31 60.71 59.66 57.94 56.78 56.21 55.65 55.09 54.54 Source: Company reports and J.P. Morgan estimates.
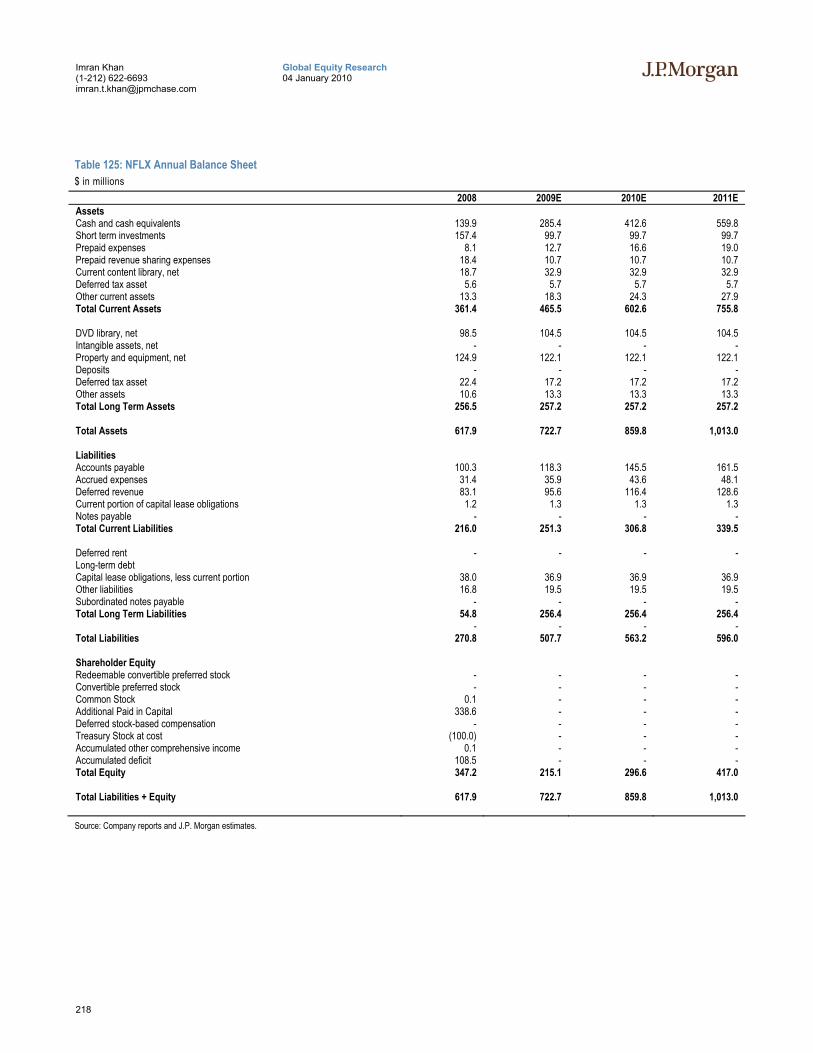
218
Global Equity Research 04 January 2010
Imran Khan (1-212) 622-6693 [email protected]
Table 125: NFLX Annual Balance Sheet $ in millions
2008 2009E 2010E 2011E Assets Cash and cash equivalents 139.9 285.4 412.6 559.8 Short term investments 157.4 99.7 99.7 99.7 Prepaid expenses 8.1 12.7 16.6 19.0 Prepaid revenue sharing expenses 18.4 10.7 10.7 10.7 Current content library, net 18.7 32.9 32.9 32.9 Deferred tax asset 5.6 5.7 5.7 5.7 Other current assets 13.3 18.3 24.3 27.9 Total Current Assets 361.4 465.5 602.6 755.8 DVD library, net 98.5 104.5 104.5 104.5 Intangible assets, net - - - - Property and equipment, net 124.9 122.1 122.1 122.1 Deposits - - - - Deferred tax asset 22.4 17.2 17.2 17.2 Other assets 10.6 13.3 13.3 13.3 Total Long Term Assets 256.5 257.2 257.2 257.2 Total Assets 617.9 722.7 859.8 1,013.0 Liabilities Accounts payable 100.3 118.3 145.5 161.5 Accrued expenses 31.4 35.9 43.6 48.1 Deferred revenue 83.1 95.6 116.4 128.6 Current portion of capital lease obligations 1.2 1.3 1.3 1.3 Notes payable - - - - Total Current Liabilities 216.0 251.3 306.8 339.5 Deferred rent - - - - Long-term debt Capital lease obligations, less current portion 38.0 36.9 36.9 36.9 Other liabilities 16.8 19.5 19.5 19.5 Subordinated notes payable - - - - Total Long Term Liabilities 54.8 256.4 256.4 256.4 - - - - Total Liabilities 270.8 507.7 563.2 596.0 Shareholder Equity Redeemable convertible preferred stock - - - - Convertible preferred stock - - - - Common Stock 0.1 - - - Additional Paid in Capital 338.6 - - - Deferred stock-based compensation - - - - Treasury Stock at cost (100.0) - - - Accumulated other comprehensive income 0.1 - - - Accumulated deficit 108.5 - - - Total Equity 347.2 215.1 296.6 417.0 Total Liabilities + Equity 617.9 722.7 859.8 1,013.0 Source: Company reports and J.P. Morgan estimates.
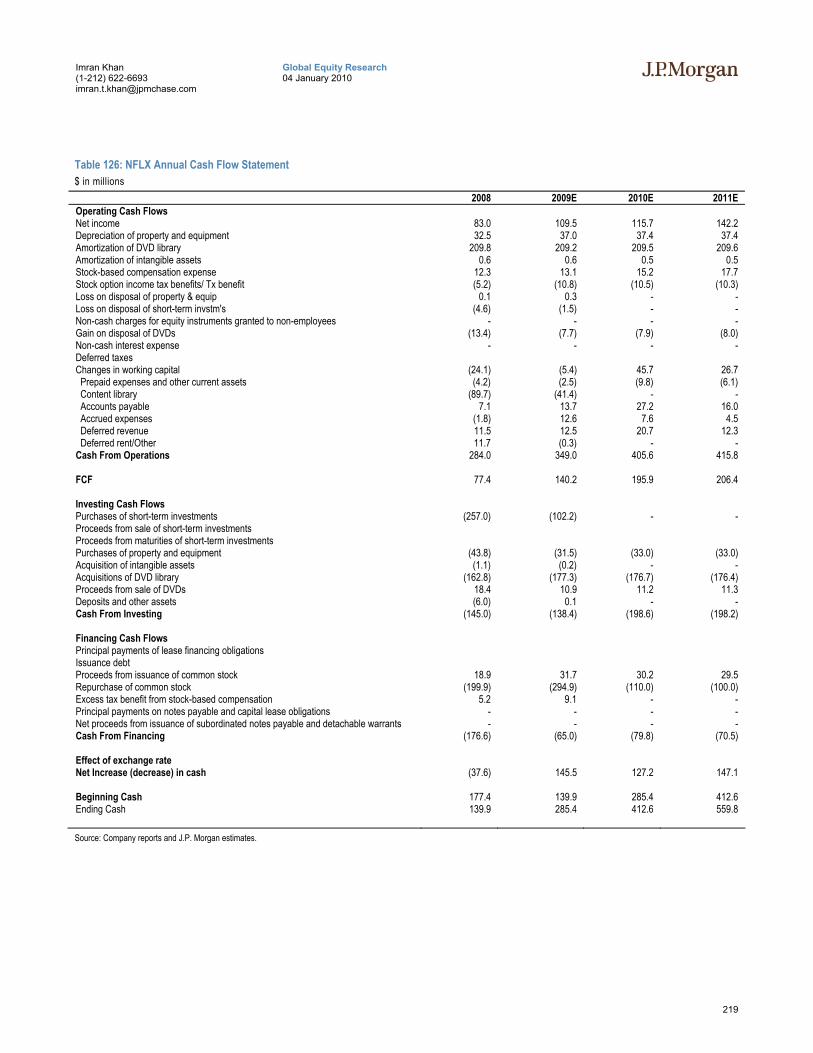
219
Global Equity Research 04 January 2010
Imran Khan (1-212) 622-6693 [email protected]
Table 126: NFLX Annual Cash Flow Statement $ in millions
2008 2009E 2010E 2011E Operating Cash Flows Net income 83.0 109.5 115.7 142.2 Depreciation of property and equipment 32.5 37.0 37.4 37.4 Amortization of DVD library 209.8 209.2 209.5 209.6 Amortization of intangible assets 0.6 0.6 0.5 0.5 Stock-based compensation expense 12.3 13.1 15.2 17.7 Stock option income tax benefits/ Tx benefit (5.2) (10.8) (10.5) (10.3) Loss on disposal of property & equip 0.1 0.3 - - Loss on disposal of short-term invstm's (4.6) (1.5) - - Non-cash charges for equity instruments granted to non-employees - - - - Gain on disposal of DVDs (13.4) (7.7) (7.9) (8.0) Non-cash interest expense - - - - Deferred taxes Changes in working capital (24.1) (5.4) 45.7 26.7 Prepaid expenses and other current assets (4.2) (2.5) (9.8) (6.1) Content library (89.7) (41.4) - - Accounts payable 7.1 13.7 27.2 16.0 Accrued expenses (1.8) 12.6 7.6 4.5 Deferred revenue 11.5 12.5 20.7 12.3 Deferred rent/Other 11.7 (0.3) - - Cash From Operations 284.0 349.0 405.6 415.8 FCF 77.4 140.2 195.9 206.4 Investing Cash Flows Purchases of short-term investments (257.0) (102.2) - - Proceeds from sale of short-term investments Proceeds from maturities of short-term investments Purchases of property and equipment (43.8) (31.5) (33.0) (33.0) Acquisition of intangible assets (1.1) (0.2) - - Acquisitions of DVD library (162.8) (177.3) (176.7) (176.4) Proceeds from sale of DVDs 18.4 10.9 11.2 11.3 Deposits and other assets (6.0) 0.1 - - Cash From Investing (145.0) (138.4) (198.6) (198.2) Financing Cash Flows Principal payments of lease financing obligations Issuance debt Proceeds from issuance of common stock 18.9 31.7 30.2 29.5 Repurchase of common stock (199.9) (294.9) (110.0) (100.0) Excess tax benefit from stock-based compensation 5.2 9.1 - - Principal payments on notes payable and capital lease obligations - - - - Net proceeds from issuance of subordinated notes payable and detachable warrants - - - - Cash From Financing (176.6) (65.0) (79.8) (70.5) Effect of exchange rate Net Increase (decrease) in cash (37.6) 145.5 127.2 147.1 Beginning Cash 177.4 139.9 285.4 412.6 Ending Cash 139.9 285.4 412.6 559.8 Source: Company reports and J.P. Morgan estimates.
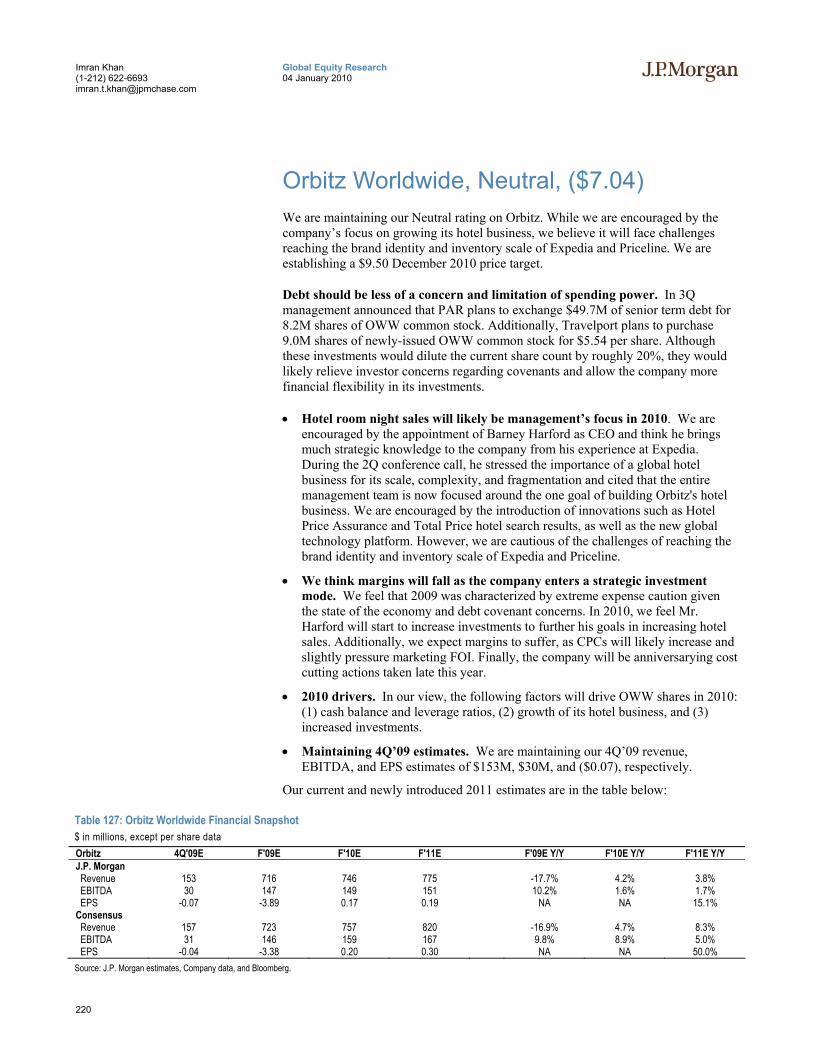
220
Global Equity Research 04 January 2010
Imran Khan (1-212) 622-6693 [email protected]
Orbitz Worldwide, Neutral, ($7.04) We are maintaining our Neutral rating on Orbitz. While we are encouraged by the company’s focus on growing its hotel business, we believe it will face challenges reaching the brand identity and inventory scale of Expedia and Priceline. We are establishing a $9.50 December 2010 price target.
Debt should be less of a concern and limitation of spending power. In 3Q management announced that PAR plans to exchange $49.7M of senior term debt for 8.2M shares of OWW common stock. Additionally, Travelport plans to purchase 9.0M shares of newly-issued OWW common stock for $5.54 per share. Although these investments would dilute the current share count by roughly 20%, they would likely relieve investor concerns regarding covenants and allow the company more financial flexibility in its investments.
• Hotel room night sales will likely be management’s focus in 2010. We are encouraged by the appointment of Barney Harford as CEO and think he brings much strategic knowledge to the company from his experience at Expedia. During the 2Q conference call, he stressed the importance of a global hotel business for its scale, complexity, and fragmentation and cited that the entire management team is now focused around the one goal of building Orbitz's hotel business. We are encouraged by the introduction of innovations such as Hotel Price Assurance and Total Price hotel search results, as well as the new global technology platform. However, we are cautious of the challenges of reaching the brand identity and inventory scale of Expedia and Priceline.
• We think margins will fall as the company enters a strategic investment mode. We feel that 2009 was characterized by extreme expense caution given the state of the economy and debt covenant concerns. In 2010, we feel Mr. Harford will start to increase investments to further his goals in increasing hotel sales. Additionally, we expect margins to suffer, as CPCs will likely increase and slightly pressure marketing FOI. Finally, the company will be anniversarying cost cutting actions taken late this year.
• 2010 drivers. In our view, the following factors will drive OWW shares in 2010: (1) cash balance and leverage ratios, (2) growth of its hotel business, and (3) increased investments.
• Maintaining 4Q’09 estimates. We are maintaining our 4Q’09 revenue, EBITDA, and EPS estimates of $153M, $30M, and ($0.07), respectively.
Our current and newly introduced 2011 estimates are in the table below:
Table 127: Orbitz Worldwide Financial Snapshot $ in millions, except per share data Orbitz 4Q'09E F'09E F'10E F'11E F'09E Y/Y F'10E Y/Y F'11E Y/Y J.P. Morgan Revenue 153 716 746 775 -17.7% 4.2% 3.8% EBITDA 30 147 149 151 10.2% 1.6% 1.7% EPS -0.07 -3.89 0.17 0.19 NA NA 15.1% Consensus Revenue 157 723 757 820 -16.9% 4.7% 8.3% EBITDA 31 146 159 167 9.8% 8.9% 5.0% EPS -0.04 -3.38 0.20 0.30 NA NA 50.0% Source: J.P. Morgan estimates, Company data, and Bloomberg.
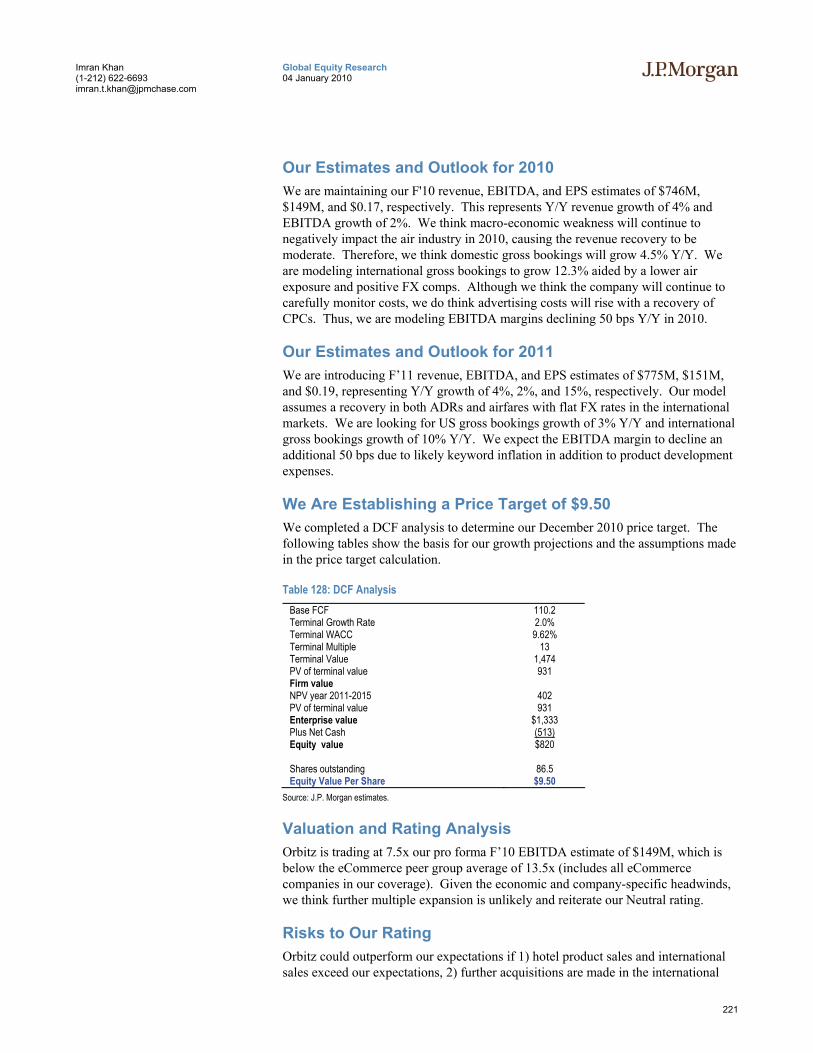
221
Global Equity Research 04 January 2010
Imran Khan (1-212) 622-6693 [email protected]
Our Estimates and Outlook for 2010 We are maintaining our F'10 revenue, EBITDA, and EPS estimates of $746M, $149M, and $0.17, respectively. This represents Y/Y revenue growth of 4% and EBITDA growth of 2%. We think macro-economic weakness will continue to negatively impact the air industry in 2010, causing the revenue recovery to be moderate. Therefore, we think domestic gross bookings will grow 4.5% Y/Y. We are modeling international gross bookings to grow 12.3% aided by a lower air exposure and positive FX comps. Although we think the company will continue to carefully monitor costs, we do think advertising costs will rise with a recovery of CPCs. Thus, we are modeling EBITDA margins declining 50 bps Y/Y in 2010.
Our Estimates and Outlook for 2011 We are introducing F’11 revenue, EBITDA, and EPS estimates of $775M, $151M, and $0.19, representing Y/Y growth of 4%, 2%, and 15%, respectively. Our model assumes a recovery in both ADRs and airfares with flat FX rates in the international markets. We are looking for US gross bookings growth of 3% Y/Y and international gross bookings growth of 10% Y/Y. We expect the EBITDA margin to decline an additional 50 bps due to likely keyword inflation in addition to product development expenses.
We Are Establishing a Price Target of $9.50 We completed a DCF analysis to determine our December 2010 price target. The following tables show the basis for our growth projections and the assumptions made in the price target calculation.
Table 128: DCF Analysis Base FCF 110.2 Terminal Growth Rate 2.0% Terminal WACC 9.62% Terminal Multiple 13 Terminal Value 1,474 PV of terminal value 931 Firm value NPV year 2011-2015 402 PV of terminal value 931 Enterprise value $1,333 Plus Net Cash (513) Equity value $820 Shares outstanding 86.5 Equity Value Per Share $9.50
Source: J.P. Morgan estimates.
Valuation and Rating Analysis Orbitz is trading at 7.5x our pro forma F’10 EBITDA estimate of $149M, which is below the eCommerce peer group average of 13.5x (includes all eCommerce companies in our coverage). Given the economic and company-specific headwinds, we think further multiple expansion is unlikely and reiterate our Neutral rating.
Risks to Our Rating Orbitz could outperform our expectations if 1) hotel product sales and international sales exceed our expectations, 2) further acquisitions are made in the international

222
Global Equity Research 04 January 2010
Imran Khan (1-212) 622-6693 [email protected]
space, 3) the company gains market share against its existing online travel agent competitors, or 4) the online travel market achieves penetration levels beyond our current expectations.
The company’s shares could under-perform if the company is unable to 1) withstand the competitive threat that the travel suppliers and travel search engines pose, 2) maintain its domestic leadership position, 3) economic conditions hinder top-line growth, 4) if it is unable to successfully expand into the international market or increase hotel sales, and 5) if it violates its debt covenants or they hinder operational strategies.
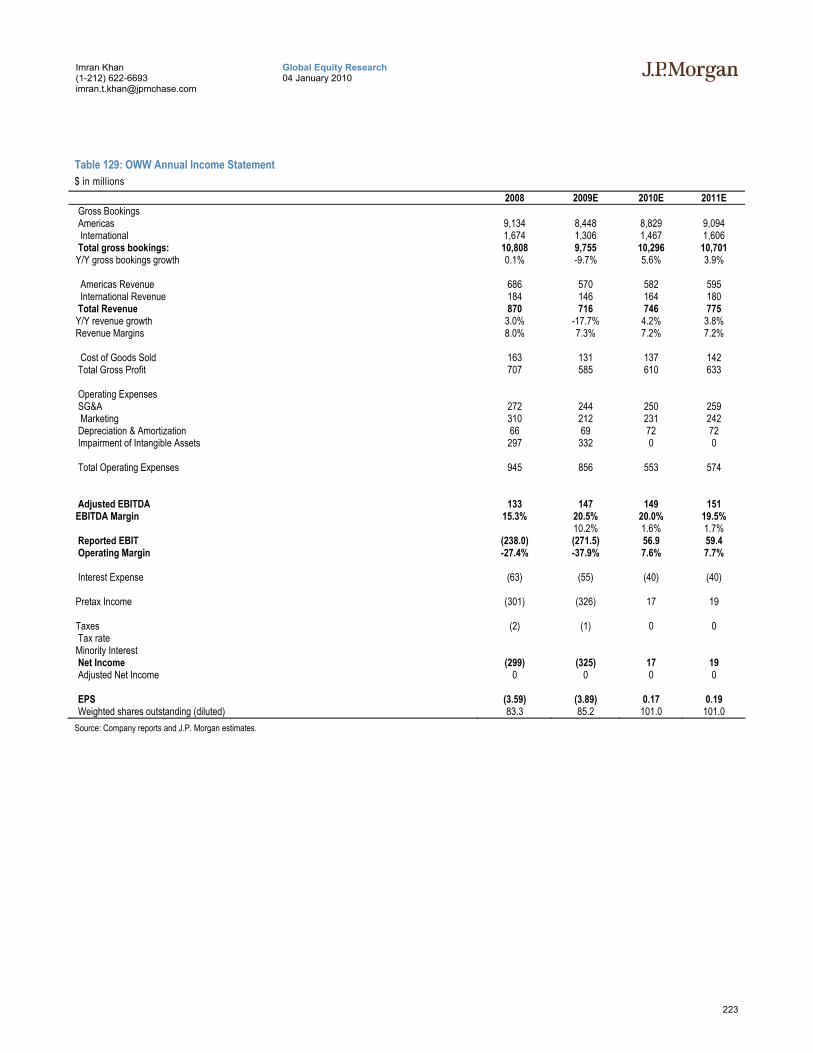
223
Global Equity Research 04 January 2010
Imran Khan (1-212) 622-6693 [email protected]
Table 129: OWW Annual Income Statement $ in millions
2008 2009E 2010E 2011E Gross Bookings Americas 9,134 8,448 8,829 9,094 International 1,674 1,306 1,467 1,606 Total gross bookings: 10,808 9,755 10,296 10,701 Y/Y gross bookings growth 0.1% -9.7% 5.6% 3.9% Americas Revenue 686 570 582 595 International Revenue 184 146 164 180 Total Revenue 870 716 746 775 Y/Y revenue growth 3.0% -17.7% 4.2% 3.8% Revenue Margins 8.0% 7.3% 7.2% 7.2% Cost of Goods Sold 163 131 137 142 Total Gross Profit 707 585 610 633 Operating Expenses SG&A 272 244 250 259 Marketing 310 212 231 242 Depreciation & Amortization 66 69 72 72 Impairment of Intangible Assets 297 332 0 0 Total Operating Expenses 945 856 553 574 Adjusted EBITDA 133 147 149 151 EBITDA Margin 15.3% 20.5% 20.0% 19.5% 10.2% 1.6% 1.7% Reported EBIT (238.0) (271.5) 56.9 59.4 Operating Margin -27.4% -37.9% 7.6% 7.7% Interest Expense (63) (55) (40) (40) Pretax Income (301) (326) 17 19 Taxes (2) (1) 0 0 Tax rate Minority Interest Net Income (299) (325) 17 19 Adjusted Net Income 0 0 0 0 EPS (3.59) (3.89) 0.17 0.19 Weighted shares outstanding (diluted) 83.3 85.2 101.0 101.0 Source: Company reports and J.P. Morgan estimates.

224
Global Equity Research 04 January 2010
Imran Khan (1-212) 622-6693 [email protected]
Table 130: OWW Quarterly Income Statement $ in millions
1Q08 2Q08 3Q08 4Q08 1Q09 2Q09 3Q09 4Q09E 1Q10E 2Q10E 3Q10E 4Q10E Gross Bookings Americas 2,387 2,567 2,313 1,867 2,069 2,332 2,199 1,848 2,131 2,449 2,309 1,941 International 488 476 421 289 314 346 366 280 345 391 414 317 Total gross bookings: 2,875 3,043 2,734 2,156 2,383 2,678 2,565 2,129 2,476 2,840 2,723 2,258 Q/Q gross bookings growth 22.0% 5.8% -10.2% -21.1% 10.5% 12.4% -4.2% -17.0% 16.3% 14.7% -4.1% -17.1% Y/Y gross bookings growth 0.0% 3.6% 4.2% -8.5% -17.1% -12.0% -6.2% -1.3% 3.9% 6.0% 6.1% 6.1% Americas Revenue 168 178 187 153 157 149 144 120 149 157 150 126 International Revenue 51 53 53 27 31 39 43 33 35 43 49 37 Total Revenue 219 231 240 180 188 188 187 153 184 200 199 164 Y/Y revenue growth 6.8% 3.4% 9.6% -8.6% -14.2% -18.6% -22.1% -15.0% -2.3% 6.4% 6.4% 6.9% Revenue Margins 7.6% 7.6% 8.8% 8.3% 7.9% 7.0% 7.3% 7.2% 7.4% 7.0% 7.3% 7.2% Cost of Goods Sold 43 46 41 33 35 34 34 28 34 36 36 30 Total Gross Profit 176 185 199 147 153 154 153 125 150 164 163 134 Operating Expenses SG&A 77 72 75 48 66 59 65 54 64 63 65 57 Marketing 85 81 86 58 64 54 48 46 62 60 60 49 Depreciation & Amortization 15 17 17 17 14 19 18 18 18 18 18 18 Impairment of Intangible Assets - - 297 - 332 - - - - - - - Total Operating Expenses 177 170 475 123 476 132 131 117 145 141 143 124 Adjusted EBITDA 20.0 37.0 43.0 33.0 28.0 45.0 44.0 29.5 27.8 46.0 42.8 32.3 EBITDA Margin 9.1% 16.0% 17.9% 18.3% 14.9% 23.9% 23.5% 19.3% 15.1% 23.0% 21.5% 19.8% Reported EBIT (1) 15 (276) 24 (323) 22 22 8 5 23 20 9 Operating Margin -0.5% 6.5% -115.0% 13.3% -171.8% 11.7% 11.8% 4.9% 2.6% 11.5% 9.9% 5.7% Interest Expense (16) (15) (16) (16) (15) (12) (14) (14) (10) (10) (10) (10) Pretax Income (17) - (292) 8 (338) 10 8 (6) (5) 13 10 (1) Taxes (2) 5 (5) - (2) - 1 - - - - - Tax rate nm nm nm nm nm nm nm nm nm nm nm nm Minority Interest Net Income (15) (5) (287) 8 (336) 10 7 (6) (5) 13 10 (1) EPS (0.18) (0.06) (3.44) 0.10 (4.02) 0.12 0.08 (0.07) (0.05) 0.13 0.10 (0.01) Weighted shares outstanding (diluted) 83.2 83.2 83.4 83.5 83.6 84.2 86.5 86.5 101.0 101.0 101.0 101.0 Source: Company reports and J.P. Morgan estimates.
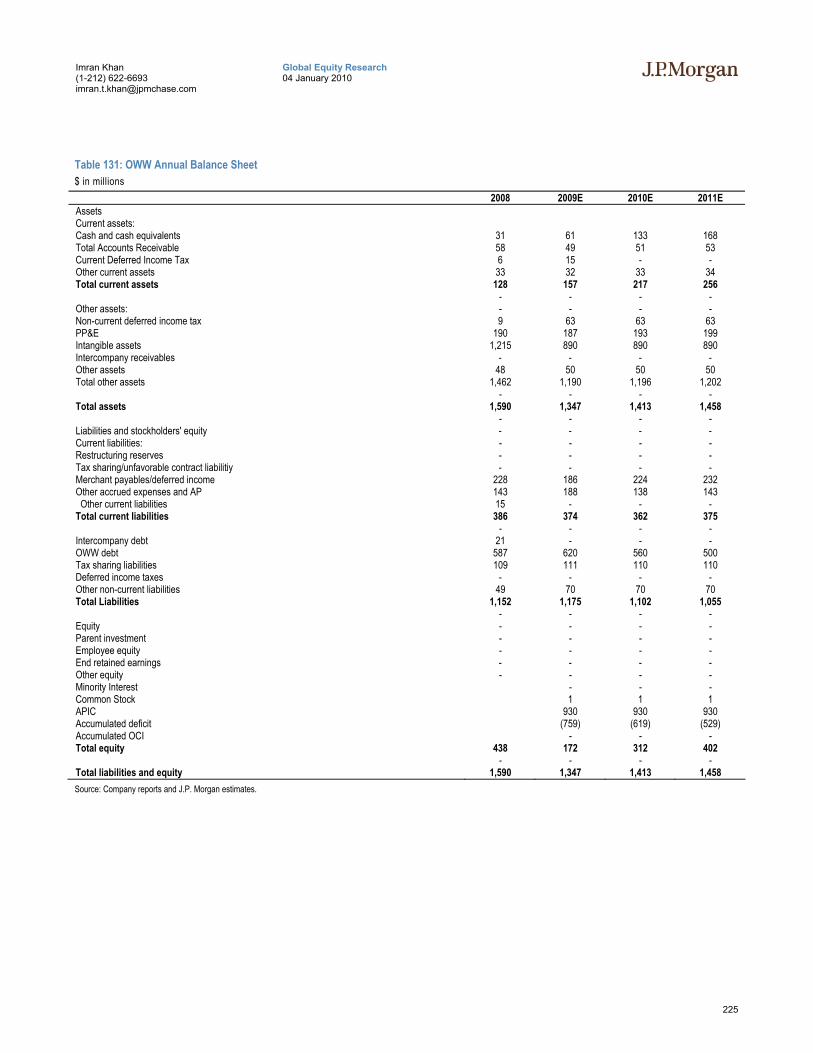
225
Global Equity Research 04 January 2010
Imran Khan (1-212) 622-6693 [email protected]
Table 131: OWW Annual Balance Sheet $ in millions
2008 2009E 2010E 2011E Assets Current assets: Cash and cash equivalents 31 61 133 168 Total Accounts Receivable 58 49 51 53 Current Deferred Income Tax 6 15 - - Other current assets 33 32 33 34 Total current assets 128 157 217 256 - - - - Other assets: - - - - Non-current deferred income tax 9 63 63 63 PP&E 190 187 193 199 Intangible assets 1,215 890 890 890 Intercompany receivables - - - - Other assets 48 50 50 50 Total other assets 1,462 1,190 1,196 1,202 - - - - Total assets 1,590 1,347 1,413 1,458 - - - - Liabilities and stockholders' equity - - - - Current liabilities: - - - - Restructuring reserves - - - - Tax sharing/unfavorable contract liabilitiy - - - - Merchant payables/deferred income 228 186 224 232 Other accrued expenses and AP 143 188 138 143 Other current liabilities 15 - - - Total current liabilities 386 374 362 375 - - - - Intercompany debt 21 - - - OWW debt 587 620 560 500 Tax sharing liabilities 109 111 110 110 Deferred income taxes - - - - Other non-current liabilities 49 70 70 70 Total Liabilities 1,152 1,175 1,102 1,055 - - - - Equity - - - - Parent investment - - - - Employee equity - - - - End retained earnings - - - - Other equity - - - - Minority Interest - - - Common Stock 1 1 1 APIC 930 930 930 Accumulated deficit (759) (619) (529) Accumulated OCI - - - Total equity 438 172 312 402 - - - - Total liabilities and equity 1,590 1,347 1,413 1,458 Source: Company reports and J.P. Morgan estimates.
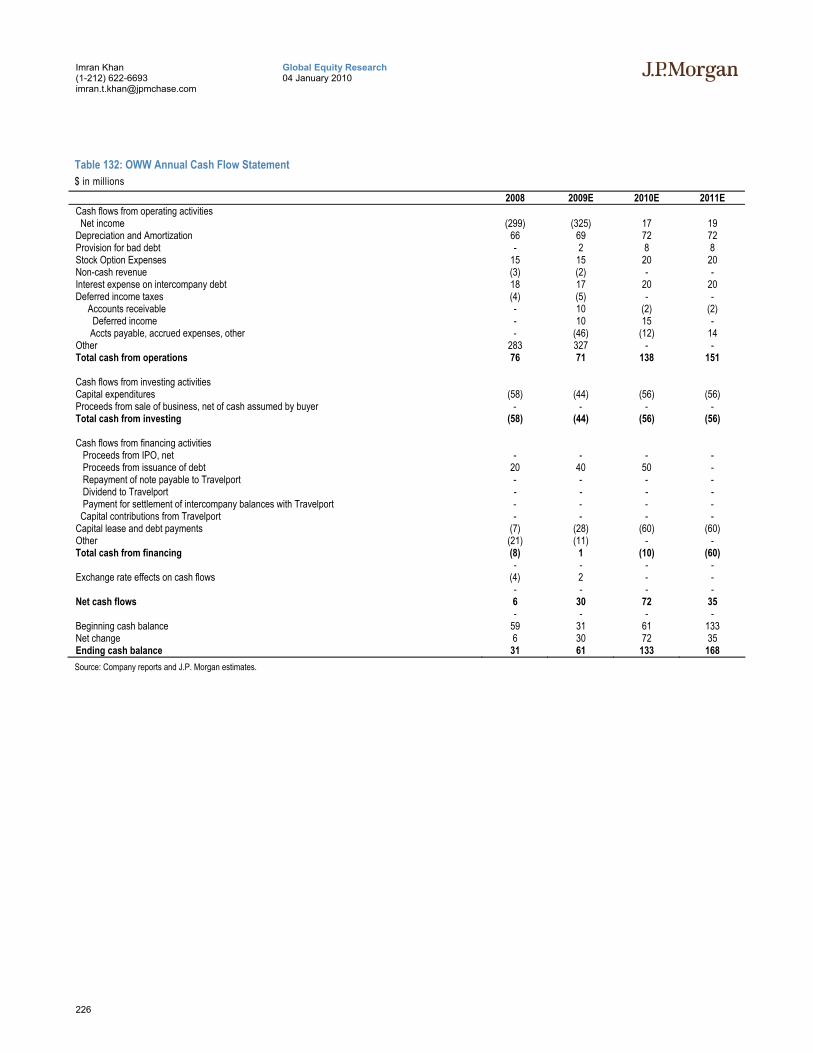
226
Global Equity Research 04 January 2010
Imran Khan (1-212) 622-6693 [email protected]
Table 132: OWW Annual Cash Flow Statement $ in millions
2008 2009E 2010E 2011E Cash flows from operating activities Net income (299) (325) 17 19 Depreciation and Amortization 66 69 72 72 Provision for bad debt - 2 8 8 Stock Option Expenses 15 15 20 20 Non-cash revenue (3) (2) - - Interest expense on intercompany debt 18 17 20 20 Deferred income taxes (4) (5) - - Accounts receivable - 10 (2) (2) Deferred income - 10 15 - Accts payable, accrued expenses, other - (46) (12) 14 Other 283 327 - - Total cash from operations 76 71 138 151 Cash flows from investing activities Capital expenditures (58) (44) (56) (56) Proceeds from sale of business, net of cash assumed by buyer - - - - Total cash from investing (58) (44) (56) (56) Cash flows from financing activities Proceeds from IPO, net - - - - Proceeds from issuance of debt 20 40 50 - Repayment of note payable to Travelport - - - - Dividend to Travelport - - - - Payment for settlement of intercompany balances with Travelport - - - - Capital contributions from Travelport - - - - Capital lease and debt payments (7) (28) (60) (60) Other (21) (11) - - Total cash from financing (8) 1 (10) (60) - - - - Exchange rate effects on cash flows (4) 2 - - - - - - Net cash flows 6 30 72 35 - - - - Beginning cash balance 59 31 61 133 Net change 6 30 72 35 Ending cash balance 31 61 133 168 Source: Company reports and J.P. Morgan estimates.
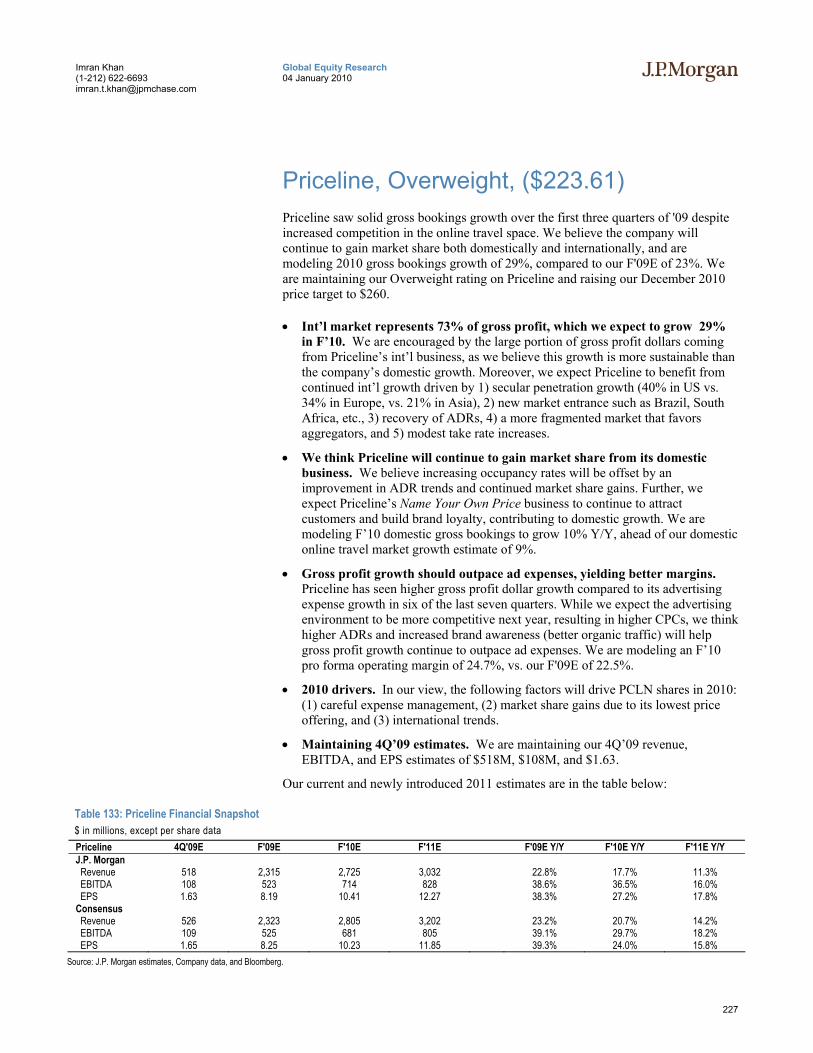
227
Global Equity Research 04 January 2010
Imran Khan (1-212) 622-6693 [email protected]
Priceline, Overweight, ($223.61) Priceline saw solid gross bookings growth over the first three quarters of '09 despite increased competition in the online travel space. We believe the company will continue to gain market share both domestically and internationally, and are modeling 2010 gross bookings growth of 29%, compared to our F'09E of 23%. We are maintaining our Overweight rating on Priceline and raising our December 2010 price target to $260.
• Int’l market represents 73% of gross profit, which we expect to grow 29% in F’10. We are encouraged by the large portion of gross profit dollars coming from Priceline’s int’l business, as we believe this growth is more sustainable than the company’s domestic growth. Moreover, we expect Priceline to benefit from continued int’l growth driven by 1) secular penetration growth (40% in US vs. 34% in Europe, vs. 21% in Asia), 2) new market entrance such as Brazil, South Africa, etc., 3) recovery of ADRs, 4) a more fragmented market that favors aggregators, and 5) modest take rate increases.
• We think Priceline will continue to gain market share from its domestic business. We believe increasing occupancy rates will be offset by an improvement in ADR trends and continued market share gains. Further, we expect Priceline’s Name Your Own Price business to continue to attract customers and build brand loyalty, contributing to domestic growth. We are modeling F’10 domestic gross bookings to grow 10% Y/Y, ahead of our domestic online travel market growth estimate of 9%.
• Gross profit growth should outpace ad expenses, yielding better margins. Priceline has seen higher gross profit dollar growth compared to its advertising expense growth in six of the last seven quarters. While we expect the advertising environment to be more competitive next year, resulting in higher CPCs, we think higher ADRs and increased brand awareness (better organic traffic) will help gross profit growth continue to outpace ad expenses. We are modeling an F’10 pro forma operating margin of 24.7%, vs. our F'09E of 22.5%.
• 2010 drivers. In our view, the following factors will drive PCLN shares in 2010: (1) careful expense management, (2) market share gains due to its lowest price offering, and (3) international trends.
• Maintaining 4Q’09 estimates. We are maintaining our 4Q’09 revenue, EBITDA, and EPS estimates of $518M, $108M, and $1.63.
Our current and newly introduced 2011 estimates are in the table below:
Table 133: Priceline Financial Snapshot $ in millions, except per share data Priceline 4Q'09E F'09E F'10E F'11E F'09E Y/Y F'10E Y/Y F'11E Y/Y J.P. Morgan Revenue 518 2,315 2,725 3,032 22.8% 17.7% 11.3% EBITDA 108 523 714 828 38.6% 36.5% 16.0% EPS 1.63 8.19 10.41 12.27 38.3% 27.2% 17.8% Consensus Revenue 526 2,323 2,805 3,202 23.2% 20.7% 14.2% EBITDA 109 525 681 805 39.1% 29.7% 18.2% EPS 1.65 8.25 10.23 11.85 39.3% 24.0% 15.8%
Source: J.P. Morgan estimates, Company data, and Bloomberg.
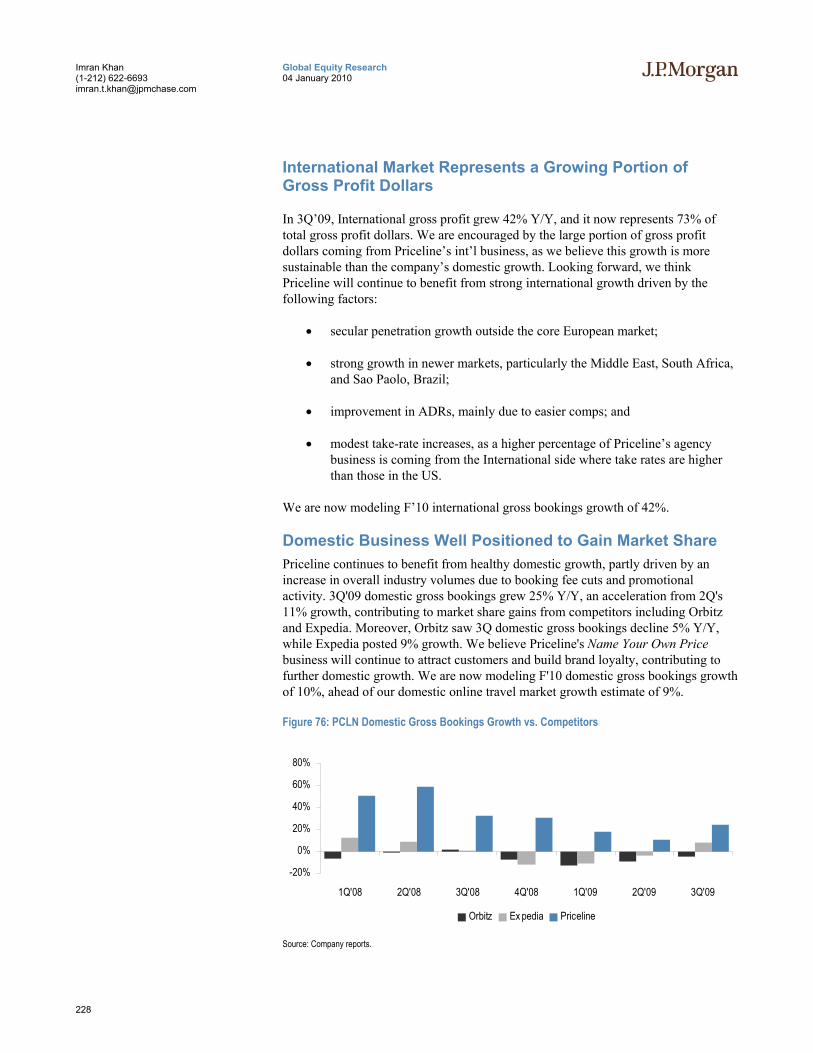
228
Global Equity Research 04 January 2010
Imran Khan (1-212) 622-6693 [email protected]
International Market Represents a Growing Portion of Gross Profit Dollars
In 3Q’09, International gross profit grew 42% Y/Y, and it now represents 73% of total gross profit dollars. We are encouraged by the large portion of gross profit dollars coming from Priceline’s int’l business, as we believe this growth is more sustainable than the company’s domestic growth. Looking forward, we think Priceline will continue to benefit from strong international growth driven by the following factors:
• secular penetration growth outside the core European market;
• strong growth in newer markets, particularly the Middle East, South Africa, and Sao Paolo, Brazil;
• improvement in ADRs, mainly due to easier comps; and
• modest take-rate increases, as a higher percentage of Priceline’s agency business is coming from the International side where take rates are higher than those in the US.
We are now modeling F’10 international gross bookings growth of 42%.
Domestic Business Well Positioned to Gain Market Share Priceline continues to benefit from healthy domestic growth, partly driven by an increase in overall industry volumes due to booking fee cuts and promotional activity. 3Q'09 domestic gross bookings grew 25% Y/Y, an acceleration from 2Q's 11% growth, contributing to market share gains from competitors including Orbitz and Expedia. Moreover, Orbitz saw 3Q domestic gross bookings decline 5% Y/Y, while Expedia posted 9% growth. We believe Priceline's Name Your Own Price business will continue to attract customers and build brand loyalty, contributing to further domestic growth. We are now modeling F'10 domestic gross bookings growth of 10%, ahead of our domestic online travel market growth estimate of 9%.
Figure 76: PCLN Domestic Gross Bookings Growth vs. Competitors
-20%
0%
20%
40%
60%
80%
1Q'08 2Q'08 3Q'08 4Q'08 1Q'09 2Q'09 3Q'09
Orbitz Ex pedia Priceline
Source: Company reports.
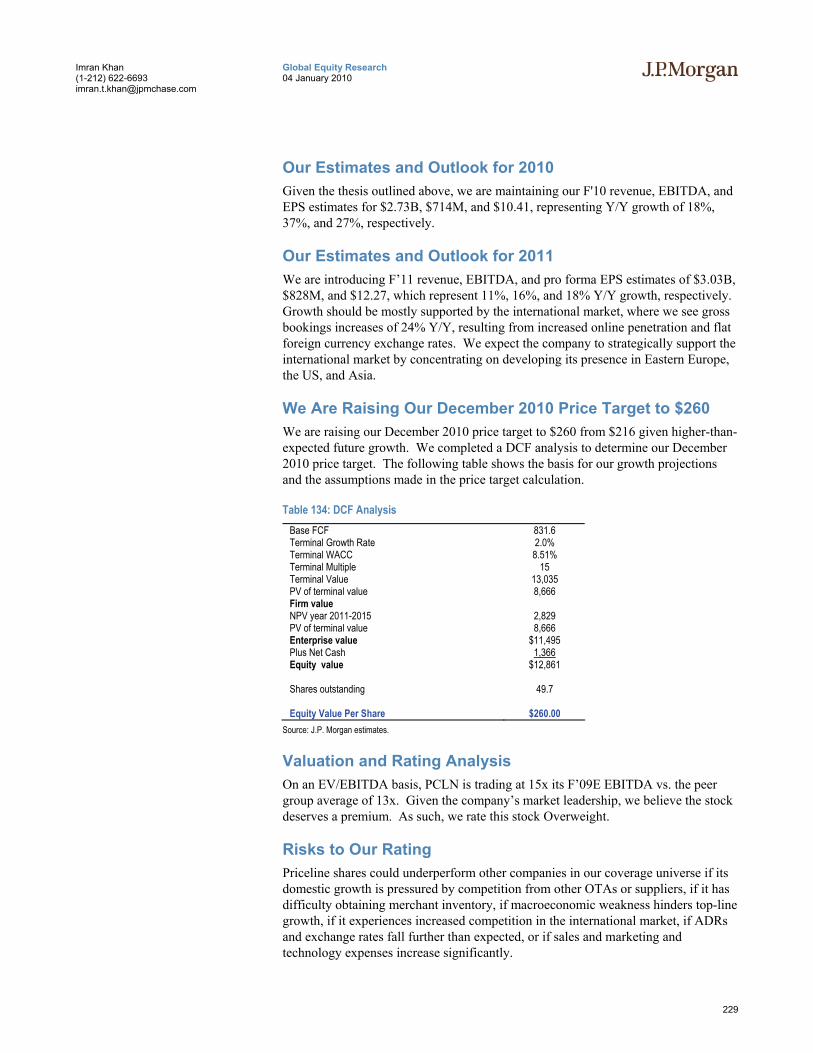
229
Global Equity Research 04 January 2010
Imran Khan (1-212) 622-6693 [email protected]
Our Estimates and Outlook for 2010 Given the thesis outlined above, we are maintaining our F'10 revenue, EBITDA, and EPS estimates for $2.73B, $714M, and $10.41, representing Y/Y growth of 18%, 37%, and 27%, respectively.
Our Estimates and Outlook for 2011 We are introducing F’11 revenue, EBITDA, and pro forma EPS estimates of $3.03B, $828M, and $12.27, which represent 11%, 16%, and 18% Y/Y growth, respectively. Growth should be mostly supported by the international market, where we see gross bookings increases of 24% Y/Y, resulting from increased online penetration and flat foreign currency exchange rates. We expect the company to strategically support the international market by concentrating on developing its presence in Eastern Europe, the US, and Asia.
We Are Raising Our December 2010 Price Target to $260 We are raising our December 2010 price target to $260 from $216 given higher-than-expected future growth. We completed a DCF analysis to determine our December 2010 price target. The following table shows the basis for our growth projections and the assumptions made in the price target calculation.
Table 134: DCF Analysis Base FCF 831.6 Terminal Growth Rate 2.0% Terminal WACC 8.51% Terminal Multiple 15 Terminal Value 13,035 PV of terminal value 8,666 Firm value NPV year 2011-2015 2,829 PV of terminal value 8,666 Enterprise value $11,495 Plus Net Cash 1,366 Equity value $12,861 Shares outstanding 49.7 Equity Value Per Share $260.00
Source: J.P. Morgan estimates.
Valuation and Rating Analysis On an EV/EBITDA basis, PCLN is trading at 15x its F’09E EBITDA vs. the peer group average of 13x. Given the company’s market leadership, we believe the stock deserves a premium. As such, we rate this stock Overweight.
Risks to Our Rating Priceline shares could underperform other companies in our coverage universe if its domestic growth is pressured by competition from other OTAs or suppliers, if it has difficulty obtaining merchant inventory, if macroeconomic weakness hinders top-line growth, if it experiences increased competition in the international market, if ADRs and exchange rates fall further than expected, or if sales and marketing and technology expenses increase significantly.
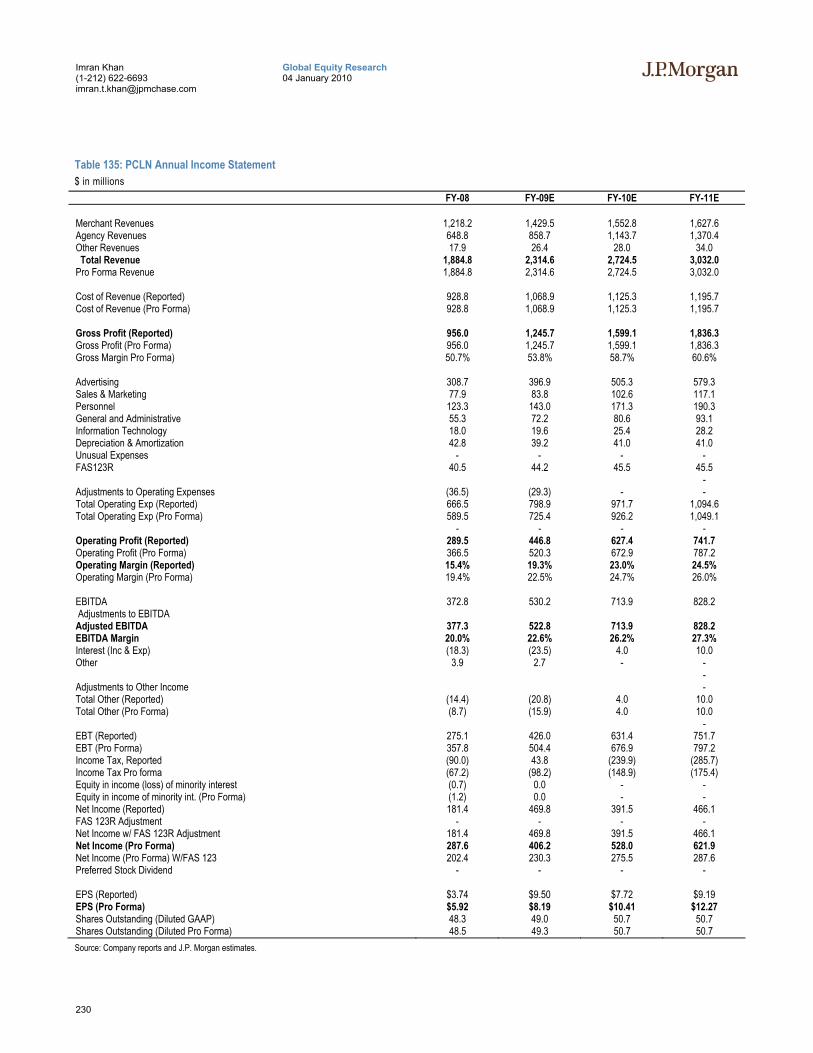
230
Global Equity Research 04 January 2010
Imran Khan (1-212) 622-6693 [email protected]
Table 135: PCLN Annual Income Statement $ in millions
FY-08 FY-09E FY-10E FY-11E Merchant Revenues 1,218.2 1,429.5 1,552.8 1,627.6 Agency Revenues 648.8 858.7 1,143.7 1,370.4 Other Revenues 17.9 26.4 28.0 34.0 Total Revenue 1,884.8 2,314.6 2,724.5 3,032.0 Pro Forma Revenue 1,884.8 2,314.6 2,724.5 3,032.0 Cost of Revenue (Reported) 928.8 1,068.9 1,125.3 1,195.7 Cost of Revenue (Pro Forma) 928.8 1,068.9 1,125.3 1,195.7 Gross Profit (Reported) 956.0 1,245.7 1,599.1 1,836.3 Gross Profit (Pro Forma) 956.0 1,245.7 1,599.1 1,836.3 Gross Margin Pro Forma) 50.7% 53.8% 58.7% 60.6% Advertising 308.7 396.9 505.3 579.3 Sales & Marketing 77.9 83.8 102.6 117.1 Personnel 123.3 143.0 171.3 190.3 General and Administrative 55.3 72.2 80.6 93.1 Information Technology 18.0 19.6 25.4 28.2 Depreciation & Amortization 42.8 39.2 41.0 41.0 Unusual Expenses - - - - FAS123R 40.5 44.2 45.5 45.5 - Adjustments to Operating Expenses (36.5) (29.3) - - Total Operating Exp (Reported) 666.5 798.9 971.7 1,094.6 Total Operating Exp (Pro Forma) 589.5 725.4 926.2 1,049.1 - - - - Operating Profit (Reported) 289.5 446.8 627.4 741.7 Operating Profit (Pro Forma) 366.5 520.3 672.9 787.2 Operating Margin (Reported) 15.4% 19.3% 23.0% 24.5% Operating Margin (Pro Forma) 19.4% 22.5% 24.7% 26.0% EBITDA 372.8 530.2 713.9 828.2 Adjustments to EBITDA Adjusted EBITDA 377.3 522.8 713.9 828.2 EBITDA Margin 20.0% 22.6% 26.2% 27.3% Interest (Inc & Exp) (18.3) (23.5) 4.0 10.0 Other 3.9 2.7 - - - Adjustments to Other Income - Total Other (Reported) (14.4) (20.8) 4.0 10.0 Total Other (Pro Forma) (8.7) (15.9) 4.0 10.0 - EBT (Reported) 275.1 426.0 631.4 751.7 EBT (Pro Forma) 357.8 504.4 676.9 797.2 Income Tax, Reported (90.0) 43.8 (239.9) (285.7) Income Tax Pro forma (67.2) (98.2) (148.9) (175.4) Equity in income (loss) of minority interest (0.7) 0.0 - - Equity in income of minority int. (Pro Forma) (1.2) 0.0 - - Net Income (Reported) 181.4 469.8 391.5 466.1 FAS 123R Adjustment - - - - Net Income w/ FAS 123R Adjustment 181.4 469.8 391.5 466.1 Net Income (Pro Forma) 287.6 406.2 528.0 621.9 Net Income (Pro Forma) W/FAS 123 202.4 230.3 275.5 287.6 Preferred Stock Dividend - - - - EPS (Reported) $3.74 $9.50 $7.72 $9.19 EPS (Pro Forma) $5.92 $8.19 $10.41 $12.27 Shares Outstanding (Diluted GAAP) 48.3 49.0 50.7 50.7 Shares Outstanding (Diluted Pro Forma) 48.5 49.3 50.7 50.7 Source: Company reports and J.P. Morgan estimates.

231
Global Equity Research 04 January 2010
Imran Khan (1-212) 622-6693 [email protected]
Table 136: PCLN Quarterly Income Statement $ in millions
Q1-08 Q2-08 Q3-08 Q4-08 Q1-09 Q2-09 Q3-09 Q4-09E Q1-10E Q2-10E Q3-10E Q4-10E Merchant Revenues 289.2 336.2 324.0 268.8 337.0 392.8 400.3 299.4 373.6 423.6 431.2 324.5 Agency Revenues 109.9 173.2 232.6 133.0 120.2 204.5 323.2 210.8 166.5 277.5 439.7 259.9 Other Revenues 4.1 4.5 5.0 4.3 4.8 6.4 7.2 8.0 7.0 7.0 7.0 7.0 Total Revenue 403.2 514.0 561.6 406.0 462.1 603.7 730.7 518.1 547.1 708.1 877.9 591.4 Cost of Revenue (Reported) 222.1 260.3 245.5 201.0 253.7 298.5 296.7 220.0 276.5 313.4 301.8 233.6 Gross Profit (Reported) 181.1 253.7 316.1 205.1 208.3 305.2 434.0 298.1 270.6 394.7 576.1 357.8 Advertising 69.8 82.8 92.6 63.5 78.9 101.2 123.6 93.3 99.6 131.0 162.4 112.4 Sales & Marketing 16.3 19.9 21.5 20.2 18.4 20.7 24.5 20.2 22.4 25.5 31.6 23.1 Personnel 26.9 30.6 35.2 30.5 28.9 33.6 40.1 40.4 34.5 40.4 49.2 47.3 General and Administrative 11.8 14.2 13.5 15.7 14.8 14.7 19.4 23.3 17.0 17.7 19.3 26.6 Information Technology 4.1 5.1 4.4 4.3 4.5 4.7 4.8 5.6 5.5 6.4 7.0 6.5 Depreciation & Amortization 10.4 11.1 10.9 10.4 9.4 9.7 10.1 10.0 10.0 10.5 10.5 10.0 Unusual Expenses FAS123R 9.9 9.1 10.1 11.5 10.6 11.3 10.9 11.5 11.0 11.0 11.0 12.5 Adjustments to Operating Expenses (14.9) (7.5) (7.3) (6.9) (8.2) (11.0) (10.1) - - - - - Total Operating Exp (Reported) 149.3 172.8 188.2 156.2 165.5 195.9 233.3 204.3 199.9 242.4 291.0 238.4 Operating Profit (Reported) 31.8 81.0 127.9 48.8 42.8 109.4 200.8 93.8 70.7 152.2 285.1 119.4 Operating Margin (Reported) 7.9% 15.8% 22.8% 12.0% 9.3% 18.1% 27.5% 18.1% 12.9% 21.5% 32.5% 20.2% EBITDA 52.1 101.1 148.9 70.7 62.8 130.4 221.7 115.3 91.7 173.7 306.6 141.9 Adjusted EBITDA 47.7 101.1 152.4 76.1 63.7 126.2 224.6 108.3 91.7 173.7 306.6 141.9 Interest (Inc & Exp) -5.89 -6.62 -4.68 -1.07 -6.06 -6.02 -5.44 -6.00 1.00 1.00 1.00 1.00 Other -5.08 -0.01 3.59 5.36 3.82 -3.88 -1.22 4.00 0.00 0.00 0.00 0.00 Total Other (Reported) -10.97 -6.63 -1.09 4.30 -2.25 -9.90 -6.66 -2.00 1.00 1.00 1.00 1.00 EBT (Reported) 20.79 74.33 126.83 53.13 40.60 99.47 194.10 91.80 71.72 153.24 286.05 120.42 Income Tax, Reported (6.51) (23.26) (40.45) (19.83) (15.54) (32.50) 124.89 (33.05) (27.25) (58.23) (108.70) (45.76) Equity in income (loss) of minority interest (0.51) (0.08) (0.10) (0.05) (0.03) 0.03 Equity in income of minority int. (Pro Forma) (0.83) (0.33) (0.05) (0.03) 0.03 Net Income (Reported) 13.8 49.8 84.5 33.3 25.0 67.0 319.0 58.8 44.5 95.0 177.4 74.7 Net Income w/ FAS 123R Adjustment 13.8 49.8 84.5 33.3 25.0 67.0 319.0 58.8 44.5 95.0 177.4 74.7 Net Income (Pro Forma) 37.3 75.2 116.8 58.2 51.3 99.0 173.3 82.6 64.5 128.1 231.7 103.7 EPS (Reported) $0.28 $1.00 $1.74 $0.73 $0.53 $1.38 $6.42 $1.16 $0.88 $1.87 $3.50 $1.47 EPS (Pro Forma) $0.76 $1.49 $2.39 $1.29 $1.09 $2.02 $3.45 $1.63 $1.27 $2.53 $4.57 $2.04 Shares Outstanding (Diluted GAAP) 49.1 49.9 48.7 45.6 47.0 48.5 49.7 50.7 50.7 50.7 50.7 50.7 Source: Company reports and J.P. Morgan estimates.

232
Global Equity Research 04 January 2010
Imran Khan (1-212) 622-6693 [email protected]
Table 137: PCLN Annual Balance Sheet $ in millions
FY-08 FY-09E FY-10E FY-11E Cash and cash equivalents 364.6 408.3 1,008.2 1,544.6 Restricted cash 2.5 1.3 1.3 1.3 Short-term investments 98.9 356.8 356.8 356.8 Accounts receivable 92.3 121.9 115.9 115.9 Prepaid expenses and other current assets 35.6 58.3 49.3 49.3 Total current assets 593.9 946.6 1,531.4 2,067.9 Property and equipment, net 29.4 30.3 34.3 46.3 Intangible assets, net 193.2 179.8 179.8 179.8 Goodwill 326.9 350.0 350.0 350.0 Deferred Taxes 154.0 282.6 282.6 282.6 Other assets 15.1 5.0 5.0 5.0 Total assets 1,312.4 1,794.3 2,383.1 2,931.6 Accounts payable 46.3 68.0 183.0 183.0 Accrued expenses 77.7 143.5 143.5 143.5 Deferred merchant bookings 29.7 50.4 50.4 50.4 Other current liabilities 317.9 220.7 220.7 220.7 Total current liabilities 471.6 482.6 597.6 597.6 Deferred Taxes 48.9 45.7 45.7 45.7 Other long-term liabilities 18.0 21.8 21.8 21.8 Minority Interest 0.0 0.0 0.0 0.0 Long-term debt 75.1 50.2 50.2 50.2 Total liabilities 613.6 600.3 715.3 715.3 Series B Mandatorily Redeemable Preferred Stock 0.0 0.0 0.0 0.0 0.0 0.0 0.0 0.0 Common stock, $0.008 par value per share, 0.4 0.4 0.4 0.4 Treasury stock, 2,496,326 shares and 2,496,326 (493.6) (507.7) (507.7) (507.7) Additional paid-in capital 2,176.6 2,229.6 2,703.5 3,251.9 Deferred compensation 0.0 0.0 0.0 0.0 Accumulated deficit (944.1) (533.1) (533.1) (533.1) Accumulated other comprehensive income (40.4) 4.8 4.8 4.8 Total stockholders equity 698.8 1,193.9 1,667.8 2,216.3 Total liabilities and stockholders equity 1,312.4 1,794.3 2,383.1 2,931.6 Source: Company reports and J.P. Morgan estimates.

233
Global Equity Research 04 January 2010
Imran Khan (1-212) 622-6693 [email protected]
Table 138: PCLN Annual Cash Flow Statement $ in millions
FY - 08 FY - 09E FY - 10E FY - 11E Net income (loss) 184.7 469.8 391.5 466.1 Depreciation 14.4 14.6 20.0 20.0 Amortization 28.7 24.6 21.0 21.0 Provision for uncollectible accounts 13.1 4.9 6.3 6.3 Deferred Income Tax 28.1 (154.0) - - Restructuring charge, net - - - - Warrant costs - - - - Equity in loss of investees, net 3.7 (0.0) - - Impairments of investments in licensees 0.8 - - - Net gain on disposal of property and equipment - - - - Compensation expense arising from restricted stock awards 40.5 44.2 45.5 45.5 Amortization of debt issuance costs 3.7 16.0 9.6 9.6 Changes in assets and liabilities: (11.0) 82.1 130.0 - Accounts receivable (42.9) (25.9) 6.0 - Prepaid expenses and other current assets (5.2) 10.5 9.0 - Accounts payable and accrued expenses 32.2 94.8 115.0 - Other 4.8 2.7 - - Cash Flow from Operations 306.8 502.2 623.9 568.5 FCF 288.5 487.3 599.9 536.5 Additions to property and equipment (18.3) (14.9) (24.0) (32.0) Purchase of short-term investments and shares held by minority interest (350.3) (757.8) - - Maturing of Investments (investing) 218.6 427.2 - - (Funding)Return of restricted cash and bank certificate of deposit (1.2) 10.2 - - Equity investment and other acquisitions (0.6) - - - Cash flow from Investing Activities (151.9) (335.3) (24.0) (32.0) Proceeds from sale of common stock 0.0 0.0 0.0 0.0 Proceeds from issuance of convertible senior notes (176.9) (122.0) 0.0 0.0 Proceeds from exercise of stock options/warrants 5.5 12.3 0.0 0.0 Proceeds from sale of minority interest in subsidiary 0.0 0.0 0.0 0.0 Purchase of conversion spread hedges 0.0 0.0 0.0 0.0 Additional debt issuance costs 0.0 0.0 0.0 0.0 Excess tax benefit from stock based comp 7.0 1.6 0.0 0.0 Repurchase of stock (4.4) (14.2) 0.0 0.0 Cash flow from Financing Activites (168.85) (122.33) - - 0.0 0.0 0.0 0.0 Effect of exchange rate changes on cash (15.6) (0.8) 0.0 0.0 Net Change in Cash (29.6) 43.7 599.9 536.5 Cash at the Beginning of period 385.4 355.8 408.3 1,008.2 Cash at the End of Period 355.8 408.3 1,008.2 1,544.6 Source: Company reports and J.P. Morgan estimates.
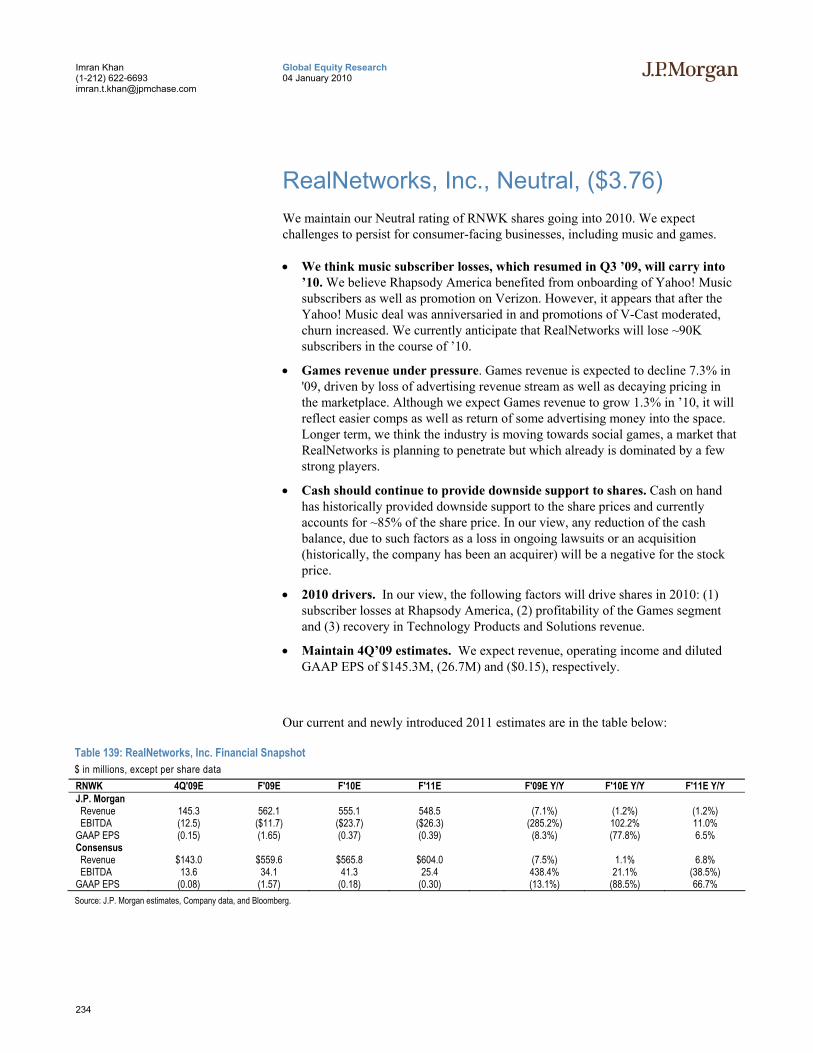
234
Global Equity Research 04 January 2010
Imran Khan (1-212) 622-6693 [email protected]
RealNetworks, Inc., Neutral, ($3.76) We maintain our Neutral rating of RNWK shares going into 2010. We expect challenges to persist for consumer-facing businesses, including music and games.
• We think music subscriber losses, which resumed in Q3 ’09, will carry into ’10. We believe Rhapsody America benefited from onboarding of Yahoo! Music subscribers as well as promotion on Verizon. However, it appears that after the Yahoo! Music deal was anniversaried in and promotions of V-Cast moderated, churn increased. We currently anticipate that RealNetworks will lose ~90K subscribers in the course of ’10.
• Games revenue under pressure. Games revenue is expected to decline 7.3% in '09, driven by loss of advertising revenue stream as well as decaying pricing in the marketplace. Although we expect Games revenue to grow 1.3% in ’10, it will reflect easier comps as well as return of some advertising money into the space. Longer term, we think the industry is moving towards social games, a market that RealNetworks is planning to penetrate but which already is dominated by a few strong players.
• Cash should continue to provide downside support to shares. Cash on hand has historically provided downside support to the share prices and currently accounts for ~85% of the share price. In our view, any reduction of the cash balance, due to such factors as a loss in ongoing lawsuits or an acquisition (historically, the company has been an acquirer) will be a negative for the stock price.
• 2010 drivers. In our view, the following factors will drive shares in 2010: (1) subscriber losses at Rhapsody America, (2) profitability of the Games segment and (3) recovery in Technology Products and Solutions revenue.
• Maintain 4Q’09 estimates. We expect revenue, operating income and diluted GAAP EPS of $145.3M, (26.7M) and ($0.15), respectively.
Our current and newly introduced 2011 estimates are in the table below:
Table 139: RealNetworks, Inc. Financial Snapshot $ in millions, except per share data RNWK 4Q'09E F'09E F'10E F'11E F'09E Y/Y F'10E Y/Y F'11E Y/Y J.P. Morgan Revenue 145.3 562.1 555.1 548.5 (7.1%) (1.2%) (1.2%) EBITDA (12.5) ($11.7) ($23.7) ($26.3) (285.2%) 102.2% 11.0% GAAP EPS (0.15) (1.65) (0.37) (0.39) (8.3%) (77.8%) 6.5% Consensus Revenue $143.0 $559.6 $565.8 $604.0 (7.5%) 1.1% 6.8% EBITDA 13.6 34.1 41.3 25.4 438.4% 21.1% (38.5%) GAAP EPS (0.08) (1.57) (0.18) (0.30) (13.1%) (88.5%) 66.7% Source: J.P. Morgan estimates, Company data, and Bloomberg.

235
Global Equity Research 04 January 2010
Imran Khan (1-212) 622-6693 [email protected]
Our Estimates and Outlook for 2010 We estimate that RealNetworks will generate revenue of $555.1M, operating loss of $77.2M and diluted EPS of ($0.37).
Our Estimates and Outlook for 2011 We are introducing 2011 revenue and EPS estimates of $548.5M and ($0.39), respectively.
Valuation and Rating Analysis In the absence of EBITDA and EPS meaningful for valuation, we think earnings trends will drive the stock price. We believe the company is facing competitive and cyclical challenges which we expect to persist in the mid term. As such, we don’t expect a material improvement in RNWK’s earnings trend. At the same time, we think the $2.76 per share in cash and equivalents will provide downside support for the stock price – we therefore assign RNWK shares a Neutral rating.
Risks to Our Rating or Where We Could Be Wrong • The recent marketing initiatives and the launch of the Rhapsody application on
iPhone and iPod Touch could exceed our expectation and drive upside to our estimates. We believe, however, that the relative simplicity of competing customer propositions (iTunes), not lack of consumer awareness, has limited growth rates.
• Penetration of broadband-enabled mobile handsets can grow faster than we expect, creating a larger opportunity for carrier application service (CAS) revenue.
• RealNetworks’ newer PC games can prove more popular than the ones released previously, potentially leading to the creation of incremental advertising inventory and revenue upside.
• RealNetworks may be more successful than we currently expect in growing and monetizing its Games business, including on social networks.
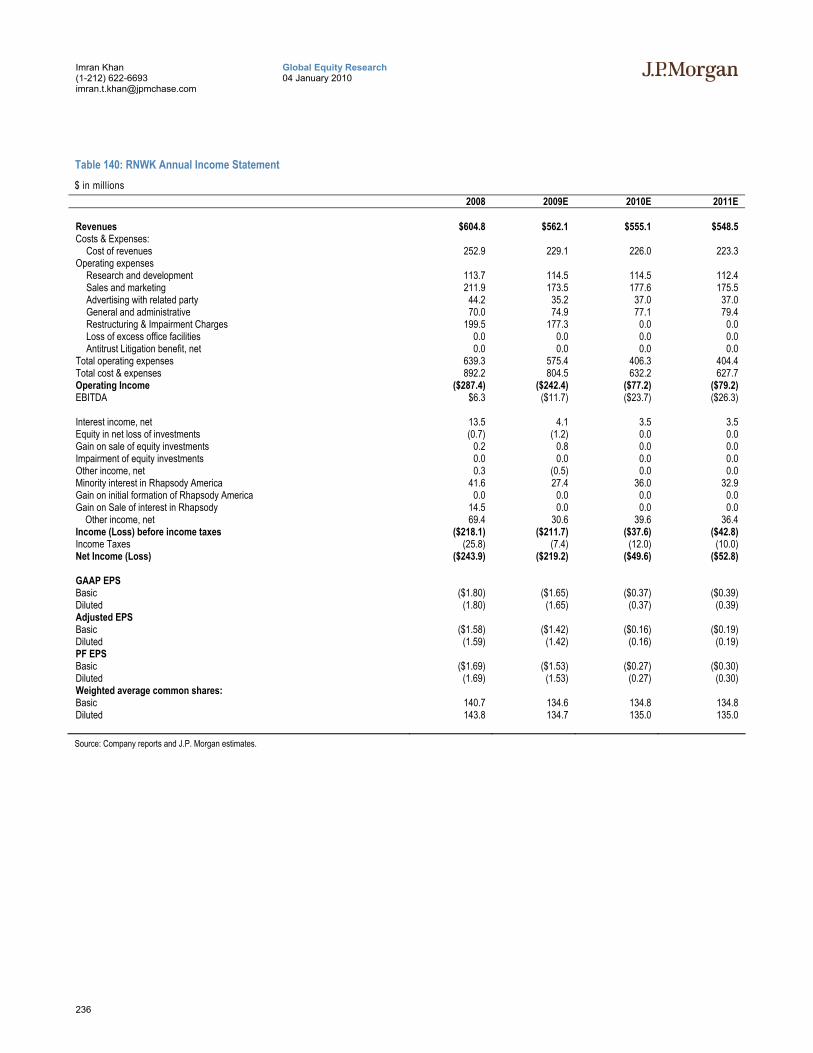
236
Global Equity Research 04 January 2010
Imran Khan (1-212) 622-6693 [email protected]
Table 140: RNWK Annual Income Statement $ in millions
2008 2009E 2010E 2011E Revenues $604.8 $562.1 $555.1 $548.5 Costs & Expenses:
Cost of revenues 252.9 229.1 226.0 223.3 Operating expenses
Research and development 113.7 114.5 114.5 112.4 Sales and marketing 211.9 173.5 177.6 175.5 Advertising with related party 44.2 35.2 37.0 37.0 General and administrative 70.0 74.9 77.1 79.4 Restructuring & Impairment Charges 199.5 177.3 0.0 0.0 Loss of excess office facilities 0.0 0.0 0.0 0.0 Antitrust Litigation benefit, net 0.0 0.0 0.0 0.0
Total operating expenses 639.3 575.4 406.3 404.4 Total cost & expenses 892.2 804.5 632.2 627.7 Operating Income ($287.4) ($242.4) ($77.2) ($79.2) EBITDA $6.3 ($11.7) ($23.7) ($26.3) Interest income, net 13.5 4.1 3.5 3.5 Equity in net loss of investments (0.7) (1.2) 0.0 0.0 Gain on sale of equity investments 0.2 0.8 0.0 0.0 Impairment of equity investments 0.0 0.0 0.0 0.0 Other income, net 0.3 (0.5) 0.0 0.0 Minority interest in Rhapsody America 41.6 27.4 36.0 32.9 Gain on initial formation of Rhapsody America 0.0 0.0 0.0 0.0 Gain on Sale of interest in Rhapsody 14.5 0.0 0.0 0.0 Other income, net 69.4 30.6 39.6 36.4 Income (Loss) before income taxes ($218.1) ($211.7) ($37.6) ($42.8) Income Taxes (25.8) (7.4) (12.0) (10.0) Net Income (Loss) ($243.9) ($219.2) ($49.6) ($52.8) GAAP EPS Basic ($1.80) ($1.65) ($0.37) ($0.39) Diluted (1.80) (1.65) (0.37) (0.39) Adjusted EPS Basic ($1.58) ($1.42) ($0.16) ($0.19) Diluted (1.59) (1.42) (0.16) (0.19) PF EPS Basic ($1.69) ($1.53) ($0.27) ($0.30) Diluted (1.69) (1.53) (0.27) (0.30) Weighted average common shares: Basic 140.7 134.6 134.8 134.8 Diluted 143.8 134.7 135.0 135.0 Source: Company reports and J.P. Morgan estimates.
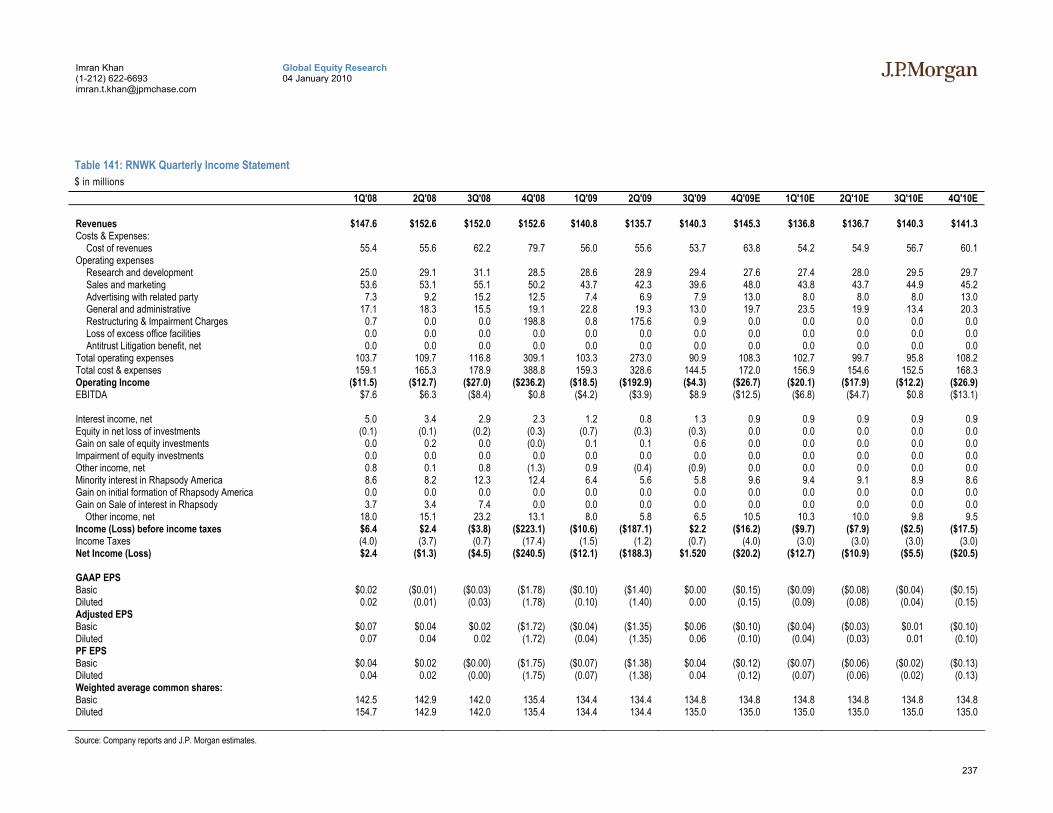
237
Global Equity Research 04 January 2010
Imran Khan (1-212) 622-6693 [email protected]
Table 141: RNWK Quarterly Income Statement $ in millions
1Q'08 2Q'08 3Q'08 4Q'08 1Q'09 2Q'09 3Q'09 4Q'09E 1Q'10E 2Q'10E 3Q'10E 4Q'10E Revenues $147.6 $152.6 $152.0 $152.6 $140.8 $135.7 $140.3 $145.3 $136.8 $136.7 $140.3 $141.3 Costs & Expenses:
Cost of revenues 55.4 55.6 62.2 79.7 56.0 55.6 53.7 63.8 54.2 54.9 56.7 60.1 Operating expenses
Research and development 25.0 29.1 31.1 28.5 28.6 28.9 29.4 27.6 27.4 28.0 29.5 29.7 Sales and marketing 53.6 53.1 55.1 50.2 43.7 42.3 39.6 48.0 43.8 43.7 44.9 45.2 Advertising with related party 7.3 9.2 15.2 12.5 7.4 6.9 7.9 13.0 8.0 8.0 8.0 13.0 General and administrative 17.1 18.3 15.5 19.1 22.8 19.3 13.0 19.7 23.5 19.9 13.4 20.3 Restructuring & Impairment Charges 0.7 0.0 0.0 198.8 0.8 175.6 0.9 0.0 0.0 0.0 0.0 0.0 Loss of excess office facilities 0.0 0.0 0.0 0.0 0.0 0.0 0.0 0.0 0.0 0.0 0.0 0.0 Antitrust Litigation benefit, net 0.0 0.0 0.0 0.0 0.0 0.0 0.0 0.0 0.0 0.0 0.0 0.0
Total operating expenses 103.7 109.7 116.8 309.1 103.3 273.0 90.9 108.3 102.7 99.7 95.8 108.2 Total cost & expenses 159.1 165.3 178.9 388.8 159.3 328.6 144.5 172.0 156.9 154.6 152.5 168.3 Operating Income ($11.5) ($12.7) ($27.0) ($236.2) ($18.5) ($192.9) ($4.3) ($26.7) ($20.1) ($17.9) ($12.2) ($26.9) EBITDA $7.6 $6.3 ($8.4) $0.8 ($4.2) ($3.9) $8.9 ($12.5) ($6.8) ($4.7) $0.8 ($13.1) Interest income, net 5.0 3.4 2.9 2.3 1.2 0.8 1.3 0.9 0.9 0.9 0.9 0.9 Equity in net loss of investments (0.1) (0.1) (0.2) (0.3) (0.7) (0.3) (0.3) 0.0 0.0 0.0 0.0 0.0 Gain on sale of equity investments 0.0 0.2 0.0 (0.0) 0.1 0.1 0.6 0.0 0.0 0.0 0.0 0.0 Impairment of equity investments 0.0 0.0 0.0 0.0 0.0 0.0 0.0 0.0 0.0 0.0 0.0 0.0 Other income, net 0.8 0.1 0.8 (1.3) 0.9 (0.4) (0.9) 0.0 0.0 0.0 0.0 0.0 Minority interest in Rhapsody America 8.6 8.2 12.3 12.4 6.4 5.6 5.8 9.6 9.4 9.1 8.9 8.6 Gain on initial formation of Rhapsody America 0.0 0.0 0.0 0.0 0.0 0.0 0.0 0.0 0.0 0.0 0.0 0.0 Gain on Sale of interest in Rhapsody 3.7 3.4 7.4 0.0 0.0 0.0 0.0 0.0 0.0 0.0 0.0 0.0 Other income, net 18.0 15.1 23.2 13.1 8.0 5.8 6.5 10.5 10.3 10.0 9.8 9.5 Income (Loss) before income taxes $6.4 $2.4 ($3.8) ($223.1) ($10.6) ($187.1) $2.2 ($16.2) ($9.7) ($7.9) ($2.5) ($17.5) Income Taxes (4.0) (3.7) (0.7) (17.4) (1.5) (1.2) (0.7) (4.0) (3.0) (3.0) (3.0) (3.0) Net Income (Loss) $2.4 ($1.3) ($4.5) ($240.5) ($12.1) ($188.3) $1.520 ($20.2) ($12.7) ($10.9) ($5.5) ($20.5) GAAP EPS Basic $0.02 ($0.01) ($0.03) ($1.78) ($0.10) ($1.40) $0.00 ($0.15) ($0.09) ($0.08) ($0.04) ($0.15) Diluted 0.02 (0.01) (0.03) (1.78) (0.10) (1.40) 0.00 (0.15) (0.09) (0.08) (0.04) (0.15) Adjusted EPS Basic $0.07 $0.04 $0.02 ($1.72) ($0.04) ($1.35) $0.06 ($0.10) ($0.04) ($0.03) $0.01 ($0.10) Diluted 0.07 0.04 0.02 (1.72) (0.04) (1.35) 0.06 (0.10) (0.04) (0.03) 0.01 (0.10) PF EPS Basic $0.04 $0.02 ($0.00) ($1.75) ($0.07) ($1.38) $0.04 ($0.12) ($0.07) ($0.06) ($0.02) ($0.13) Diluted 0.04 0.02 (0.00) (1.75) (0.07) (1.38) 0.04 (0.12) (0.07) (0.06) (0.02) (0.13) Weighted average common shares: Basic 142.5 142.9 142.0 135.4 134.4 134.4 134.8 134.8 134.8 134.8 134.8 134.8 Diluted 154.7 142.9 142.0 135.4 134.4 134.4 135.0 135.0 135.0 135.0 135.0 135.0 Source: Company reports and J.P. Morgan estimates.

238
Global Equity Research 04 January 2010
Imran Khan (1-212) 622-6693 [email protected]
Table 142: RNWK Annual Balance Sheet $ in millions
2008 2009E 2010E 2011E ASSETS Current Assets:
Cash and cash equivalents $233.0 $197.6 $187.0 $175.2 Short-term investments 137.8 168.4 168.4 168.4 Trade accounts receivable, net of allowances for doubtful accounts and sales
returns 70.2 69.5 67.6 66.8 Deferred costs, current portion 4.0 6.4 6.3 8.2 Deferred tax assets, net, current portion 0.0 0.0 0.0 0.0 Prepaid expenses and other current assets 34.6 37.4 36.5 42.6
Total current assets $479.6 $479.3 $465.8 $461.1 Equipment, software, and leasehold improvements:
Equipment and software 135.8 150.8 162.6 174.7 Leashold improvements 30.7 32.5 37.5 42.7
Total equipment, software, and leasehold improvements, at cost 166.5 183.3 200.1 217.4 Less accumulated depreciation and amortization 103.5 123.2 135.5 147.6
Net equipment, software, and leasehold improvements 63.0 60.1 64.6 69.8 Restricted cash equivalents 14.7 13.7 13.7 13.7 Notes receivable from related parties 0.0 0.0 0.0 0.0 Equity investments 18.6 21.8 21.8 21.8 Other assets 9.9 13.1 13.1 13.1 Deferred tax assets, net, non-current portion 9.2 9.9 9.9 9.9 Other intangible assets, net 18.7 12.8 12.8 12.8 Goodwill 175.3 0.0 0.0 0.0 Total Assets $789.0 $610.6 $601.6 $602.1 LIABILITIES AND STOCKHOLDERS' EQUITY Current Liabilities:
Accounts payable $36.6 $46.7 $45.7 $34.2 Accrued and other liabilities 118.7 132.5 129.6 137.0 Deferred revenue, current portion 39.8 37.1 36.1 35.6 Related party payable 13.2 13.0 13.0 37.0 Convertible Debt, Current Portion 0.0 0.0 0.0 0.0 Accrued loss on excess office facilities, current portion 4.3 4.3 4.3 4.3
Total Current Liabilities $212.6 $233.6 $228.7 $248.2 Deferred revenue, non-current portion 2.0 1.9 1.9 1.9 Accrued loss on excess office facilities, non-current portion 2.9 0.0 0.0 0.0 Deferred rent 4.6 4.5 4.5 4.5 Deferred tax liabilities, net, non-current portion 1.4 0.9 0.9 0.9 Convertible debt 0.0 0.0 0.0 0.0 Minority Interest 0.0 0.0 Other long-term liabilities 11.7 15.2 96.8 163.4 Total liabilities $235.1 $256.2 $332.8 $418.9 Minority Interest $0.4 ($4.1) ($40.2) ($73.0) Shareholders' equity: Preferred stock, $0.001 par value, no shares issued and outstanding 0.0 0.0 0.0 0.0 Series A: authorized 200 shares 0.0 0.0 0.0 0.0 Undesignated series: authorized 59,800 shares 0.0 0.0 0.0 0.0 Common stock, $0.001 par value authorized 1,000,000 shares; issued and outstanding 154,108 shares in 2007 and 163,278 shares in 2006 0.2 0.1 0.1 0.1 Additional paid-in capital 605.5 660.4 660.4 660.4 Deferred stock-based compensation 0.0 0.0 0.0 0.0 Accumulated other comprehensive income 24.1 (38.5) (38.5) (38.5) Retained earnings (76.2) (263.4) (312.9) (365.8) Accumulated deficit 0.0 0.0 0.0 0.0 Total shareholders’ equity $553.9 $354.5 $268.8 $183.2 Total liabilities & stockholders' equity $789.0 $610.6 $601.6 $602.1 Source: Company reports and J.P. Morgan estimates.
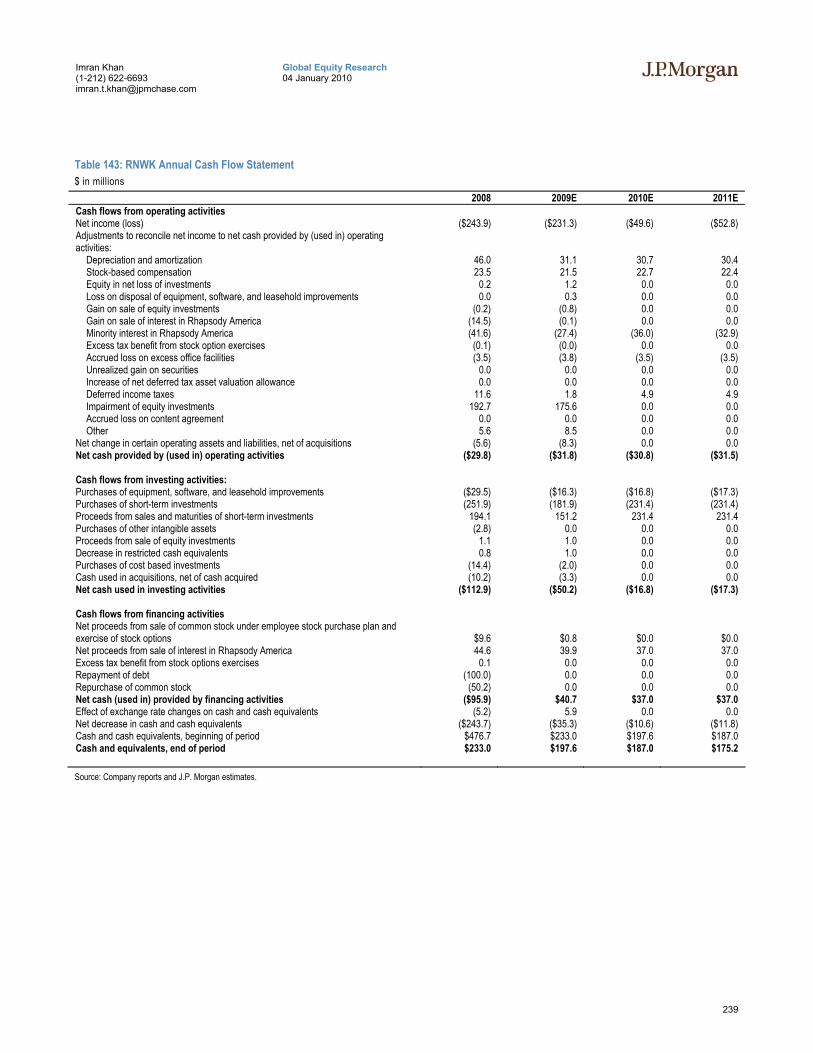
239
Global Equity Research 04 January 2010
Imran Khan (1-212) 622-6693 [email protected]
Table 143: RNWK Annual Cash Flow Statement $ in millions
2008 2009E 2010E 2011E Cash flows from operating activities Net income (loss) ($243.9) ($231.3) ($49.6) ($52.8) Adjustments to reconcile net income to net cash provided by (used in) operating activities:
Depreciation and amortization 46.0 31.1 30.7 30.4 Stock-based compensation 23.5 21.5 22.7 22.4 Equity in net loss of investments 0.2 1.2 0.0 0.0 Loss on disposal of equipment, software, and leasehold improvements 0.0 0.3 0.0 0.0 Gain on sale of equity investments (0.2) (0.8) 0.0 0.0 Gain on sale of interest in Rhapsody America (14.5) (0.1) 0.0 0.0 Minority interest in Rhapsody America (41.6) (27.4) (36.0) (32.9) Excess tax benefit from stock option exercises (0.1) (0.0) 0.0 0.0 Accrued loss on excess office facilities (3.5) (3.8) (3.5) (3.5) Unrealized gain on securities 0.0 0.0 0.0 0.0 Increase of net deferred tax asset valuation allowance 0.0 0.0 0.0 0.0 Deferred income taxes 11.6 1.8 4.9 4.9 Impairment of equity investments 192.7 175.6 0.0 0.0 Accrued loss on content agreement 0.0 0.0 0.0 0.0 Other 5.6 8.5 0.0 0.0
Net change in certain operating assets and liabilities, net of acquisitions (5.6) (8.3) 0.0 0.0 Net cash provided by (used in) operating activities ($29.8) ($31.8) ($30.8) ($31.5) Cash flows from investing activities: Purchases of equipment, software, and leasehold improvements ($29.5) ($16.3) ($16.8) ($17.3) Purchases of short-term investments (251.9) (181.9) (231.4) (231.4) Proceeds from sales and maturities of short-term investments 194.1 151.2 231.4 231.4 Purchases of other intangible assets (2.8) 0.0 0.0 0.0 Proceeds from sale of equity investments 1.1 1.0 0.0 0.0 Decrease in restricted cash equivalents 0.8 1.0 0.0 0.0 Purchases of cost based investments (14.4) (2.0) 0.0 0.0 Cash used in acquisitions, net of cash acquired (10.2) (3.3) 0.0 0.0 Net cash used in investing activities ($112.9) ($50.2) ($16.8) ($17.3) Cash flows from financing activities Net proceeds from sale of common stock under employee stock purchase plan and exercise of stock options $9.6 $0.8 $0.0 $0.0 Net proceeds from sale of interest in Rhapsody America 44.6 39.9 37.0 37.0 Excess tax benefit from stock options exercises 0.1 0.0 0.0 0.0 Repayment of debt (100.0) 0.0 0.0 0.0 Repurchase of common stock (50.2) 0.0 0.0 0.0 Net cash (used in) provided by financing activities ($95.9) $40.7 $37.0 $37.0 Effect of exchange rate changes on cash and cash equivalents (5.2) 5.9 0.0 0.0 Net decrease in cash and cash equivalents ($243.7) ($35.3) ($10.6) ($11.8) Cash and cash equivalents, beginning of period $476.7 $233.0 $197.6 $187.0 Cash and equivalents, end of period $233.0 $197.6 $187.0 $175.2 Source: Company reports and J.P. Morgan estimates.
240
Global Equity Research 04 January 2010
Imran Khan (1-212) 622-6693 [email protected]
Shutterfly, Inc., Overweight, ($17.84) We believe Shutterfly’s top-line growth will accelerate in 2010, driven by continued strength in its Personalized Products & Services business. Additionally, we expect the company to further expand its commercial printing initiative, thereby increasing revenue and profitability. We are maintaining our Overweight rating on Shutterfly and raising our December 2010 price target to $19, from $17.
• Continued growth in PP&S business. .We think increased penetration of photobooks and continued product development will drive growth in Shutterfly’s PP&S business. Additionally, we believe further adoption of social networking via Shutterfly Share Sites will help attract new customers to the site at low traffic acquisition costs. We are modeling F’10 non-print revenue to grow 23%, above our F'09 estimate of 15%.
• Better printing facility utilization via development of commercial print business. Shutterfly's commercial printing initiative delivered nearly $3M in revenue for the first nine months of the year. Through expanding strategic partnerships (i.e., Group O relationship) and new customer additions, we believe Shutterfly will further grow the business in 2010. Additionally, we expect the commercial printing business to increase Shutterfly's profitability, eventually achieving a 30% contribution margin.
• Minimal long-term impact from the phase-out of WebLoyalty. Since the adoption of the program in 4Q'06, WebLoyalty has contributed approximately 3% of total net revenues, with an estimated 2.5% contribution in F'09. Management expects this percentage to further decline in 2010, amounting to ~2% of revenue. Additionally, while the eventual phase-out of WebLoyalty may contribute a short-term drag on EBITDA, we do not see the impact as material to the company's longer-term growth prospects.
• 2010 drivers. In our view, the following factors will drive SFLY shares in 2010: (1) continued mix shift trend from print to non-print products, (2) development of commercial printing business, and (3) WebLoyalty impact.
• Maintaining 4Q’09 estimates. Our 4Q’09 estimates call for $116M in revenue, $40M EBITDA and $0.70 EPS.
Our current and newly introduced 2011 estimates are in the table below:
Table 144: Shutterfly Financial Snapshot $ in millions, except per share data
Shutterfly 4Q’09E F’09E F’10E F’11E F’08E Y/Y F’09E Y/Y F’10E Y/Y J.P. Morgan Revenue 116 231 261 298 35% 13% 14% EBITDA 40 43 50 57 8% 19% 13% EPS 0.70 0.03 0.27 0.33 NM NM 22%
Consensus Revenue 114 229 251 277 34% 10% 10% EBITDA 39 41 49 57 5% 19% 16% EPS 0.68 0.00 0.16 0.37 NM NM 130% Source: J.P. Morgan estimates, Company data, and Bloomberg.
241
Global Equity Research 04 January 2010
Imran Khan (1-212) 622-6693 [email protected]
Our Estimates and Outlook for 2010 We are maintaining our F’10 estimates, with revenue of $261M, EBITDA of $50M, and EPS of $0.27. We are projecting orders growth to accelerate to 8.8% in F’10, from 1% in F’09E, and a 4% increase in average order size, resulting in 13% Y/Y revenue growth. We are modeling for increased efficiencies on the cost of revenue line to be partly offset by somewhat higher Sales & Marketing spend as the economy begins to rebound.
Our Estimates and Outlook for 2011 We are introducing our F’11 revenue, EBITDA and EPS estimates of $298M, $57M, and $0.33, respectively. Our model of 14% Y/Y revenue growth is predicated on 8% growth in orders in 2011, as well as an additional 5% Y/Y boost in average order size. We expect the EBITDA margin to stay roughly in line with that of F’10 at 19%.
Valuation and Rating Analysis SFLY trades at a discount to its peers. On an EV/EBITDA basis, SFLY trades at 7.7x our F’10 EBITDA estimate of $50M, vs. its eCommerce peer group (including all eCommerce companies in our coverage) at 13.5x. Given SFLY’s strong growth prospects, we believe there is opportunity for multiple expansion and thus rate the stock Overweight.
We Are Raising Our December 2010 Price Target to $19 Our December 2010 price target is predicated on a DCF analysis, with the following parameters:
Table 145: Key DCF Assumptions Equity beta 0.99 Risk free rate (10yr yield) 3.7% Risk premium 6.4% Cost of Equity 10.0% Final debt ratio 0.0% Equity as a % Cap 100.0%
Source: Company reports and J.P. Morgan estimates.
Risks to Our Rating We believe there are three primary risks to our Overweight rating on Shutterfly:
• Seasonality: Currently, Shutterfly’s business is very seasonal, with approximately 50% of revenue earned in the fourth quarter. If the company were unable to deliver customer orders during the holiday season, there would be downside risk to our rating.
• Product pricing: Pricing on 4X6 prints has come down over the last few years, causing the company to look for growth in other product segments. Should other product segments experience similar pricing pressure, our Overweight rating could be at risk.
• Consumer spending: If consumer spending slows more rapidly than we are currently expecting, the company may have difficulty meeting our revenue estimates, and, as such, there could be downside risk to the stock.
242
Global Equity Research 04 January 2010
Imran Khan (1-212) 622-6693 [email protected]
Table 146: SFLY Annual Income Statement $ in millions 2008A 2009E 2010E 2011E Revenues 213.5 231.1 261.4 298.2 Cost of revenues 96.2 108.7 117.3 133.7 Pro forma adj for SBC 0.4 0.4 0.4 0.4 Gross Profit 117.3 122.4 144.1 164.5 Pro forma Gross Profit 119.1 124.4 146.1 166.5 Gross Margins 54.9% 53.0% 55.1% 55.2% Technology and Development 39.5 45.0 48.4 54.9 Sales and Marketing 42.0 42.6 51.5 59.5 General and Administrative 32.3 33.8 35.8 38.3 Total Operating Expenses 113.8 121.4 135.7 152.8 - - SBC opex adjustments: - - Technology and development 2.2 2.3 - - Sales and marketing 2.2 2.4 - - General and administrative 4.9 4.8 - - Total SBC adjustments 9.4 13.9 13.5 15.2 Amortization 1.8 1.9 2.0 2.4 Total pro forma operating expenses 102.6 105.6 120.2 135.2 Income from Operations 3.5 1.0 8.4 11.7 PF Income from Operations 16.5 18.9 25.9 31.3 Operating Margins 1.6% 0.4% 3.2% 3.9% EBITDA 39.3 42.5 50.5 57.0 EBITDA Margins 18.4% 18.4% 19.3% 19.1%
Interest Expense (0.3) (0.2) (0.1) (0.1) Interest Income 2.9 1.1 4.0 4.0 EBT and accounting change 6.1 1.9 12.3 15.6 Tax benefit (provision) (1.6) (1.1) (4.9) (6.2) Assumed Tax Rate 26% 60% 40% 40% Pro forma EBT 19.2 19.8 29.8 35.3 Pro forma tax benefit (provision) (4.9) (6.6) (10.4) (12.3) Pro forma Assumed Tax Rate 26% 34% 35% 35% EAT and before accounting change 4.5 0.7 7.4 9.4 Cumulative effect of change in acct principle - - - - Net income 4.5 0.7 7.4 9.4 Pro forma net income 14.2 13.1 19.4 22.9 EPS - basic 0.18 0.02 0.28 0.35 EPS - diluted 0.18 0.03 0.27 0.33 Pro forma EPS (diluted) 0.55 0.49 0.72 0.85 Pro Forma Dilluted Sharecount 26.5 26.8 26.9 26.9 Shares outstanding - basic 25.0 25.4 25.9 26.3 Shares outstanding - diluted 25.8 26.8 26.9 26.9 METRICS Customers 2,788,743 2,974,443 3,461,813 3,932,903 Y/Y Growth 18.3% 6.7% 16.4% 13.6% Orders 7,569,448 7,651,285 8,325,717 9,024,035 Y/Y Growth 7.2% 1.1% 8.8% 8.4% Average orders per customer 1.81 1.70 1.60 1.52 Y/Y Growth -6.6% -5.8% -6.1% -4.7% Average Order Size $28.20 $30.20 $31.39 $33.04 Y/Y Growth 6.7% 7.1% 3.9% 5.3% Print Revenue (% of total revenue) 39% 34% 30% 30% Non-Print Revenue (% of total revenue) 61% 66% 70% 70% Commercial Print revenue (% of total revenue) Print Revenue 83.6 79.3 77.4 88.4
243
Global Equity Research 04 January 2010
Imran Khan (1-212) 622-6693 [email protected]
Non-print revenue 129.8 149.1 183.9 209.7 Commercial Print revenue Expenses as % of Revenue Cost of revenues 45.1% 47.0% 44.9% 44.8% Technology and Development 18.5% 19.5% 18.5% 18.4% Sales and Marketing 19.7% 18.4% 19.7% 20.0% General and Administrative 15.1% 14.6% 13.7% 12.9% Y/Y Change Revenue Growth 14.3% 8.3% 13.1% 14.1% Print Revenue Non-print revenue Cost of revenues 14.3% 13.1% 7.9% 14.0% Technology and Development 37.9% 14.1% 7.4% 13.5% Sales and Marketing 25.9% 1.5% 20.9% 15.5% General and Administrative 9.4% 4.4% 6.1% 7.1% Source: Company reports and J.P. Morgan estimates.
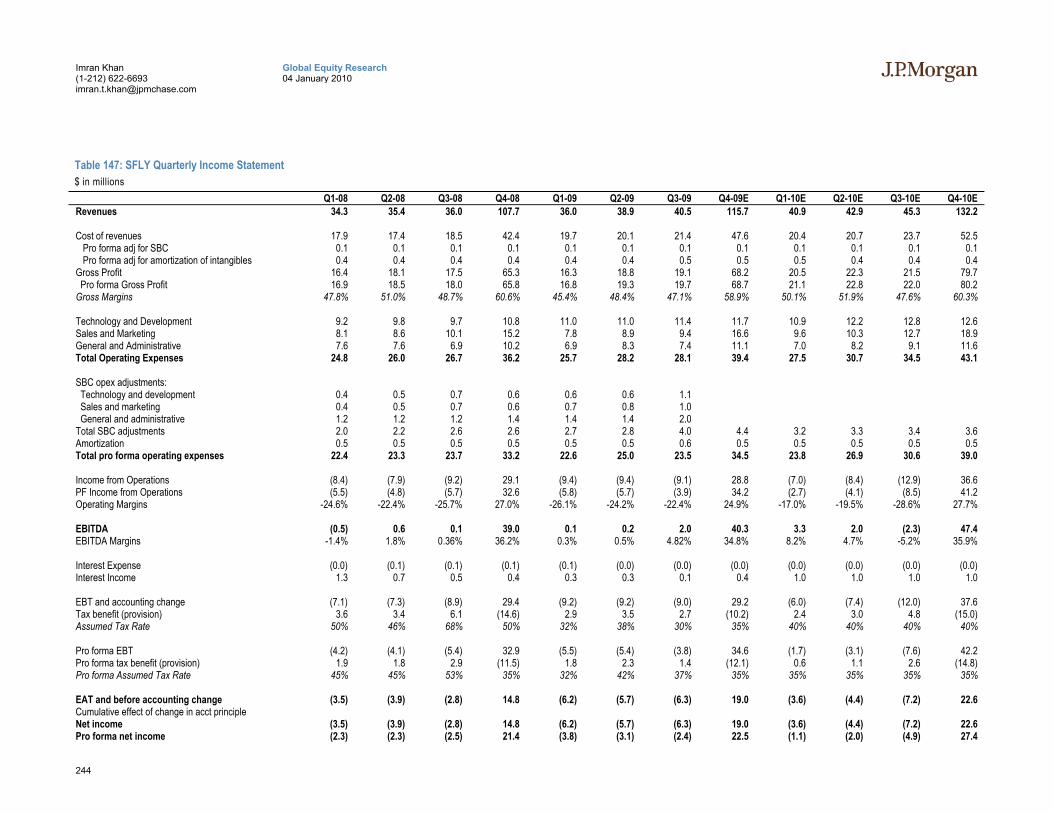
244
Global Equity Research 04 January 2010
Imran Khan (1-212) 622-6693 [email protected]
Table 147: SFLY Quarterly Income Statement $ in millions
Q1-08 Q2-08 Q3-08 Q4-08 Q1-09 Q2-09 Q3-09 Q4-09E Q1-10E Q2-10E Q3-10E Q4-10E Revenues 34.3 35.4 36.0 107.7 36.0 38.9 40.5 115.7 40.9 42.9 45.3 132.2 Cost of revenues 17.9 17.4 18.5 42.4 19.7 20.1 21.4 47.6 20.4 20.7 23.7 52.5 Pro forma adj for SBC 0.1 0.1 0.1 0.1 0.1 0.1 0.1 0.1 0.1 0.1 0.1 0.1 Pro forma adj for amortization of intangibles 0.4 0.4 0.4 0.4 0.4 0.4 0.5 0.5 0.5 0.4 0.4 0.4 Gross Profit 16.4 18.1 17.5 65.3 16.3 18.8 19.1 68.2 20.5 22.3 21.5 79.7 Pro forma Gross Profit 16.9 18.5 18.0 65.8 16.8 19.3 19.7 68.7 21.1 22.8 22.0 80.2 Gross Margins 47.8% 51.0% 48.7% 60.6% 45.4% 48.4% 47.1% 58.9% 50.1% 51.9% 47.6% 60.3% Technology and Development 9.2 9.8 9.7 10.8 11.0 11.0 11.4 11.7 10.9 12.2 12.8 12.6 Sales and Marketing 8.1 8.6 10.1 15.2 7.8 8.9 9.4 16.6 9.6 10.3 12.7 18.9 General and Administrative 7.6 7.6 6.9 10.2 6.9 8.3 7.4 11.1 7.0 8.2 9.1 11.6 Total Operating Expenses 24.8 26.0 26.7 36.2 25.7 28.2 28.1 39.4 27.5 30.7 34.5 43.1 SBC opex adjustments: Technology and development 0.4 0.5 0.7 0.6 0.6 0.6 1.1 Sales and marketing 0.4 0.5 0.7 0.6 0.7 0.8 1.0 General and administrative 1.2 1.2 1.2 1.4 1.4 1.4 2.0 Total SBC adjustments 2.0 2.2 2.6 2.6 2.7 2.8 4.0 4.4 3.2 3.3 3.4 3.6 Amortization 0.5 0.5 0.5 0.5 0.5 0.5 0.6 0.5 0.5 0.5 0.5 0.5 Total pro forma operating expenses 22.4 23.3 23.7 33.2 22.6 25.0 23.5 34.5 23.8 26.9 30.6 39.0 Income from Operations (8.4) (7.9) (9.2) 29.1 (9.4) (9.4) (9.1) 28.8 (7.0) (8.4) (12.9) 36.6 PF Income from Operations (5.5) (4.8) (5.7) 32.6 (5.8) (5.7) (3.9) 34.2 (2.7) (4.1) (8.5) 41.2 Operating Margins -24.6% -22.4% -25.7% 27.0% -26.1% -24.2% -22.4% 24.9% -17.0% -19.5% -28.6% 27.7% EBITDA (0.5) 0.6 0.1 39.0 0.1 0.2 2.0 40.3 3.3 2.0 (2.3) 47.4 EBITDA Margins -1.4% 1.8% 0.36% 36.2% 0.3% 0.5% 4.82% 34.8% 8.2% 4.7% -5.2% 35.9% Interest Expense (0.0) (0.1) (0.1) (0.1) (0.1) (0.0) (0.0) (0.0) (0.0) (0.0) (0.0) (0.0) Interest Income 1.3 0.7 0.5 0.4 0.3 0.3 0.1 0.4 1.0 1.0 1.0 1.0 EBT and accounting change (7.1) (7.3) (8.9) 29.4 (9.2) (9.2) (9.0) 29.2 (6.0) (7.4) (12.0) 37.6 Tax benefit (provision) 3.6 3.4 6.1 (14.6) 2.9 3.5 2.7 (10.2) 2.4 3.0 4.8 (15.0) Assumed Tax Rate 50% 46% 68% 50% 32% 38% 30% 35% 40% 40% 40% 40% Pro forma EBT (4.2) (4.1) (5.4) 32.9 (5.5) (5.4) (3.8) 34.6 (1.7) (3.1) (7.6) 42.2 Pro forma tax benefit (provision) 1.9 1.8 2.9 (11.5) 1.8 2.3 1.4 (12.1) 0.6 1.1 2.6 (14.8) Pro forma Assumed Tax Rate 45% 45% 53% 35% 32% 42% 37% 35% 35% 35% 35% 35% EAT and before accounting change (3.5) (3.9) (2.8) 14.8 (6.2) (5.7) (6.3) 19.0 (3.6) (4.4) (7.2) 22.6 Cumulative effect of change in acct principle Net income (3.5) (3.9) (2.8) 14.8 (6.2) (5.7) (6.3) 19.0 (3.6) (4.4) (7.2) 22.6 Pro forma net income (2.3) (2.3) (2.5) 21.4 (3.8) (3.1) (2.4) 22.5 (1.1) (2.0) (4.9) 27.4
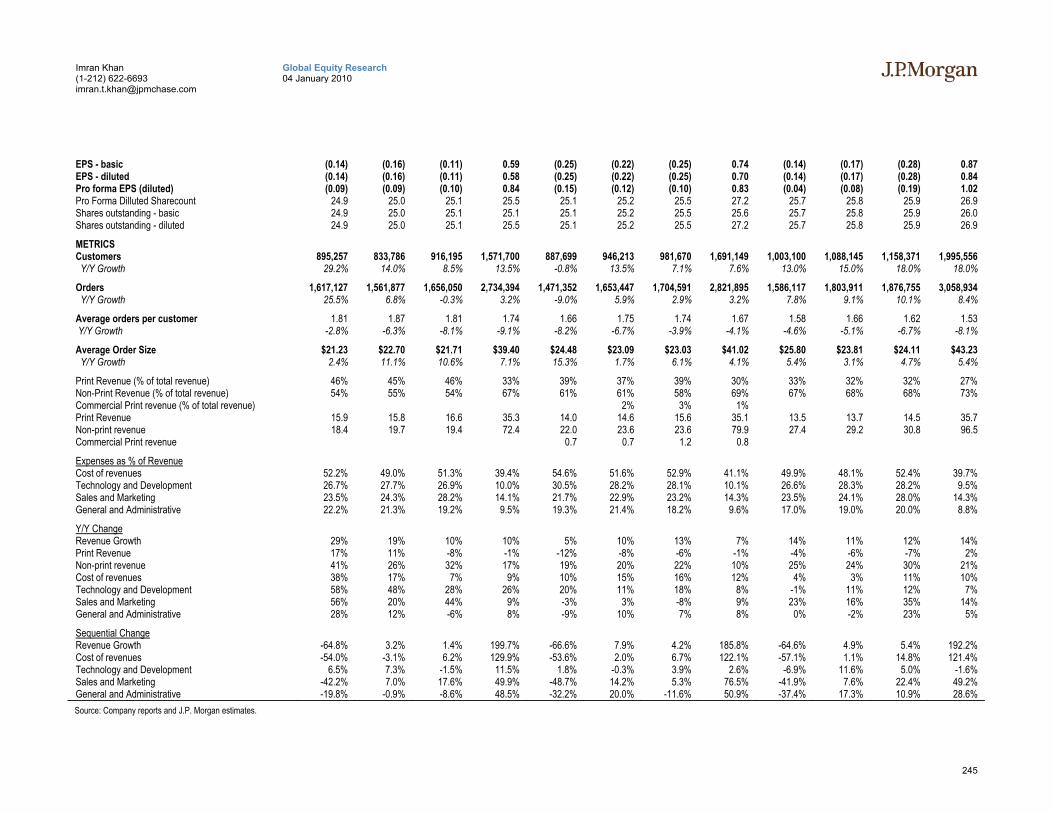
245
Global Equity Research 04 January 2010
Imran Khan (1-212) 622-6693 [email protected]
EPS - basic (0.14) (0.16) (0.11) 0.59 (0.25) (0.22) (0.25) 0.74 (0.14) (0.17) (0.28) 0.87 EPS - diluted (0.14) (0.16) (0.11) 0.58 (0.25) (0.22) (0.25) 0.70 (0.14) (0.17) (0.28) 0.84 Pro forma EPS (diluted) (0.09) (0.09) (0.10) 0.84 (0.15) (0.12) (0.10) 0.83 (0.04) (0.08) (0.19) 1.02 Pro Forma Dilluted Sharecount 24.9 25.0 25.1 25.5 25.1 25.2 25.5 27.2 25.7 25.8 25.9 26.9 Shares outstanding - basic 24.9 25.0 25.1 25.1 25.1 25.2 25.5 25.6 25.7 25.8 25.9 26.0 Shares outstanding - diluted 24.9 25.0 25.1 25.5 25.1 25.2 25.5 27.2 25.7 25.8 25.9 26.9 METRICS Customers 895,257 833,786 916,195 1,571,700 887,699 946,213 981,670 1,691,149 1,003,100 1,088,145 1,158,371 1,995,556 Y/Y Growth 29.2% 14.0% 8.5% 13.5% -0.8% 13.5% 7.1% 7.6% 13.0% 15.0% 18.0% 18.0% Orders 1,617,127 1,561,877 1,656,050 2,734,394 1,471,352 1,653,447 1,704,591 2,821,895 1,586,117 1,803,911 1,876,755 3,058,934 Y/Y Growth 25.5% 6.8% -0.3% 3.2% -9.0% 5.9% 2.9% 3.2% 7.8% 9.1% 10.1% 8.4% Average orders per customer 1.81 1.87 1.81 1.74 1.66 1.75 1.74 1.67 1.58 1.66 1.62 1.53 Y/Y Growth -2.8% -6.3% -8.1% -9.1% -8.2% -6.7% -3.9% -4.1% -4.6% -5.1% -6.7% -8.1% Average Order Size $21.23 $22.70 $21.71 $39.40 $24.48 $23.09 $23.03 $41.02 $25.80 $23.81 $24.11 $43.23 Y/Y Growth 2.4% 11.1% 10.6% 7.1% 15.3% 1.7% 6.1% 4.1% 5.4% 3.1% 4.7% 5.4% Print Revenue (% of total revenue) 46% 45% 46% 33% 39% 37% 39% 30% 33% 32% 32% 27% Non-Print Revenue (% of total revenue) 54% 55% 54% 67% 61% 61% 58% 69% 67% 68% 68% 73% Commercial Print revenue (% of total revenue) 2% 3% 1% Print Revenue 15.9 15.8 16.6 35.3 14.0 14.6 15.6 35.1 13.5 13.7 14.5 35.7 Non-print revenue 18.4 19.7 19.4 72.4 22.0 23.6 23.6 79.9 27.4 29.2 30.8 96.5 Commercial Print revenue 0.7 0.7 1.2 0.8 Expenses as % of Revenue Cost of revenues 52.2% 49.0% 51.3% 39.4% 54.6% 51.6% 52.9% 41.1% 49.9% 48.1% 52.4% 39.7% Technology and Development 26.7% 27.7% 26.9% 10.0% 30.5% 28.2% 28.1% 10.1% 26.6% 28.3% 28.2% 9.5% Sales and Marketing 23.5% 24.3% 28.2% 14.1% 21.7% 22.9% 23.2% 14.3% 23.5% 24.1% 28.0% 14.3% General and Administrative 22.2% 21.3% 19.2% 9.5% 19.3% 21.4% 18.2% 9.6% 17.0% 19.0% 20.0% 8.8% Y/Y Change Revenue Growth 29% 19% 10% 10% 5% 10% 13% 7% 14% 11% 12% 14% Print Revenue 17% 11% -8% -1% -12% -8% -6% -1% -4% -6% -7% 2% Non-print revenue 41% 26% 32% 17% 19% 20% 22% 10% 25% 24% 30% 21% Cost of revenues 38% 17% 7% 9% 10% 15% 16% 12% 4% 3% 11% 10% Technology and Development 58% 48% 28% 26% 20% 11% 18% 8% -1% 11% 12% 7% Sales and Marketing 56% 20% 44% 9% -3% 3% -8% 9% 23% 16% 35% 14% General and Administrative 28% 12% -6% 8% -9% 10% 7% 8% 0% -2% 23% 5% Sequential Change Revenue Growth -64.8% 3.2% 1.4% 199.7% -66.6% 7.9% 4.2% 185.8% -64.6% 4.9% 5.4% 192.2% Cost of revenues -54.0% -3.1% 6.2% 129.9% -53.6% 2.0% 6.7% 122.1% -57.1% 1.1% 14.8% 121.4% Technology and Development 6.5% 7.3% -1.5% 11.5% 1.8% -0.3% 3.9% 2.6% -6.9% 11.6% 5.0% -1.6% Sales and Marketing -42.2% 7.0% 17.6% 49.9% -48.7% 14.2% 5.3% 76.5% -41.9% 7.6% 22.4% 49.2% General and Administrative -19.8% -0.9% -8.6% 48.5% -32.2% 20.0% -11.6% 50.9% -37.4% 17.3% 10.9% 28.6% Source: Company reports and J.P. Morgan estimates.
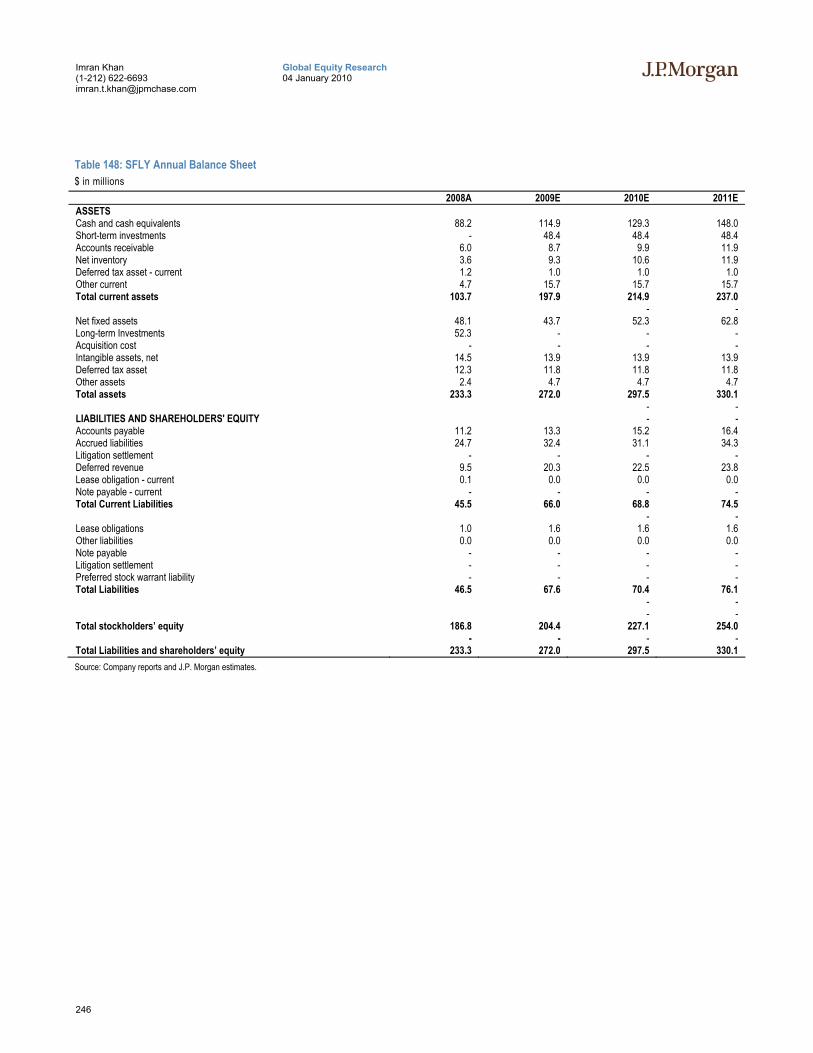
246
Global Equity Research 04 January 2010
Imran Khan (1-212) 622-6693 [email protected]
Table 148: SFLY Annual Balance Sheet $ in millions
2008A 2009E 2010E 2011E ASSETS Cash and cash equivalents 88.2 114.9 129.3 148.0 Short-term investments - 48.4 48.4 48.4 Accounts receivable 6.0 8.7 9.9 11.9 Net inventory 3.6 9.3 10.6 11.9 Deferred tax asset - current 1.2 1.0 1.0 1.0 Other current 4.7 15.7 15.7 15.7 Total current assets 103.7 197.9 214.9 237.0 - - Net fixed assets 48.1 43.7 52.3 62.8 Long-term Investments 52.3 - - - Acquisition cost - - - - Intangible assets, net 14.5 13.9 13.9 13.9 Deferred tax asset 12.3 11.8 11.8 11.8 Other assets 2.4 4.7 4.7 4.7 Total assets 233.3 272.0 297.5 330.1 - - LIABILITIES AND SHAREHOLDERS' EQUITY - - Accounts payable 11.2 13.3 15.2 16.4 Accrued liabilities 24.7 32.4 31.1 34.3 Litigation settlement - - - - Deferred revenue 9.5 20.3 22.5 23.8 Lease obligation - current 0.1 0.0 0.0 0.0 Note payable - current - - - - Total Current Liabilities 45.5 66.0 68.8 74.5 - - Lease obligations 1.0 1.6 1.6 1.6 Other liabilities 0.0 0.0 0.0 0.0 Note payable - - - - Litigation settlement - - - - Preferred stock warrant liability - - - - Total Liabilities 46.5 67.6 70.4 76.1 - - - - Total stockholders’ equity 186.8 204.4 227.1 254.0 - - - - Total Liabilities and shareholders’ equity 233.3 272.0 297.5 330.1 Source: Company reports and J.P. Morgan estimates.
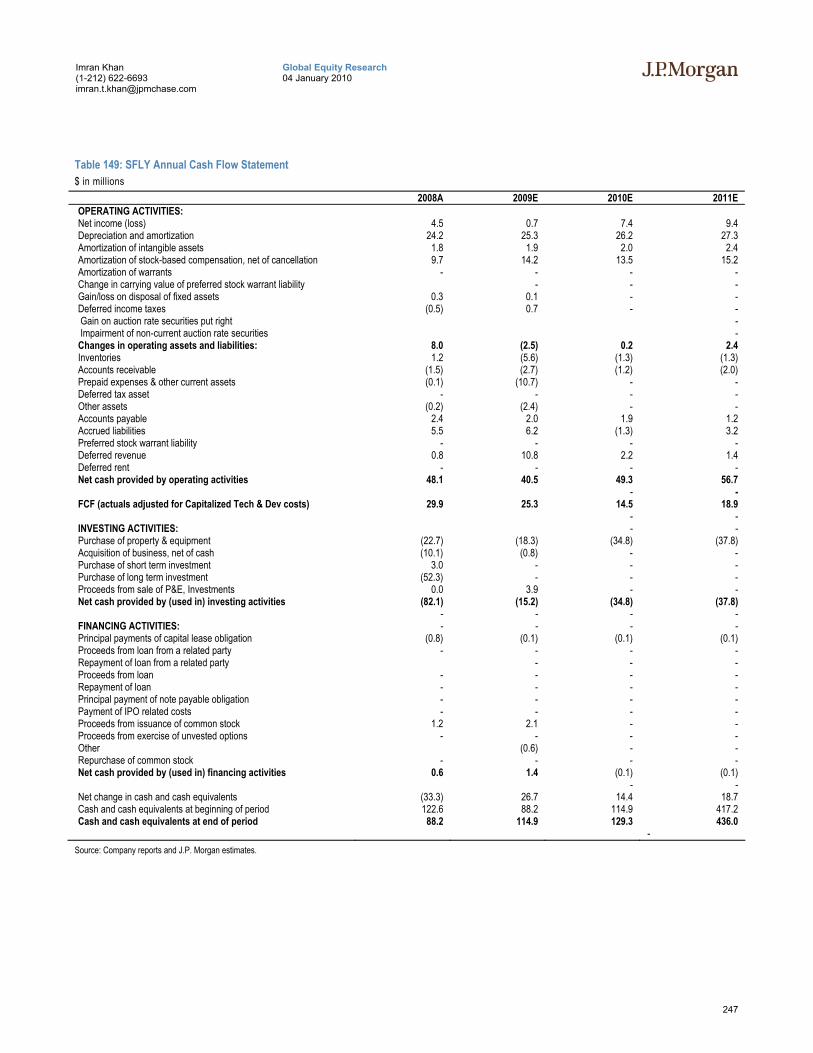
247
Global Equity Research 04 January 2010
Imran Khan (1-212) 622-6693 [email protected]
Table 149: SFLY Annual Cash Flow Statement $ in millions
2008A 2009E 2010E 2011E OPERATING ACTIVITIES: Net income (loss) 4.5 0.7 7.4 9.4 Depreciation and amortization 24.2 25.3 26.2 27.3 Amortization of intangible assets 1.8 1.9 2.0 2.4 Amortization of stock-based compensation, net of cancellation 9.7 14.2 13.5 15.2 Amortization of warrants - - - - Change in carrying value of preferred stock warrant liability - - - Gain/loss on disposal of fixed assets 0.3 0.1 - - Deferred income taxes (0.5) 0.7 - - Gain on auction rate securities put right - Impairment of non-current auction rate securities - Changes in operating assets and liabilities: 8.0 (2.5) 0.2 2.4 Inventories 1.2 (5.6) (1.3) (1.3) Accounts receivable (1.5) (2.7) (1.2) (2.0) Prepaid expenses & other current assets (0.1) (10.7) - - Deferred tax asset - - - - Other assets (0.2) (2.4) - - Accounts payable 2.4 2.0 1.9 1.2 Accrued liabilities 5.5 6.2 (1.3) 3.2 Preferred stock warrant liability - - - - Deferred revenue 0.8 10.8 2.2 1.4 Deferred rent - - - - Net cash provided by operating activities 48.1 40.5 49.3 56.7 - - FCF (actuals adjusted for Capitalized Tech & Dev costs) 29.9 25.3 14.5 18.9 - - INVESTING ACTIVITIES: - - Purchase of property & equipment (22.7) (18.3) (34.8) (37.8) Acquisition of business, net of cash (10.1) (0.8) - - Purchase of short term investment 3.0 - - - Purchase of long term investment (52.3) - - - Proceeds from sale of P&E, Investments 0.0 3.9 - - Net cash provided by (used in) investing activities (82.1) (15.2) (34.8) (37.8) - - - - FINANCING ACTIVITIES: - - - - Principal payments of capital lease obligation (0.8) (0.1) (0.1) (0.1) Proceeds from loan from a related party - - - - Repayment of loan from a related party - - - Proceeds from loan - - - - Repayment of loan - - - - Principal payment of note payable obligation - - - - Payment of IPO related costs - - - - Proceeds from issuance of common stock 1.2 2.1 - - Proceeds from exercise of unvested options - - - - Other (0.6) - - Repurchase of common stock - - - - Net cash provided by (used in) financing activities 0.6 1.4 (0.1) (0.1) - - Net change in cash and cash equivalents (33.3) 26.7 14.4 18.7 Cash and cash equivalents at beginning of period 122.6 88.2 114.9 417.2 Cash and cash equivalents at end of period 88.2 114.9 129.3 436.0 - Source: Company reports and J.P. Morgan estimates.
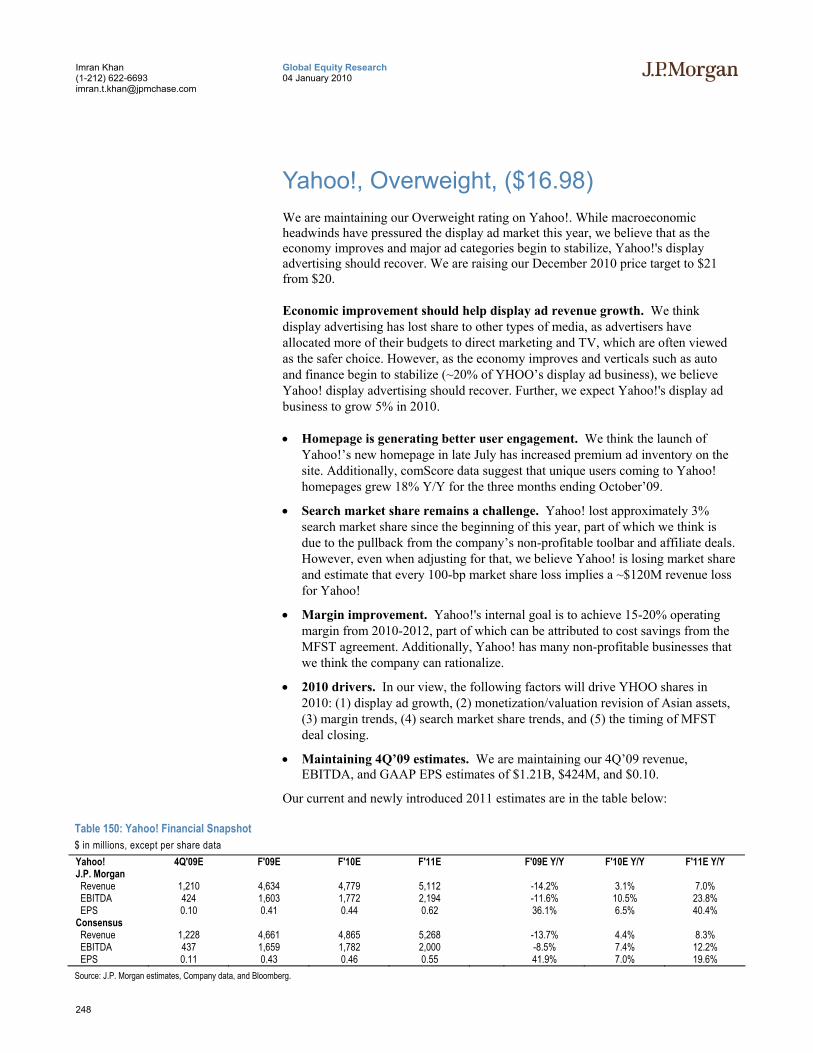
248
Global Equity Research 04 January 2010
Imran Khan (1-212) 622-6693 [email protected]
Yahoo!, Overweight, ($16.98) We are maintaining our Overweight rating on Yahoo!. While macroeconomic headwinds have pressured the display ad market this year, we believe that as the economy improves and major ad categories begin to stabilize, Yahoo!'s display advertising should recover. We are raising our December 2010 price target to $21 from $20.
Economic improvement should help display ad revenue growth. We think display advertising has lost share to other types of media, as advertisers have allocated more of their budgets to direct marketing and TV, which are often viewed as the safer choice. However, as the economy improves and verticals such as auto and finance begin to stabilize (~20% of YHOO’s display ad business), we believe Yahoo! display advertising should recover. Further, we expect Yahoo!'s display ad business to grow 5% in 2010.
• Homepage is generating better user engagement. We think the launch of Yahoo!’s new homepage in late July has increased premium ad inventory on the site. Additionally, comScore data suggest that unique users coming to Yahoo! homepages grew 18% Y/Y for the three months ending October’09.
• Search market share remains a challenge. Yahoo! lost approximately 3% search market share since the beginning of this year, part of which we think is due to the pullback from the company’s non-profitable toolbar and affiliate deals. However, even when adjusting for that, we believe Yahoo! is losing market share and estimate that every 100-bp market share loss implies a ~$120M revenue loss for Yahoo!
• Margin improvement. Yahoo!'s internal goal is to achieve 15-20% operating margin from 2010-2012, part of which can be attributed to cost savings from the MFST agreement. Additionally, Yahoo! has many non-profitable businesses that we think the company can rationalize.
• 2010 drivers. In our view, the following factors will drive YHOO shares in 2010: (1) display ad growth, (2) monetization/valuation revision of Asian assets, (3) margin trends, (4) search market share trends, and (5) the timing of MFST deal closing.
• Maintaining 4Q’09 estimates. We are maintaining our 4Q’09 revenue, EBITDA, and GAAP EPS estimates of $1.21B, $424M, and $0.10.
Our current and newly introduced 2011 estimates are in the table below:
Table 150: Yahoo! Financial Snapshot $ in millions, except per share data Yahoo! 4Q'09E F'09E F'10E F'11E F'09E Y/Y F'10E Y/Y F'11E Y/Y J.P. Morgan Revenue 1,210 4,634 4,779 5,112 -14.2% 3.1% 7.0% EBITDA 424 1,603 1,772 2,194 -11.6% 10.5% 23.8% EPS 0.10 0.41 0.44 0.62 36.1% 6.5% 40.4% Consensus Revenue 1,228 4,661 4,865 5,268 -13.7% 4.4% 8.3% EBITDA 437 1,659 1,782 2,000 -8.5% 7.4% 12.2% EPS 0.11 0.43 0.46 0.55 41.9% 7.0% 19.6% Source: J.P. Morgan estimates, Company data, and Bloomberg.
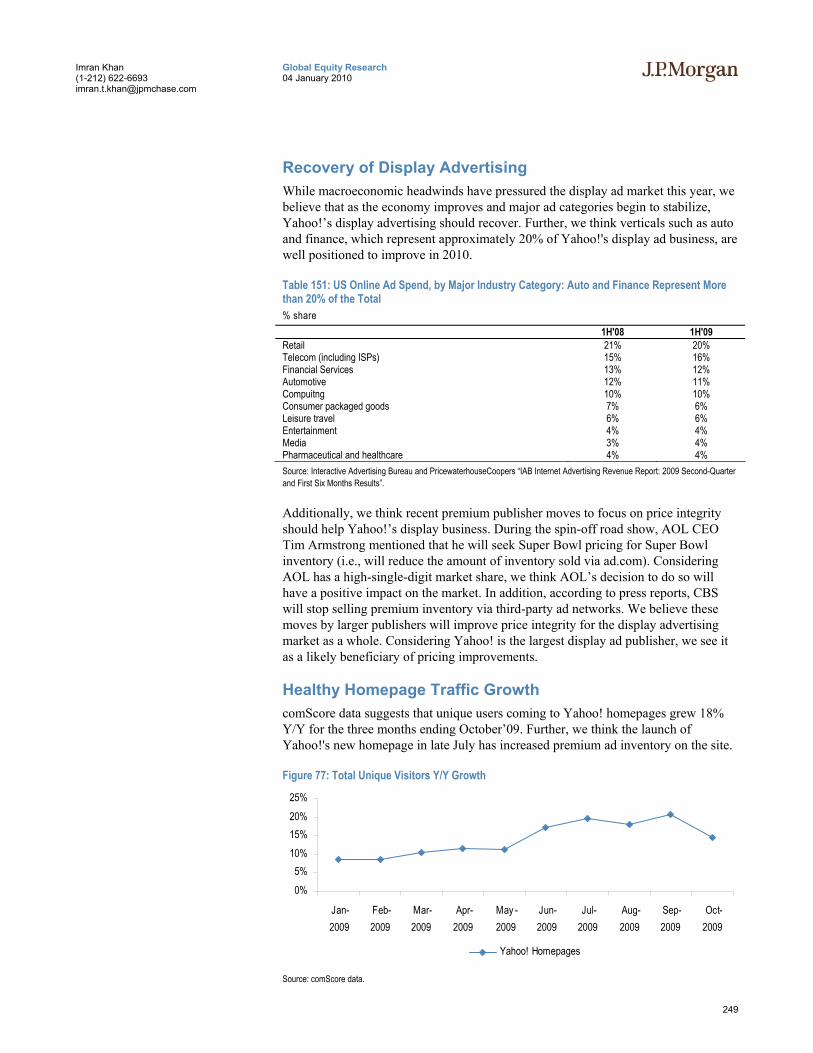
249
Global Equity Research 04 January 2010
Imran Khan (1-212) 622-6693 [email protected]
Recovery of Display Advertising While macroeconomic headwinds have pressured the display ad market this year, we believe that as the economy improves and major ad categories begin to stabilize, Yahoo!’s display advertising should recover. Further, we think verticals such as auto and finance, which represent approximately 20% of Yahoo!'s display ad business, are well positioned to improve in 2010.
Table 151: US Online Ad Spend, by Major Industry Category: Auto and Finance Represent More than 20% of the Total % share
1H'08 1H'09 Retail 21% 20% Telecom (including ISPs) 15% 16% Financial Services 13% 12% Automotive 12% 11% Compuitng 10% 10% Consumer packaged goods 7% 6% Leisure travel 6% 6% Entertainment 4% 4% Media 3% 4% Pharmaceutical and healthcare 4% 4% Source: Interactive Advertising Bureau and PricewaterhouseCoopers “IAB Internet Advertising Revenue Report: 2009 Second-Quarter and First Six Months Results”.
Additionally, we think recent premium publisher moves to focus on price integrity should help Yahoo!’s display business. During the spin-off road show, AOL CEO Tim Armstrong mentioned that he will seek Super Bowl pricing for Super Bowl inventory (i.e., will reduce the amount of inventory sold via ad.com). Considering AOL has a high-single-digit market share, we think AOL’s decision to do so will have a positive impact on the market. In addition, according to press reports, CBS will stop selling premium inventory via third-party ad networks. We believe these moves by larger publishers will improve price integrity for the display advertising market as a whole. Considering Yahoo! is the largest display ad publisher, we see it as a likely beneficiary of pricing improvements.
Healthy Homepage Traffic Growth comScore data suggests that unique users coming to Yahoo! homepages grew 18% Y/Y for the three months ending October’09. Further, we think the launch of Yahoo!'s new homepage in late July has increased premium ad inventory on the site.
Figure 77: Total Unique Visitors Y/Y Growth
0%5%
10%15%20%25%
Jan-2009
Feb-2009
Mar-2009
Apr-2009
May -2009
Jun-2009
Jul-2009
Aug-2009
Sep-2009
Oct-2009
Yahoo! Homepages
Source: comScore data.
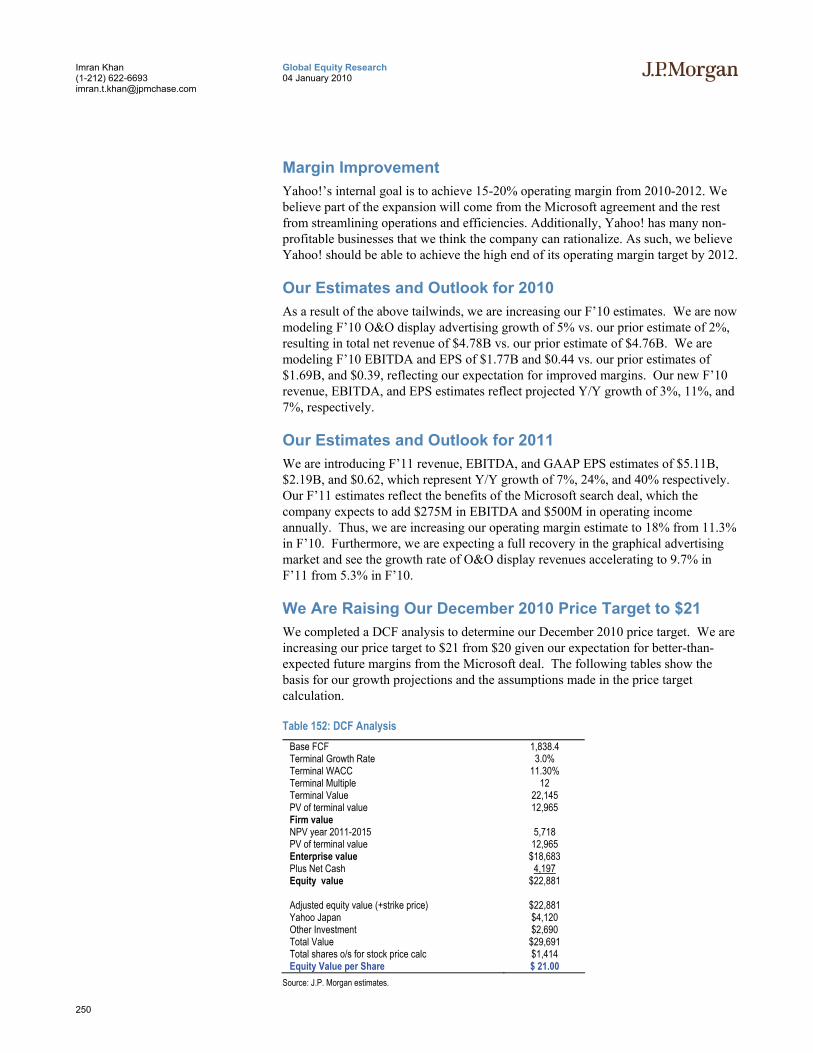
250
Global Equity Research 04 January 2010
Imran Khan (1-212) 622-6693 [email protected]
Margin Improvement Yahoo!’s internal goal is to achieve 15-20% operating margin from 2010-2012. We believe part of the expansion will come from the Microsoft agreement and the rest from streamlining operations and efficiencies. Additionally, Yahoo! has many non-profitable businesses that we think the company can rationalize. As such, we believe Yahoo! should be able to achieve the high end of its operating margin target by 2012.
Our Estimates and Outlook for 2010 As a result of the above tailwinds, we are increasing our F’10 estimates. We are now modeling F’10 O&O display advertising growth of 5% vs. our prior estimate of 2%, resulting in total net revenue of $4.78B vs. our prior estimate of $4.76B. We are modeling F’10 EBITDA and EPS of $1.77B and $0.44 vs. our prior estimates of $1.69B, and $0.39, reflecting our expectation for improved margins. Our new F’10 revenue, EBITDA, and EPS estimates reflect projected Y/Y growth of 3%, 11%, and 7%, respectively.
Our Estimates and Outlook for 2011 We are introducing F’11 revenue, EBITDA, and GAAP EPS estimates of $5.11B, $2.19B, and $0.62, which represent Y/Y growth of 7%, 24%, and 40% respectively. Our F’11 estimates reflect the benefits of the Microsoft search deal, which the company expects to add $275M in EBITDA and $500M in operating income annually. Thus, we are increasing our operating margin estimate to 18% from 11.3% in F’10. Furthermore, we are expecting a full recovery in the graphical advertising market and see the growth rate of O&O display revenues accelerating to 9.7% in F’11 from 5.3% in F’10.
We Are Raising Our December 2010 Price Target to $21 We completed a DCF analysis to determine our December 2010 price target. We are increasing our price target to $21 from $20 given our expectation for better-than-expected future margins from the Microsoft deal. The following tables show the basis for our growth projections and the assumptions made in the price target calculation.
Table 152: DCF Analysis Base FCF 1,838.4 Terminal Growth Rate 3.0% Terminal WACC 11.30% Terminal Multiple 12 Terminal Value 22,145 PV of terminal value 12,965 Firm value NPV year 2011-2015 5,718 PV of terminal value 12,965 Enterprise value $18,683 Plus Net Cash 4,197 Equity value $22,881 Adjusted equity value (+strike price) $22,881 Yahoo Japan $4,120 Other Investment $2,690 Total Value $29,691 Total shares o/s for stock price calc $1,414 Equity Value per Share $ 21.00
Source: J.P. Morgan estimates.
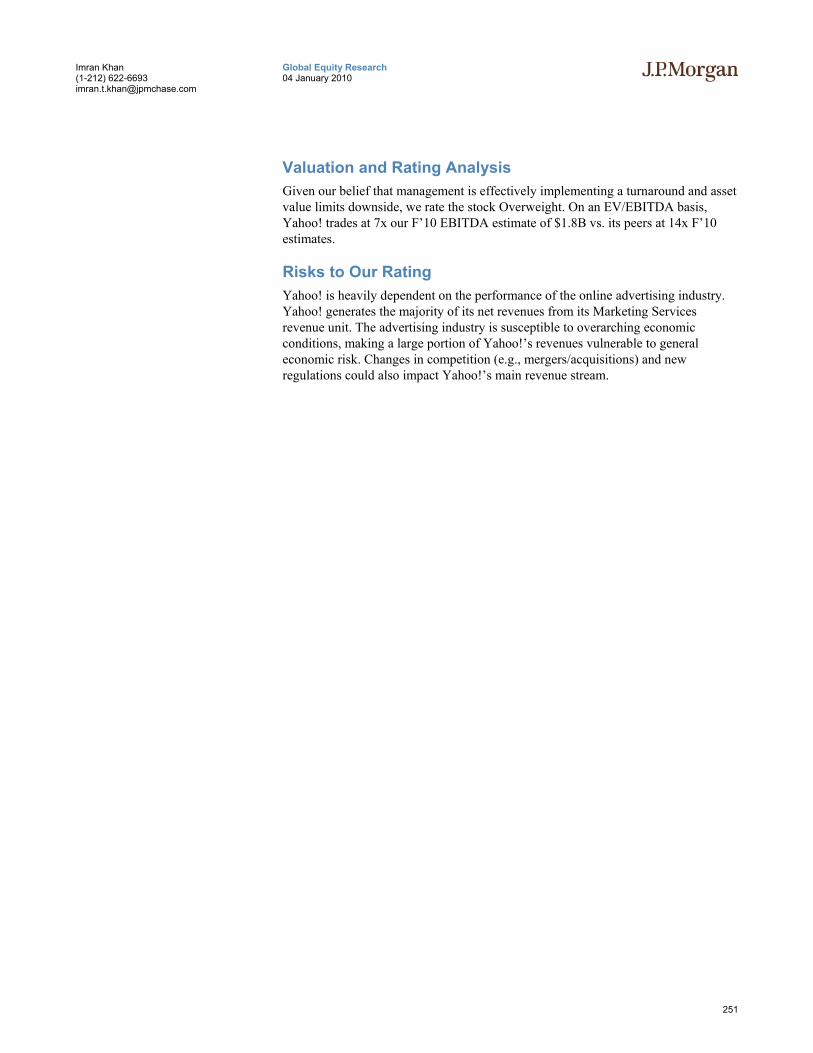
251
Global Equity Research 04 January 2010
Imran Khan (1-212) 622-6693 [email protected]
Valuation and Rating Analysis Given our belief that management is effectively implementing a turnaround and asset value limits downside, we rate the stock Overweight. On an EV/EBITDA basis, Yahoo! trades at 7x our F’10 EBITDA estimate of $1.8B vs. its peers at 14x F’10 estimates.
Risks to Our Rating Yahoo! is heavily dependent on the performance of the online advertising industry. Yahoo! generates the majority of its net revenues from its Marketing Services revenue unit. The advertising industry is susceptible to overarching economic conditions, making a large portion of Yahoo!’s revenues vulnerable to general economic risk. Changes in competition (e.g., mergers/acquisitions) and new regulations could also impact Yahoo!’s main revenue stream.
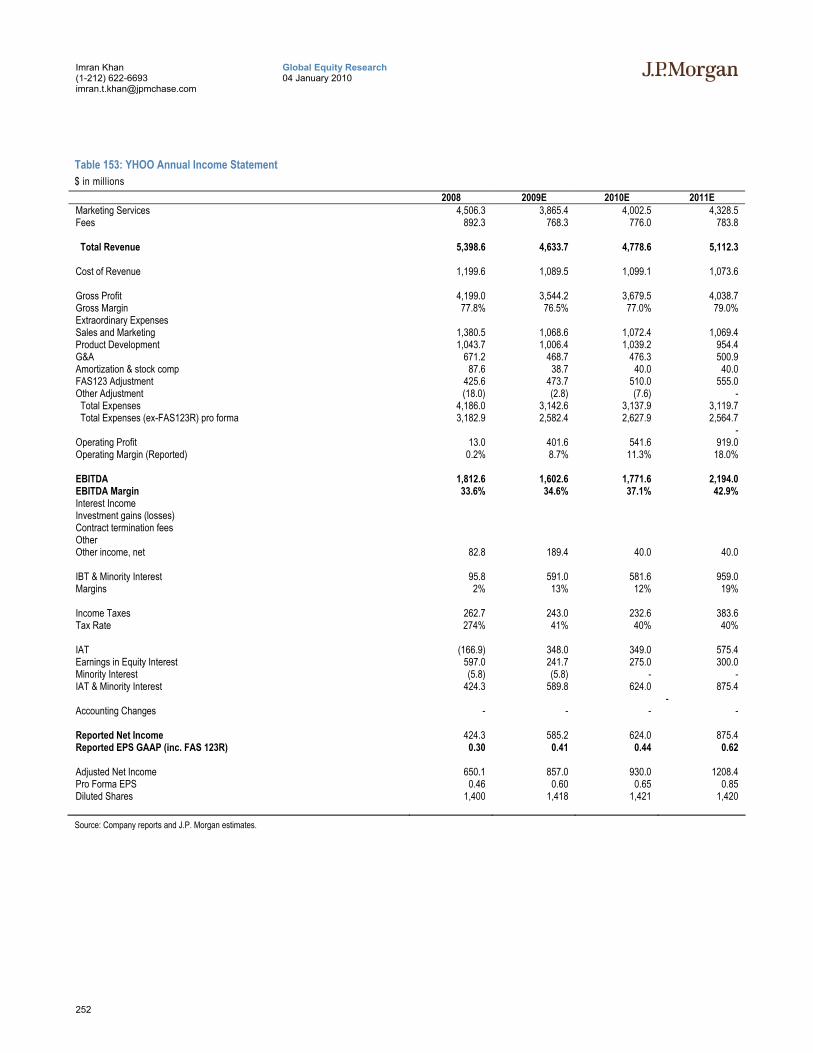
252
Global Equity Research 04 January 2010
Imran Khan (1-212) 622-6693 [email protected]
Table 153: YHOO Annual Income Statement $ in millions
2008 2009E 2010E 2011E Marketing Services 4,506.3 3,865.4 4,002.5 4,328.5 Fees 892.3 768.3 776.0 783.8 Total Revenue 5,398.6 4,633.7 4,778.6 5,112.3 Cost of Revenue 1,199.6 1,089.5 1,099.1 1,073.6 Gross Profit 4,199.0 3,544.2 3,679.5 4,038.7 Gross Margin 77.8% 76.5% 77.0% 79.0% Extraordinary Expenses Sales and Marketing 1,380.5 1,068.6 1,072.4 1,069.4 Product Development 1,043.7 1,006.4 1,039.2 954.4 G&A 671.2 468.7 476.3 500.9 Amortization & stock comp 87.6 38.7 40.0 40.0 FAS123 Adjustment 425.6 473.7 510.0 555.0 Other Adjustment (18.0) (2.8) (7.6) - Total Expenses 4,186.0 3,142.6 3,137.9 3,119.7 Total Expenses (ex-FAS123R) pro forma 3,182.9 2,582.4 2,627.9 2,564.7 - Operating Profit 13.0 401.6 541.6 919.0 Operating Margin (Reported) 0.2% 8.7% 11.3% 18.0% EBITDA 1,812.6 1,602.6 1,771.6 2,194.0 EBITDA Margin 33.6% 34.6% 37.1% 42.9% Interest Income Investment gains (losses) Contract termination fees Other Other income, net 82.8 189.4 40.0 40.0 IBT & Minority Interest 95.8 591.0 581.6 959.0 Margins 2% 13% 12% 19% Income Taxes 262.7 243.0 232.6 383.6 Tax Rate 274% 41% 40% 40% IAT (166.9) 348.0 349.0 575.4 Earnings in Equity Interest 597.0 241.7 275.0 300.0 Minority Interest (5.8) (5.8) - - IAT & Minority Interest 424.3 589.8 624.0 875.4 - Accounting Changes - - - - Reported Net Income 424.3 585.2 624.0 875.4 Reported EPS GAAP (inc. FAS 123R) 0.30 0.41 0.44 0.62 Adjusted Net Income 650.1 857.0 930.0 1208.4 Pro Forma EPS 0.46 0.60 0.65 0.85 Diluted Shares 1,400 1,418 1,421 1,420 Source: Company reports and J.P. Morgan estimates.
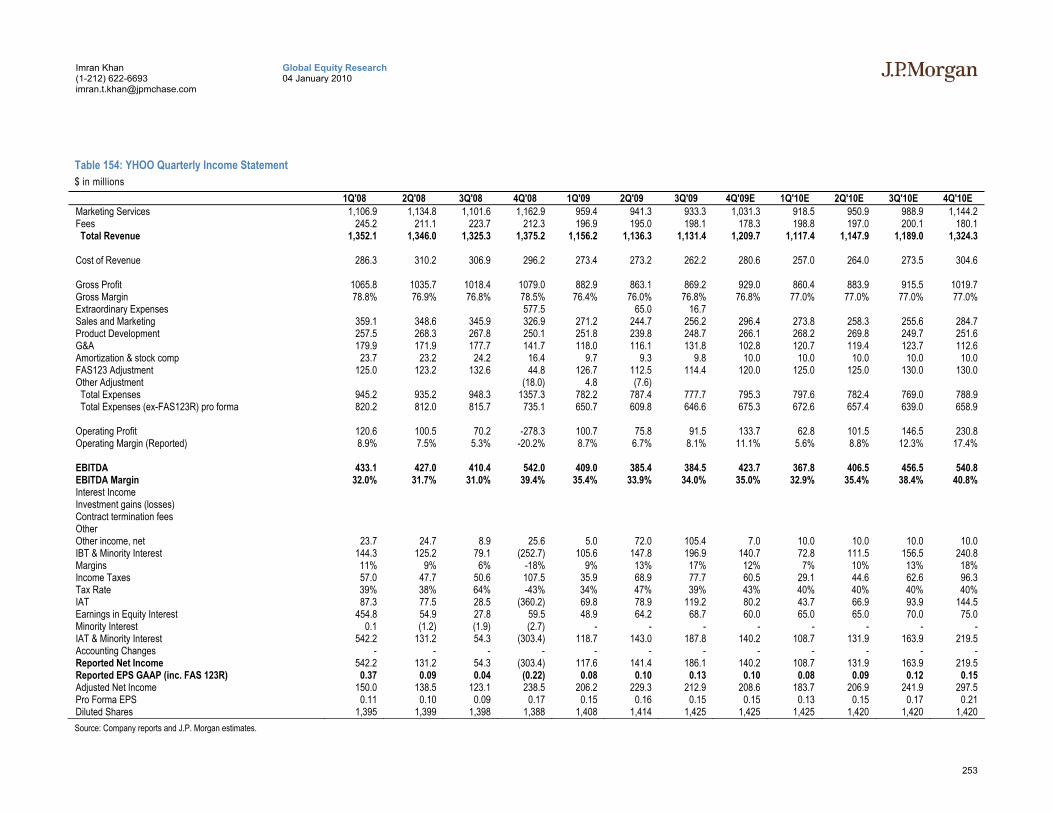
253
Global Equity Research 04 January 2010
Imran Khan (1-212) 622-6693 [email protected]
Table 154: YHOO Quarterly Income Statement $ in millions
1Q'08 2Q'08 3Q'08 4Q'08 1Q'09 2Q'09 3Q'09 4Q'09E 1Q'10E 2Q'10E 3Q'10E 4Q'10E Marketing Services 1,106.9 1,134.8 1,101.6 1,162.9 959.4 941.3 933.3 1,031.3 918.5 950.9 988.9 1,144.2 Fees 245.2 211.1 223.7 212.3 196.9 195.0 198.1 178.3 198.8 197.0 200.1 180.1 Total Revenue 1,352.1 1,346.0 1,325.3 1,375.2 1,156.2 1,136.3 1,131.4 1,209.7 1,117.4 1,147.9 1,189.0 1,324.3 Cost of Revenue 286.3 310.2 306.9 296.2 273.4 273.2 262.2 280.6 257.0 264.0 273.5 304.6 Gross Profit 1065.8 1035.7 1018.4 1079.0 882.9 863.1 869.2 929.0 860.4 883.9 915.5 1019.7 Gross Margin 78.8% 76.9% 76.8% 78.5% 76.4% 76.0% 76.8% 76.8% 77.0% 77.0% 77.0% 77.0% Extraordinary Expenses 577.5 65.0 16.7 Sales and Marketing 359.1 348.6 345.9 326.9 271.2 244.7 256.2 296.4 273.8 258.3 255.6 284.7 Product Development 257.5 268.3 267.8 250.1 251.8 239.8 248.7 266.1 268.2 269.8 249.7 251.6 G&A 179.9 171.9 177.7 141.7 118.0 116.1 131.8 102.8 120.7 119.4 123.7 112.6 Amortization & stock comp 23.7 23.2 24.2 16.4 9.7 9.3 9.8 10.0 10.0 10.0 10.0 10.0 FAS123 Adjustment 125.0 123.2 132.6 44.8 126.7 112.5 114.4 120.0 125.0 125.0 130.0 130.0 Other Adjustment (18.0) 4.8 (7.6) Total Expenses 945.2 935.2 948.3 1357.3 782.2 787.4 777.7 795.3 797.6 782.4 769.0 788.9 Total Expenses (ex-FAS123R) pro forma 820.2 812.0 815.7 735.1 650.7 609.8 646.6 675.3 672.6 657.4 639.0 658.9 Operating Profit 120.6 100.5 70.2 -278.3 100.7 75.8 91.5 133.7 62.8 101.5 146.5 230.8 Operating Margin (Reported) 8.9% 7.5% 5.3% -20.2% 8.7% 6.7% 8.1% 11.1% 5.6% 8.8% 12.3% 17.4% EBITDA 433.1 427.0 410.4 542.0 409.0 385.4 384.5 423.7 367.8 406.5 456.5 540.8 EBITDA Margin 32.0% 31.7% 31.0% 39.4% 35.4% 33.9% 34.0% 35.0% 32.9% 35.4% 38.4% 40.8% Interest Income Investment gains (losses) Contract termination fees Other Other income, net 23.7 24.7 8.9 25.6 5.0 72.0 105.4 7.0 10.0 10.0 10.0 10.0 IBT & Minority Interest 144.3 125.2 79.1 (252.7) 105.6 147.8 196.9 140.7 72.8 111.5 156.5 240.8 Margins 11% 9% 6% -18% 9% 13% 17% 12% 7% 10% 13% 18% Income Taxes 57.0 47.7 50.6 107.5 35.9 68.9 77.7 60.5 29.1 44.6 62.6 96.3 Tax Rate 39% 38% 64% -43% 34% 47% 39% 43% 40% 40% 40% 40% IAT 87.3 77.5 28.5 (360.2) 69.8 78.9 119.2 80.2 43.7 66.9 93.9 144.5 Earnings in Equity Interest 454.8 54.9 27.8 59.5 48.9 64.2 68.7 60.0 65.0 65.0 70.0 75.0 Minority Interest 0.1 (1.2) (1.9) (2.7) - - - - - - - - IAT & Minority Interest 542.2 131.2 54.3 (303.4) 118.7 143.0 187.8 140.2 108.7 131.9 163.9 219.5 Accounting Changes - - - - - - - - - - - - Reported Net Income 542.2 131.2 54.3 (303.4) 117.6 141.4 186.1 140.2 108.7 131.9 163.9 219.5 Reported EPS GAAP (inc. FAS 123R) 0.37 0.09 0.04 (0.22) 0.08 0.10 0.13 0.10 0.08 0.09 0.12 0.15 Adjusted Net Income 150.0 138.5 123.1 238.5 206.2 229.3 212.9 208.6 183.7 206.9 241.9 297.5 Pro Forma EPS 0.11 0.10 0.09 0.17 0.15 0.16 0.15 0.15 0.13 0.15 0.17 0.21 Diluted Shares 1,395 1,399 1,398 1,388 1,408 1,414 1,425 1,425 1,425 1,420 1,420 1,420 Source: Company reports and J.P. Morgan estimates.
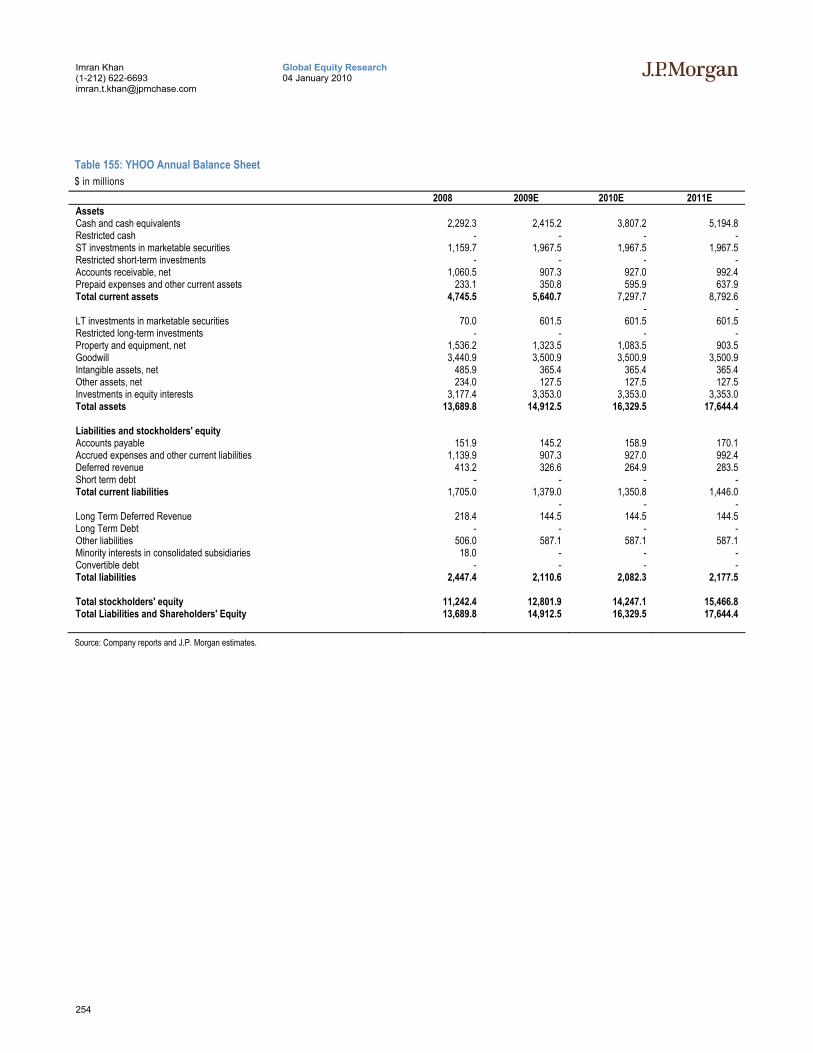
254
Global Equity Research 04 January 2010
Imran Khan (1-212) 622-6693 [email protected]
Table 155: YHOO Annual Balance Sheet $ in millions
2008 2009E 2010E 2011E Assets Cash and cash equivalents 2,292.3 2,415.2 3,807.2 5,194.8 Restricted cash - - - - ST investments in marketable securities 1,159.7 1,967.5 1,967.5 1,967.5 Restricted short-term investments - - - - Accounts receivable, net 1,060.5 907.3 927.0 992.4 Prepaid expenses and other current assets 233.1 350.8 595.9 637.9 Total current assets 4,745.5 5,640.7 7,297.7 8,792.6 - - LT investments in marketable securities 70.0 601.5 601.5 601.5 Restricted long-term investments - - - - Property and equipment, net 1,536.2 1,323.5 1,083.5 903.5 Goodwill 3,440.9 3,500.9 3,500.9 3,500.9 Intangible assets, net 485.9 365.4 365.4 365.4 Other assets, net 234.0 127.5 127.5 127.5 Investments in equity interests 3,177.4 3,353.0 3,353.0 3,353.0 Total assets 13,689.8 14,912.5 16,329.5 17,644.4 Liabilities and stockholders' equity Accounts payable 151.9 145.2 158.9 170.1 Accrued expenses and other current liabilities 1,139.9 907.3 927.0 992.4 Deferred revenue 413.2 326.6 264.9 283.5 Short term debt - - - - Total current liabilities 1,705.0 1,379.0 1,350.8 1,446.0 - - - Long Term Deferred Revenue 218.4 144.5 144.5 144.5 Long Term Debt - - - - Other liabilities 506.0 587.1 587.1 587.1 Minority interests in consolidated subsidiaries 18.0 - - - Convertible debt - - - - Total liabilities 2,447.4 2,110.6 2,082.3 2,177.5 Total stockholders' equity 11,242.4 12,801.9 14,247.1 15,466.8 Total Liabilities and Shareholders' Equity 13,689.8 14,912.5 16,329.5 17,644.4 Source: Company reports and J.P. Morgan estimates.
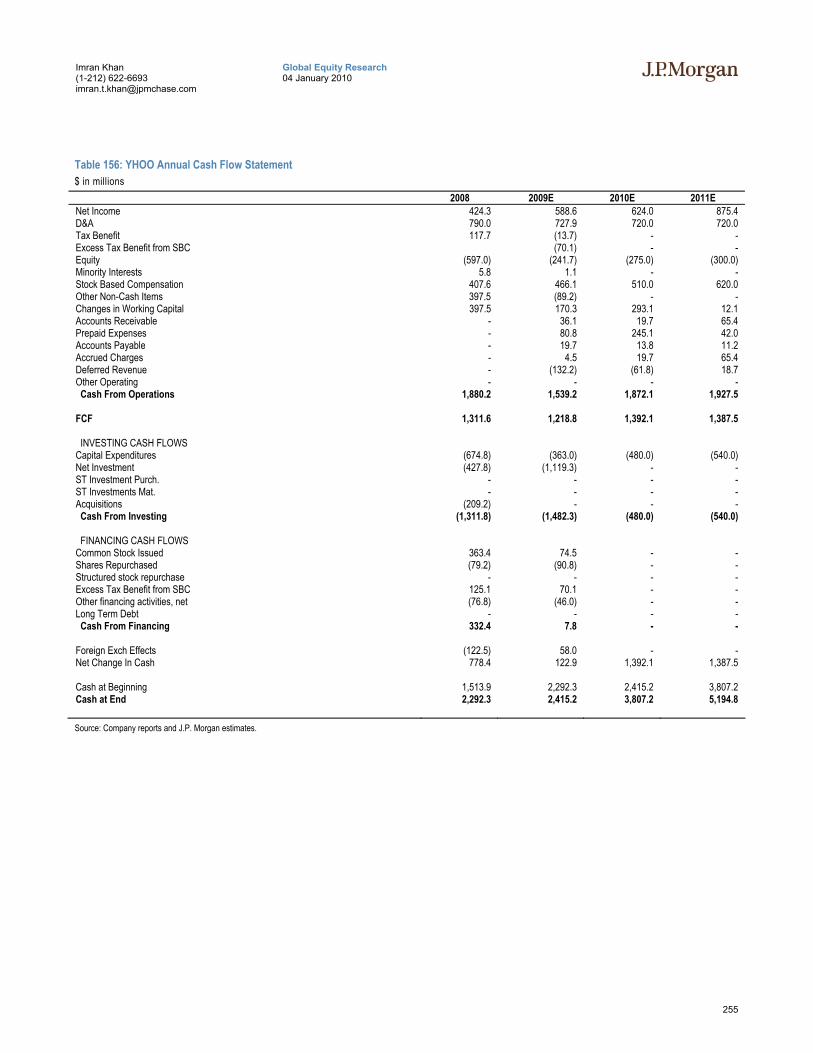
255
Global Equity Research 04 January 2010
Imran Khan (1-212) 622-6693 [email protected]
Table 156: YHOO Annual Cash Flow Statement $ in millions
2008 2009E 2010E 2011E Net Income 424.3 588.6 624.0 875.4 D&A 790.0 727.9 720.0 720.0 Tax Benefit 117.7 (13.7) - - Excess Tax Benefit from SBC (70.1) - - Equity (597.0) (241.7) (275.0) (300.0) Minority Interests 5.8 1.1 - - Stock Based Compensation 407.6 466.1 510.0 620.0 Other Non-Cash Items 397.5 (89.2) - - Changes in Working Capital 397.5 170.3 293.1 12.1 Accounts Receivable - 36.1 19.7 65.4 Prepaid Expenses - 80.8 245.1 42.0 Accounts Payable - 19.7 13.8 11.2 Accrued Charges - 4.5 19.7 65.4 Deferred Revenue - (132.2) (61.8) 18.7 Other Operating - - - - Cash From Operations 1,880.2 1,539.2 1,872.1 1,927.5 FCF 1,311.6 1,218.8 1,392.1 1,387.5 INVESTING CASH FLOWS Capital Expenditures (674.8) (363.0) (480.0) (540.0) Net Investment (427.8) (1,119.3) - - ST Investment Purch. - - - - ST Investments Mat. - - - - Acquisitions (209.2) - - - Cash From Investing (1,311.8) (1,482.3) (480.0) (540.0) FINANCING CASH FLOWS Common Stock Issued 363.4 74.5 - - Shares Repurchased (79.2) (90.8) - - Structured stock repurchase - - - - Excess Tax Benefit from SBC 125.1 70.1 - - Other financing activities, net (76.8) (46.0) - - Long Term Debt - - - - Cash From Financing 332.4 7.8 - - Foreign Exch Effects (122.5) 58.0 - - Net Change In Cash 778.4 122.9 1,392.1 1,387.5 Cash at Beginning 1,513.9 2,292.3 2,415.2 3,807.2 Cash at End 2,292.3 2,415.2 3,807.2 5,194.8 Source: Company reports and J.P. Morgan estimates.

257
Global Equity Research 04 January 2010
Imran Khan (1-212) 622-6693 [email protected]
International Company Outlooks
Inte
rnat
iona
l Com
pany
Out
look
s
259
Global Equity Research 04 January 2010
Imran Khan (1-212) 622-6693 [email protected]
Alibaba, Neutral, (HK$18.06) We maintain our Neutral rating on Alibaba, the leader in the eCommerce segment in China. Our Dec-10 price target is HK$22, which implies 80.2x FY09E, 51.7x FY10E, and 40.9x FY11E diluted adjusted EPS, on the back of 55%/26% earnings growth forecast for FY10/11.
• Alibaba is the leader in China’s eCommerce segment. Alibaba is already the leader in exports and in the domestic B2B marketplace, with 80% market share in the B2B space for 1H09. We believe its prepaid subscription business model ensures its strong cash position and good visibility on future revenue.
• We expect the company to continue adding Gold Supplier members due to (1) improving macro fundamentals, (2) the company’s focus on accelerating membership acquisition and improving customer satisfaction, (3) the GS Starter package price point attracting interest from a larger China exporter base to try Alibaba’s services, (4) a large-scale marketing campaign globally that drives ROI for customers, and (5) SMEs turning to the internet for more cost-effective marketing campaigns. The company had ~84,900 Gold Supplier members at the end of 3Q09, up from 28,500 members at the end of 1Q08.
• Alibaba signed up either strategic or channel partners in 13 countries to distribute its Gold Supplier International membership. These countries include India, Japan, Malaysia, Indonesia, Korea, Vietnam, and Turkey. For India, Alibaba’s total registered users have already exceeded 1MM. The company also started monetizing its Japan portal in 2Q09.
• Alibaba aspires to become a “one-stop shop” for all SME needs. The company took many initiatives in 2009 to cater to various requirements of SMEs such as skill training, financing needs, and software support for business management. The company acquired HiChina, a leading provider of internet infrastructure services, including domain name services, web and server hosting services, e-mail hosting services and web design and development services. The company also acquired the business management software division of Alisoft, comprising software application product lines for small businesses and related assets.
• In the third quarter of 2009, the company beta-launched AliExpress, the wholesale platform on the international marketplace that is designed to facilitate small bulk transactions online. The company also launched VAS like Ali Loan and Ali Institute to take care of financing needs and skill development for using eCommerce.
2010 drivers: In our view, potential positive share price drivers are: (1) cyclical market upturns leading to higher-than-expected subscriber net-adds; (2) upside in VAS (from currently free services or low-price services); and (3) operating margin expanding to 35% in FY10E from 29.3% in FY09, due to leverage on marketing expenses. Our current 2010 estimates are presented in the table below:

260
Global Equity Research 04 January 2010
Imran Khan (1-212) 622-6693 [email protected]
Table 157: Alibaba: Financial Snapshot $ in millions, except per share data; year-end December 4Q09E FY09E FY10E FY11E FY09E Y/Y FY10E Y/Y FY11E Y/Y J.P. Morgan Revenue 157.7 563.0 788.7 974.9 29% 40% 24% EBITDA 53.1 192.1 309.3 395.9 5% 61% 28% GAAP EPS 0.01 0.03 0.05 0.06 -12% 67% 28% Adj. EPS 0.01 0.04 0.05 0.07 -11% 55% 26% Consensus Revenue 153.5 549.3 767.4 1043.0 26% 40% 36% EBITDA 37.1 172.0 270.7 389.5 -6% 57% 44% GAAP EPS 0.01 0.03 0.05 0.07 -13% 53% 50% Adj. EPS 0.01 0.03 0.05 0.07 -24% 53% 46%
Source: Bloomberg, J.P. Morgan. *Note: Adj. EPS excludes share-based compensation expense.
261
Global Equity Research 04 January 2010
Imran Khan (1-212) 622-6693 [email protected]
Our Estimates and Outlook for 2010 We forecast net revenue of US$788.7MM in 2010, up 40% Y/Y, and GAAP-diluted EPS of US$0.05, up 67% Y/Y, or adjusted EPS (ex-share-based expenses) of US$0.05, up 55% Y/Y. We forecast 2010 International marketplace revenue of US$472.7MM (60% of total revenue), up 36% Y/Y, and China marketplace revenue of US$277MM (35% of total revenue), up 34% Y/Y.
We forecast a gross margin of 85.6% for 2010, slightly down from 86.0% for 2009. We expect an adjusted operating margin (ex-share-based expense) of 35.7% for 2010, up from 30.3% for 2009, and an adjusted net margin of 36.0% for 2010, up from 31.9% for 2009.
Our Estimates and Outlook for 2011 For 2011, we forecast net revenue of US$974.9MM, up 24% Y/Y, and GAAP diluted EPS of US$0.06, up 28% Y/Y, or adjusted EPS of US$0.07, up 26% Y/Y. We forecast 2011 International marketplace revenue of US$339.1MM, up 23% Y/Y, and China marketplace revenue of US$339.1MM, up 23% Y/Y. On margins, we forecast a gross margin of 86.6% (up Y/Y), an adjusted operating margin of 36.9% (up Y/Y), and an adjusted net margin of 37.4% (up slightly Y/Y).
Price Target, Valuation and Rating Analysis Our Dec-10 price target of HK$22 is based on our DCF valuation of HK$22 (WACC = 12%, with terminal growth of 0%).
With business fundamentals improving and a cyclical market upturn, we believe earnings downside is limited. We do not rate the stock OW, mainly due to a risk-reward ratio that we believe is not attractive, given the high valuation and high volatility of the stock. We maintain our view that investors with a long investment horizon who look beyond near-term volatility and investors who want to add beta to their portfolio should accumulate the stock.
Our price target of HK$22 implies 93.7x FY09E, 56.0x FY10E and 43.7x FY11E diluted GAAP EPS, or 80.2x FY09E, 51.7x FY10E, and 40.9x FY11E diluted adjusted EPS. This implies 2.0x PEG (based on 2010E P/E and 2011E EPS growth) or 1.9x PEG (based on 2010E P/E and a 2010-2012E CAGR of 29%). We note that on a forward P/E basis, Alibaba has always traded at high multiples since its IPO. The company has not traded below a forward P/E of 20x, even during market lows.
We believe FCF generation is a good indication of the company’s current year profitability. At our PT, Alibaba’s 2011E P/FCF ratio of 28x is in line with that of other China internet leaders.
We believe a higher multiple for Alibaba can be justified, given: (1) Alibaba’s leadership in the China B2B market (80% market share); (2) strong cash position for strategic acquisitions to gain market share; and (3) potential upside in earnings from new initiatives and currently free VAS.

262
Global Equity Research 04 January 2010
Imran Khan (1-212) 622-6693 [email protected]
Risks to Our Rating and Price Target Downside risks include (1) a slowdown in Gold Supplier and China Trustpass customer growth, (2) VAS not gaining good traction as expected in both marketplaces, and (3) global macro fundamentals turning negative.
Upside risks include (1) better-than-expected Gold Supplier and China Trustpass customer growth, due to the company’s strong execution or strong export market growth, (2) better-than-expected VAS contribution, (3) share buybacks, and (4) further cash dividends.
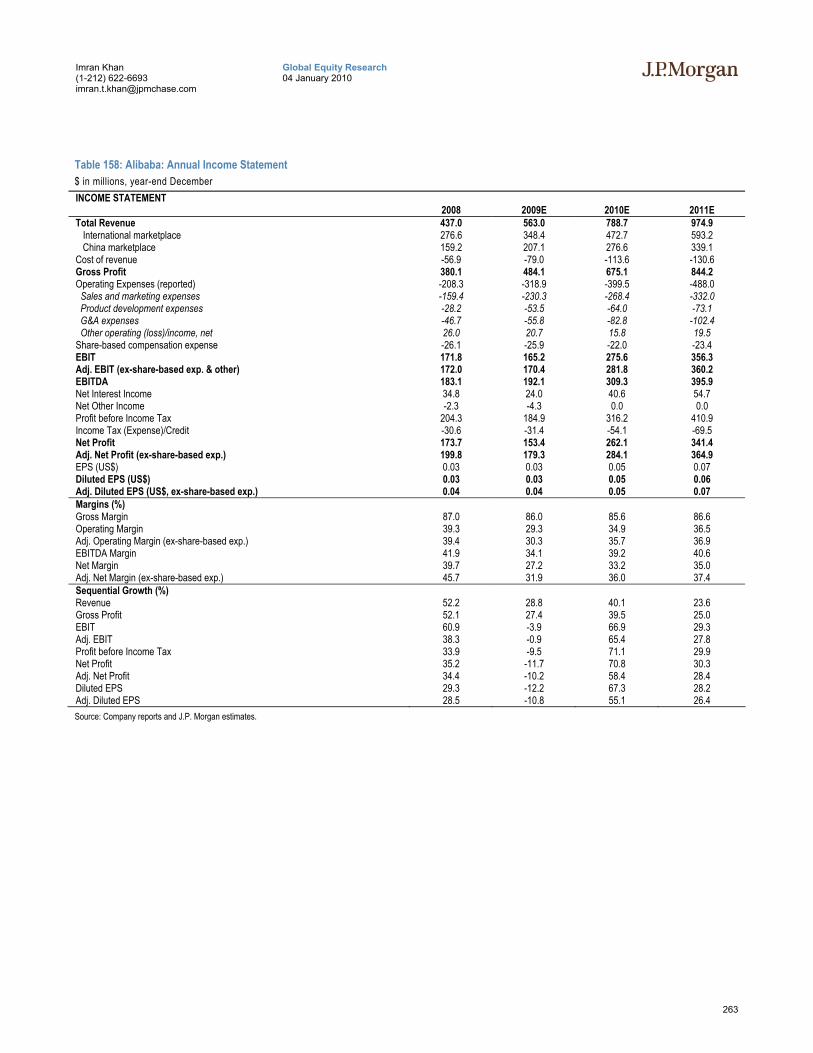
263
Global Equity Research 04 January 2010
Imran Khan (1-212) 622-6693 [email protected]
Table 158: Alibaba: Annual Income Statement $ in millions, year-end December INCOME STATEMENT
2008 2009E 2010E 2011E Total Revenue 437.0 563.0 788.7 974.9 International marketplace 276.6 348.4 472.7 593.2 China marketplace 159.2 207.1 276.6 339.1 Cost of revenue -56.9 -79.0 -113.6 -130.6 Gross Profit 380.1 484.1 675.1 844.2 Operating Expenses (reported) -208.3 -318.9 -399.5 -488.0 Sales and marketing expenses -159.4 -230.3 -268.4 -332.0 Product development expenses -28.2 -53.5 -64.0 -73.1 G&A expenses -46.7 -55.8 -82.8 -102.4 Other operating (loss)/income, net 26.0 20.7 15.8 19.5 Share-based compensation expense -26.1 -25.9 -22.0 -23.4 EBIT 171.8 165.2 275.6 356.3 Adj. EBIT (ex-share-based exp. & other) 172.0 170.4 281.8 360.2 EBITDA 183.1 192.1 309.3 395.9 Net Interest Income 34.8 24.0 40.6 54.7 Net Other Income -2.3 -4.3 0.0 0.0 Profit before Income Tax 204.3 184.9 316.2 410.9 Income Tax (Expense)/Credit -30.6 -31.4 -54.1 -69.5 Net Profit 173.7 153.4 262.1 341.4 Adj. Net Profit (ex-share-based exp.) 199.8 179.3 284.1 364.9 EPS (US$) 0.03 0.03 0.05 0.07 Diluted EPS (US$) 0.03 0.03 0.05 0.06 Adj. Diluted EPS (US$, ex-share-based exp.) 0.04 0.04 0.05 0.07 Margins (%) Gross Margin 87.0 86.0 85.6 86.6 Operating Margin 39.3 29.3 34.9 36.5 Adj. Operating Margin (ex-share-based exp.) 39.4 30.3 35.7 36.9 EBITDA Margin 41.9 34.1 39.2 40.6 Net Margin 39.7 27.2 33.2 35.0 Adj. Net Margin (ex-share-based exp.) 45.7 31.9 36.0 37.4 Sequential Growth (%) Revenue 52.2 28.8 40.1 23.6 Gross Profit 52.1 27.4 39.5 25.0 EBIT 60.9 -3.9 66.9 29.3 Adj. EBIT 38.3 -0.9 65.4 27.8 Profit before Income Tax 33.9 -9.5 71.1 29.9 Net Profit 35.2 -11.7 70.8 30.3 Adj. Net Profit 34.4 -10.2 58.4 28.4 Diluted EPS 29.3 -12.2 67.3 28.2 Adj. Diluted EPS 28.5 -10.8 55.1 26.4 Source: Company reports and J.P. Morgan estimates.
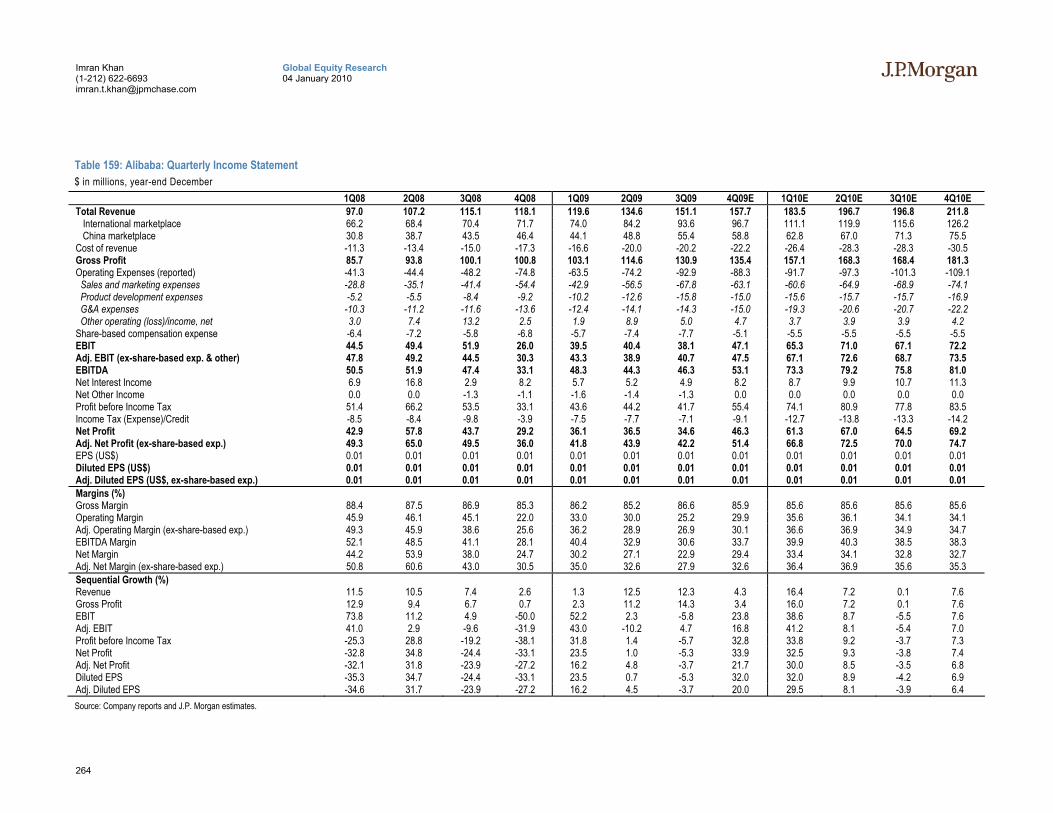
264
Global Equity Research 04 January 2010
Imran Khan (1-212) 622-6693 [email protected]
Table 159: Alibaba: Quarterly Income Statement $ in millions, year-end December
1Q08 2Q08 3Q08 4Q08 1Q09 2Q09 3Q09 4Q09E 1Q10E 2Q10E 3Q10E 4Q10E Total Revenue 97.0 107.2 115.1 118.1 119.6 134.6 151.1 157.7 183.5 196.7 196.8 211.8 International marketplace 66.2 68.4 70.4 71.7 74.0 84.2 93.6 96.7 111.1 119.9 115.6 126.2 China marketplace 30.8 38.7 43.5 46.4 44.1 48.8 55.4 58.8 62.8 67.0 71.3 75.5 Cost of revenue -11.3 -13.4 -15.0 -17.3 -16.6 -20.0 -20.2 -22.2 -26.4 -28.3 -28.3 -30.5 Gross Profit 85.7 93.8 100.1 100.8 103.1 114.6 130.9 135.4 157.1 168.3 168.4 181.3 Operating Expenses (reported) -41.3 -44.4 -48.2 -74.8 -63.5 -74.2 -92.9 -88.3 -91.7 -97.3 -101.3 -109.1 Sales and marketing expenses -28.8 -35.1 -41.4 -54.4 -42.9 -56.5 -67.8 -63.1 -60.6 -64.9 -68.9 -74.1 Product development expenses -5.2 -5.5 -8.4 -9.2 -10.2 -12.6 -15.8 -15.0 -15.6 -15.7 -15.7 -16.9 G&A expenses -10.3 -11.2 -11.6 -13.6 -12.4 -14.1 -14.3 -15.0 -19.3 -20.6 -20.7 -22.2 Other operating (loss)/income, net 3.0 7.4 13.2 2.5 1.9 8.9 5.0 4.7 3.7 3.9 3.9 4.2 Share-based compensation expense -6.4 -7.2 -5.8 -6.8 -5.7 -7.4 -7.7 -5.1 -5.5 -5.5 -5.5 -5.5 EBIT 44.5 49.4 51.9 26.0 39.5 40.4 38.1 47.1 65.3 71.0 67.1 72.2 Adj. EBIT (ex-share-based exp. & other) 47.8 49.2 44.5 30.3 43.3 38.9 40.7 47.5 67.1 72.6 68.7 73.5 EBITDA 50.5 51.9 47.4 33.1 48.3 44.3 46.3 53.1 73.3 79.2 75.8 81.0 Net Interest Income 6.9 16.8 2.9 8.2 5.7 5.2 4.9 8.2 8.7 9.9 10.7 11.3 Net Other Income 0.0 0.0 -1.3 -1.1 -1.6 -1.4 -1.3 0.0 0.0 0.0 0.0 0.0 Profit before Income Tax 51.4 66.2 53.5 33.1 43.6 44.2 41.7 55.4 74.1 80.9 77.8 83.5 Income Tax (Expense)/Credit -8.5 -8.4 -9.8 -3.9 -7.5 -7.7 -7.1 -9.1 -12.7 -13.8 -13.3 -14.2 Net Profit 42.9 57.8 43.7 29.2 36.1 36.5 34.6 46.3 61.3 67.0 64.5 69.2 Adj. Net Profit (ex-share-based exp.) 49.3 65.0 49.5 36.0 41.8 43.9 42.2 51.4 66.8 72.5 70.0 74.7 EPS (US$) 0.01 0.01 0.01 0.01 0.01 0.01 0.01 0.01 0.01 0.01 0.01 0.01 Diluted EPS (US$) 0.01 0.01 0.01 0.01 0.01 0.01 0.01 0.01 0.01 0.01 0.01 0.01 Adj. Diluted EPS (US$, ex-share-based exp.) 0.01 0.01 0.01 0.01 0.01 0.01 0.01 0.01 0.01 0.01 0.01 0.01 Margins (%) Gross Margin 88.4 87.5 86.9 85.3 86.2 85.2 86.6 85.9 85.6 85.6 85.6 85.6 Operating Margin 45.9 46.1 45.1 22.0 33.0 30.0 25.2 29.9 35.6 36.1 34.1 34.1 Adj. Operating Margin (ex-share-based exp.) 49.3 45.9 38.6 25.6 36.2 28.9 26.9 30.1 36.6 36.9 34.9 34.7 EBITDA Margin 52.1 48.5 41.1 28.1 40.4 32.9 30.6 33.7 39.9 40.3 38.5 38.3 Net Margin 44.2 53.9 38.0 24.7 30.2 27.1 22.9 29.4 33.4 34.1 32.8 32.7 Adj. Net Margin (ex-share-based exp.) 50.8 60.6 43.0 30.5 35.0 32.6 27.9 32.6 36.4 36.9 35.6 35.3 Sequential Growth (%) Revenue 11.5 10.5 7.4 2.6 1.3 12.5 12.3 4.3 16.4 7.2 0.1 7.6 Gross Profit 12.9 9.4 6.7 0.7 2.3 11.2 14.3 3.4 16.0 7.2 0.1 7.6 EBIT 73.8 11.2 4.9 -50.0 52.2 2.3 -5.8 23.8 38.6 8.7 -5.5 7.6 Adj. EBIT 41.0 2.9 -9.6 -31.9 43.0 -10.2 4.7 16.8 41.2 8.1 -5.4 7.0 Profit before Income Tax -25.3 28.8 -19.2 -38.1 31.8 1.4 -5.7 32.8 33.8 9.2 -3.7 7.3 Net Profit -32.8 34.8 -24.4 -33.1 23.5 1.0 -5.3 33.9 32.5 9.3 -3.8 7.4 Adj. Net Profit -32.1 31.8 -23.9 -27.2 16.2 4.8 -3.7 21.7 30.0 8.5 -3.5 6.8 Diluted EPS -35.3 34.7 -24.4 -33.1 23.5 0.7 -5.3 32.0 32.0 8.9 -4.2 6.9 Adj. Diluted EPS -34.6 31.7 -23.9 -27.2 16.2 4.5 -3.7 20.0 29.5 8.1 -3.9 6.4 Source: Company reports and J.P. Morgan estimates.
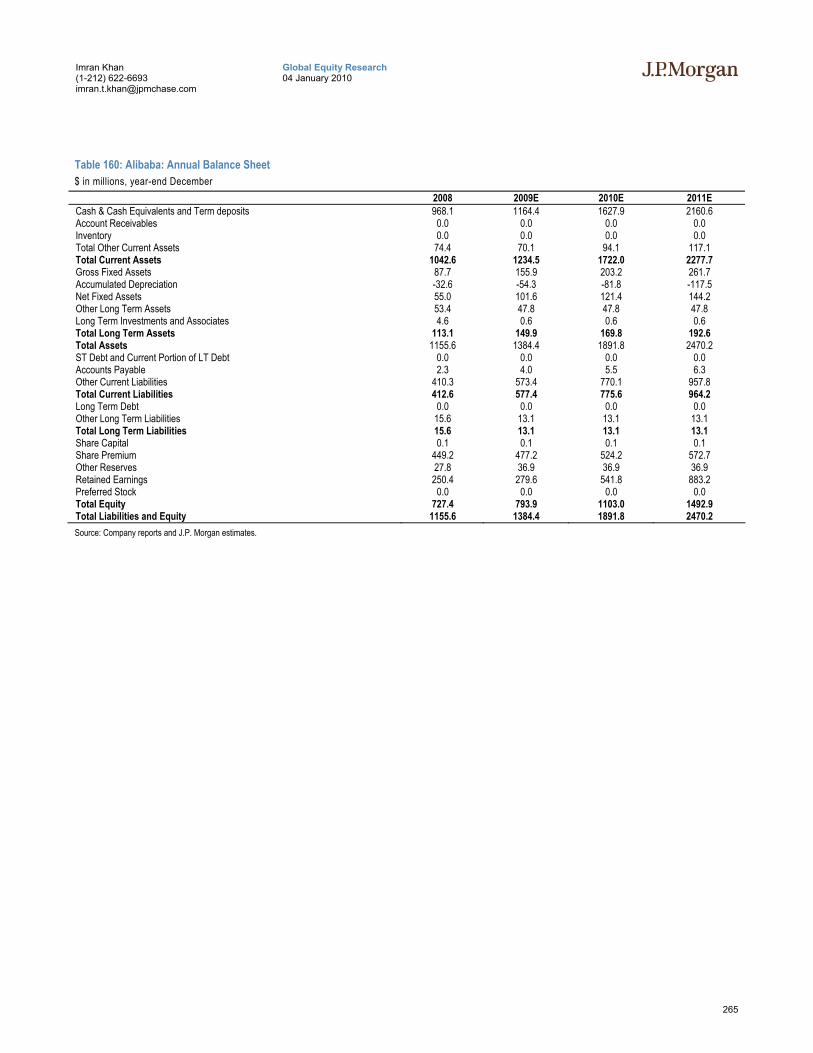
265
Global Equity Research 04 January 2010
Imran Khan (1-212) 622-6693 [email protected]
Table 160: Alibaba: Annual Balance Sheet $ in millions, year-end December
2008 2009E 2010E 2011E Cash & Cash Equivalents and Term deposits 968.1 1164.4 1627.9 2160.6 Account Receivables 0.0 0.0 0.0 0.0 Inventory 0.0 0.0 0.0 0.0 Total Other Current Assets 74.4 70.1 94.1 117.1 Total Current Assets 1042.6 1234.5 1722.0 2277.7 Gross Fixed Assets 87.7 155.9 203.2 261.7 Accumulated Depreciation -32.6 -54.3 -81.8 -117.5 Net Fixed Assets 55.0 101.6 121.4 144.2 Other Long Term Assets 53.4 47.8 47.8 47.8 Long Term Investments and Associates 4.6 0.6 0.6 0.6 Total Long Term Assets 113.1 149.9 169.8 192.6 Total Assets 1155.6 1384.4 1891.8 2470.2 ST Debt and Current Portion of LT Debt 0.0 0.0 0.0 0.0 Accounts Payable 2.3 4.0 5.5 6.3 Other Current Liabilities 410.3 573.4 770.1 957.8 Total Current Liabilities 412.6 577.4 775.6 964.2 Long Term Debt 0.0 0.0 0.0 0.0 Other Long Term Liabilities 15.6 13.1 13.1 13.1 Total Long Term Liabilities 15.6 13.1 13.1 13.1 Share Capital 0.1 0.1 0.1 0.1 Share Premium 449.2 477.2 524.2 572.7 Other Reserves 27.8 36.9 36.9 36.9 Retained Earnings 250.4 279.6 541.8 883.2 Preferred Stock 0.0 0.0 0.0 0.0 Total Equity 727.4 793.9 1103.0 1492.9 Total Liabilities and Equity 1155.6 1384.4 1891.8 2470.2 Source: Company reports and J.P. Morgan estimates.
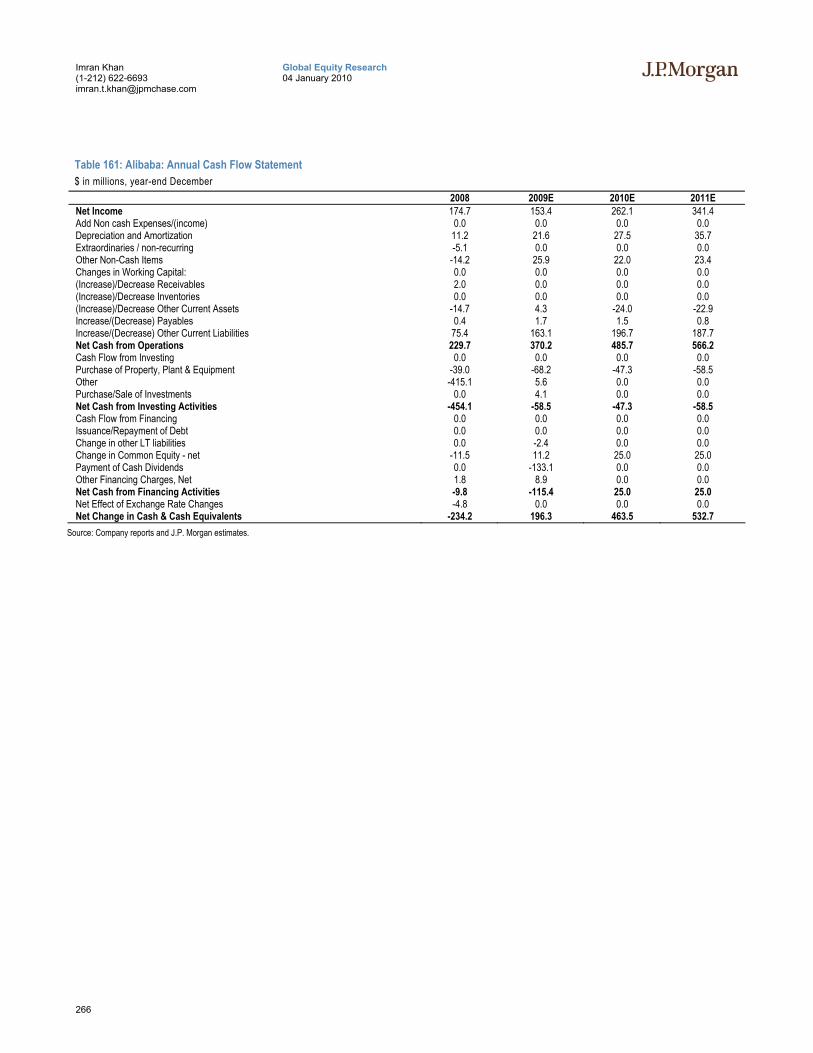
266
Global Equity Research 04 January 2010
Imran Khan (1-212) 622-6693 [email protected]
Table 161: Alibaba: Annual Cash Flow Statement $ in millions, year-end December
2008 2009E 2010E 2011E Net Income 174.7 153.4 262.1 341.4 Add Non cash Expenses/(income) 0.0 0.0 0.0 0.0 Depreciation and Amortization 11.2 21.6 27.5 35.7 Extraordinaries / non-recurring -5.1 0.0 0.0 0.0 Other Non-Cash Items -14.2 25.9 22.0 23.4 Changes in Working Capital: 0.0 0.0 0.0 0.0 (Increase)/Decrease Receivables 2.0 0.0 0.0 0.0 (Increase)/Decrease Inventories 0.0 0.0 0.0 0.0 (Increase)/Decrease Other Current Assets -14.7 4.3 -24.0 -22.9 Increase/(Decrease) Payables 0.4 1.7 1.5 0.8 Increase/(Decrease) Other Current Liabilities 75.4 163.1 196.7 187.7 Net Cash from Operations 229.7 370.2 485.7 566.2 Cash Flow from Investing 0.0 0.0 0.0 0.0 Purchase of Property, Plant & Equipment -39.0 -68.2 -47.3 -58.5 Other -415.1 5.6 0.0 0.0 Purchase/Sale of Investments 0.0 4.1 0.0 0.0 Net Cash from Investing Activities -454.1 -58.5 -47.3 -58.5 Cash Flow from Financing 0.0 0.0 0.0 0.0 Issuance/Repayment of Debt 0.0 0.0 0.0 0.0 Change in other LT liabilities 0.0 -2.4 0.0 0.0 Change in Common Equity - net -11.5 11.2 25.0 25.0 Payment of Cash Dividends 0.0 -133.1 0.0 0.0 Other Financing Charges, Net 1.8 8.9 0.0 0.0 Net Cash from Financing Activities -9.8 -115.4 25.0 25.0 Net Effect of Exchange Rate Changes -4.8 0.0 0.0 0.0 Net Change in Cash & Cash Equivalents -234.2 196.3 463.5 532.7
Source: Company reports and J.P. Morgan estimates.
267
Global Equity Research 04 January 2010
Imran Khan (1-212) 622-6693 [email protected]
Baidu, Overweight, ($416.23) We maintain our Overweight rating on Baidu, the dominant market leader in China’s online search market. Our Dec-10 price target is US$460, which implies 75.0x FY09E, 50.3x FY10E, and 35.0x FY11E diluted GAAP EPS, or 70.6x FY09E, 48.1x FY10E, and 33.9x FY11E adjusted diluted EPS, which we believe is reasonable given the strong China internet usage growth and early stage of search advertising.
We believe online search advertising is still in an early high-growth stage in China, driven by: (1) rising internet penetration, (2) significant growth in websites and pages, (3) higher search usage (due to greater mass of web content), and (4) a large number of SMEs (with small ad budgets) turning to search advertising (due to the higher ROI). We expect the paid search market in China to grow by more than 40% Y/Y and 43% Y/Y in 2009 and 2010 respectively (following ~36% growth for 2009, based on our estimates).
• Baidu is the market leader in China’s search market, with ~64% market share as of 3Q09 (according to Analysys estimates), and also has the highest internet traffic in China (based on Alexa estimates). We expect Baidu to maintain its leadership in China due to: (1) our view that its products are better tailored to local needs (e.g., music search and Baidu Knows - community Q&A site), (2) its strong local brand name, (3) its good relationship with the Chinese government, (4) its good Chinese search technology, and (5) the fact that it has one of the widest distribution networks in China (a key to market development and driving sales), and is well ahead of competitors in search.
• Overall, we expect Baidu to see slight growth in TAC in the longer term, driven by (1) Baidu’s recent changes in TAC structure for exclusive Union members that will likely increase Union traffic, (2) expansion in contextual search program (similar to Google’s AdSense for content), and (3) company plans to continue to expand its Union member program to drive top- and bottom-line growth. We urge investors not to focus too much on the gradually increasing TAC, as higher Union traffic also converts into larger earnings for Baidu.
• 2010 drivers: In our view, the following factors will drive the share price in 2010: (1) increased monetization from Phoenix Nest algorithm; (2) increasing eCommerce marketing needs in China; (3) improving macro environment with easier credits for SME; and (4) continued solid growth in China’s Internet usage and SME search adoption.
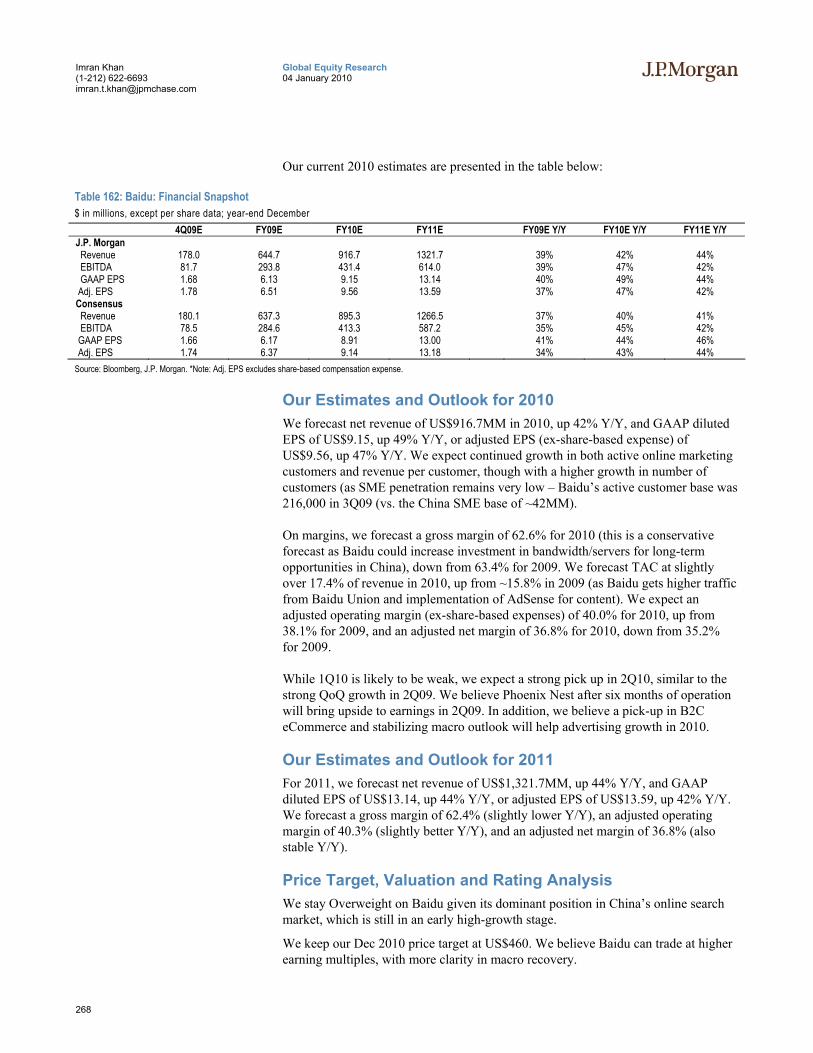
268
Global Equity Research 04 January 2010
Imran Khan (1-212) 622-6693 [email protected]
Our current 2010 estimates are presented in the table below:
Table 162: Baidu: Financial Snapshot $ in millions, except per share data; year-end December 4Q09E FY09E FY10E FY11E FY09E Y/Y FY10E Y/Y FY11E Y/Y J.P. Morgan Revenue 178.0 644.7 916.7 1321.7 39% 42% 44% EBITDA 81.7 293.8 431.4 614.0 39% 47% 42% GAAP EPS 1.68 6.13 9.15 13.14 40% 49% 44% Adj. EPS 1.78 6.51 9.56 13.59 37% 47% 42% Consensus Revenue 180.1 637.3 895.3 1266.5 37% 40% 41% EBITDA 78.5 284.6 413.3 587.2 35% 45% 42% GAAP EPS 1.66 6.17 8.91 13.00 41% 44% 46% Adj. EPS 1.74 6.37 9.14 13.18 34% 43% 44% Source: Bloomberg, J.P. Morgan. *Note: Adj. EPS excludes share-based compensation expense.
Our Estimates and Outlook for 2010 We forecast net revenue of US$916.7MM in 2010, up 42% Y/Y, and GAAP diluted EPS of US$9.15, up 49% Y/Y, or adjusted EPS (ex-share-based expense) of US$9.56, up 47% Y/Y. We expect continued growth in both active online marketing customers and revenue per customer, though with a higher growth in number of customers (as SME penetration remains very low – Baidu’s active customer base was 216,000 in 3Q09 (vs. the China SME base of ~42MM).
On margins, we forecast a gross margin of 62.6% for 2010 (this is a conservative forecast as Baidu could increase investment in bandwidth/servers for long-term opportunities in China), down from 63.4% for 2009. We forecast TAC at slightly over 17.4% of revenue in 2010, up from ~15.8% in 2009 (as Baidu gets higher traffic from Baidu Union and implementation of AdSense for content). We expect an adjusted operating margin (ex-share-based expenses) of 40.0% for 2010, up from 38.1% for 2009, and an adjusted net margin of 36.8% for 2010, down from 35.2% for 2009.
While 1Q10 is likely to be weak, we expect a strong pick up in 2Q10, similar to the strong QoQ growth in 2Q09. We believe Phoenix Nest after six months of operation will bring upside to earnings in 2Q09. In addition, we believe a pick-up in B2C eCommerce and stabilizing macro outlook will help advertising growth in 2010.
Our Estimates and Outlook for 2011 For 2011, we forecast net revenue of US$1,321.7MM, up 44% Y/Y, and GAAP diluted EPS of US$13.14, up 44% Y/Y, or adjusted EPS of US$13.59, up 42% Y/Y. We forecast a gross margin of 62.4% (slightly lower Y/Y), an adjusted operating margin of 40.3% (slightly better Y/Y), and an adjusted net margin of 36.8% (also stable Y/Y).
Price Target, Valuation and Rating Analysis We stay Overweight on Baidu given its dominant position in China’s online search market, which is still in an early high-growth stage.
We keep our Dec 2010 price target at US$460. We believe Baidu can trade at higher earning multiples, with more clarity in macro recovery.
269
Global Equity Research 04 January 2010
Imran Khan (1-212) 622-6693 [email protected]
Our PT is based on our DCF valuation (20% long-term growth in 2014E-2018E, 15% growth in 2019E-2025E). Our nominal case DCF valuation suggests a valuation of US$459.8. We use a WACC of 12% and 0% terminal growth.
Our price target implies 75.0x FY09E, 50.3x FY10E, and 35.0x FY11E diluted GAAP EPS, or 70.6x FY09E, 48.1x FY10E, and 33.9x FY11E adjusted diluted EPS, which we believe is reasonable given the strong China internet usage growth and early stage of search advertising.
We believe that earnings upside in FY09 and FY10 could come from the new Phoenix Nest algorithm, banner advertising, and potential margin leverage. In addition, the improving macro outlook should help Baidu’s earnings growth.
Risks to Our Rating Downside risks to our rating and price target include:
• Slower-than-expected online search spending: This is due to economic slowdown, government policy changes, risks in Phoenix Nest transition, fraudulent clicks causing a general decline in ROI, and availability of an alternative more effective advertising form.
• Potential margin decline: While we expect Baidu to see leverage from its business, we believe there are risks in TAC, bandwidth costs increases, tax rate increases, and significant labor costs increases. In particular, with the company more aggressively launching an “AdSense for content” type of program, there could be upward pressure in TAC.
• Large infrastructure-related expense: During the early phase of search advertising growth, Baidu could invest in servers and bandwidths more significantly than we forecast. While this is positive in the long term, the share price could be affected in the near term due to lower earnings.
• Unsuccessful Japan initiatives: Baidu began investments in Japan in 2007 with US$15 million in expenses (we forecast another US$25-30 million for 2009). If the company spends significantly more in Japan, or if the traction among Japanese users proves to be weak after the launch, Baidu’s share price will likely react negatively.
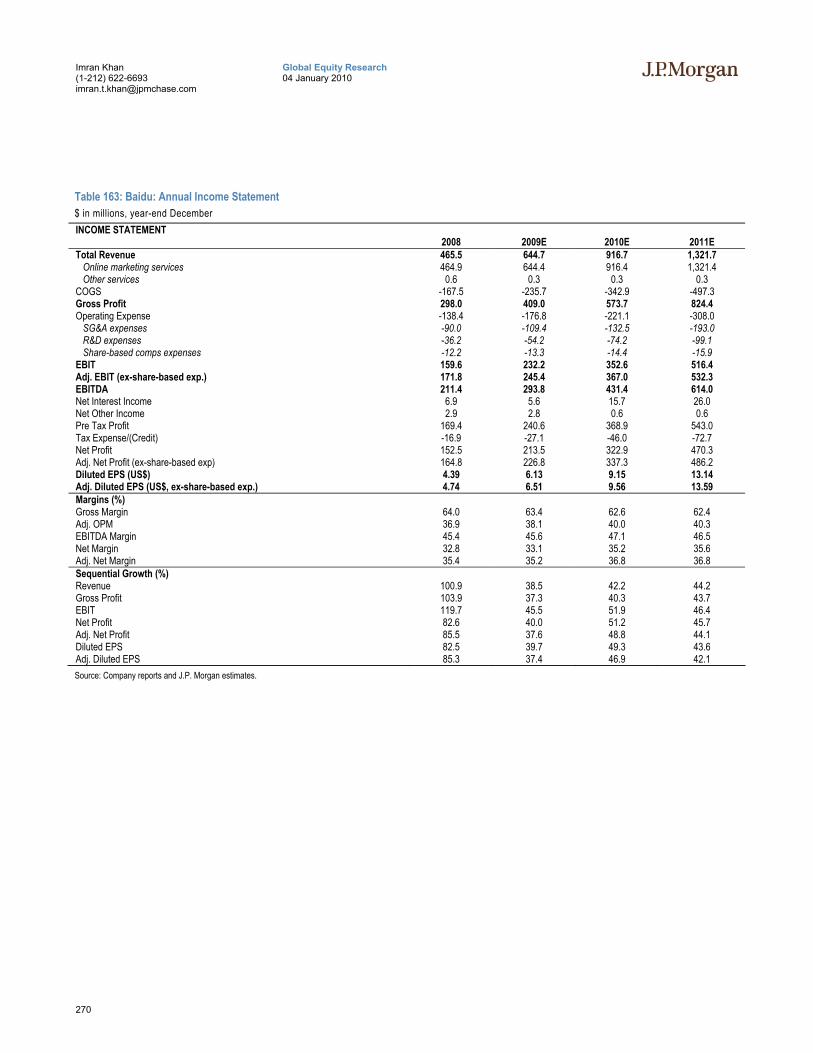
270
Global Equity Research 04 January 2010
Imran Khan (1-212) 622-6693 [email protected]
Table 163: Baidu: Annual Income Statement $ in millions, year-end December INCOME STATEMENT
2008 2009E 2010E 2011E Total Revenue 465.5 644.7 916.7 1,321.7 Online marketing services 464.9 644.4 916.4 1,321.4 Other services 0.6 0.3 0.3 0.3 COGS -167.5 -235.7 -342.9 -497.3 Gross Profit 298.0 409.0 573.7 824.4 Operating Expense -138.4 -176.8 -221.1 -308.0 SG&A expenses -90.0 -109.4 -132.5 -193.0 R&D expenses -36.2 -54.2 -74.2 -99.1 Share-based comps expenses -12.2 -13.3 -14.4 -15.9 EBIT 159.6 232.2 352.6 516.4 Adj. EBIT (ex-share-based exp.) 171.8 245.4 367.0 532.3 EBITDA 211.4 293.8 431.4 614.0 Net Interest Income 6.9 5.6 15.7 26.0 Net Other Income 2.9 2.8 0.6 0.6 Pre Tax Profit 169.4 240.6 368.9 543.0 Tax Expense/(Credit) -16.9 -27.1 -46.0 -72.7 Net Profit 152.5 213.5 322.9 470.3 Adj. Net Profit (ex-share-based exp) 164.8 226.8 337.3 486.2 Diluted EPS (US$) 4.39 6.13 9.15 13.14 Adj. Diluted EPS (US$, ex-share-based exp.) 4.74 6.51 9.56 13.59 Margins (%) Gross Margin 64.0 63.4 62.6 62.4 Adj. OPM 36.9 38.1 40.0 40.3 EBITDA Margin 45.4 45.6 47.1 46.5 Net Margin 32.8 33.1 35.2 35.6 Adj. Net Margin 35.4 35.2 36.8 36.8 Sequential Growth (%) Revenue 100.9 38.5 42.2 44.2 Gross Profit 103.9 37.3 40.3 43.7 EBIT 119.7 45.5 51.9 46.4 Net Profit 82.6 40.0 51.2 45.7 Adj. Net Profit 85.5 37.6 48.8 44.1 Diluted EPS 82.5 39.7 49.3 43.6 Adj. Diluted EPS 85.3 37.4 46.9 42.1 Source: Company reports and J.P. Morgan estimates.
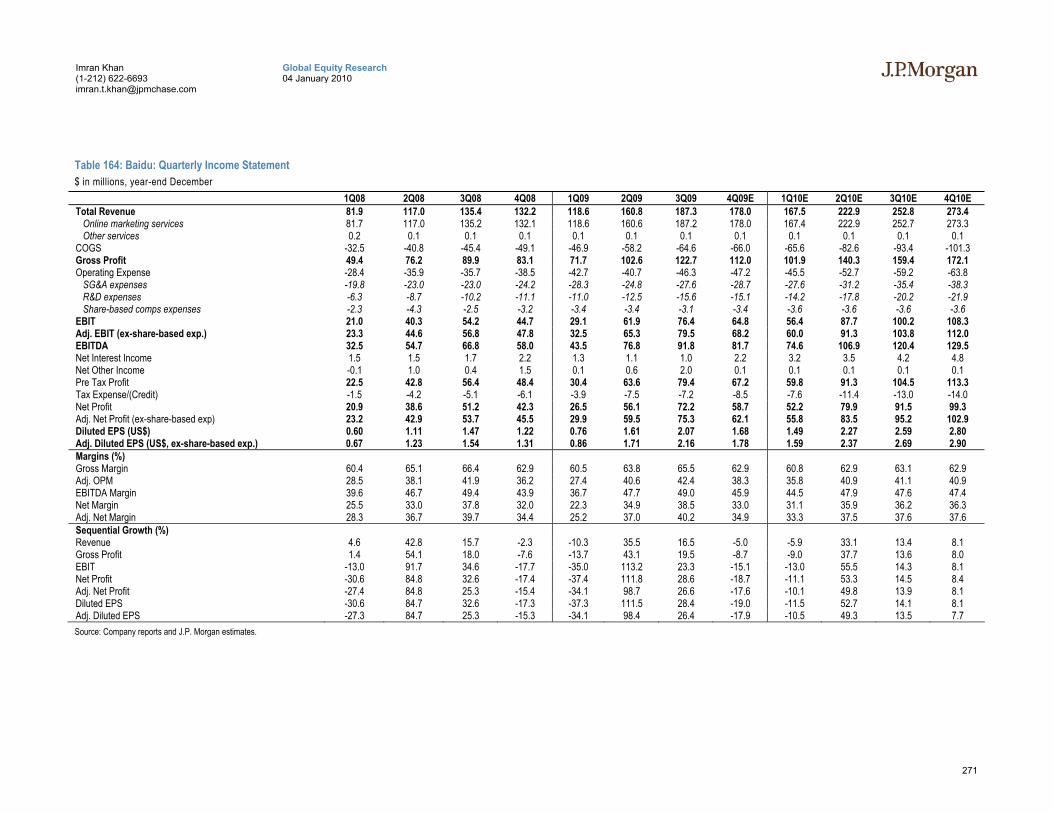
271
Global Equity Research 04 January 2010
Imran Khan (1-212) 622-6693 [email protected]
Table 164: Baidu: Quarterly Income Statement $ in millions, year-end December
1Q08 2Q08 3Q08 4Q08 1Q09 2Q09 3Q09 4Q09E 1Q10E 2Q10E 3Q10E 4Q10E Total Revenue 81.9 117.0 135.4 132.2 118.6 160.8 187.3 178.0 167.5 222.9 252.8 273.4 Online marketing services 81.7 117.0 135.2 132.1 118.6 160.6 187.2 178.0 167.4 222.9 252.7 273.3 Other services 0.2 0.1 0.1 0.1 0.1 0.1 0.1 0.1 0.1 0.1 0.1 0.1 COGS -32.5 -40.8 -45.4 -49.1 -46.9 -58.2 -64.6 -66.0 -65.6 -82.6 -93.4 -101.3 Gross Profit 49.4 76.2 89.9 83.1 71.7 102.6 122.7 112.0 101.9 140.3 159.4 172.1 Operating Expense -28.4 -35.9 -35.7 -38.5 -42.7 -40.7 -46.3 -47.2 -45.5 -52.7 -59.2 -63.8 SG&A expenses -19.8 -23.0 -23.0 -24.2 -28.3 -24.8 -27.6 -28.7 -27.6 -31.2 -35.4 -38.3 R&D expenses -6.3 -8.7 -10.2 -11.1 -11.0 -12.5 -15.6 -15.1 -14.2 -17.8 -20.2 -21.9 Share-based comps expenses -2.3 -4.3 -2.5 -3.2 -3.4 -3.4 -3.1 -3.4 -3.6 -3.6 -3.6 -3.6 EBIT 21.0 40.3 54.2 44.7 29.1 61.9 76.4 64.8 56.4 87.7 100.2 108.3 Adj. EBIT (ex-share-based exp.) 23.3 44.6 56.8 47.8 32.5 65.3 79.5 68.2 60.0 91.3 103.8 112.0 EBITDA 32.5 54.7 66.8 58.0 43.5 76.8 91.8 81.7 74.6 106.9 120.4 129.5 Net Interest Income 1.5 1.5 1.7 2.2 1.3 1.1 1.0 2.2 3.2 3.5 4.2 4.8 Net Other Income -0.1 1.0 0.4 1.5 0.1 0.6 2.0 0.1 0.1 0.1 0.1 0.1 Pre Tax Profit 22.5 42.8 56.4 48.4 30.4 63.6 79.4 67.2 59.8 91.3 104.5 113.3 Tax Expense/(Credit) -1.5 -4.2 -5.1 -6.1 -3.9 -7.5 -7.2 -8.5 -7.6 -11.4 -13.0 -14.0 Net Profit 20.9 38.6 51.2 42.3 26.5 56.1 72.2 58.7 52.2 79.9 91.5 99.3 Adj. Net Profit (ex-share-based exp) 23.2 42.9 53.7 45.5 29.9 59.5 75.3 62.1 55.8 83.5 95.2 102.9 Diluted EPS (US$) 0.60 1.11 1.47 1.22 0.76 1.61 2.07 1.68 1.49 2.27 2.59 2.80 Adj. Diluted EPS (US$, ex-share-based exp.) 0.67 1.23 1.54 1.31 0.86 1.71 2.16 1.78 1.59 2.37 2.69 2.90 Margins (%) Gross Margin 60.4 65.1 66.4 62.9 60.5 63.8 65.5 62.9 60.8 62.9 63.1 62.9 Adj. OPM 28.5 38.1 41.9 36.2 27.4 40.6 42.4 38.3 35.8 40.9 41.1 40.9 EBITDA Margin 39.6 46.7 49.4 43.9 36.7 47.7 49.0 45.9 44.5 47.9 47.6 47.4 Net Margin 25.5 33.0 37.8 32.0 22.3 34.9 38.5 33.0 31.1 35.9 36.2 36.3 Adj. Net Margin 28.3 36.7 39.7 34.4 25.2 37.0 40.2 34.9 33.3 37.5 37.6 37.6 Sequential Growth (%) Revenue 4.6 42.8 15.7 -2.3 -10.3 35.5 16.5 -5.0 -5.9 33.1 13.4 8.1 Gross Profit 1.4 54.1 18.0 -7.6 -13.7 43.1 19.5 -8.7 -9.0 37.7 13.6 8.0 EBIT -13.0 91.7 34.6 -17.7 -35.0 113.2 23.3 -15.1 -13.0 55.5 14.3 8.1 Net Profit -30.6 84.8 32.6 -17.4 -37.4 111.8 28.6 -18.7 -11.1 53.3 14.5 8.4 Adj. Net Profit -27.4 84.8 25.3 -15.4 -34.1 98.7 26.6 -17.6 -10.1 49.8 13.9 8.1 Diluted EPS -30.6 84.7 32.6 -17.3 -37.3 111.5 28.4 -19.0 -11.5 52.7 14.1 8.1 Adj. Diluted EPS -27.3 84.7 25.3 -15.3 -34.1 98.4 26.4 -17.9 -10.5 49.3 13.5 7.7 Source: Company reports and J.P. Morgan estimates.
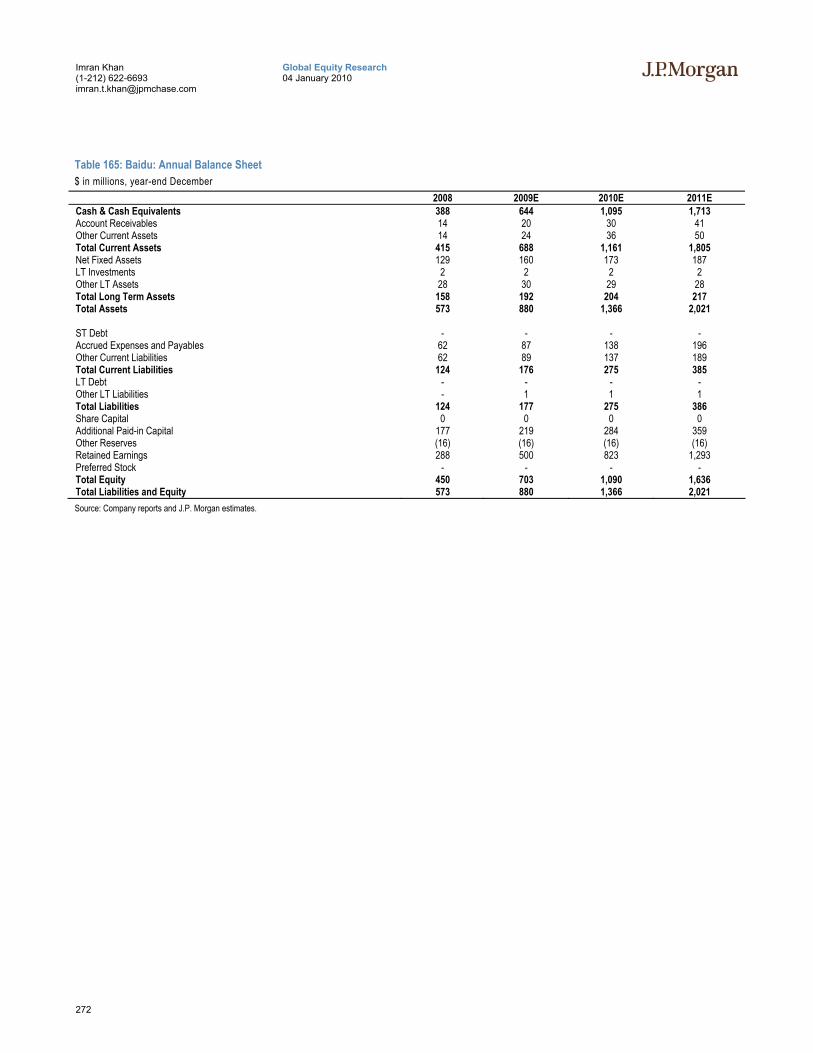
272
Global Equity Research 04 January 2010
Imran Khan (1-212) 622-6693 [email protected]
Table 165: Baidu: Annual Balance Sheet $ in millions, year-end December
2008 2009E 2010E 2011E Cash & Cash Equivalents 388 644 1,095 1,713 Account Receivables 14 20 30 41 Other Current Assets 14 24 36 50 Total Current Assets 415 688 1,161 1,805 Net Fixed Assets 129 160 173 187 LT Investments 2 2 2 2 Other LT Assets 28 30 29 28 Total Long Term Assets 158 192 204 217 Total Assets 573 880 1,366 2,021 ST Debt - - - - Accrued Expenses and Payables 62 87 138 196 Other Current Liabilities 62 89 137 189 Total Current Liabilities 124 176 275 385 LT Debt - - - - Other LT Liabilities - 1 1 1 Total Liabilities 124 177 275 386 Share Capital 0 0 0 0 Additional Paid-in Capital 177 219 284 359 Other Reserves (16) (16) (16) (16) Retained Earnings 288 500 823 1,293 Preferred Stock - - - - Total Equity 450 703 1,090 1,636 Total Liabilities and Equity 573 880 1,366 2,021 Source: Company reports and J.P. Morgan estimates.

273
Global Equity Research 04 January 2010
Imran Khan (1-212) 622-6693 [email protected]
Table 166: Baidu: Annual Cash Flow Statement $ in millions, year-end December
2008 2009E 2010E 2011E Net Income 153 214 323 470 Add Non cash Expenses/(income) Depreciation and Amortization 40 48 64 82 Extra-ordinaries - - - - Other Non-Cash Items 38 13 14 16 Changes in Working Capital: (Increase)/Decrease Receivables (4) (6) (10) (11) (Increase)/Decrease Inventories - - - - (Increase)/Decrease Other Current Assets (4) (10) (13) (14) Increase/(Decrease) Payables 9 25 51 58 Increase/(Decrease) Other Current Liabilities 22 27 48 52 Net Cash from Operations 254 311 477 653 Cash Flow from Investing Purchase of Property, Plant & Equipment (54) (78) (76) (94) Purchase / Sale of Other LT Assets (6) (4) (0) (0) Purchase / Sale of Investments (34) (0) - - Net Cash from Investing Activities (93) (81) (76) (94) Cash Flow from Financing Issuance/Repayment of Debt - - - - Change in other LT liabilities (0) 1 - - Change in Common Equity - net (9) 28 50 60 Payment of Cash Dividends - - - - Other Financing Charges, Net 5 (4) (0) 0 Net Cash from Financing Activities (5) 25 50 60 Net Change in Cash & Cash Equivalents 176 257 451 618 Cash & Cash Equivalents at end of period 388 644 1,095 1,713 Source: Company reports and J.P. Morgan estimates.
274
Global Equity Research 04 January 2010
Imran Khan (1-212) 622-6693 [email protected]
China Finance Online, Neutral, ($7.28) We maintain our Neutral rating on China Finance Online (JRJC) due to what we believe to be a lack of near-term share price drivers despite good activity in the domestic stock market. Our Dec-10 price target is US$12.0, which implies 28.8x/14.4x 2010E/2011E adjusted diluted P/E.
• We expect the company to be able to maintain its cash revenue generation at the mid-teen level. The company generated cash revenue of US$13.5MM in 3Q09 and US$21.0MM in 2Q09. We are confident that JRJC can maintain a mid-to-high-teen level of revenue, given (1) reduced volatility in stock markets, (2) expanded product portfolio offering a wider price range of products available for sale, (3) enhanced execution, (4) a large untapped registered user base, (5) revenue upside from brokerage and institutional investors, and (6) increased ad revenues due to enhanced website content, such as real-time quotes from the Hong Kong Stock Exchange.
• The company is in the process of reducing its headcount. It expects the headcount to come down to 1300 by 1Q10 from the 3Q09 end number of 1,600. The rationale for headcount reduction is to improve efficiency. However, the reduction in G&A expenses is expected to be neutralized by an increase in R&D expenses and increased bonus payments to sales force on account of higher expected sales.
• JRJC plans to release a new trend analysis product after the 2010 Chinese New Year holidays. This product uses stock trade data from the Shanghai stock exchange and provides trading insights to customers. The company also plans to launch new institutional business products after the Chinese New Year.
• On a mid-term view, the company expects the current cost structure to support a revenue run rate of US$80-100MM and doesn’t expect much of a change in costs for the next 1-2 years. On the acquisition side, the company is interested in targets with strong technology platforms or product lines.
• However, we remain Neutral, due to the following concerns: (a) the company lacks a new killer product (with TopView discontinued in early 2009); (b) market stabilizing may not improve the demand for stock analysis software; (c) non-subscription-based services (such as international brokerage and domestic brokerage revenue-sharing) are yet to gain strong traction.
• 2010 drivers: In our view, the key positive and negative share price drivers in 2010 will be (1) a meaningful recovery, or further deterioration, in China’s domestic stock market activities, (2) performance of newly launched subscription-based products, and (3) performance of other new initiatives.
Our current 2010 estimates are presented in the table below:
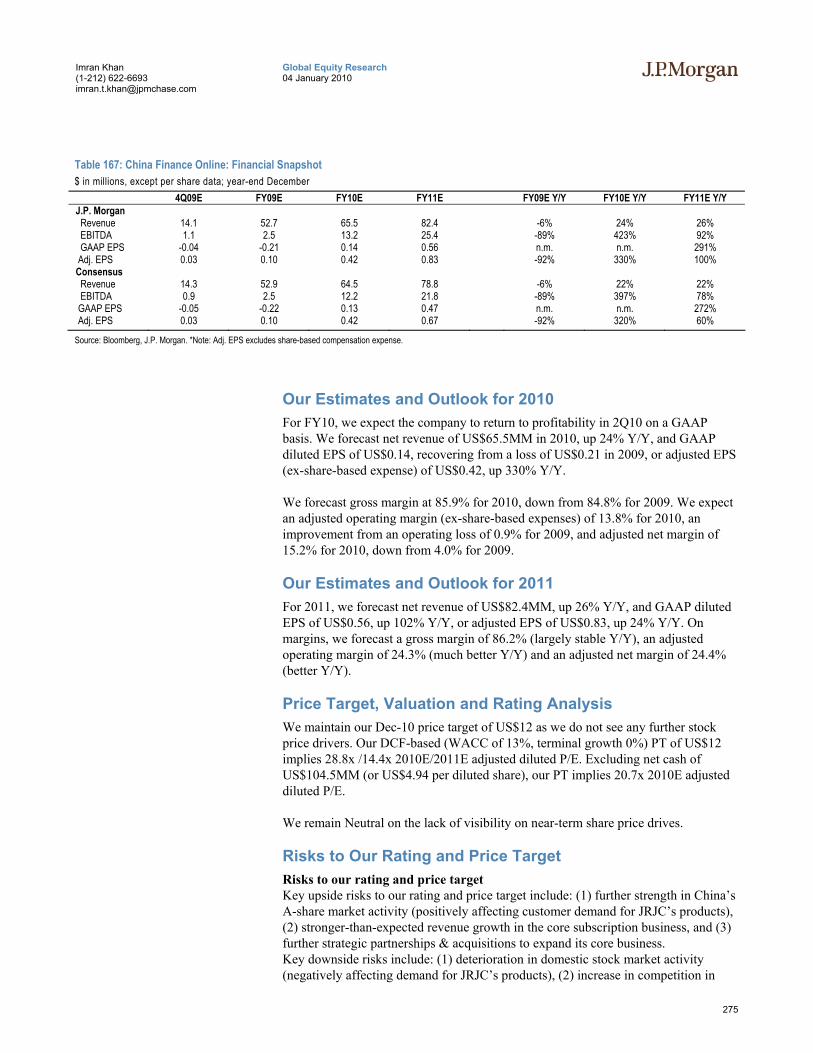
275
Global Equity Research 04 January 2010
Imran Khan (1-212) 622-6693 [email protected]
Table 167: China Finance Online: Financial Snapshot $ in millions, except per share data; year-end December 4Q09E FY09E FY10E FY11E FY09E Y/Y FY10E Y/Y FY11E Y/Y J.P. Morgan Revenue 14.1 52.7 65.5 82.4 -6% 24% 26% EBITDA 1.1 2.5 13.2 25.4 -89% 423% 92% GAAP EPS -0.04 -0.21 0.14 0.56 n.m. n.m. 291% Adj. EPS 0.03 0.10 0.42 0.83 -92% 330% 100% Consensus Revenue 14.3 52.9 64.5 78.8 -6% 22% 22% EBITDA 0.9 2.5 12.2 21.8 -89% 397% 78% GAAP EPS -0.05 -0.22 0.13 0.47 n.m. n.m. 272% Adj. EPS 0.03 0.10 0.42 0.67 -92% 320% 60%
Source: Bloomberg, J.P. Morgan. *Note: Adj. EPS excludes share-based compensation expense.
Our Estimates and Outlook for 2010 For FY10, we expect the company to return to profitability in 2Q10 on a GAAP basis. We forecast net revenue of US$65.5MM in 2010, up 24% Y/Y, and GAAP diluted EPS of US$0.14, recovering from a loss of US$0.21 in 2009, or adjusted EPS (ex-share-based expense) of US$0.42, up 330% Y/Y.
We forecast gross margin at 85.9% for 2010, down from 84.8% for 2009. We expect an adjusted operating margin (ex-share-based expenses) of 13.8% for 2010, an improvement from an operating loss of 0.9% for 2009, and adjusted net margin of 15.2% for 2010, down from 4.0% for 2009.
Our Estimates and Outlook for 2011 For 2011, we forecast net revenue of US$82.4MM, up 26% Y/Y, and GAAP diluted EPS of US$0.56, up 102% Y/Y, or adjusted EPS of US$0.83, up 24% Y/Y. On margins, we forecast a gross margin of 86.2% (largely stable Y/Y), an adjusted operating margin of 24.3% (much better Y/Y) and an adjusted net margin of 24.4% (better Y/Y).
Price Target, Valuation and Rating Analysis We maintain our Dec-10 price target of US$12 as we do not see any further stock price drivers. Our DCF-based (WACC of 13%, terminal growth 0%) PT of US$12 implies 28.8x /14.4x 2010E/2011E adjusted diluted P/E. Excluding net cash of US$104.5MM (or US$4.94 per diluted share), our PT implies 20.7x 2010E adjusted diluted P/E.
We remain Neutral on the lack of visibility on near-term share price drives.
Risks to Our Rating and Price Target Risks to our rating and price target Key upside risks to our rating and price target include: (1) further strength in China’s A-share market activity (positively affecting customer demand for JRJC’s products), (2) stronger-than-expected revenue growth in the core subscription business, and (3) further strategic partnerships & acquisitions to expand its core business. Key downside risks include: (1) deterioration in domestic stock market activity (negatively affecting demand for JRJC’s products), (2) increase in competition in
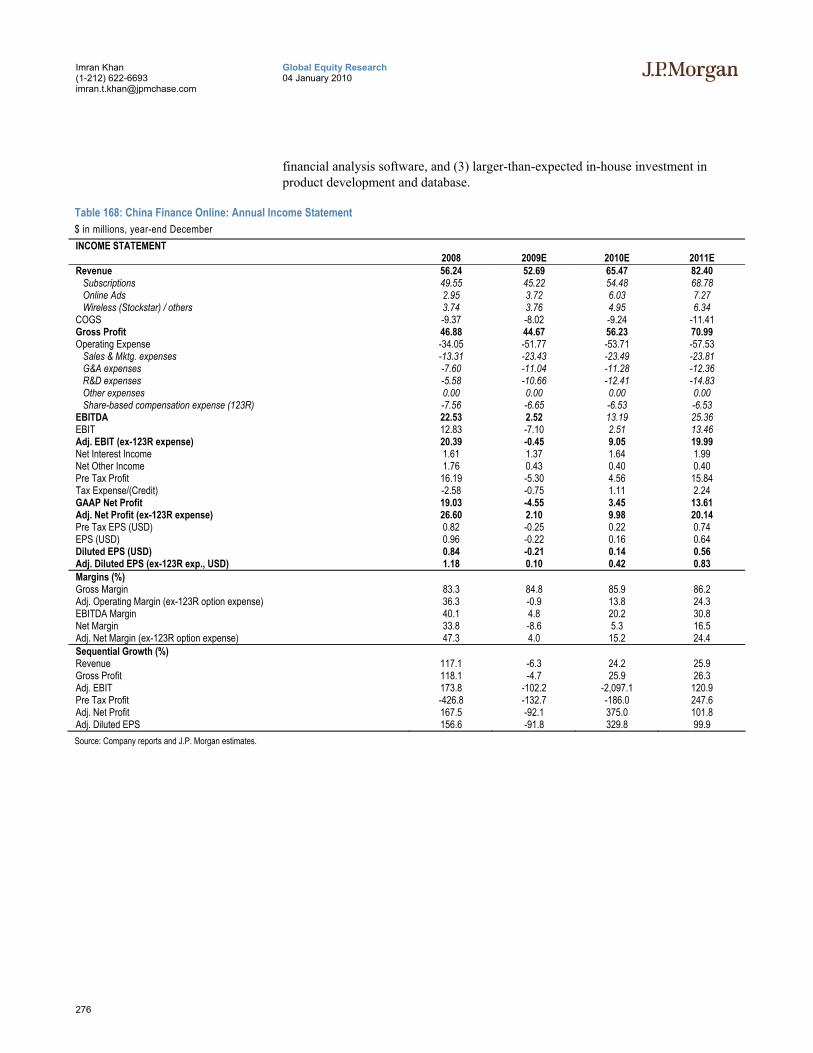
276
Global Equity Research 04 January 2010
Imran Khan (1-212) 622-6693 [email protected]
financial analysis software, and (3) larger-than-expected in-house investment in product development and database.
Table 168: China Finance Online: Annual Income Statement $ in millions, year-end December INCOME STATEMENT
2008 2009E 2010E 2011E Revenue 56.24 52.69 65.47 82.40 Subscriptions 49.55 45.22 54.48 68.78 Online Ads 2.95 3.72 6.03 7.27 Wireless (Stockstar) / others 3.74 3.76 4.95 6.34 COGS -9.37 -8.02 -9.24 -11.41 Gross Profit 46.88 44.67 56.23 70.99 Operating Expense -34.05 -51.77 -53.71 -57.53 Sales & Mktg. expenses -13.31 -23.43 -23.49 -23.81 G&A expenses -7.60 -11.04 -11.28 -12.36 R&D expenses -5.58 -10.66 -12.41 -14.83 Other expenses 0.00 0.00 0.00 0.00 Share-based compensation expense (123R) -7.56 -6.65 -6.53 -6.53 EBITDA 22.53 2.52 13.19 25.36 EBIT 12.83 -7.10 2.51 13.46 Adj. EBIT (ex-123R expense) 20.39 -0.45 9.05 19.99 Net Interest Income 1.61 1.37 1.64 1.99 Net Other Income 1.76 0.43 0.40 0.40 Pre Tax Profit 16.19 -5.30 4.56 15.84 Tax Expense/(Credit) -2.58 -0.75 1.11 2.24 GAAP Net Profit 19.03 -4.55 3.45 13.61 Adj. Net Profit (ex-123R expense) 26.60 2.10 9.98 20.14 Pre Tax EPS (USD) 0.82 -0.25 0.22 0.74 EPS (USD) 0.96 -0.22 0.16 0.64 Diluted EPS (USD) 0.84 -0.21 0.14 0.56 Adj. Diluted EPS (ex-123R exp., USD) 1.18 0.10 0.42 0.83 Margins (%) Gross Margin 83.3 84.8 85.9 86.2 Adj. Operating Margin (ex-123R option expense) 36.3 -0.9 13.8 24.3 EBITDA Margin 40.1 4.8 20.2 30.8 Net Margin 33.8 -8.6 5.3 16.5 Adj. Net Margin (ex-123R option expense) 47.3 4.0 15.2 24.4 Sequential Growth (%) Revenue 117.1 -6.3 24.2 25.9 Gross Profit 118.1 -4.7 25.9 26.3 Adj. EBIT 173.8 -102.2 -2,097.1 120.9 Pre Tax Profit -426.8 -132.7 -186.0 247.6 Adj. Net Profit 167.5 -92.1 375.0 101.8 Adj. Diluted EPS 156.6 -91.8 329.8 99.9 Source: Company reports and J.P. Morgan estimates.

277
Global Equity Research 04 January 2010
Imran Khan (1-212) 622-6693 [email protected]
Table 169: China Finance Online: Quarterly Income Statement $ in millions, year-end December
1Q08 2Q08 3Q08 4Q08 1Q09 2Q09 3Q09 4Q09E 1Q10E 2Q10E 3Q10E 4Q10E Revenue 11.06 14.68 15.23 15.28 11.76 12.28 14.58 14.08 14.75 15.86 16.76 18.09 Subscriptions 9.85 13.40 13.78 12.52 10.98 10.99 11.81 11.44 12.34 13.20 13.91 15.03 Online Ads 0.59 0.76 0.76 0.84 0.43 0.77 1.12 1.40 1.26 1.44 1.59 1.75 Wireless (Stockstar) / others 0.62 0.52 0.68 1.92 0.34 0.52 1.65 1.25 1.15 1.22 1.27 1.32 COGS -1.72 -2.10 -2.77 -2.78 -1.53 -2.03 -2.31 -2.15 -2.15 -2.25 -2.34 -2.49 Gross Profit 9.34 12.58 12.46 12.50 10.22 10.25 12.27 11.93 12.60 13.60 14.42 15.60 Operating Expense -7.36 -9.00 -8.56 -9.13 -10.50 -13.62 -14.29 -13.36 -12.84 -13.21 -13.45 -14.21 Sales & Mktg. expenses -2.39 -3.57 -3.58 -3.77 -4.58 -6.54 -6.40 -5.91 -5.61 -5.87 -5.87 -6.15 G&A expenses -1.64 -2.23 -1.88 -1.85 -2.24 -2.43 -3.41 -2.96 -2.66 -2.70 -2.85 -3.08 R&D expenses -0.97 -1.23 -1.48 -1.89 -1.93 -3.02 -2.86 -2.86 -2.95 -3.01 -3.10 -3.35 Other expenses 0.00 0.00 0.00 0.00 0.00 0.00 0.00 0.00 0.00 0.00 0.00 0.00 Share-based compensation expense (123R) -2.37 -1.97 -1.61 -1.62 -1.75 -1.64 -1.63 -1.63 -1.63 -1.63 -1.63 -1.63 EBITDA 4.77 6.00 6.10 5.67 2.13 -1.05 0.36 1.08 2.32 3.01 3.68 4.20 EBIT 1.97 3.58 3.90 3.37 -0.27 -3.37 -2.03 -1.43 -0.24 0.39 0.97 1.40 Adj. EBIT (ex-123R expense) 4.34 5.54 5.52 4.99 1.48 -1.74 -0.39 0.20 1.39 2.03 2.60 3.03 Net Interest Income 0.34 0.35 0.52 0.40 0.30 0.30 0.38 0.39 0.38 0.40 0.42 0.44 Net Other Income 0.87 0.55 0.11 0.23 0.04 0.14 0.16 0.10 0.10 0.10 0.10 0.10 Pre Tax Profit 3.19 4.47 4.52 4.01 0.06 -2.93 -1.49 -0.94 0.24 0.90 1.49 1.94 Tax Expense/(Credit) -0.06 -0.09 -0.25 -2.18 0.19 -0.54 -0.46 0.05 0.19 0.25 0.31 0.36 GAAP Net Profit 3.51 4.56 4.77 6.19 -0.13 -2.40 -1.03 -0.99 0.05 0.64 1.18 1.58 Adj. Net Profit (ex-123R expense) 5.88 6.53 6.38 7.81 1.62 -0.76 0.60 0.64 1.68 2.28 2.81 3.21 Pre Tax EPS (USD) 0.16 0.23 0.23 0.20 0.00 -0.14 -0.07 -0.04 0.01 0.04 0.07 0.09 EPS (USD) 0.18 0.23 0.24 0.31 -0.01 -0.11 -0.05 -0.05 0.00 0.03 0.06 0.07 Diluted EPS (USD) 0.15 0.20 0.21 0.28 -0.01 -0.11 -0.05 -0.04 0.00 0.03 0.05 0.07 Adj. Diluted EPS (ex-123R exp., USD) 0.26 0.28 0.28 0.36 0.08 -0.04 0.03 0.03 0.07 0.10 0.12 0.13 Margins (%) Gross Margin 84.5 85.7 81.8 81.8 87.0 83.5 84.2 84.7 85.4 85.8 86.0 86.2 Operating Margin (ex-123R option expense) 39.3 37.8 36.2 32.7 12.5 -14.2 -2.7 1.4 9.4 12.8 15.5 16.7 EBITDA Margin 43.1 40.9 40.0 37.1 18.1 -8.5 2.5 7.7 15.7 19.0 21.9 23.2 Net Margin 31.7 31.1 31.3 40.5 -1.1 -19.5 -7.1 -7.0 0.3 4.1 7.0 8.7 Net Margin (ex-123R option expense) 53.1 44.5 41.9 51.1 13.8 -6.2 4.1 4.6 11.4 14.3 16.8 17.7 Sequential Growth (%) Revenue 24.5 32.8 3.7 0.3 -23.1 4.5 18.7 -3.4 4.8 7.5 5.7 7.9 Gross Profit 23.5 34.7 -0.9 0.3 -18.2 0.2 19.7 -2.7 5.6 8.0 6.0 8.2 EBIT ex-123R option expense 73.0 27.7 -0.5 -9.5 -70.4 -217.9 -77.5 -151.8 583.7 46.0 28.4 16.4 Pre Tax Profit -136.3 40.1 1.2 -11.4 -98.5 -4,832.3 -49.3 -37.0 -125.3 276.7 66.5 29.8 Net Profit ex-123R option expense 61.7 11.1 -2.2 22.4 -79.3 n.m. n.m. 7.1 162.1 35.2 23.5 14.2 Diluted EPS ex-123R expense 66.3 10.1 -1.4 27.2 -78.1 n.m. n.m. -4.8 160.6 35.0 23.4 14.1 Source: Company reports and J.P. Morgan estimates.
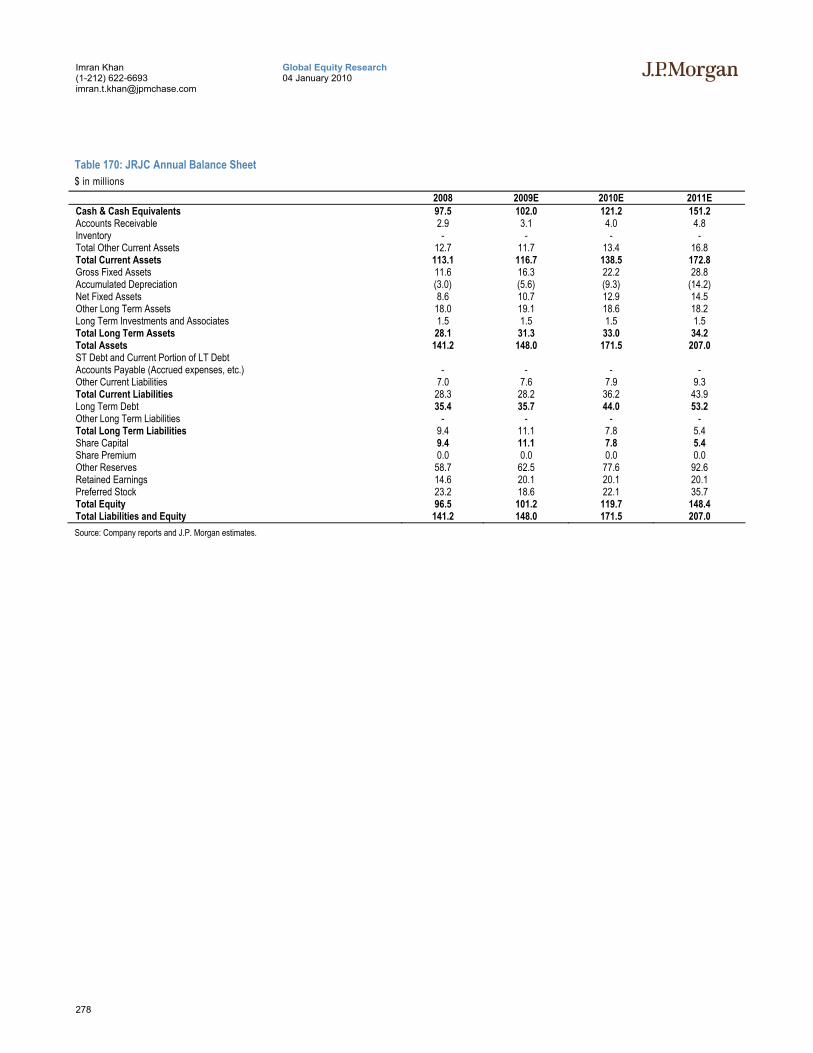
278
Global Equity Research 04 January 2010
Imran Khan (1-212) 622-6693 [email protected]
Table 170: JRJC Annual Balance Sheet $ in millions
2008 2009E 2010E 2011E Cash & Cash Equivalents 97.5 102.0 121.2 151.2 Accounts Receivable 2.9 3.1 4.0 4.8 Inventory - - - - Total Other Current Assets 12.7 11.7 13.4 16.8 Total Current Assets 113.1 116.7 138.5 172.8 Gross Fixed Assets 11.6 16.3 22.2 28.8 Accumulated Depreciation (3.0) (5.6) (9.3) (14.2) Net Fixed Assets 8.6 10.7 12.9 14.5 Other Long Term Assets 18.0 19.1 18.6 18.2 Long Term Investments and Associates 1.5 1.5 1.5 1.5 Total Long Term Assets 28.1 31.3 33.0 34.2 Total Assets 141.2 148.0 171.5 207.0 ST Debt and Current Portion of LT Debt Accounts Payable (Accrued expenses, etc.) - - - - Other Current Liabilities 7.0 7.6 7.9 9.3 Total Current Liabilities 28.3 28.2 36.2 43.9 Long Term Debt 35.4 35.7 44.0 53.2 Other Long Term Liabilities - - - - Total Long Term Liabilities 9.4 11.1 7.8 5.4 Share Capital 9.4 11.1 7.8 5.4 Share Premium 0.0 0.0 0.0 0.0 Other Reserves 58.7 62.5 77.6 92.6 Retained Earnings 14.6 20.1 20.1 20.1 Preferred Stock 23.2 18.6 22.1 35.7 Total Equity 96.5 101.2 119.7 148.4 Total Liabilities and Equity 141.2 148.0 171.5 207.0 Source: Company reports and J.P. Morgan estimates.
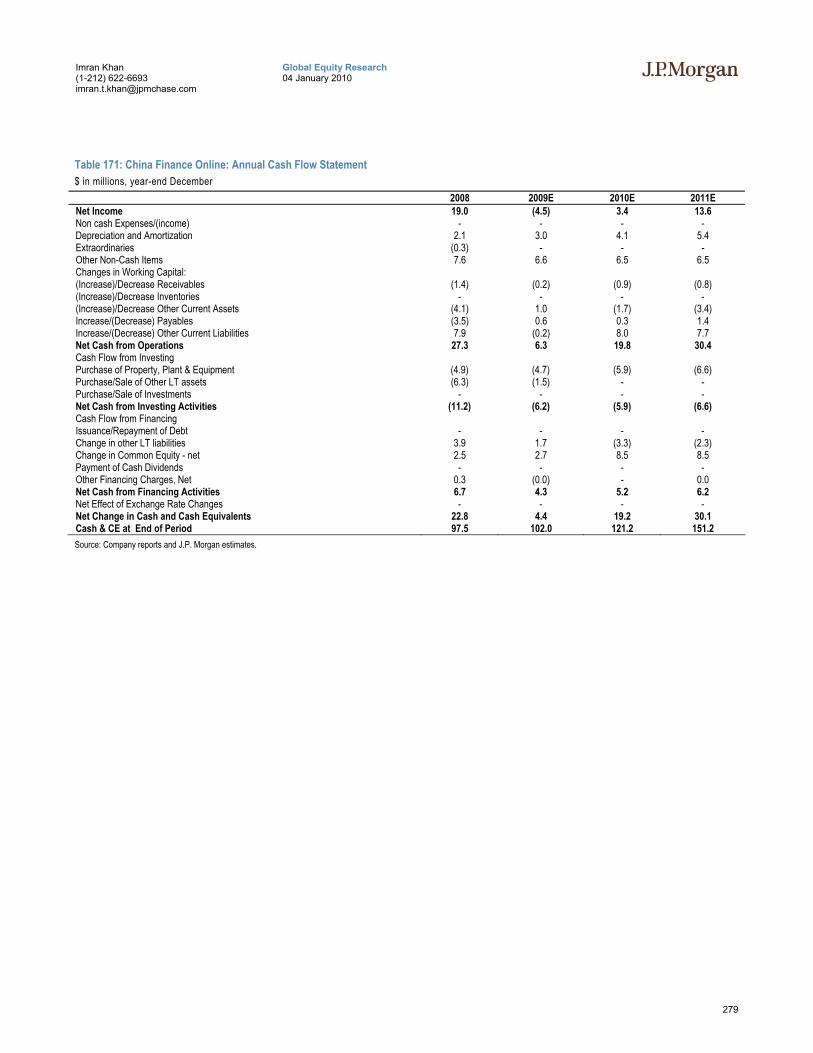
279
Global Equity Research 04 January 2010
Imran Khan (1-212) 622-6693 [email protected]
Table 171: China Finance Online: Annual Cash Flow Statement $ in millions, year-end December
2008 2009E 2010E 2011E Net Income 19.0 (4.5) 3.4 13.6 Non cash Expenses/(income) - - - - Depreciation and Amortization 2.1 3.0 4.1 5.4 Extraordinaries (0.3) - - - Other Non-Cash Items 7.6 6.6 6.5 6.5 Changes in Working Capital: (Increase)/Decrease Receivables (1.4) (0.2) (0.9) (0.8) (Increase)/Decrease Inventories - - - - (Increase)/Decrease Other Current Assets (4.1) 1.0 (1.7) (3.4) Increase/(Decrease) Payables (3.5) 0.6 0.3 1.4 Increase/(Decrease) Other Current Liabilities 7.9 (0.2) 8.0 7.7 Net Cash from Operations 27.3 6.3 19.8 30.4 Cash Flow from Investing Purchase of Property, Plant & Equipment (4.9) (4.7) (5.9) (6.6) Purchase/Sale of Other LT assets (6.3) (1.5) - - Purchase/Sale of Investments - - - - Net Cash from Investing Activities (11.2) (6.2) (5.9) (6.6) Cash Flow from Financing Issuance/Repayment of Debt - - - - Change in other LT liabilities 3.9 1.7 (3.3) (2.3) Change in Common Equity - net 2.5 2.7 8.5 8.5 Payment of Cash Dividends - - - - Other Financing Charges, Net 0.3 (0.0) - 0.0 Net Cash from Financing Activities 6.7 4.3 5.2 6.2 Net Effect of Exchange Rate Changes - - - - Net Change in Cash and Cash Equivalents 22.8 4.4 19.2 30.1 Cash & CE at End of Period 97.5 102.0 121.2 151.2 Source: Company reports and J.P. Morgan estimates.
280
Global Equity Research 04 January 2010
Imran Khan (1-212) 622-6693 [email protected]
NetEase, Overweight, ($37.01) • We remain OW on NetEase. NetEase is one of the leading online game
developers and operators in China. While NetEase has seen regulatory challenges over the launch of World of Warcraft (WoW), we believe WoW has a good chance of getting the required regulatory approvals given (1) the backing from Ministry of Culture, and (2) more clarity on the regulatory landscape expected over the next few months. We believe the current share price is not fully reflecting the potential in Blizzard’s relationship and other in-house games in the pipeline. Our Dec-10 PT of US$53 implies 17.3x FY10E and 14.7x FY11E diluted adjusted EPS. If we exclude cash of US$7.2 per share, our PT implies 15x FY10E and 12.7x FY11E ex-cash P/E.
• We believe NetEase differentiates itself by: (1) its deep penetration of sales & marketing teams into small cities (where there is less competition), and (2) taking a long-term view in game development (and upgrade) and customer monetization. As one of the leading online game developers (with ~1,100 R&D staff) in China with proven game operating capability, we believe NetEase is well positioned to capture growth in China’s online games industry in the long run.
• There is long-term potential from ad revenues as well. The company has recently expanded its website content. In addition, NetEase has the largest free email user base in China. The company can leverage this user base and portal traffic to monetize better over time through online ads and search services. The top ad sectors for NetEase are automobiles, internet services, and telecom services. Increasing auto sales and 3G related advertising should add more revenues for NetEase.
• Based on calculations that we believe are conservative, in-house NetEase games and portal implies a value of US$36.7 per share (assuming a 12x forward P/E for in-house games, and not Blizzard-related business). We estimate the value of the Blizzard-NetEase relation to be in the range of US$9 to US$13 per share, including (1) WoW and (2) the option value for Battle.net and other Blizzard’s games. As a result, at the current share price, we believe the market has mostly discounted the value of World of Warcraft and Blizzard-NetEase JV (for games such as StarCraft II, Warcraft III: The Frozen Throne, and Warcraft III: Reign of Chaos).
2010 drivers: We expect the share price to be driven by: (1) more clarity on the regulatory front, which we expect to materialize in next 2-3 months; (2) next WoW upgrade, Wrath of the Lich King, getting regulatory approval; (3) upside from new games after years of development, for example, TX2, and a large number of games to begin the final phase of testing and this could lead to earnings upside; (4) other Blizzard game launches, such as Warcraft III, StarCraft II, and Battle.net.
Our current 2010 estimates are presented in the table below:
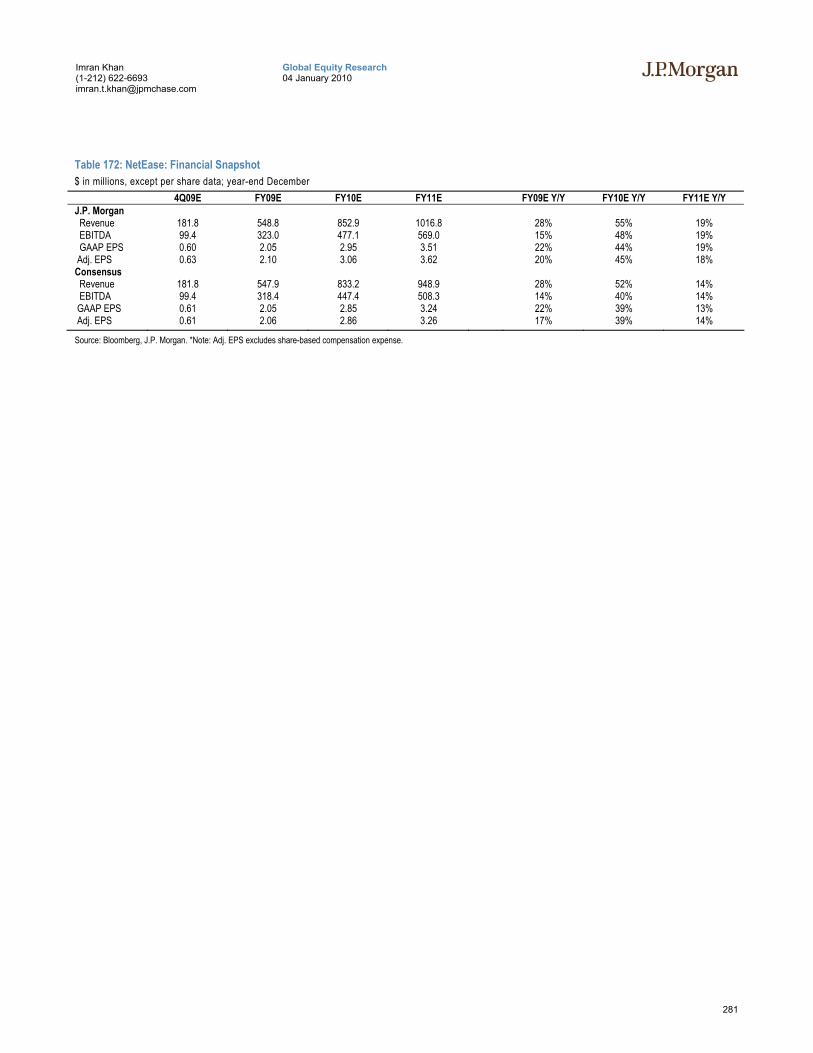
281
Global Equity Research 04 January 2010
Imran Khan (1-212) 622-6693 [email protected]
Table 172: NetEase: Financial Snapshot $ in millions, except per share data; year-end December 4Q09E FY09E FY10E FY11E FY09E Y/Y FY10E Y/Y FY11E Y/Y J.P. Morgan Revenue 181.8 548.8 852.9 1016.8 28% 55% 19% EBITDA 99.4 323.0 477.1 569.0 15% 48% 19% GAAP EPS 0.60 2.05 2.95 3.51 22% 44% 19% Adj. EPS 0.63 2.10 3.06 3.62 20% 45% 18% Consensus Revenue 181.8 547.9 833.2 948.9 28% 52% 14% EBITDA 99.4 318.4 447.4 508.3 14% 40% 14% GAAP EPS 0.61 2.05 2.85 3.24 22% 39% 13% Adj. EPS 0.61 2.06 2.86 3.26 17% 39% 14%
Source: Bloomberg, J.P. Morgan. *Note: Adj. EPS excludes share-based compensation expense.
282
Global Equity Research 04 January 2010
Imran Khan (1-212) 622-6693 [email protected]
Our Estimates and Outlook for 2010 We forecast net revenue of US$852.9MM in 2010, up 55% Y/Y, and GAAP diluted EPS of US$2.95, up 45% Y/Y, or adjusted EPS (ex-share-based expense) of US$3.06, up 47% Y/Y. We forecast online game revenue of US$779.7MM in 2010 (91% of total revenue), up 56% Y/Y, with FWJ revenue growth of 13% Y/Y, WWJ2 revenue growth of 5% Y/Y, and WWJ3 revenue growth of 18% Y/Y. For online advertising, we forecast revenue of US$61.9MM (7% of total revenue), up 61% Y/Y.
We forecast a gross margin of 68.6% for 2010, down significantly from 75.4% for 2009, mainly due to the high revenue contribution from licensed game WoW. We expect an adjusted operating margin (ex-share-based expenses) of 51.3% for 2010, down from 55.0% for 2009 (due to lower gross margins), and adjusted net margin of 47.0% for 2010, down from 49.6% for 2009.
Our Estimates and Outlook for 2011 For 2011, we forecast net revenue of US$1,016.8MM, up 19% Y/Y, and GAAP diluted EPS of US$3.51, up 19% Y/Y, or adjusted EPS of US$3.62, up 18% Y/Y. On margins, we forecast a gross margin of 68.8% (flat Y/Y), an adjusted operating margin of 51.3% (flat Y/Y), and an adjusted net margin of 47.6% (stable Y/Y).
Price Target, Valuation and Rating Analysis We stay OW on NetEase with a Dec-10 PT of US$53. We believe the current share price has not fully reflecting the potential in NetEase’s new games and relationship with Blizzard.
Our PT of US$53 is based on our DCF valuation of US$53.2 (WACC of 13% and 0% terminal growth) and implies 25.2x FY09E, 17.3x FY10E, and 14.7x FY11E diluted adjusted EPS. If we exclude cash of US$7.2 per share, our PT of US$53 implies 21.8x FY09E, 15.0x FY10E, and 12.7x FY11E ex-cash P/E. The company has a strong cash position of US$939MM (US$7.2 per diluted share).
This PT is also in line with our nominal sum-of-the parts valuation of US$52.
Risks to Our Rating and Price Target Downside risks to our price target include intense competition resulting in negative industry environment, delays in game launches, hacking or pirated server issues limiting user growth, and the risk of losing operating rights for licensed games.
Upside risks to our price target include better-than-expected acceptance of its new games, new game licensing agreement, extended life cycle of existing games on the back of new upgrade packs, and upside in online advertising.
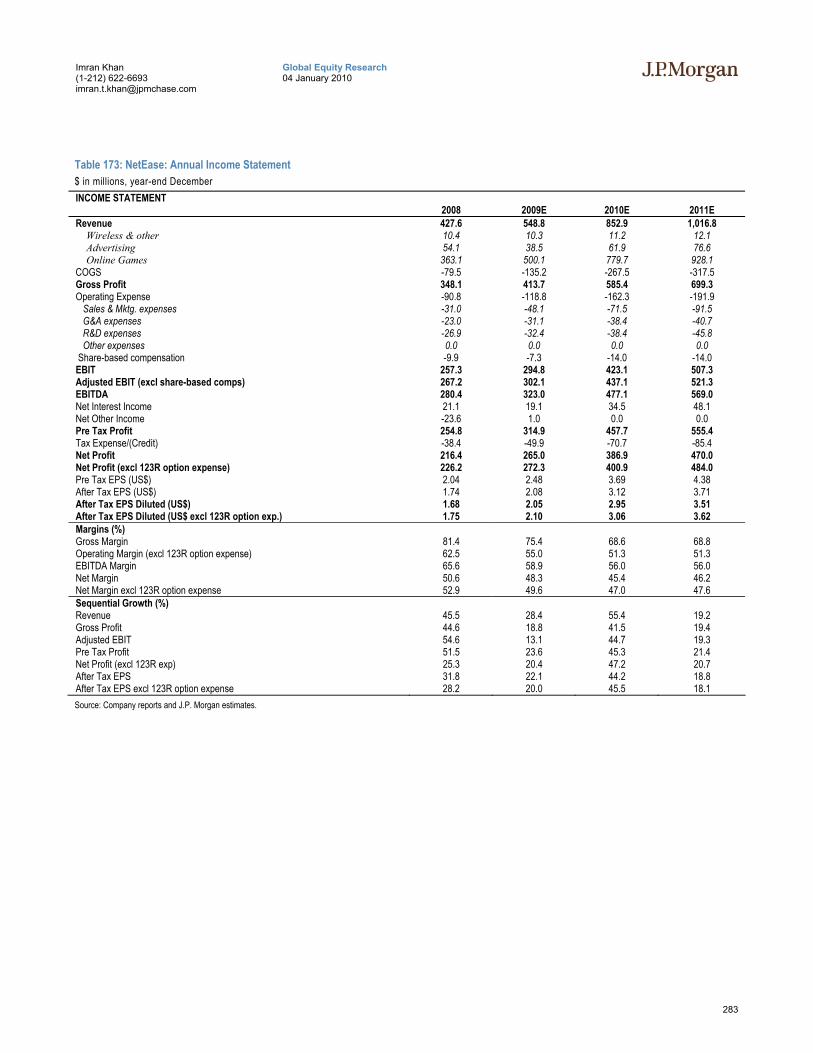
283
Global Equity Research 04 January 2010
Imran Khan (1-212) 622-6693 [email protected]
Table 173: NetEase: Annual Income Statement $ in millions, year-end December INCOME STATEMENT
2008 2009E 2010E 2011E Revenue 427.6 548.8 852.9 1,016.8 Wireless & other 10.4 10.3 11.2 12.1 Advertising 54.1 38.5 61.9 76.6 Online Games 363.1 500.1 779.7 928.1 COGS -79.5 -135.2 -267.5 -317.5 Gross Profit 348.1 413.7 585.4 699.3 Operating Expense -90.8 -118.8 -162.3 -191.9 Sales & Mktg. expenses -31.0 -48.1 -71.5 -91.5 G&A expenses -23.0 -31.1 -38.4 -40.7 R&D expenses -26.9 -32.4 -38.4 -45.8 Other expenses 0.0 0.0 0.0 0.0 Share-based compensation -9.9 -7.3 -14.0 -14.0 EBIT 257.3 294.8 423.1 507.3 Adjusted EBIT (excl share-based comps) 267.2 302.1 437.1 521.3 EBITDA 280.4 323.0 477.1 569.0 Net Interest Income 21.1 19.1 34.5 48.1 Net Other Income -23.6 1.0 0.0 0.0 Pre Tax Profit 254.8 314.9 457.7 555.4 Tax Expense/(Credit) -38.4 -49.9 -70.7 -85.4 Net Profit 216.4 265.0 386.9 470.0 Net Profit (excl 123R option expense) 226.2 272.3 400.9 484.0 Pre Tax EPS (US$) 2.04 2.48 3.69 4.38 After Tax EPS (US$) 1.74 2.08 3.12 3.71 After Tax EPS Diluted (US$) 1.68 2.05 2.95 3.51 After Tax EPS Diluted (US$ excl 123R option exp.) 1.75 2.10 3.06 3.62 Margins (%) Gross Margin 81.4 75.4 68.6 68.8 Operating Margin (excl 123R option expense) 62.5 55.0 51.3 51.3 EBITDA Margin 65.6 58.9 56.0 56.0 Net Margin 50.6 48.3 45.4 46.2 Net Margin excl 123R option expense 52.9 49.6 47.0 47.6 Sequential Growth (%) Revenue 45.5 28.4 55.4 19.2 Gross Profit 44.6 18.8 41.5 19.4 Adjusted EBIT 54.6 13.1 44.7 19.3 Pre Tax Profit 51.5 23.6 45.3 21.4 Net Profit (excl 123R exp) 25.3 20.4 47.2 20.7 After Tax EPS 31.8 22.1 44.2 18.8 After Tax EPS excl 123R option expense 28.2 20.0 45.5 18.1 Source: Company reports and J.P. Morgan estimates.
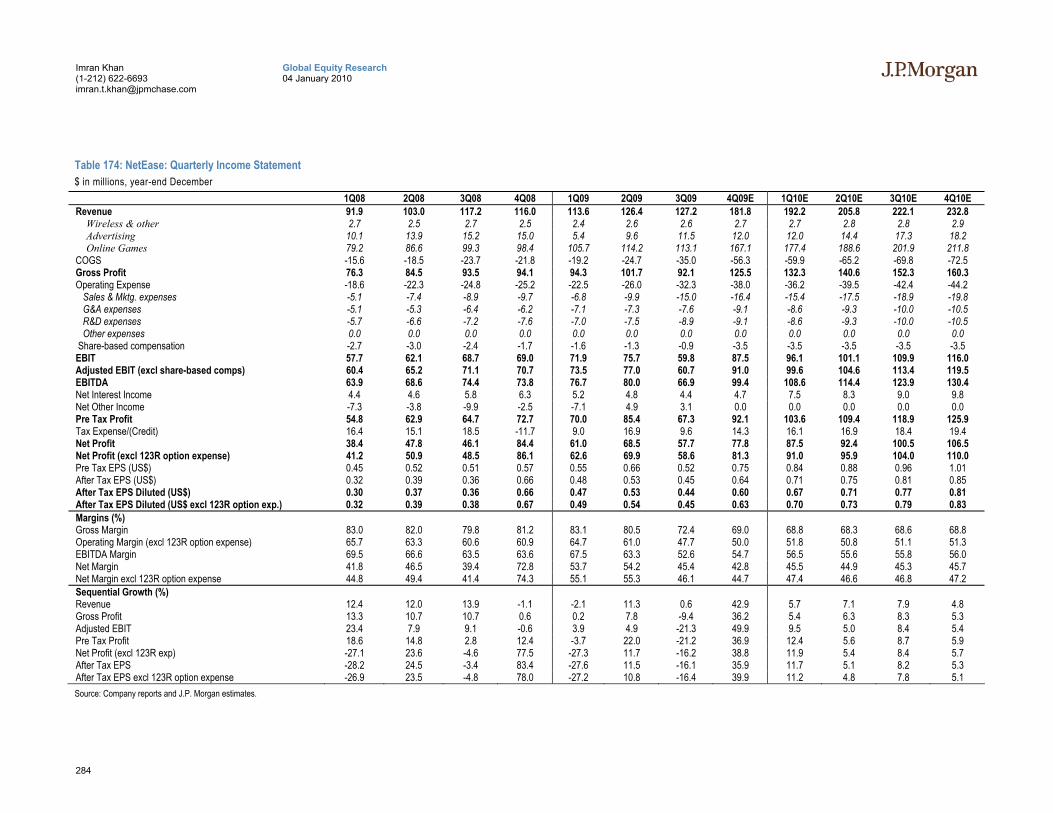
284
Global Equity Research 04 January 2010
Imran Khan (1-212) 622-6693 [email protected]
Table 174: NetEase: Quarterly Income Statement $ in millions, year-end December
1Q08 2Q08 3Q08 4Q08 1Q09 2Q09 3Q09 4Q09E 1Q10E 2Q10E 3Q10E 4Q10E Revenue 91.9 103.0 117.2 116.0 113.6 126.4 127.2 181.8 192.2 205.8 222.1 232.8 Wireless & other 2.7 2.5 2.7 2.5 2.4 2.6 2.6 2.7 2.7 2.8 2.8 2.9 Advertising 10.1 13.9 15.2 15.0 5.4 9.6 11.5 12.0 12.0 14.4 17.3 18.2 Online Games 79.2 86.6 99.3 98.4 105.7 114.2 113.1 167.1 177.4 188.6 201.9 211.8 COGS -15.6 -18.5 -23.7 -21.8 -19.2 -24.7 -35.0 -56.3 -59.9 -65.2 -69.8 -72.5 Gross Profit 76.3 84.5 93.5 94.1 94.3 101.7 92.1 125.5 132.3 140.6 152.3 160.3 Operating Expense -18.6 -22.3 -24.8 -25.2 -22.5 -26.0 -32.3 -38.0 -36.2 -39.5 -42.4 -44.2 Sales & Mktg. expenses -5.1 -7.4 -8.9 -9.7 -6.8 -9.9 -15.0 -16.4 -15.4 -17.5 -18.9 -19.8 G&A expenses -5.1 -5.3 -6.4 -6.2 -7.1 -7.3 -7.6 -9.1 -8.6 -9.3 -10.0 -10.5 R&D expenses -5.7 -6.6 -7.2 -7.6 -7.0 -7.5 -8.9 -9.1 -8.6 -9.3 -10.0 -10.5 Other expenses 0.0 0.0 0.0 0.0 0.0 0.0 0.0 0.0 0.0 0.0 0.0 0.0 Share-based compensation -2.7 -3.0 -2.4 -1.7 -1.6 -1.3 -0.9 -3.5 -3.5 -3.5 -3.5 -3.5 EBIT 57.7 62.1 68.7 69.0 71.9 75.7 59.8 87.5 96.1 101.1 109.9 116.0 Adjusted EBIT (excl share-based comps) 60.4 65.2 71.1 70.7 73.5 77.0 60.7 91.0 99.6 104.6 113.4 119.5 EBITDA 63.9 68.6 74.4 73.8 76.7 80.0 66.9 99.4 108.6 114.4 123.9 130.4 Net Interest Income 4.4 4.6 5.8 6.3 5.2 4.8 4.4 4.7 7.5 8.3 9.0 9.8 Net Other Income -7.3 -3.8 -9.9 -2.5 -7.1 4.9 3.1 0.0 0.0 0.0 0.0 0.0 Pre Tax Profit 54.8 62.9 64.7 72.7 70.0 85.4 67.3 92.1 103.6 109.4 118.9 125.9 Tax Expense/(Credit) 16.4 15.1 18.5 -11.7 9.0 16.9 9.6 14.3 16.1 16.9 18.4 19.4 Net Profit 38.4 47.8 46.1 84.4 61.0 68.5 57.7 77.8 87.5 92.4 100.5 106.5 Net Profit (excl 123R option expense) 41.2 50.9 48.5 86.1 62.6 69.9 58.6 81.3 91.0 95.9 104.0 110.0 Pre Tax EPS (US$) 0.45 0.52 0.51 0.57 0.55 0.66 0.52 0.75 0.84 0.88 0.96 1.01 After Tax EPS (US$) 0.32 0.39 0.36 0.66 0.48 0.53 0.45 0.64 0.71 0.75 0.81 0.85 After Tax EPS Diluted (US$) 0.30 0.37 0.36 0.66 0.47 0.53 0.44 0.60 0.67 0.71 0.77 0.81 After Tax EPS Diluted (US$ excl 123R option exp.) 0.32 0.39 0.38 0.67 0.49 0.54 0.45 0.63 0.70 0.73 0.79 0.83 Margins (%) Gross Margin 83.0 82.0 79.8 81.2 83.1 80.5 72.4 69.0 68.8 68.3 68.6 68.8 Operating Margin (excl 123R option expense) 65.7 63.3 60.6 60.9 64.7 61.0 47.7 50.0 51.8 50.8 51.1 51.3 EBITDA Margin 69.5 66.6 63.5 63.6 67.5 63.3 52.6 54.7 56.5 55.6 55.8 56.0 Net Margin 41.8 46.5 39.4 72.8 53.7 54.2 45.4 42.8 45.5 44.9 45.3 45.7 Net Margin excl 123R option expense 44.8 49.4 41.4 74.3 55.1 55.3 46.1 44.7 47.4 46.6 46.8 47.2 Sequential Growth (%) Revenue 12.4 12.0 13.9 -1.1 -2.1 11.3 0.6 42.9 5.7 7.1 7.9 4.8 Gross Profit 13.3 10.7 10.7 0.6 0.2 7.8 -9.4 36.2 5.4 6.3 8.3 5.3 Adjusted EBIT 23.4 7.9 9.1 -0.6 3.9 4.9 -21.3 49.9 9.5 5.0 8.4 5.4 Pre Tax Profit 18.6 14.8 2.8 12.4 -3.7 22.0 -21.2 36.9 12.4 5.6 8.7 5.9 Net Profit (excl 123R exp) -27.1 23.6 -4.6 77.5 -27.3 11.7 -16.2 38.8 11.9 5.4 8.4 5.7 After Tax EPS -28.2 24.5 -3.4 83.4 -27.6 11.5 -16.1 35.9 11.7 5.1 8.2 5.3 After Tax EPS excl 123R option expense -26.9 23.5 -4.8 78.0 -27.2 10.8 -16.4 39.9 11.2 4.8 7.8 5.1 Source: Company reports and J.P. Morgan estimates.
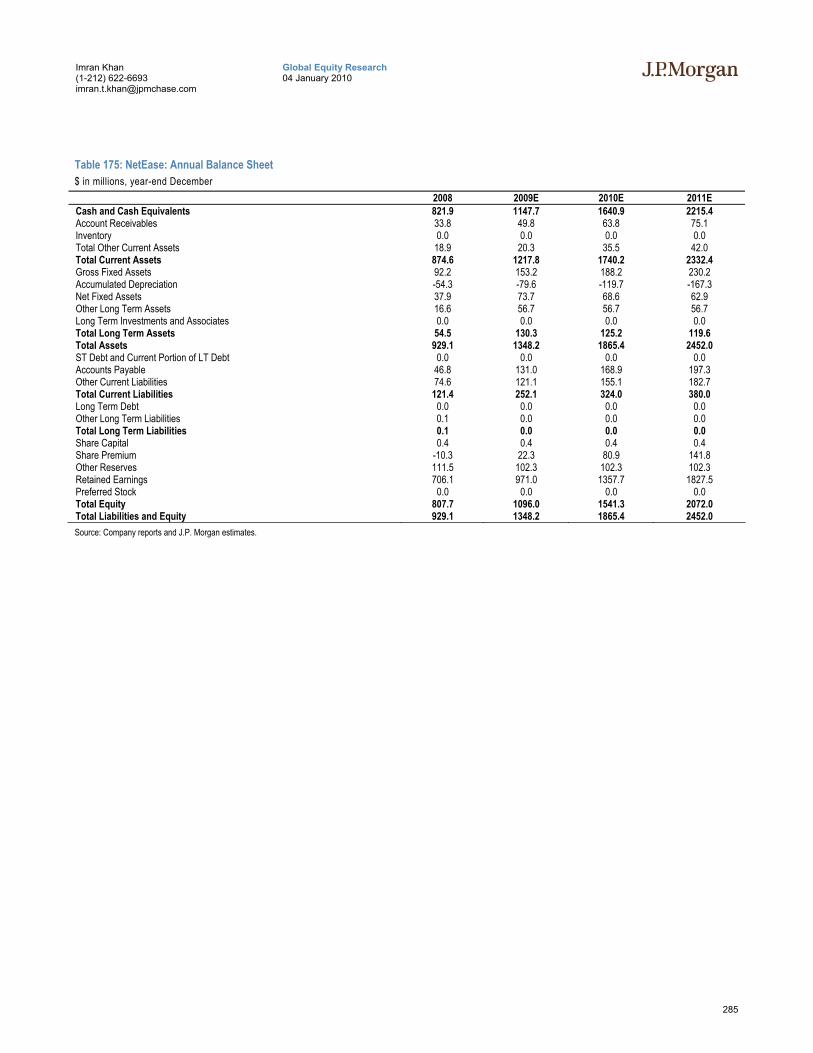
285
Global Equity Research 04 January 2010
Imran Khan (1-212) 622-6693 [email protected]
Table 175: NetEase: Annual Balance Sheet $ in millions, year-end December
2008 2009E 2010E 2011E Cash and Cash Equivalents 821.9 1147.7 1640.9 2215.4 Account Receivables 33.8 49.8 63.8 75.1 Inventory 0.0 0.0 0.0 0.0 Total Other Current Assets 18.9 20.3 35.5 42.0 Total Current Assets 874.6 1217.8 1740.2 2332.4 Gross Fixed Assets 92.2 153.2 188.2 230.2 Accumulated Depreciation -54.3 -79.6 -119.7 -167.3 Net Fixed Assets 37.9 73.7 68.6 62.9 Other Long Term Assets 16.6 56.7 56.7 56.7 Long Term Investments and Associates 0.0 0.0 0.0 0.0 Total Long Term Assets 54.5 130.3 125.2 119.6 Total Assets 929.1 1348.2 1865.4 2452.0 ST Debt and Current Portion of LT Debt 0.0 0.0 0.0 0.0 Accounts Payable 46.8 131.0 168.9 197.3 Other Current Liabilities 74.6 121.1 155.1 182.7 Total Current Liabilities 121.4 252.1 324.0 380.0 Long Term Debt 0.0 0.0 0.0 0.0 Other Long Term Liabilities 0.1 0.0 0.0 0.0 Total Long Term Liabilities 0.1 0.0 0.0 0.0 Share Capital 0.4 0.4 0.4 0.4 Share Premium -10.3 22.3 80.9 141.8 Other Reserves 111.5 102.3 102.3 102.3 Retained Earnings 706.1 971.0 1357.7 1827.5 Preferred Stock 0.0 0.0 0.0 0.0 Total Equity 807.7 1096.0 1541.3 2072.0 Total Liabilities and Equity 929.1 1348.2 1865.4 2452.0 Source: Company reports and J.P. Morgan estimates.
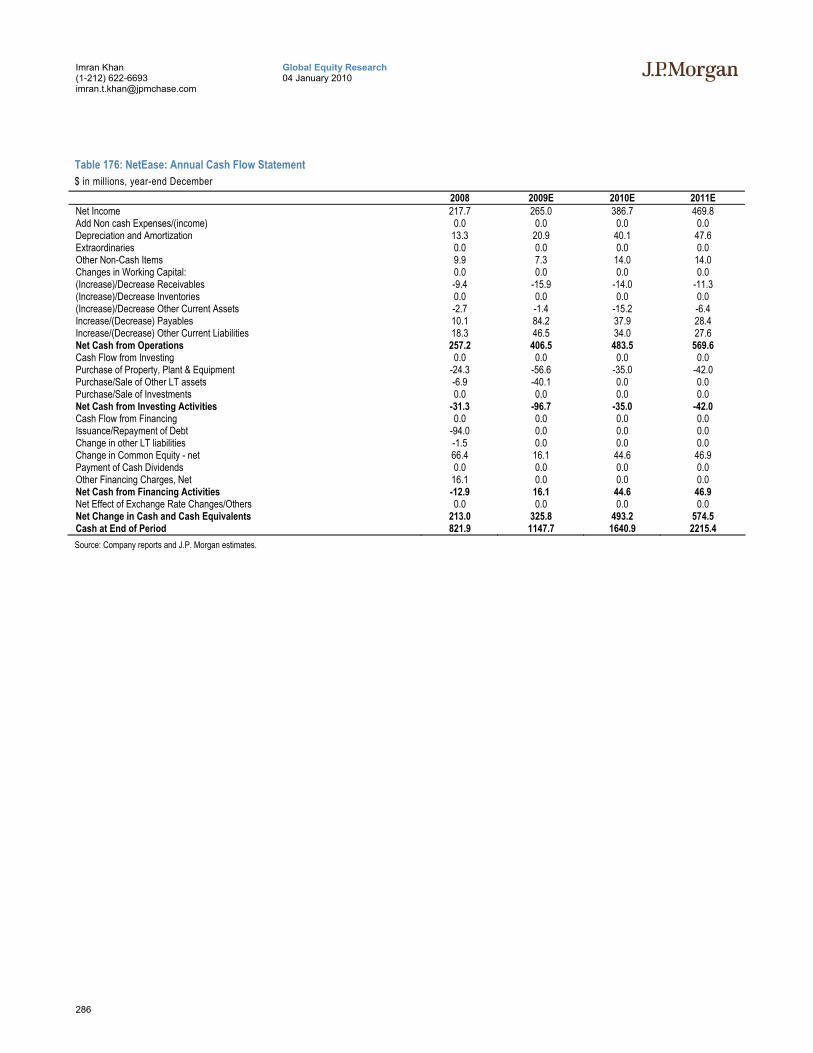
286
Global Equity Research 04 January 2010
Imran Khan (1-212) 622-6693 [email protected]
Table 176: NetEase: Annual Cash Flow Statement $ in millions, year-end December
2008 2009E 2010E 2011E Net Income 217.7 265.0 386.7 469.8 Add Non cash Expenses/(income) 0.0 0.0 0.0 0.0 Depreciation and Amortization 13.3 20.9 40.1 47.6 Extraordinaries 0.0 0.0 0.0 0.0 Other Non-Cash Items 9.9 7.3 14.0 14.0 Changes in Working Capital: 0.0 0.0 0.0 0.0 (Increase)/Decrease Receivables -9.4 -15.9 -14.0 -11.3 (Increase)/Decrease Inventories 0.0 0.0 0.0 0.0 (Increase)/Decrease Other Current Assets -2.7 -1.4 -15.2 -6.4 Increase/(Decrease) Payables 10.1 84.2 37.9 28.4 Increase/(Decrease) Other Current Liabilities 18.3 46.5 34.0 27.6 Net Cash from Operations 257.2 406.5 483.5 569.6 Cash Flow from Investing 0.0 0.0 0.0 0.0 Purchase of Property, Plant & Equipment -24.3 -56.6 -35.0 -42.0 Purchase/Sale of Other LT assets -6.9 -40.1 0.0 0.0 Purchase/Sale of Investments 0.0 0.0 0.0 0.0 Net Cash from Investing Activities -31.3 -96.7 -35.0 -42.0 Cash Flow from Financing 0.0 0.0 0.0 0.0 Issuance/Repayment of Debt -94.0 0.0 0.0 0.0 Change in other LT liabilities -1.5 0.0 0.0 0.0 Change in Common Equity - net 66.4 16.1 44.6 46.9 Payment of Cash Dividends 0.0 0.0 0.0 0.0 Other Financing Charges, Net 16.1 0.0 0.0 0.0 Net Cash from Financing Activities -12.9 16.1 44.6 46.9 Net Effect of Exchange Rate Changes/Others 0.0 0.0 0.0 0.0 Net Change in Cash and Cash Equivalents 213.0 325.8 493.2 574.5 Cash at End of Period 821.9 1147.7 1640.9 2215.4 Source: Company reports and J.P. Morgan estimates.

287
Global Equity Research 04 January 2010
Imran Khan (1-212) 622-6693 [email protected]
Ninetowns, Neutral, ($1.78) We remain Neutral on Ninetowns as the company’s core B2G (business-to-government) segment continue to face a tough business environment due to the continuing slowdown in the global trade sector. Its recently launched B2C (Business-to-consumer) is also yet to pickup scale. Our Dec-10 price target is US$1.7 which is based on our DCF valuation and is at a discount to current net cash per share of US$2.68 due to market concerns about potentially higher losses going forward, which are likely to keep the stock price under pressure.
• Ninetowns’ e-filings software sales have faced a tough business environment over the last couple of years due to a free alternative distributed by the government. In recent months, the ongoing export slowdown has adversely impacted Ninetowns’ SME client base for B2G offerings.
• Company launched e-grocery business in 1H09 under the brand of tootoo.cn. The organic food focused business-generated US$0.7MM of sales-now services with around 2,000 customers Beijing area. Ninetowns currently cooperate with two local Beijing farms, and has plans to expand to Shanghai. In our view, this business is yet to gain scale and will take some more quarters to have a meaningful impact on share price.
• After discontinuing the B2B business and other cost cutting initiatives, Ninetowns significantly reduced its operating expenses. However, the company still registers an operating loss. With the new investment in e-grocery business, NINE’s timing to achieve operational breakeven is still uncertain. NINE currently has around 500 employees, with 300 in e-grocery and 200 in B2G business.
• Overall, we believe a turnaround for the company is still not imminent, and the share price lacks positive drivers in the near term.
• Potential 2010 drivers: In our view, the following factors could drive the share price in 2010: (1) return to profitability (upside risk) or larger operating losses (downside risk) mainly related to the investments in e-grocery business; and (2) if Ninetowns were to become a potential acquisition or partnership prospect (due to its customer list of over 130,000 exporters and importers, and cheap valuation).
Our current 2010 estimates are presented in the table below:
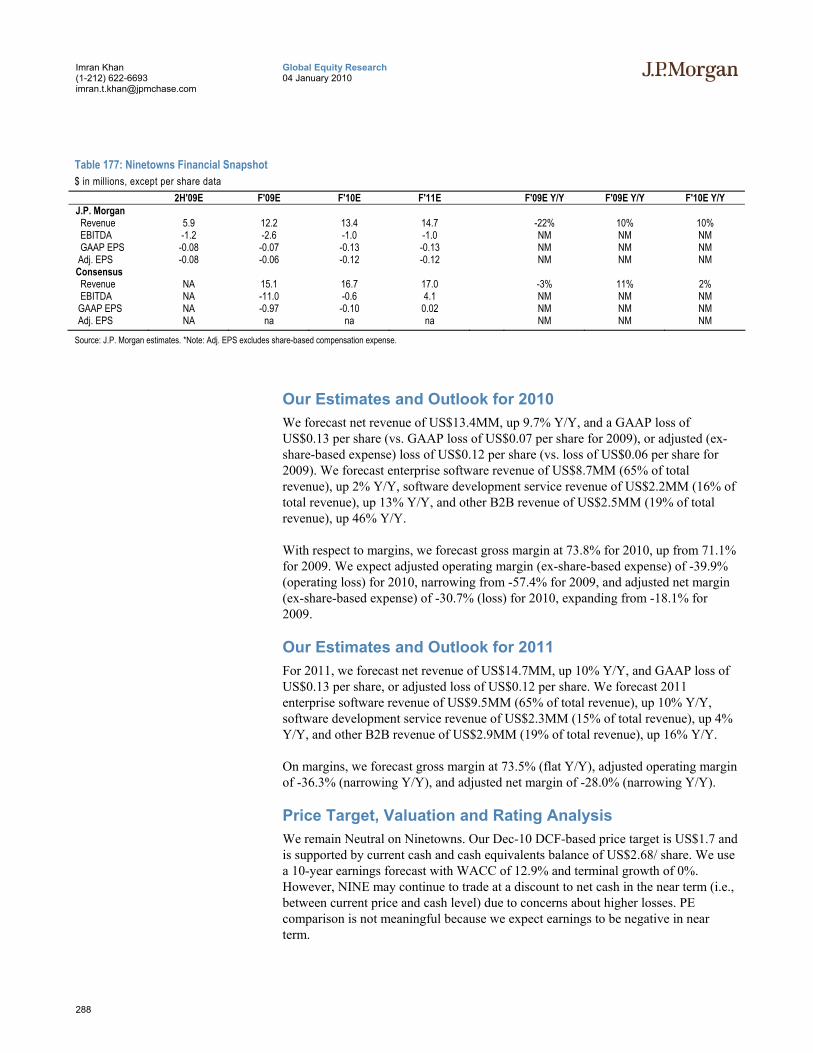
288
Global Equity Research 04 January 2010
Imran Khan (1-212) 622-6693 [email protected]
Table 177: Ninetowns Financial Snapshot $ in millions, except per share data 2H'09E F'09E F'10E F'11E F'09E Y/Y F'09E Y/Y F'10E Y/Y J.P. Morgan Revenue 5.9 12.2 13.4 14.7 -22% 10% 10% EBITDA -1.2 -2.6 -1.0 -1.0 NM NM NM GAAP EPS -0.08 -0.07 -0.13 -0.13 NM NM NM Adj. EPS -0.08 -0.06 -0.12 -0.12 NM NM NM Consensus Revenue NA 15.1 16.7 17.0 -3% 11% 2% EBITDA NA -11.0 -0.6 4.1 NM NM NM GAAP EPS NA -0.97 -0.10 0.02 NM NM NM Adj. EPS NA na na na NM NM NM
Source: J.P. Morgan estimates. *Note: Adj. EPS excludes share-based compensation expense.
Our Estimates and Outlook for 2010 We forecast net revenue of US$13.4MM, up 9.7% Y/Y, and a GAAP loss of US$0.13 per share (vs. GAAP loss of US$0.07 per share for 2009), or adjusted (ex-share-based expense) loss of US$0.12 per share (vs. loss of US$0.06 per share for 2009). We forecast enterprise software revenue of US$8.7MM (65% of total revenue), up 2% Y/Y, software development service revenue of US$2.2MM (16% of total revenue), up 13% Y/Y, and other B2B revenue of US$2.5MM (19% of total revenue), up 46% Y/Y.
With respect to margins, we forecast gross margin at 73.8% for 2010, up from 71.1% for 2009. We expect adjusted operating margin (ex-share-based expense) of -39.9% (operating loss) for 2010, narrowing from -57.4% for 2009, and adjusted net margin (ex-share-based expense) of -30.7% (loss) for 2010, expanding from -18.1% for 2009.
Our Estimates and Outlook for 2011 For 2011, we forecast net revenue of US$14.7MM, up 10% Y/Y, and GAAP loss of US$0.13 per share, or adjusted loss of US$0.12 per share. We forecast 2011 enterprise software revenue of US$9.5MM (65% of total revenue), up 10% Y/Y, software development service revenue of US$2.3MM (15% of total revenue), up 4% Y/Y, and other B2B revenue of US$2.9MM (19% of total revenue), up 16% Y/Y.
On margins, we forecast gross margin at 73.5% (flat Y/Y), adjusted operating margin of -36.3% (narrowing Y/Y), and adjusted net margin of -28.0% (narrowing Y/Y).
Price Target, Valuation and Rating Analysis We remain Neutral on Ninetowns. Our Dec-10 DCF-based price target is US$1.7 and is supported by current cash and cash equivalents balance of US$2.68/ share. We use a 10-year earnings forecast with WACC of 12.9% and terminal growth of 0%. However, NINE may continue to trade at a discount to net cash in the near term (i.e., between current price and cash level) due to concerns about higher losses. PE comparison is not meaningful because we expect earnings to be negative in near term.
289
Global Equity Research 04 January 2010
Imran Khan (1-212) 622-6693 [email protected]
Risks to Our Rating and Price Target Upside risks to our rating and price target include: 1) Ninetowns owns a database of more than 141k China exporters. We believe this database is a valuable asset. Any potential acquirer or business partner can further monetize this list of exporter through other services and products. (Currently, Ninetowns only offer government e-filing services to these customers); 2) higher-than-expected monetization from the new e-grocery segment; 3) significant conversions of free e-filing software users to NINE’s paid software / service contracts. While downside risks include: 1) further decline in existing core revenue base; 2) larger-than-expected investments in the e-grocery business; 3) disruption in NINE’s good working relationship with the PRC Inspections Administration.
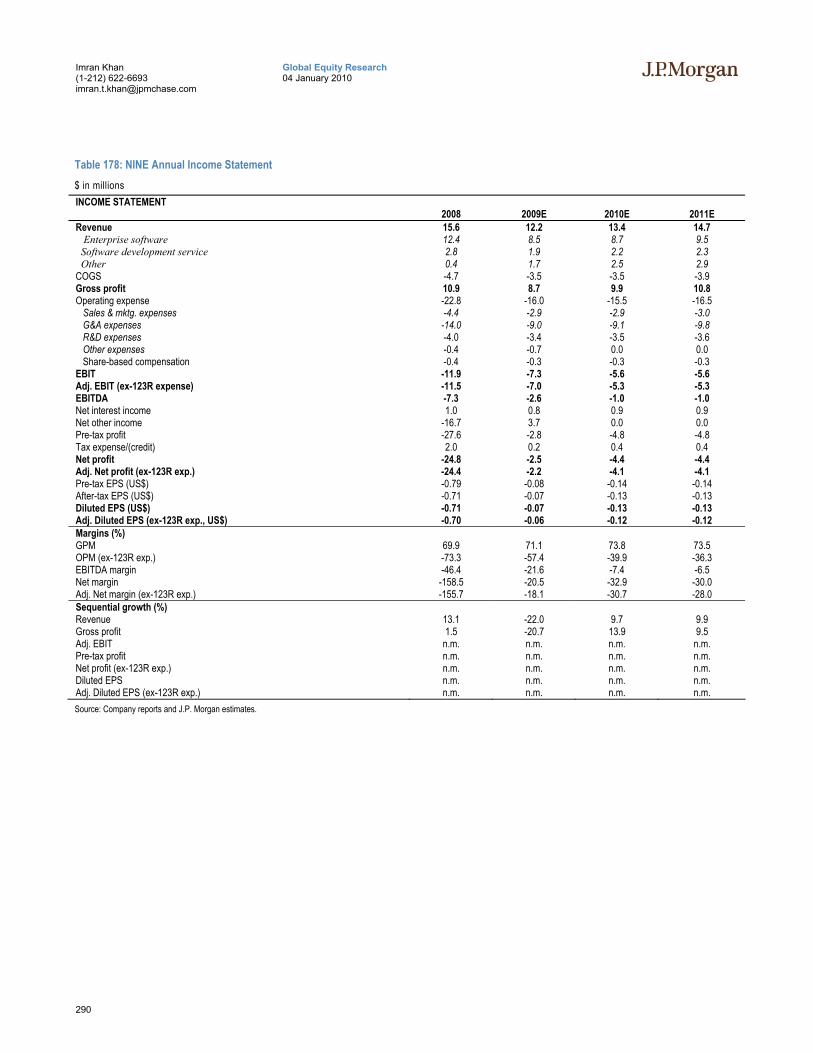
290
Global Equity Research 04 January 2010
Imran Khan (1-212) 622-6693 [email protected]
Table 178: NINE Annual Income Statement $ in millions INCOME STATEMENT
2008 2009E 2010E 2011E Revenue 15.6 12.2 13.4 14.7 Enterprise software 12.4 8.5 8.7 9.5 Software development service 2.8 1.9 2.2 2.3 Other 0.4 1.7 2.5 2.9 COGS -4.7 -3.5 -3.5 -3.9 Gross profit 10.9 8.7 9.9 10.8 Operating expense -22.8 -16.0 -15.5 -16.5 Sales & mktg. expenses -4.4 -2.9 -2.9 -3.0 G&A expenses -14.0 -9.0 -9.1 -9.8 R&D expenses -4.0 -3.4 -3.5 -3.6 Other expenses -0.4 -0.7 0.0 0.0 Share-based compensation -0.4 -0.3 -0.3 -0.3 EBIT -11.9 -7.3 -5.6 -5.6 Adj. EBIT (ex-123R expense) -11.5 -7.0 -5.3 -5.3 EBITDA -7.3 -2.6 -1.0 -1.0 Net interest income 1.0 0.8 0.9 0.9 Net other income -16.7 3.7 0.0 0.0 Pre-tax profit -27.6 -2.8 -4.8 -4.8 Tax expense/(credit) 2.0 0.2 0.4 0.4 Net profit -24.8 -2.5 -4.4 -4.4 Adj. Net profit (ex-123R exp.) -24.4 -2.2 -4.1 -4.1 Pre-tax EPS (US$) -0.79 -0.08 -0.14 -0.14 After-tax EPS (US$) -0.71 -0.07 -0.13 -0.13 Diluted EPS (US$) -0.71 -0.07 -0.13 -0.13 Adj. Diluted EPS (ex-123R exp., US$) -0.70 -0.06 -0.12 -0.12 Margins (%) GPM 69.9 71.1 73.8 73.5 OPM (ex-123R exp.) -73.3 -57.4 -39.9 -36.3 EBITDA margin -46.4 -21.6 -7.4 -6.5 Net margin -158.5 -20.5 -32.9 -30.0 Adj. Net margin (ex-123R exp.) -155.7 -18.1 -30.7 -28.0 Sequential growth (%) Revenue 13.1 -22.0 9.7 9.9 Gross profit 1.5 -20.7 13.9 9.5 Adj. EBIT n.m. n.m. n.m. n.m. Pre-tax profit n.m. n.m. n.m. n.m. Net profit (ex-123R exp.) n.m. n.m. n.m. n.m. Diluted EPS n.m. n.m. n.m. n.m. Adj. Diluted EPS (ex-123R exp.) n.m. n.m. n.m. n.m. Source: Company reports and J.P. Morgan estimates.
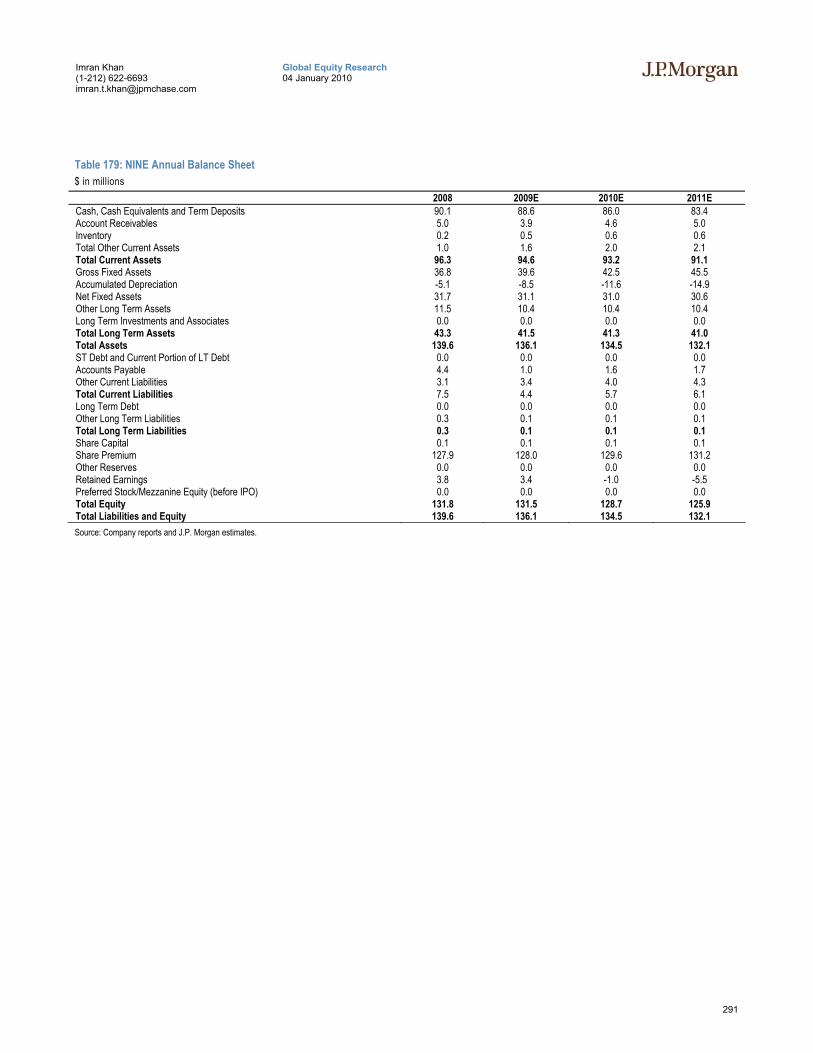
291
Global Equity Research 04 January 2010
Imran Khan (1-212) 622-6693 [email protected]
Table 179: NINE Annual Balance Sheet $ in millions
2008 2009E 2010E 2011E Cash, Cash Equivalents and Term Deposits 90.1 88.6 86.0 83.4 Account Receivables 5.0 3.9 4.6 5.0 Inventory 0.2 0.5 0.6 0.6 Total Other Current Assets 1.0 1.6 2.0 2.1 Total Current Assets 96.3 94.6 93.2 91.1 Gross Fixed Assets 36.8 39.6 42.5 45.5 Accumulated Depreciation -5.1 -8.5 -11.6 -14.9 Net Fixed Assets 31.7 31.1 31.0 30.6 Other Long Term Assets 11.5 10.4 10.4 10.4 Long Term Investments and Associates 0.0 0.0 0.0 0.0 Total Long Term Assets 43.3 41.5 41.3 41.0 Total Assets 139.6 136.1 134.5 132.1 ST Debt and Current Portion of LT Debt 0.0 0.0 0.0 0.0 Accounts Payable 4.4 1.0 1.6 1.7 Other Current Liabilities 3.1 3.4 4.0 4.3 Total Current Liabilities 7.5 4.4 5.7 6.1 Long Term Debt 0.0 0.0 0.0 0.0 Other Long Term Liabilities 0.3 0.1 0.1 0.1 Total Long Term Liabilities 0.3 0.1 0.1 0.1 Share Capital 0.1 0.1 0.1 0.1 Share Premium 127.9 128.0 129.6 131.2 Other Reserves 0.0 0.0 0.0 0.0 Retained Earnings 3.8 3.4 -1.0 -5.5 Preferred Stock/Mezzanine Equity (before IPO) 0.0 0.0 0.0 0.0 Total Equity 131.8 131.5 128.7 125.9 Total Liabilities and Equity 139.6 136.1 134.5 132.1 Source: Company reports and J.P. Morgan estimates.
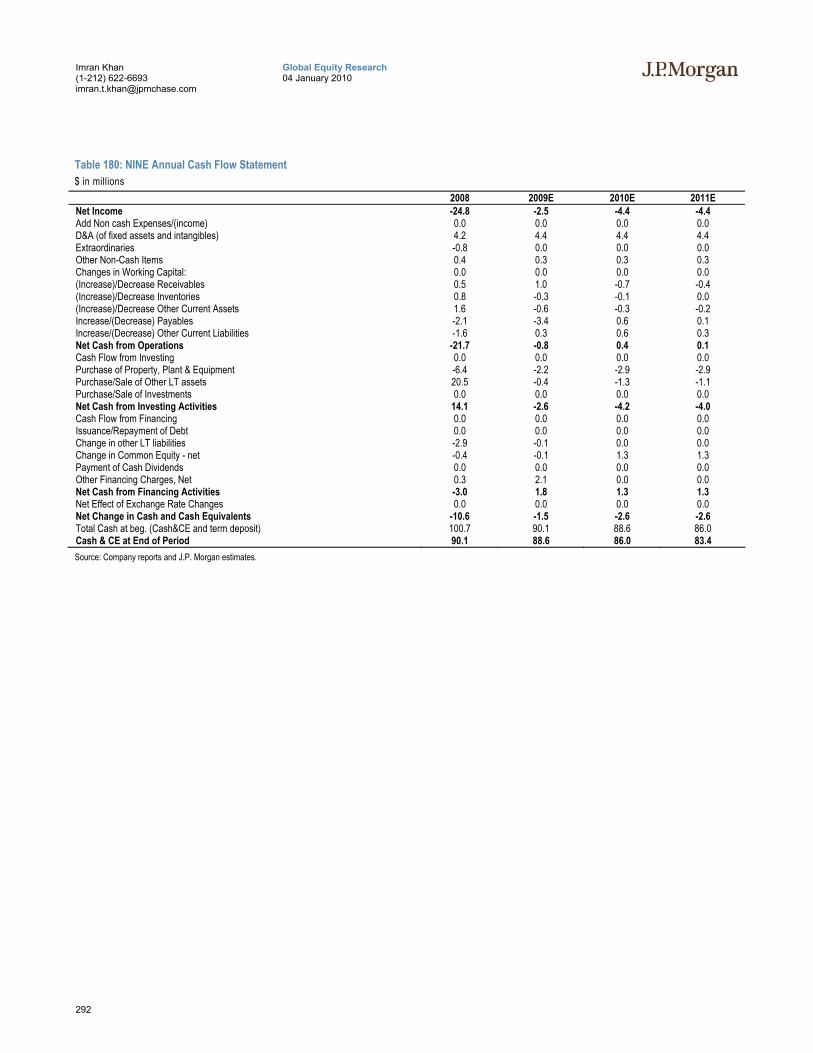
292
Global Equity Research 04 January 2010
Imran Khan (1-212) 622-6693 [email protected]
Table 180: NINE Annual Cash Flow Statement $ in millions
2008 2009E 2010E 2011E Net Income -24.8 -2.5 -4.4 -4.4 Add Non cash Expenses/(income) 0.0 0.0 0.0 0.0 D&A (of fixed assets and intangibles) 4.2 4.4 4.4 4.4 Extraordinaries -0.8 0.0 0.0 0.0 Other Non-Cash Items 0.4 0.3 0.3 0.3 Changes in Working Capital: 0.0 0.0 0.0 0.0 (Increase)/Decrease Receivables 0.5 1.0 -0.7 -0.4 (Increase)/Decrease Inventories 0.8 -0.3 -0.1 0.0 (Increase)/Decrease Other Current Assets 1.6 -0.6 -0.3 -0.2 Increase/(Decrease) Payables -2.1 -3.4 0.6 0.1 Increase/(Decrease) Other Current Liabilities -1.6 0.3 0.6 0.3 Net Cash from Operations -21.7 -0.8 0.4 0.1 Cash Flow from Investing 0.0 0.0 0.0 0.0 Purchase of Property, Plant & Equipment -6.4 -2.2 -2.9 -2.9 Purchase/Sale of Other LT assets 20.5 -0.4 -1.3 -1.1 Purchase/Sale of Investments 0.0 0.0 0.0 0.0 Net Cash from Investing Activities 14.1 -2.6 -4.2 -4.0 Cash Flow from Financing 0.0 0.0 0.0 0.0 Issuance/Repayment of Debt 0.0 0.0 0.0 0.0 Change in other LT liabilities -2.9 -0.1 0.0 0.0 Change in Common Equity - net -0.4 -0.1 1.3 1.3 Payment of Cash Dividends 0.0 0.0 0.0 0.0 Other Financing Charges, Net 0.3 2.1 0.0 0.0 Net Cash from Financing Activities -3.0 1.8 1.3 1.3 Net Effect of Exchange Rate Changes 0.0 0.0 0.0 0.0 Net Change in Cash and Cash Equivalents -10.6 -1.5 -2.6 -2.6 Total Cash at beg. (Cash&CE and term deposit) 100.7 90.1 88.6 86.0 Cash & CE at End of Period 90.1 88.6 86.0 83.4 Source: Company reports and J.P. Morgan estimates.
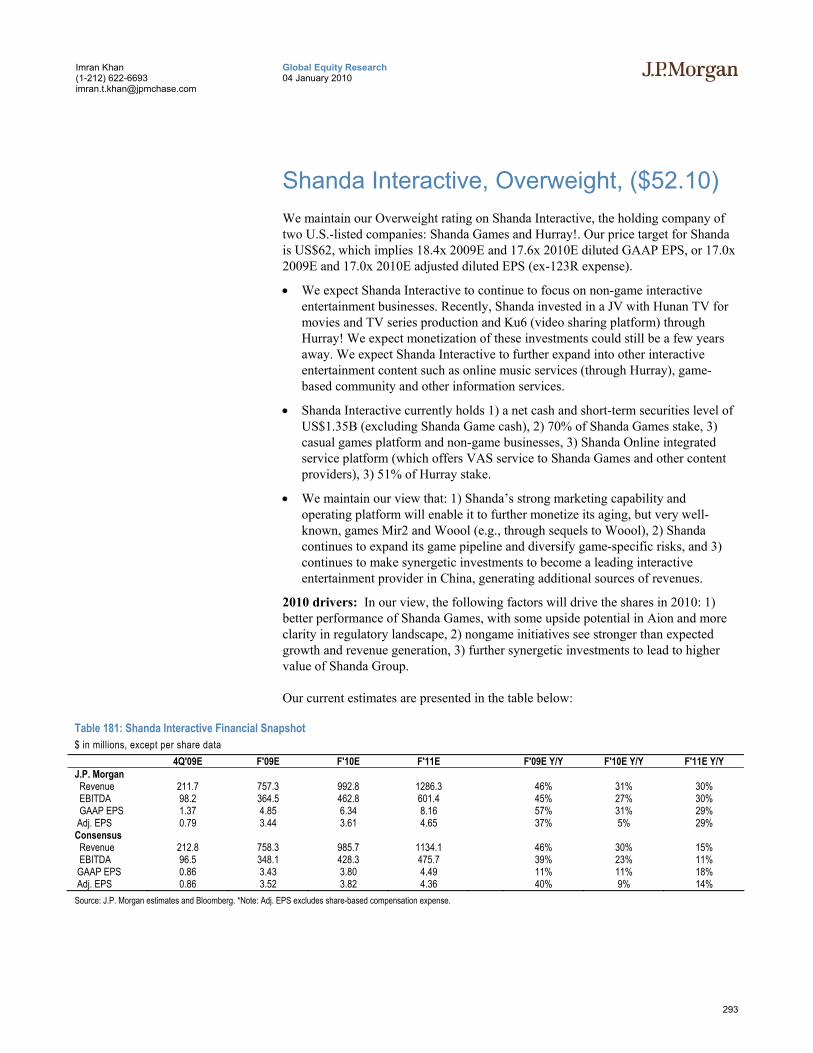
293
Global Equity Research 04 January 2010
Imran Khan (1-212) 622-6693 [email protected]
Shanda Interactive, Overweight, ($52.10) We maintain our Overweight rating on Shanda Interactive, the holding company of two U.S.-listed companies: Shanda Games and Hurray!. Our price target for Shanda is US$62, which implies 18.4x 2009E and 17.6x 2010E diluted GAAP EPS, or 17.0x 2009E and 17.0x 2010E adjusted diluted EPS (ex-123R expense).
• We expect Shanda Interactive to continue to focus on non-game interactive entertainment businesses. Recently, Shanda invested in a JV with Hunan TV for movies and TV series production and Ku6 (video sharing platform) through Hurray! We expect monetization of these investments could still be a few years away. We expect Shanda Interactive to further expand into other interactive entertainment content such as online music services (through Hurray), game-based community and other information services.
• Shanda Interactive currently holds 1) a net cash and short-term securities level of US$1.35B (excluding Shanda Game cash), 2) 70% of Shanda Games stake, 3) casual games platform and non-game businesses, 3) Shanda Online integrated service platform (which offers VAS service to Shanda Games and other content providers), 3) 51% of Hurray stake.
• We maintain our view that: 1) Shanda’s strong marketing capability and operating platform will enable it to further monetize its aging, but very well-known, games Mir2 and Woool (e.g., through sequels to Woool), 2) Shanda continues to expand its game pipeline and diversify game-specific risks, and 3) continues to make synergetic investments to become a leading interactive entertainment provider in China, generating additional sources of revenues.
2010 drivers: In our view, the following factors will drive the shares in 2010: 1) better performance of Shanda Games, with some upside potential in Aion and more clarity in regulatory landscape, 2) nongame initiatives see stronger than expected growth and revenue generation, 3) further synergetic investments to lead to higher value of Shanda Group.
Our current estimates are presented in the table below:
Table 181: Shanda Interactive Financial Snapshot $ in millions, except per share data 4Q'09E F'09E F'10E F'11E F'09E Y/Y F'10E Y/Y F'11E Y/Y J.P. Morgan Revenue 211.7 757.3 992.8 1286.3 46% 31% 30% EBITDA 98.2 364.5 462.8 601.4 45% 27% 30% GAAP EPS 1.37 4.85 6.34 8.16 57% 31% 29% Adj. EPS 0.79 3.44 3.61 4.65 37% 5% 29% Consensus Revenue 212.8 758.3 985.7 1134.1 46% 30% 15% EBITDA 96.5 348.1 428.3 475.7 39% 23% 11% GAAP EPS 0.86 3.43 3.80 4.49 11% 11% 18% Adj. EPS 0.86 3.52 3.82 4.36 40% 9% 14% Source: J.P. Morgan estimates and Bloomberg. *Note: Adj. EPS excludes share-based compensation expense.
294
Global Equity Research 04 January 2010
Imran Khan (1-212) 622-6693 [email protected]
Our Estimates and Outlook for 2010 We forecast net revenue of US$992.8MM in 2010, up 31% Y/Y, and GAAP diluted EPS of US$3.51, up 25% Y/Y, or adjusted EPS (ex-share-based expense) of US$3.64, up 26% Y/Y. We forecast Shanda games revenue of US$924.4MM in 2010 (93% of total revenue), up 31% Y/Y, and revenues from non-game operations of US$68.4MM (7% of total revenue), up 28% Y/Y.
We forecast gross margin at 70.6% for 2010, slightly lower than 71.7% for 2009, adjusted operating margin (ex-share-based expense) of 40.7% for 2010, slightly lower than 42.4% for 2009, and adjusted net margin of 25.6% for 2010, down from 33.3% for 2009.
Our Estimates and Outlook for 2011 For 2011, we forecast net revenue of US$1286.3MM, up 30% Y/Y, and GAAP diluted EPS of US$4.51, up 28.3% Y/Y, or adjusted EPS of US$4.63, up 27.3% Y/Y. We forecast Shanda games revenue of US$1204.1MM in 2010 (94% of total revenue), up 30% Y/Y, and non-game revenues of US$82.2MM (6% of total revenue), up 20% Y/Y. On margins, we forecast gross margin at 69.9% (stable Y/Y); adjusted operating margin of 40.8% (stable Y/Y) and adjusted net margin of 25.4% (also stable Y/Y).
Price Target, Valuation and Rating Analysis We maintain our Overweight rating on Shanda with Dec-10 PT of US$62. Our Dec-10 is based on SOTP valuation for: 1) Shanda Games holdings of US$2.34B (at Shanda GAME PT of US$14.5 and take a 20% liquidity discount), 2) Shanda Online, Shanda Literature and other new initiatives of US$ 574M, and 3) net cash of US$1.35B. PT implies 17.3x 2010E and 13.6 2011Ex adjusted diluted P/E. Excluding net cash, PT implies 13.6x and 10.62x ’10E and ’11E adj. dil. P/E. We expect share price drivers to be better-than-expected non-game revenue growth and further investment that creates synergy with Shanda platform.
Risks to Our Rating and Price Target Upside risks include: 1) New games such as Aion attracting greater-than-expected user traction; 2) better-than-expected casual game revenue growth; and 3) new revenues from other non-game contents. On the other hand, downside risks include: 1) Existing games seeing a significant decline from lack of new content or promotion; 2) new big titles MMORPG seeing lower-than-expected gamer interest; and 3) new investment fails to generate expected value.
.
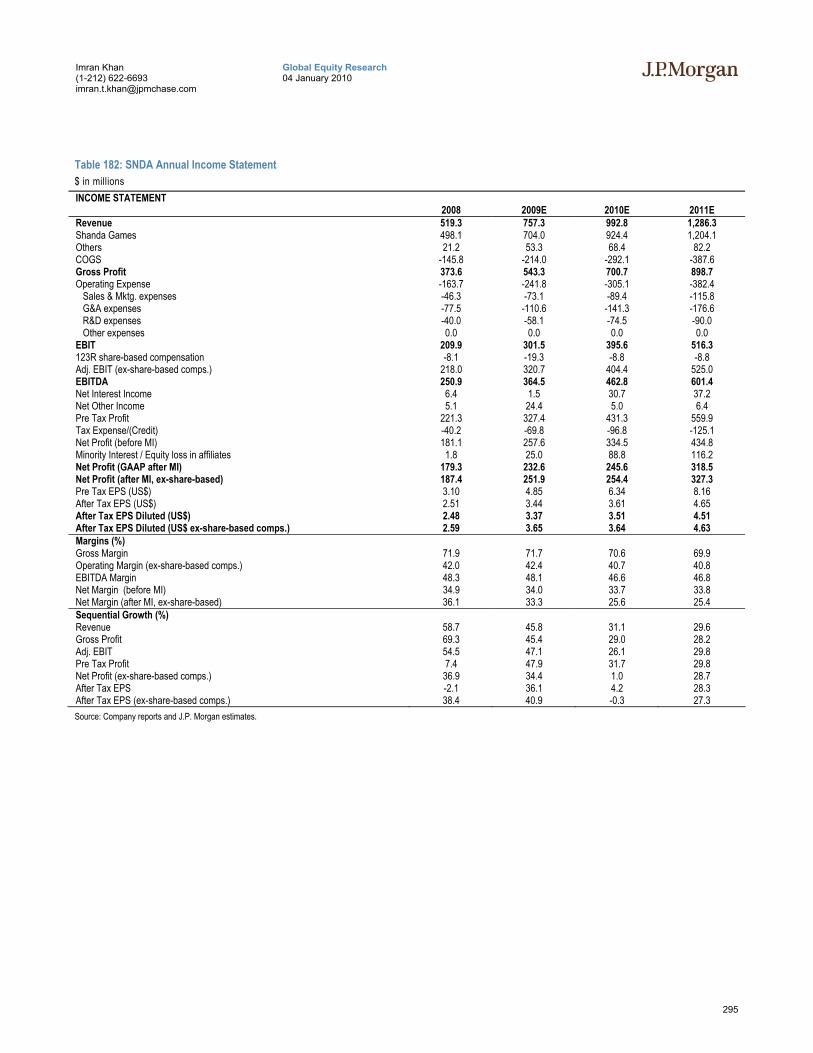
295
Global Equity Research 04 January 2010
Imran Khan (1-212) 622-6693 [email protected]
Table 182: SNDA Annual Income Statement $ in millions INCOME STATEMENT 2008 2009E 2010E 2011E Revenue 519.3 757.3 992.8 1,286.3 Shanda Games 498.1 704.0 924.4 1,204.1 Others 21.2 53.3 68.4 82.2 COGS -145.8 -214.0 -292.1 -387.6 Gross Profit 373.6 543.3 700.7 898.7 Operating Expense -163.7 -241.8 -305.1 -382.4 Sales & Mktg. expenses -46.3 -73.1 -89.4 -115.8 G&A expenses -77.5 -110.6 -141.3 -176.6 R&D expenses -40.0 -58.1 -74.5 -90.0 Other expenses 0.0 0.0 0.0 0.0 EBIT 209.9 301.5 395.6 516.3 123R share-based compensation -8.1 -19.3 -8.8 -8.8 Adj. EBIT (ex-share-based comps.) 218.0 320.7 404.4 525.0 EBITDA 250.9 364.5 462.8 601.4 Net Interest Income 6.4 1.5 30.7 37.2 Net Other Income 5.1 24.4 5.0 6.4 Pre Tax Profit 221.3 327.4 431.3 559.9 Tax Expense/(Credit) -40.2 -69.8 -96.8 -125.1 Net Profit (before MI) 181.1 257.6 334.5 434.8 Minority Interest / Equity loss in affiliates 1.8 25.0 88.8 116.2 Net Profit (GAAP after MI) 179.3 232.6 245.6 318.5 Net Profit (after MI, ex-share-based) 187.4 251.9 254.4 327.3 Pre Tax EPS (US$) 3.10 4.85 6.34 8.16 After Tax EPS (US$) 2.51 3.44 3.61 4.65 After Tax EPS Diluted (US$) 2.48 3.37 3.51 4.51 After Tax EPS Diluted (US$ ex-share-based comps.) 2.59 3.65 3.64 4.63 Margins (%) Gross Margin 71.9 71.7 70.6 69.9 Operating Margin (ex-share-based comps.) 42.0 42.4 40.7 40.8 EBITDA Margin 48.3 48.1 46.6 46.8 Net Margin (before MI) 34.9 34.0 33.7 33.8 Net Margin (after MI, ex-share-based) 36.1 33.3 25.6 25.4 Sequential Growth (%) Revenue 58.7 45.8 31.1 29.6 Gross Profit 69.3 45.4 29.0 28.2 Adj. EBIT 54.5 47.1 26.1 29.8 Pre Tax Profit 7.4 47.9 31.7 29.8 Net Profit (ex-share-based comps.) 36.9 34.4 1.0 28.7 After Tax EPS -2.1 36.1 4.2 28.3 After Tax EPS (ex-share-based comps.) 38.4 40.9 -0.3 27.3 Source: Company reports and J.P. Morgan estimates.
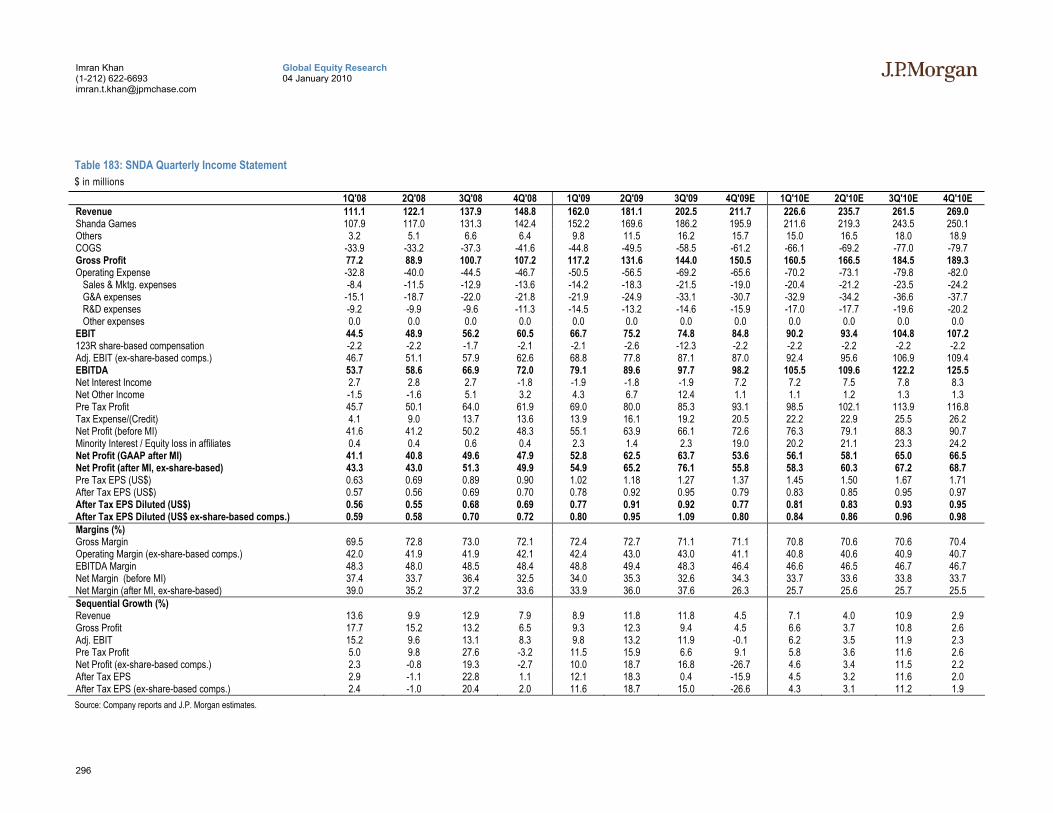
296
Global Equity Research 04 January 2010
Imran Khan (1-212) 622-6693 [email protected]
Table 183: SNDA Quarterly Income Statement $ in millions
1Q'08 2Q'08 3Q'08 4Q'08 1Q'09 2Q'09 3Q'09 4Q'09E 1Q'10E 2Q'10E 3Q'10E 4Q'10E Revenue 111.1 122.1 137.9 148.8 162.0 181.1 202.5 211.7 226.6 235.7 261.5 269.0 Shanda Games 107.9 117.0 131.3 142.4 152.2 169.6 186.2 195.9 211.6 219.3 243.5 250.1 Others 3.2 5.1 6.6 6.4 9.8 11.5 16.2 15.7 15.0 16.5 18.0 18.9 COGS -33.9 -33.2 -37.3 -41.6 -44.8 -49.5 -58.5 -61.2 -66.1 -69.2 -77.0 -79.7 Gross Profit 77.2 88.9 100.7 107.2 117.2 131.6 144.0 150.5 160.5 166.5 184.5 189.3 Operating Expense -32.8 -40.0 -44.5 -46.7 -50.5 -56.5 -69.2 -65.6 -70.2 -73.1 -79.8 -82.0 Sales & Mktg. expenses -8.4 -11.5 -12.9 -13.6 -14.2 -18.3 -21.5 -19.0 -20.4 -21.2 -23.5 -24.2 G&A expenses -15.1 -18.7 -22.0 -21.8 -21.9 -24.9 -33.1 -30.7 -32.9 -34.2 -36.6 -37.7 R&D expenses -9.2 -9.9 -9.6 -11.3 -14.5 -13.2 -14.6 -15.9 -17.0 -17.7 -19.6 -20.2 Other expenses 0.0 0.0 0.0 0.0 0.0 0.0 0.0 0.0 0.0 0.0 0.0 0.0 EBIT 44.5 48.9 56.2 60.5 66.7 75.2 74.8 84.8 90.2 93.4 104.8 107.2 123R share-based compensation -2.2 -2.2 -1.7 -2.1 -2.1 -2.6 -12.3 -2.2 -2.2 -2.2 -2.2 -2.2 Adj. EBIT (ex-share-based comps.) 46.7 51.1 57.9 62.6 68.8 77.8 87.1 87.0 92.4 95.6 106.9 109.4 EBITDA 53.7 58.6 66.9 72.0 79.1 89.6 97.7 98.2 105.5 109.6 122.2 125.5 Net Interest Income 2.7 2.8 2.7 -1.8 -1.9 -1.8 -1.9 7.2 7.2 7.5 7.8 8.3 Net Other Income -1.5 -1.6 5.1 3.2 4.3 6.7 12.4 1.1 1.1 1.2 1.3 1.3 Pre Tax Profit 45.7 50.1 64.0 61.9 69.0 80.0 85.3 93.1 98.5 102.1 113.9 116.8 Tax Expense/(Credit) 4.1 9.0 13.7 13.6 13.9 16.1 19.2 20.5 22.2 22.9 25.5 26.2 Net Profit (before MI) 41.6 41.2 50.2 48.3 55.1 63.9 66.1 72.6 76.3 79.1 88.3 90.7 Minority Interest / Equity loss in affiliates 0.4 0.4 0.6 0.4 2.3 1.4 2.3 19.0 20.2 21.1 23.3 24.2 Net Profit (GAAP after MI) 41.1 40.8 49.6 47.9 52.8 62.5 63.7 53.6 56.1 58.1 65.0 66.5 Net Profit (after MI, ex-share-based) 43.3 43.0 51.3 49.9 54.9 65.2 76.1 55.8 58.3 60.3 67.2 68.7 Pre Tax EPS (US$) 0.63 0.69 0.89 0.90 1.02 1.18 1.27 1.37 1.45 1.50 1.67 1.71 After Tax EPS (US$) 0.57 0.56 0.69 0.70 0.78 0.92 0.95 0.79 0.83 0.85 0.95 0.97 After Tax EPS Diluted (US$) 0.56 0.55 0.68 0.69 0.77 0.91 0.92 0.77 0.81 0.83 0.93 0.95 After Tax EPS Diluted (US$ ex-share-based comps.) 0.59 0.58 0.70 0.72 0.80 0.95 1.09 0.80 0.84 0.86 0.96 0.98 Margins (%) Gross Margin 69.5 72.8 73.0 72.1 72.4 72.7 71.1 71.1 70.8 70.6 70.6 70.4 Operating Margin (ex-share-based comps.) 42.0 41.9 41.9 42.1 42.4 43.0 43.0 41.1 40.8 40.6 40.9 40.7 EBITDA Margin 48.3 48.0 48.5 48.4 48.8 49.4 48.3 46.4 46.6 46.5 46.7 46.7 Net Margin (before MI) 37.4 33.7 36.4 32.5 34.0 35.3 32.6 34.3 33.7 33.6 33.8 33.7 Net Margin (after MI, ex-share-based) 39.0 35.2 37.2 33.6 33.9 36.0 37.6 26.3 25.7 25.6 25.7 25.5 Sequential Growth (%) Revenue 13.6 9.9 12.9 7.9 8.9 11.8 11.8 4.5 7.1 4.0 10.9 2.9 Gross Profit 17.7 15.2 13.2 6.5 9.3 12.3 9.4 4.5 6.6 3.7 10.8 2.6 Adj. EBIT 15.2 9.6 13.1 8.3 9.8 13.2 11.9 -0.1 6.2 3.5 11.9 2.3 Pre Tax Profit 5.0 9.8 27.6 -3.2 11.5 15.9 6.6 9.1 5.8 3.6 11.6 2.6 Net Profit (ex-share-based comps.) 2.3 -0.8 19.3 -2.7 10.0 18.7 16.8 -26.7 4.6 3.4 11.5 2.2 After Tax EPS 2.9 -1.1 22.8 1.1 12.1 18.3 0.4 -15.9 4.5 3.2 11.6 2.0 After Tax EPS (ex-share-based comps.) 2.4 -1.0 20.4 2.0 11.6 18.7 15.0 -26.6 4.3 3.1 11.2 1.9 Source: Company reports and J.P. Morgan estimates.
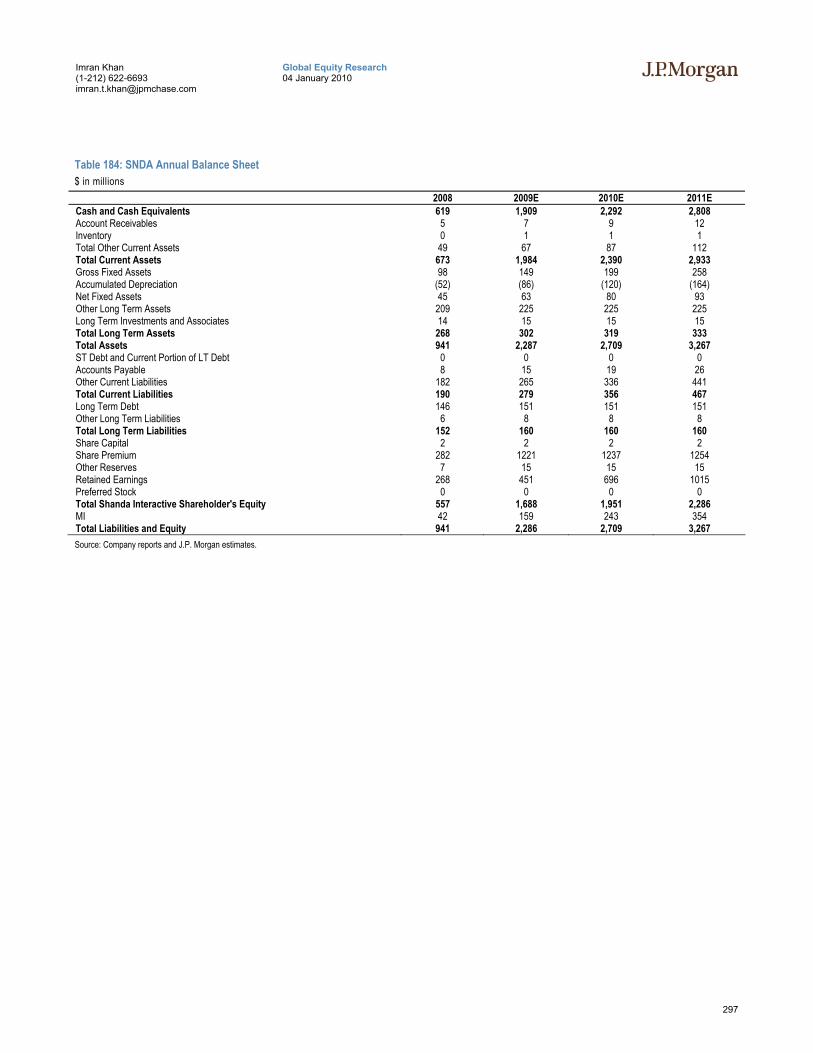
297
Global Equity Research 04 January 2010
Imran Khan (1-212) 622-6693 [email protected]
Table 184: SNDA Annual Balance Sheet $ in millions
2008 2009E 2010E 2011E Cash and Cash Equivalents 619 1,909 2,292 2,808 Account Receivables 5 7 9 12 Inventory 0 1 1 1 Total Other Current Assets 49 67 87 112 Total Current Assets 673 1,984 2,390 2,933 Gross Fixed Assets 98 149 199 258 Accumulated Depreciation (52) (86) (120) (164) Net Fixed Assets 45 63 80 93 Other Long Term Assets 209 225 225 225 Long Term Investments and Associates 14 15 15 15 Total Long Term Assets 268 302 319 333 Total Assets 941 2,287 2,709 3,267 ST Debt and Current Portion of LT Debt 0 0 0 0 Accounts Payable 8 15 19 26 Other Current Liabilities 182 265 336 441 Total Current Liabilities 190 279 356 467 Long Term Debt 146 151 151 151 Other Long Term Liabilities 6 8 8 8 Total Long Term Liabilities 152 160 160 160 Share Capital 2 2 2 2 Share Premium 282 1221 1237 1254 Other Reserves 7 15 15 15 Retained Earnings 268 451 696 1015 Preferred Stock 0 0 0 0 Total Shanda Interactive Shareholder's Equity 557 1,688 1,951 2,286 MI 42 159 243 354 Total Liabilities and Equity 941 2,286 2,709 3,267 Source: Company reports and J.P. Morgan estimates.
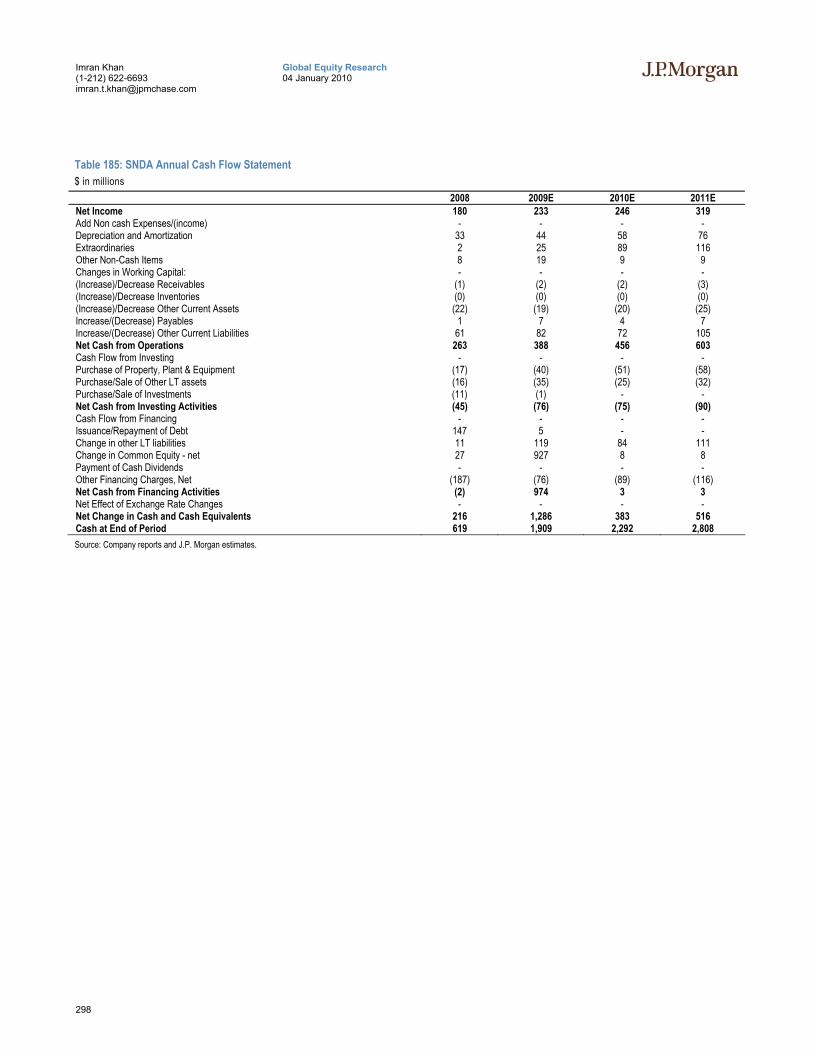
298
Global Equity Research 04 January 2010
Imran Khan (1-212) 622-6693 [email protected]
Table 185: SNDA Annual Cash Flow Statement $ in millions
2008 2009E 2010E 2011E Net Income 180 233 246 319 Add Non cash Expenses/(income) - - - - Depreciation and Amortization 33 44 58 76 Extraordinaries 2 25 89 116 Other Non-Cash Items 8 19 9 9 Changes in Working Capital: - - - - (Increase)/Decrease Receivables (1) (2) (2) (3) (Increase)/Decrease Inventories (0) (0) (0) (0) (Increase)/Decrease Other Current Assets (22) (19) (20) (25) Increase/(Decrease) Payables 1 7 4 7 Increase/(Decrease) Other Current Liabilities 61 82 72 105 Net Cash from Operations 263 388 456 603 Cash Flow from Investing - - - - Purchase of Property, Plant & Equipment (17) (40) (51) (58) Purchase/Sale of Other LT assets (16) (35) (25) (32) Purchase/Sale of Investments (11) (1) - - Net Cash from Investing Activities (45) (76) (75) (90) Cash Flow from Financing - - - - Issuance/Repayment of Debt 147 5 - - Change in other LT liabilities 11 119 84 111 Change in Common Equity - net 27 927 8 8 Payment of Cash Dividends - - - - Other Financing Charges, Net (187) (76) (89) (116) Net Cash from Financing Activities (2) 974 3 3 Net Effect of Exchange Rate Changes - - - - Net Change in Cash and Cash Equivalents 216 1,286 383 516 Cash at End of Period 619 1,909 2,292 2,808 Source: Company reports and J.P. Morgan estimates.
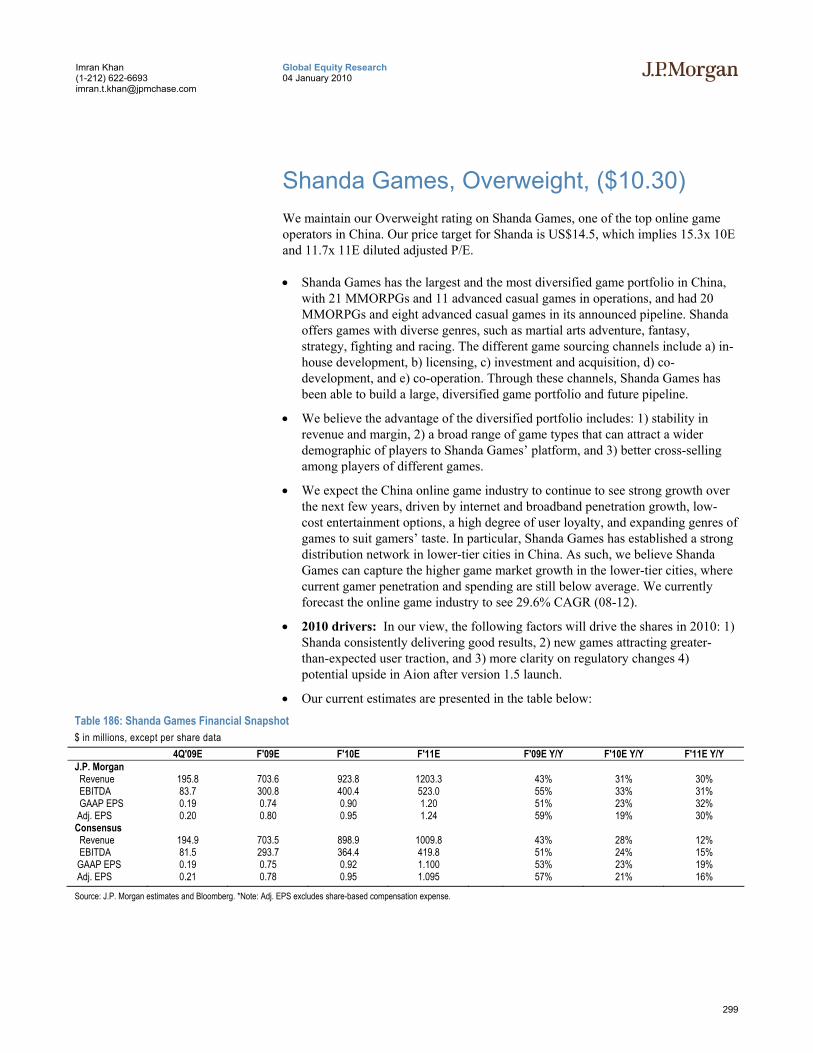
299
Global Equity Research 04 January 2010
Imran Khan (1-212) 622-6693 [email protected]
Shanda Games, Overweight, ($10.30) We maintain our Overweight rating on Shanda Games, one of the top online game operators in China. Our price target for Shanda is US$14.5, which implies 15.3x 10E and 11.7x 11E diluted adjusted P/E.
• Shanda Games has the largest and the most diversified game portfolio in China, with 21 MMORPGs and 11 advanced casual games in operations, and had 20 MMORPGs and eight advanced casual games in its announced pipeline. Shanda offers games with diverse genres, such as martial arts adventure, fantasy, strategy, fighting and racing. The different game sourcing channels include a) in-house development, b) licensing, c) investment and acquisition, d) co-development, and e) co-operation. Through these channels, Shanda Games has been able to build a large, diversified game portfolio and future pipeline.
• We believe the advantage of the diversified portfolio includes: 1) stability in revenue and margin, 2) a broad range of game types that can attract a wider demographic of players to Shanda Games’ platform, and 3) better cross-selling among players of different games.
• We expect the China online game industry to continue to see strong growth over the next few years, driven by internet and broadband penetration growth, low-cost entertainment options, a high degree of user loyalty, and expanding genres of games to suit gamers’ taste. In particular, Shanda Games has established a strong distribution network in lower-tier cities in China. As such, we believe Shanda Games can capture the higher game market growth in the lower-tier cities, where current gamer penetration and spending are still below average. We currently forecast the online game industry to see 29.6% CAGR (08-12).
• 2010 drivers: In our view, the following factors will drive the shares in 2010: 1) Shanda consistently delivering good results, 2) new games attracting greater-than-expected user traction, and 3) more clarity on regulatory changes 4) potential upside in Aion after version 1.5 launch.
• Our current estimates are presented in the table below:
Table 186: Shanda Games Financial Snapshot $ in millions, except per share data 4Q'09E F'09E F'10E F'11E F'09E Y/Y F'10E Y/Y F'11E Y/Y J.P. Morgan Revenue 195.8 703.6 923.8 1203.3 43% 31% 30% EBITDA 83.7 300.8 400.4 523.0 55% 33% 31% GAAP EPS 0.19 0.74 0.90 1.20 51% 23% 32% Adj. EPS 0.20 0.80 0.95 1.24 59% 19% 30% Consensus Revenue 194.9 703.5 898.9 1009.8 43% 28% 12% EBITDA 81.5 293.7 364.4 419.8 51% 24% 15% GAAP EPS 0.19 0.75 0.92 1.100 53% 23% 19% Adj. EPS 0.21 0.78 0.95 1.095 57% 21% 16%
Source: J.P. Morgan estimates and Bloomberg. *Note: Adj. EPS excludes share-based compensation expense.
300
Global Equity Research 04 January 2010
Imran Khan (1-212) 622-6693 [email protected]
Our Estimates and Outlook for 2010 We forecast net revenue of US$923.8MM in 2010, up 31% Y/Y, and GAAP diluted EPS of US$0.90, up 23% Y/Y, or adjusted EPS (ex-share-based expense) of US$0.95, up 32% Y/Y. We forecast MMORPG revenue of US$862MM in 2010 (93% of total revenue), up 33% Y/Y, and casual game revenue of US$57MM (6% of total revenue), up 13% Y/Y.
We forecast gross margin at 58.9% for 2010, slightly lower than 59.6% for 2009, adjusted operating margin (ex-share-based expense) of 39.3% for 2010, slightly better than 39.0% for 2009, and adjusted net margin of 31.0% for 2010, down from 32.2% for 2009.
Our Estimates and Outlook for 2011 For 2011, we forecast net revenue of US$1,203.3MM, up 30% Y/Y, and GAAP diluted EPS of US$1.20, up 32% Y/Y, or adjusted EPS of US$1.24, up 30% Y/Y. We forecast MMORPG revenue of US$1,131MM in 2011 (94% of total revenue), up 31% Y/Y, and casual game revenue of US$67MM (6% of total revenue), up 17% Y/Y. On margins, we forecast gross margin at 58.3% (stable Y/Y); adjusted operating margin of 39.2% (stable Y/Y) and adjusted net margin of 31.2% (also stable Y/Y).
Price Target, Valuation and Rating Analysis We maintain our Overweight rating on Shanda Games., We note that Shanda Interactive (Shanda Games' parent) has been trading at a 12-month forward P/E range of 8x to 15x. We believe Shanda Games can trade in a similar trading range. Our PT of US$14.5 is based on the midpoint of the 12-month forward P/E range at 11.5x 11E. Our price target implies 15.3x 10E and 11.7x 11E diluted adjusted PE.
We believe the large trading range is often driven by investor perception/newsflow about the success or the lack thereof of a particular game. We believe current expectations on the growth of Shanda’s old games and Aion is low. Therefore, we expect share price drivers to be: 1) more clarity on regulatory changes, and 2) potential upside in Aion and other new games.
Our DCF valuation assumes 10-year revenue growth and 0% terminal growth. At a WACC of 12.1%, our DCF valuation is US$20.4. We believe DCF is a good reference to value the company. However, with risks in the game pipeline, we believe Shanda Games may not be able to trade at its DCF valuation.
Risks to Our Rating and Price Target Risks to our price target include: 1) slower-than-expected revenue growth due to an aging game portfolio and Shanda Games fails to launch future new games, 2) increased competition in the game industry, 3) larger-than-expected spending in marketing, overseas expansion or game sourcing, 4) disruption in the distribution contract with Shanda Interactive, and 5) regulatory changes that could impact the operation of existing games or delay new game launches.
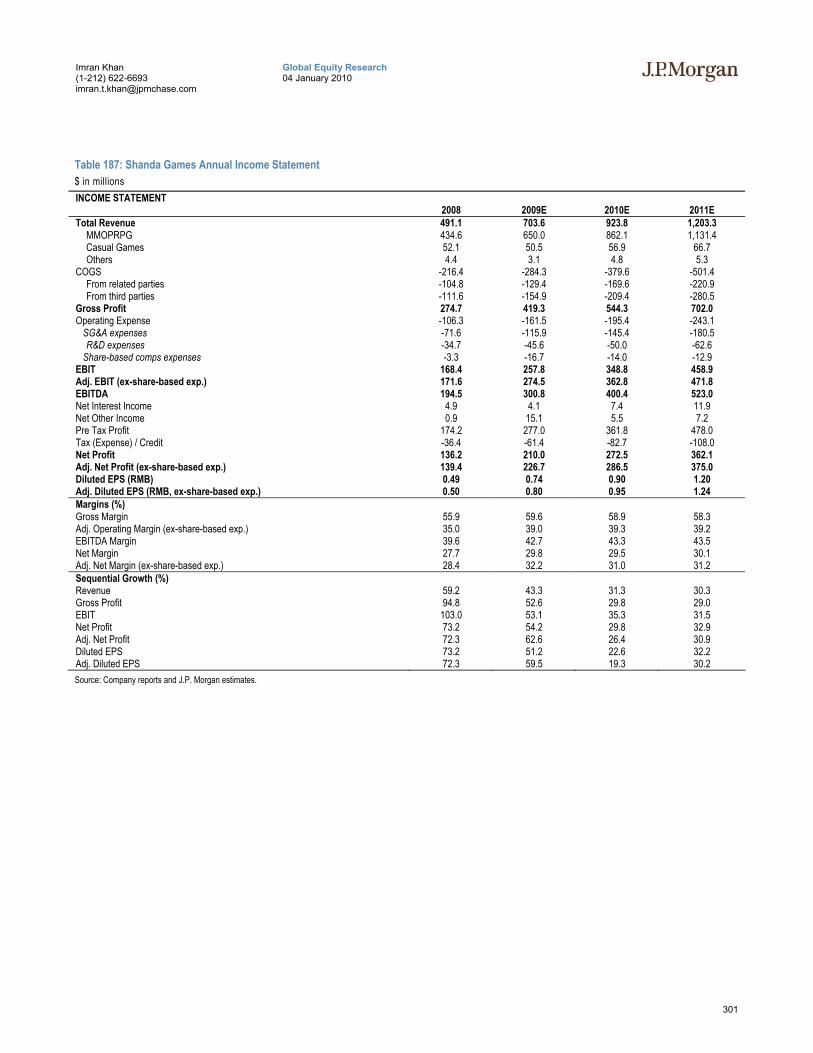
301
Global Equity Research 04 January 2010
Imran Khan (1-212) 622-6693 [email protected]
Table 187: Shanda Games Annual Income Statement $ in millions INCOME STATEMENT
2008 2009E 2010E 2011E Total Revenue 491.1 703.6 923.8 1,203.3
MMOPRPG 434.6 650.0 862.1 1,131.4 Casual Games 52.1 50.5 56.9 66.7 Others 4.4 3.1 4.8 5.3
COGS -216.4 -284.3 -379.6 -501.4 From related parties -104.8 -129.4 -169.6 -220.9 From third parties -111.6 -154.9 -209.4 -280.5
Gross Profit 274.7 419.3 544.3 702.0 Operating Expense -106.3 -161.5 -195.4 -243.1 SG&A expenses -71.6 -115.9 -145.4 -180.5
R&D expenses -34.7 -45.6 -50.0 -62.6 Share-based comps expenses -3.3 -16.7 -14.0 -12.9 EBIT 168.4 257.8 348.8 458.9 Adj. EBIT (ex-share-based exp.) 171.6 274.5 362.8 471.8 EBITDA 194.5 300.8 400.4 523.0 Net Interest Income 4.9 4.1 7.4 11.9 Net Other Income 0.9 15.1 5.5 7.2 Pre Tax Profit 174.2 277.0 361.8 478.0 Tax (Expense) / Credit -36.4 -61.4 -82.7 -108.0 Net Profit 136.2 210.0 272.5 362.1 Adj. Net Profit (ex-share-based exp.) 139.4 226.7 286.5 375.0 Diluted EPS (RMB) 0.49 0.74 0.90 1.20 Adj. Diluted EPS (RMB, ex-share-based exp.) 0.50 0.80 0.95 1.24 Margins (%) Gross Margin 55.9 59.6 58.9 58.3 Adj. Operating Margin (ex-share-based exp.) 35.0 39.0 39.3 39.2 EBITDA Margin 39.6 42.7 43.3 43.5 Net Margin 27.7 29.8 29.5 30.1 Adj. Net Margin (ex-share-based exp.) 28.4 32.2 31.0 31.2 Sequential Growth (%) Revenue 59.2 43.3 31.3 30.3 Gross Profit 94.8 52.6 29.8 29.0 EBIT 103.0 53.1 35.3 31.5 Net Profit 73.2 54.2 29.8 32.9 Adj. Net Profit 72.3 62.6 26.4 30.9 Diluted EPS 73.2 51.2 22.6 32.2 Adj. Diluted EPS 72.3 59.5 19.3 30.2 Source: Company reports and J.P. Morgan estimates.
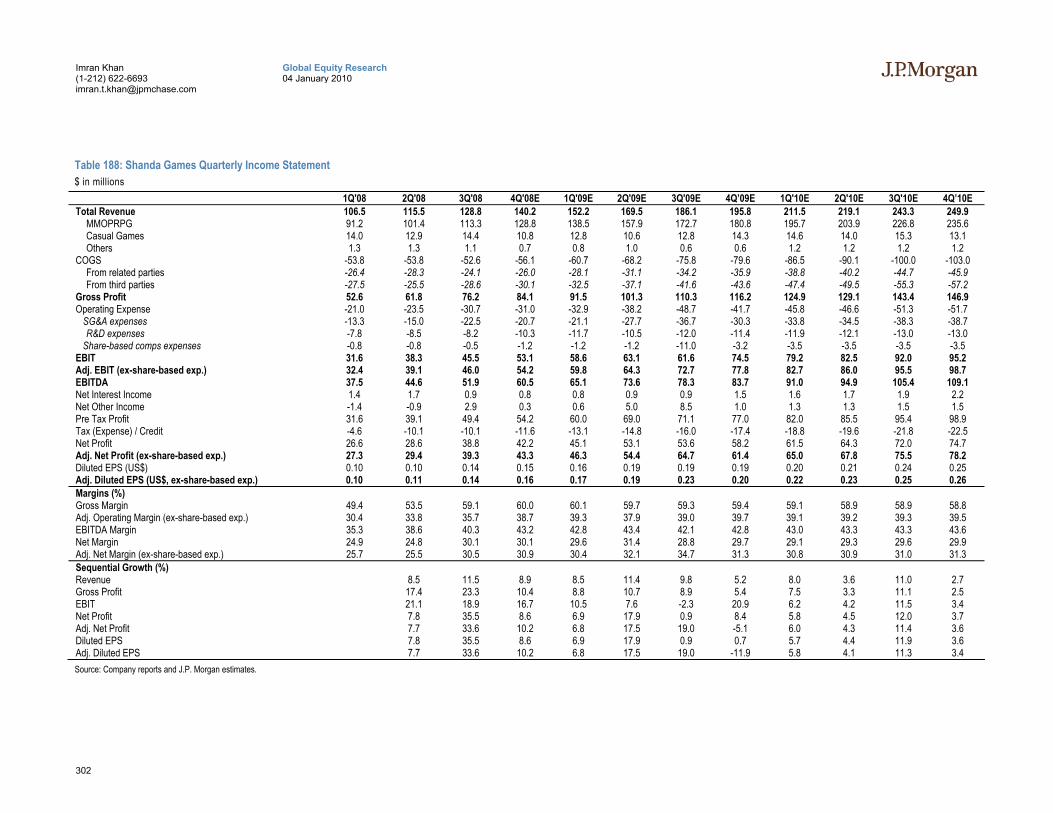
302
Global Equity Research 04 January 2010
Imran Khan (1-212) 622-6693 [email protected]
Table 188: Shanda Games Quarterly Income Statement $ in millions
1Q'08 2Q'08 3Q'08 4Q'08E 1Q'09E 2Q'09E 3Q'09E 4Q’09E 1Q'10E 2Q'10E 3Q'10E 4Q’10E Total Revenue 106.5 115.5 128.8 140.2 152.2 169.5 186.1 195.8 211.5 219.1 243.3 249.9
MMOPRPG 91.2 101.4 113.3 128.8 138.5 157.9 172.7 180.8 195.7 203.9 226.8 235.6 Casual Games 14.0 12.9 14.4 10.8 12.8 10.6 12.8 14.3 14.6 14.0 15.3 13.1 Others 1.3 1.3 1.1 0.7 0.8 1.0 0.6 0.6 1.2 1.2 1.2 1.2
COGS -53.8 -53.8 -52.6 -56.1 -60.7 -68.2 -75.8 -79.6 -86.5 -90.1 -100.0 -103.0 From related parties -26.4 -28.3 -24.1 -26.0 -28.1 -31.1 -34.2 -35.9 -38.8 -40.2 -44.7 -45.9 From third parties -27.5 -25.5 -28.6 -30.1 -32.5 -37.1 -41.6 -43.6 -47.4 -49.5 -55.3 -57.2
Gross Profit 52.6 61.8 76.2 84.1 91.5 101.3 110.3 116.2 124.9 129.1 143.4 146.9 Operating Expense -21.0 -23.5 -30.7 -31.0 -32.9 -38.2 -48.7 -41.7 -45.8 -46.6 -51.3 -51.7 SG&A expenses -13.3 -15.0 -22.5 -20.7 -21.1 -27.7 -36.7 -30.3 -33.8 -34.5 -38.3 -38.7
R&D expenses -7.8 -8.5 -8.2 -10.3 -11.7 -10.5 -12.0 -11.4 -11.9 -12.1 -13.0 -13.0 Share-based comps expenses -0.8 -0.8 -0.5 -1.2 -1.2 -1.2 -11.0 -3.2 -3.5 -3.5 -3.5 -3.5 EBIT 31.6 38.3 45.5 53.1 58.6 63.1 61.6 74.5 79.2 82.5 92.0 95.2 Adj. EBIT (ex-share-based exp.) 32.4 39.1 46.0 54.2 59.8 64.3 72.7 77.8 82.7 86.0 95.5 98.7 EBITDA 37.5 44.6 51.9 60.5 65.1 73.6 78.3 83.7 91.0 94.9 105.4 109.1 Net Interest Income 1.4 1.7 0.9 0.8 0.8 0.9 0.9 1.5 1.6 1.7 1.9 2.2 Net Other Income -1.4 -0.9 2.9 0.3 0.6 5.0 8.5 1.0 1.3 1.3 1.5 1.5 Pre Tax Profit 31.6 39.1 49.4 54.2 60.0 69.0 71.1 77.0 82.0 85.5 95.4 98.9 Tax (Expense) / Credit -4.6 -10.1 -10.1 -11.6 -13.1 -14.8 -16.0 -17.4 -18.8 -19.6 -21.8 -22.5 Net Profit 26.6 28.6 38.8 42.2 45.1 53.1 53.6 58.2 61.5 64.3 72.0 74.7 Adj. Net Profit (ex-share-based exp.) 27.3 29.4 39.3 43.3 46.3 54.4 64.7 61.4 65.0 67.8 75.5 78.2 Diluted EPS (US$) 0.10 0.10 0.14 0.15 0.16 0.19 0.19 0.19 0.20 0.21 0.24 0.25 Adj. Diluted EPS (US$, ex-share-based exp.) 0.10 0.11 0.14 0.16 0.17 0.19 0.23 0.20 0.22 0.23 0.25 0.26 Margins (%) Gross Margin 49.4 53.5 59.1 60.0 60.1 59.7 59.3 59.4 59.1 58.9 58.9 58.8 Adj. Operating Margin (ex-share-based exp.) 30.4 33.8 35.7 38.7 39.3 37.9 39.0 39.7 39.1 39.2 39.3 39.5 EBITDA Margin 35.3 38.6 40.3 43.2 42.8 43.4 42.1 42.8 43.0 43.3 43.3 43.6 Net Margin 24.9 24.8 30.1 30.1 29.6 31.4 28.8 29.7 29.1 29.3 29.6 29.9 Adj. Net Margin (ex-share-based exp.) 25.7 25.5 30.5 30.9 30.4 32.1 34.7 31.3 30.8 30.9 31.0 31.3 Sequential Growth (%) Revenue 8.5 11.5 8.9 8.5 11.4 9.8 5.2 8.0 3.6 11.0 2.7 Gross Profit 17.4 23.3 10.4 8.8 10.7 8.9 5.4 7.5 3.3 11.1 2.5 EBIT 21.1 18.9 16.7 10.5 7.6 -2.3 20.9 6.2 4.2 11.5 3.4 Net Profit 7.8 35.5 8.6 6.9 17.9 0.9 8.4 5.8 4.5 12.0 3.7 Adj. Net Profit 7.7 33.6 10.2 6.8 17.5 19.0 -5.1 6.0 4.3 11.4 3.6 Diluted EPS 7.8 35.5 8.6 6.9 17.9 0.9 0.7 5.7 4.4 11.9 3.6 Adj. Diluted EPS 7.7 33.6 10.2 6.8 17.5 19.0 -11.9 5.8 4.1 11.3 3.4 Source: Company reports and J.P. Morgan estimates.

303
Global Equity Research 04 January 2010
Imran Khan (1-212) 622-6693 [email protected]
Table 189: Shanda Games Annual Balance Sheet $ in millions
2008 2009E 2010E 2011E Cash and Cash Equivalents 125 415 664 1,026 Account Receivables 64 90 137 181 Other Current Assets 40 57 73 96 Total Current Assets 230 562 873 1,303 Net Fixed Assets 14 28 48 70 LT Investments 3 3 3 3 Other LT Assets 108 109 109 109 Total Long Term Assets 125 140 160 182 Total Assets 355 703 1,033 1,485 ST Debt - 57 57 57 Accrued Expenses and Payables 14 17 22 29 Other Current Liabilities 157 196 250 330 Total Current Liabilities 171 270 329 416 LT Debt - - - - Other LT Liabilities 4 4 4 4 Total Liabilities 176 274 333 421 Share Capital 6 6 6 6 Additional Paid-in Capital 69 173 173 173 Other Reserves 4 9 9 9 Retained Earnings 80 213 485 847 Preferred Stock - - - - Total Shanda Games Shareholder's Equity 159 401 674 1,036 Minority Interests 20 28 26 29 Total Liabilities and Equity 355 703 1,033 1,485 Source: Company reports and J.P. Morgan estimates.
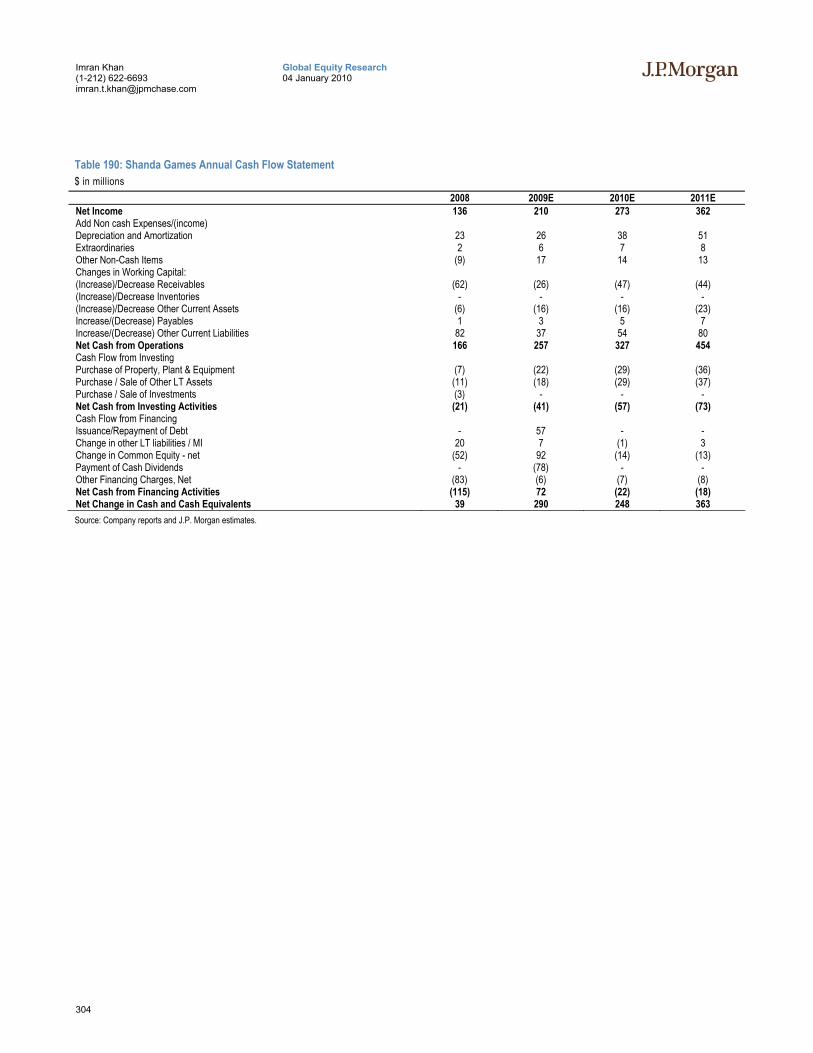
304
Global Equity Research 04 January 2010
Imran Khan (1-212) 622-6693 [email protected]
Table 190: Shanda Games Annual Cash Flow Statement $ in millions
2008 2009E 2010E 2011E Net Income 136 210 273 362 Add Non cash Expenses/(income) Depreciation and Amortization 23 26 38 51 Extraordinaries 2 6 7 8 Other Non-Cash Items (9) 17 14 13 Changes in Working Capital: (Increase)/Decrease Receivables (62) (26) (47) (44) (Increase)/Decrease Inventories - - - - (Increase)/Decrease Other Current Assets (6) (16) (16) (23) Increase/(Decrease) Payables 1 3 5 7 Increase/(Decrease) Other Current Liabilities 82 37 54 80 Net Cash from Operations 166 257 327 454 Cash Flow from Investing Purchase of Property, Plant & Equipment (7) (22) (29) (36) Purchase / Sale of Other LT Assets (11) (18) (29) (37) Purchase / Sale of Investments (3) - - - Net Cash from Investing Activities (21) (41) (57) (73) Cash Flow from Financing Issuance/Repayment of Debt - 57 - - Change in other LT liabilities / MI 20 7 (1) 3 Change in Common Equity - net (52) 92 (14) (13) Payment of Cash Dividends - (78) - - Other Financing Charges, Net (83) (6) (7) (8) Net Cash from Financing Activities (115) 72 (22) (18) Net Change in Cash and Cash Equivalents 39 290 248 363 Source: Company reports and J.P. Morgan estimates.
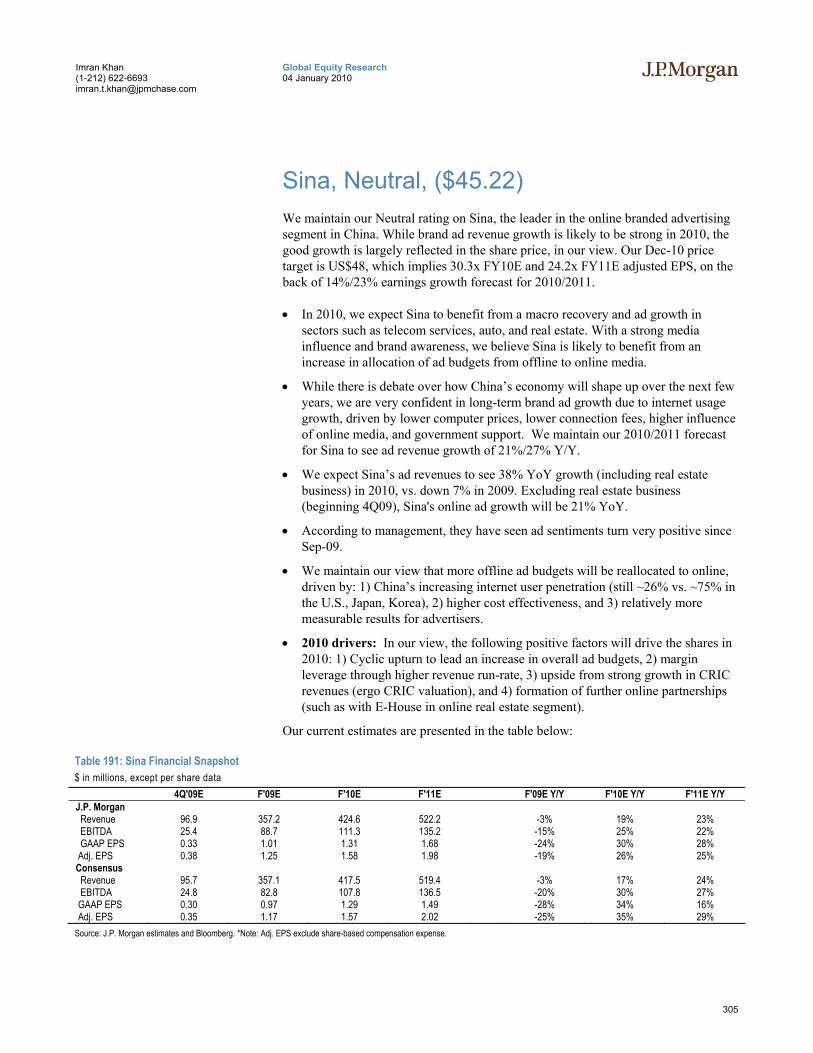
305
Global Equity Research 04 January 2010
Imran Khan (1-212) 622-6693 [email protected]
Sina, Neutral, ($45.22) We maintain our Neutral rating on Sina, the leader in the online branded advertising segment in China. While brand ad revenue growth is likely to be strong in 2010, the good growth is largely reflected in the share price, in our view. Our Dec-10 price target is US$48, which implies 30.3x FY10E and 24.2x FY11E adjusted EPS, on the back of 14%/23% earnings growth forecast for 2010/2011.
• In 2010, we expect Sina to benefit from a macro recovery and ad growth in sectors such as telecom services, auto, and real estate. With a strong media influence and brand awareness, we believe Sina is likely to benefit from an increase in allocation of ad budgets from offline to online media.
• While there is debate over how China’s economy will shape up over the next few years, we are very confident in long-term brand ad growth due to internet usage growth, driven by lower computer prices, lower connection fees, higher influence of online media, and government support. We maintain our 2010/2011 forecast for Sina to see ad revenue growth of 21%/27% Y/Y.
• We expect Sina’s ad revenues to see 38% YoY growth (including real estate business) in 2010, vs. down 7% in 2009. Excluding real estate business (beginning 4Q09), Sina's online ad growth will be 21% YoY.
• According to management, they have seen ad sentiments turn very positive since Sep-09.
• We maintain our view that more offline ad budgets will be reallocated to online, driven by: 1) China’s increasing internet user penetration (still ~26% vs. ~75% in the U.S., Japan, Korea), 2) higher cost effectiveness, and 3) relatively more measurable results for advertisers.
• 2010 drivers: In our view, the following positive factors will drive the shares in 2010: 1) Cyclic upturn to lead an increase in overall ad budgets, 2) margin leverage through higher revenue run-rate, 3) upside from strong growth in CRIC revenues (ergo CRIC valuation), and 4) formation of further online partnerships (such as with E-House in online real estate segment).
Our current estimates are presented in the table below:
Table 191: Sina Financial Snapshot $ in millions, except per share data 4Q'09E F'09E F'10E F'11E F'09E Y/Y F'10E Y/Y F'11E Y/Y J.P. Morgan Revenue 96.9 357.2 424.6 522.2 -3% 19% 23% EBITDA 25.4 88.7 111.3 135.2 -15% 25% 22% GAAP EPS 0.33 1.01 1.31 1.68 -24% 30% 28% Adj. EPS 0.38 1.25 1.58 1.98 -19% 26% 25% Consensus Revenue 95.7 357.1 417.5 519.4 -3% 17% 24% EBITDA 24.8 82.8 107.8 136.5 -20% 30% 27% GAAP EPS 0.30 0.97 1.29 1.49 -28% 34% 16% Adj. EPS 0.35 1.17 1.57 2.02 -25% 35% 29% Source: J.P. Morgan estimates and Bloomberg. *Note: Adj. EPS exclude share-based compensation expense.
306
Global Equity Research 04 January 2010
Imran Khan (1-212) 622-6693 [email protected]
Our Estimates and Outlook for 2010 We forecast net revenue of US$424.6MM in 2009, up 19% Y/Y, and GAAP diluted EPS of US$1.31, up 30% Y/Y, or adjusted EPS (ex-share-based expense) of US$1.58, up 26% Y/Y. We forecast 2010 advertising revenue of US$274.7MM (65% of total revenue), up 21% Y/Y, and wireless–related revenue of US$142.6MM (34% of total revenue), up 16% Y/Y. Among other revenue, we currently forecast US$7.3MM in search–related revenue in 2009, up 10% Y/Y.
We forecast gross margin at 56.0% for 2010, down from 56.9% for 2009 (due to higher bandwidth–related costs in 2009). Our online ad gross margin forecast is 58.4% in 2010, up from 58.9% for 2009 (due to bandwidth–related costs), and our wireless–related gross margin forecast is 50.4%, down from 52.4% for 2009. We expect adjusted operating margin (ex-share-based expense) of 21.4% for 2010, up from 19.8% for 2009, and adjusted net margin of 24.0% for 2010, up from 20.5% for 2009.
Our Estimates and Outlook for 2011 For 2011, we forecast net revenue of US$522.2MM, up 23% Y/Y, and GAAP diluted EPS of US$1.68, up 28% Y/Y, or adjusted EPS of US$1.98, up 25% Y/Y. We forecast 2010 advertising revenue of US$348.4MM, up 27% Y/Y, and wireless-related revenue of US$165.6MM, up 16% Y/Y. On margins, we forecast gross margin at 56.0% (stable Y/Y), adjusted operating margin of 21.5% (stable Y/Y) and adjusted net margin of 24.6% (slightly up Y/Y).
Price Target, Valuation and Rating Analysis Our PT is based on SOTP valuation of Sina’s organic business (valued at US$38) and 33% holding in CRIC (valued at US$10).
Excluding equity income from CRIC, we value Sina’s organic business based on a DCF valuation of US$38. At a price of US$38, this implies the business is valued at 27.2x 2010E and 21.7x 2011E diluted adjusted P/E. We believe this is a fair P/E multiple, given a CAGR growth rate of roughly 25% over the next few years, or a P/E-to-Growth ratio of around 1x. Without equity earnings from CRIC, we expect 2009E/10E diluted adjusted EPS to be US$1.40 and US$1.75, respectively.
We value Sina’s 33% holding in CRIC based on the current share price of US$15.7. This represents US$750MM, or US11.6 per share. We also take a liquidity discount of 15% for the stake, given the large percentage of the holding. As such, we value this part of the business at US$10.
On our PT of US$48, this implies 30.3x 2010E and 24.2x 2011E P/E, and 15.7x 2010E and 12.9x 11E EV/EBTIDA.
We maintain our Neutral rating on Sina. While brand ad revenue growth will likely be strong in 2010, that growth has been largely reflected in the share price, in our view.
307
Global Equity Research 04 January 2010
Imran Khan (1-212) 622-6693 [email protected]
Risks to Our Rating and Price Target Upside risks to our price target include better-than-expected online advertising growth, further partnerships formed (similar to E-House real estate partnership), and further operating leverage achieved.
Downside risks to our price target include decline in operating margin with higher video-related bandwidth costs and WVAS marketing, lower-than-expected advertising spending in China, and competition with other internet portals. In addition, changes in regulations in wireless value-added space, as well as further decline in wireless–related revenue due to strong competition are downside risks.

308
Global Equity Research 04 January 2010
Imran Khan (1-212) 622-6693 [email protected]
Table 192: SINA Annual Income Statement $ in millions INCOME STATEMENT
2008 2009E 2010E 2011E Revenue 369.6 357.2 424.6 522.2 Mobile related 103.3 123.1 142.6 165.6 Advertising 258.5 227.5 274.7 348.4 Others 7.8 6.6 7.3 8.2 COGS -147.1 -153.9 -186.7 -229.8 Gross Profit 222.5 203.4 237.9 292.5 Operating Expense -147.9 -145.1 -162.9 -198.3 Sales & Mktg. expenses -77.7 -77.4 -81.6 -100.3 G&A expenses -26.2 -23.9 -29.7 -36.6 R&D expenses -28.4 -29.6 -34.0 -41.8 Other expenses -1.3 -1.6 -1.6 -1.6 Share-based compensation -14.3 -12.5 -16.0 -18.0 EBIT 74.6 58.3 75.0 94.2 Adjusted EBIT (ex- 123R exp.) 88.9 70.8 91.0 112.2 EBITDA 103.8 88.7 111.3 135.2 Net Interest Income 17.7 8.6 11.5 17.1 Net Other Income 2.4 3.1 14.2 17.9 Pre Tax Profit 94.7 70.0 100.6 129.2 Tax Expense/(Credit) -14.0 -10.9 -16.3 -20.6 Reported Net Profit 80.6 59.1 84.3 108.6 Adj. Net Profit * 94.0 73.2 101.9 128.2 Reported Diluted EPS (US$) 1.33 1.01 1.31 1.68 Adj. Diluted EPS (US$) * 1.56 1.25 1.58 1.98 Margins (%) Gross Margin 60.2 56.9 56.0 56.0 Adj. Operating Margin * 24.1 19.8 21.4 21.5 EBITDA Margin 28.1 24.8 26.2 25.9 Net Margin 21.8 16.5 19.9 20.8 Adj. Net Margin * 25.4 20.5 24.0 24.6 Sequential Growth (%) Revenue 50.2 -3.3 18.9 23.0 Gross Profit 45.2 -8.6 17.0 22.9 Adj. EBIT (ex-123R) 48.8 -20.3 28.5 23.3 EBITDA 39.8 -14.6 25.5 21.5 Reported Diluted EPS 37.6 -24.2 29.6 28.2 Adj. Diluted EPS * 39.1 -19.5 26.4 25.2 Source: Company reports and J.P. Morgan estimates.
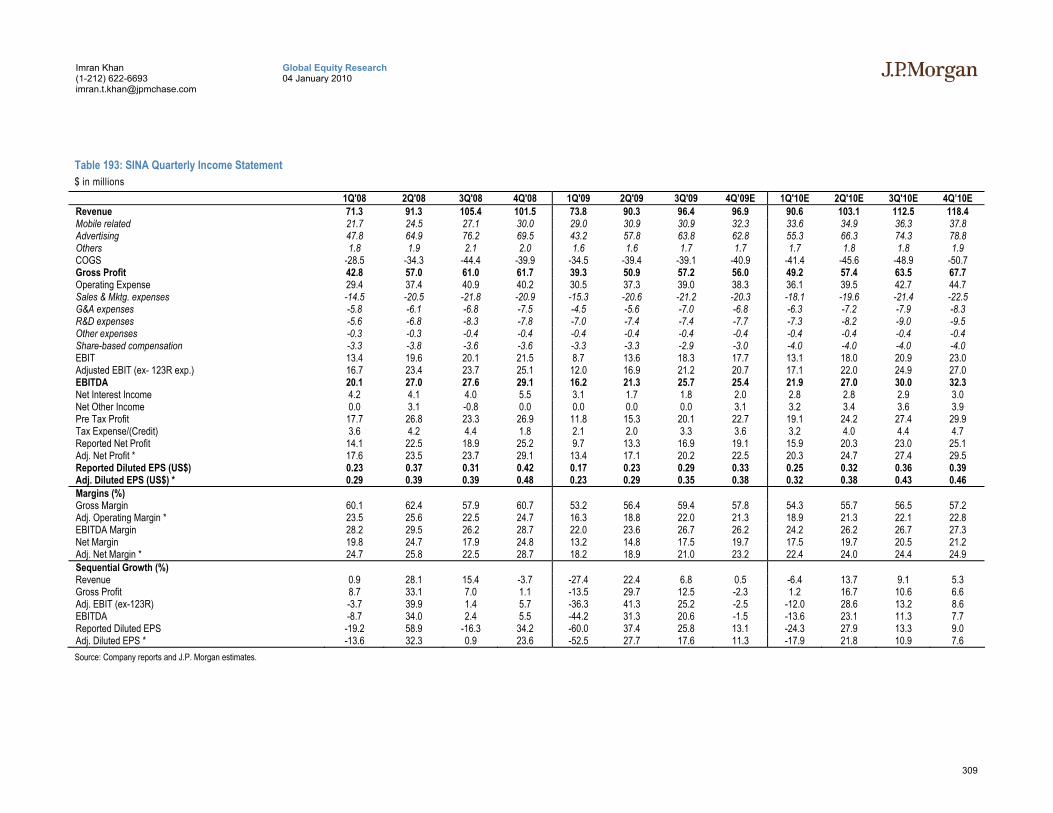
309
Global Equity Research 04 January 2010
Imran Khan (1-212) 622-6693 [email protected]
Table 193: SINA Quarterly Income Statement $ in millions
1Q'08 2Q'08 3Q'08 4Q'08 1Q'09 2Q'09 3Q'09 4Q’09E 1Q'10E 2Q'10E 3Q'10E 4Q’10E Revenue 71.3 91.3 105.4 101.5 73.8 90.3 96.4 96.9 90.6 103.1 112.5 118.4 Mobile related 21.7 24.5 27.1 30.0 29.0 30.9 30.9 32.3 33.6 34.9 36.3 37.8 Advertising 47.8 64.9 76.2 69.5 43.2 57.8 63.8 62.8 55.3 66.3 74.3 78.8 Others 1.8 1.9 2.1 2.0 1.6 1.6 1.7 1.7 1.7 1.8 1.8 1.9 COGS -28.5 -34.3 -44.4 -39.9 -34.5 -39.4 -39.1 -40.9 -41.4 -45.6 -48.9 -50.7 Gross Profit 42.8 57.0 61.0 61.7 39.3 50.9 57.2 56.0 49.2 57.4 63.5 67.7 Operating Expense 29.4 37.4 40.9 40.2 30.5 37.3 39.0 38.3 36.1 39.5 42.7 44.7 Sales & Mktg. expenses -14.5 -20.5 -21.8 -20.9 -15.3 -20.6 -21.2 -20.3 -18.1 -19.6 -21.4 -22.5 G&A expenses -5.8 -6.1 -6.8 -7.5 -4.5 -5.6 -7.0 -6.8 -6.3 -7.2 -7.9 -8.3 R&D expenses -5.6 -6.8 -8.3 -7.8 -7.0 -7.4 -7.4 -7.7 -7.3 -8.2 -9.0 -9.5 Other expenses -0.3 -0.3 -0.4 -0.4 -0.4 -0.4 -0.4 -0.4 -0.4 -0.4 -0.4 -0.4 Share-based compensation -3.3 -3.8 -3.6 -3.6 -3.3 -3.3 -2.9 -3.0 -4.0 -4.0 -4.0 -4.0 EBIT 13.4 19.6 20.1 21.5 8.7 13.6 18.3 17.7 13.1 18.0 20.9 23.0 Adjusted EBIT (ex- 123R exp.) 16.7 23.4 23.7 25.1 12.0 16.9 21.2 20.7 17.1 22.0 24.9 27.0 EBITDA 20.1 27.0 27.6 29.1 16.2 21.3 25.7 25.4 21.9 27.0 30.0 32.3 Net Interest Income 4.2 4.1 4.0 5.5 3.1 1.7 1.8 2.0 2.8 2.8 2.9 3.0 Net Other Income 0.0 3.1 -0.8 0.0 0.0 0.0 0.0 3.1 3.2 3.4 3.6 3.9 Pre Tax Profit 17.7 26.8 23.3 26.9 11.8 15.3 20.1 22.7 19.1 24.2 27.4 29.9 Tax Expense/(Credit) 3.6 4.2 4.4 1.8 2.1 2.0 3.3 3.6 3.2 4.0 4.4 4.7 Reported Net Profit 14.1 22.5 18.9 25.2 9.7 13.3 16.9 19.1 15.9 20.3 23.0 25.1 Adj. Net Profit * 17.6 23.5 23.7 29.1 13.4 17.1 20.2 22.5 20.3 24.7 27.4 29.5 Reported Diluted EPS (US$) 0.23 0.37 0.31 0.42 0.17 0.23 0.29 0.33 0.25 0.32 0.36 0.39 Adj. Diluted EPS (US$) * 0.29 0.39 0.39 0.48 0.23 0.29 0.35 0.38 0.32 0.38 0.43 0.46 Margins (%) Gross Margin 60.1 62.4 57.9 60.7 53.2 56.4 59.4 57.8 54.3 55.7 56.5 57.2 Adj. Operating Margin * 23.5 25.6 22.5 24.7 16.3 18.8 22.0 21.3 18.9 21.3 22.1 22.8 EBITDA Margin 28.2 29.5 26.2 28.7 22.0 23.6 26.7 26.2 24.2 26.2 26.7 27.3 Net Margin 19.8 24.7 17.9 24.8 13.2 14.8 17.5 19.7 17.5 19.7 20.5 21.2 Adj. Net Margin * 24.7 25.8 22.5 28.7 18.2 18.9 21.0 23.2 22.4 24.0 24.4 24.9 Sequential Growth (%) Revenue 0.9 28.1 15.4 -3.7 -27.4 22.4 6.8 0.5 -6.4 13.7 9.1 5.3 Gross Profit 8.7 33.1 7.0 1.1 -13.5 29.7 12.5 -2.3 1.2 16.7 10.6 6.6 Adj. EBIT (ex-123R) -3.7 39.9 1.4 5.7 -36.3 41.3 25.2 -2.5 -12.0 28.6 13.2 8.6 EBITDA -8.7 34.0 2.4 5.5 -44.2 31.3 20.6 -1.5 -13.6 23.1 11.3 7.7 Reported Diluted EPS -19.2 58.9 -16.3 34.2 -60.0 37.4 25.8 13.1 -24.3 27.9 13.3 9.0 Adj. Diluted EPS * -13.6 32.3 0.9 23.6 -52.5 27.7 17.6 11.3 -17.9 21.8 10.9 7.6 Source: Company reports and J.P. Morgan estimates.
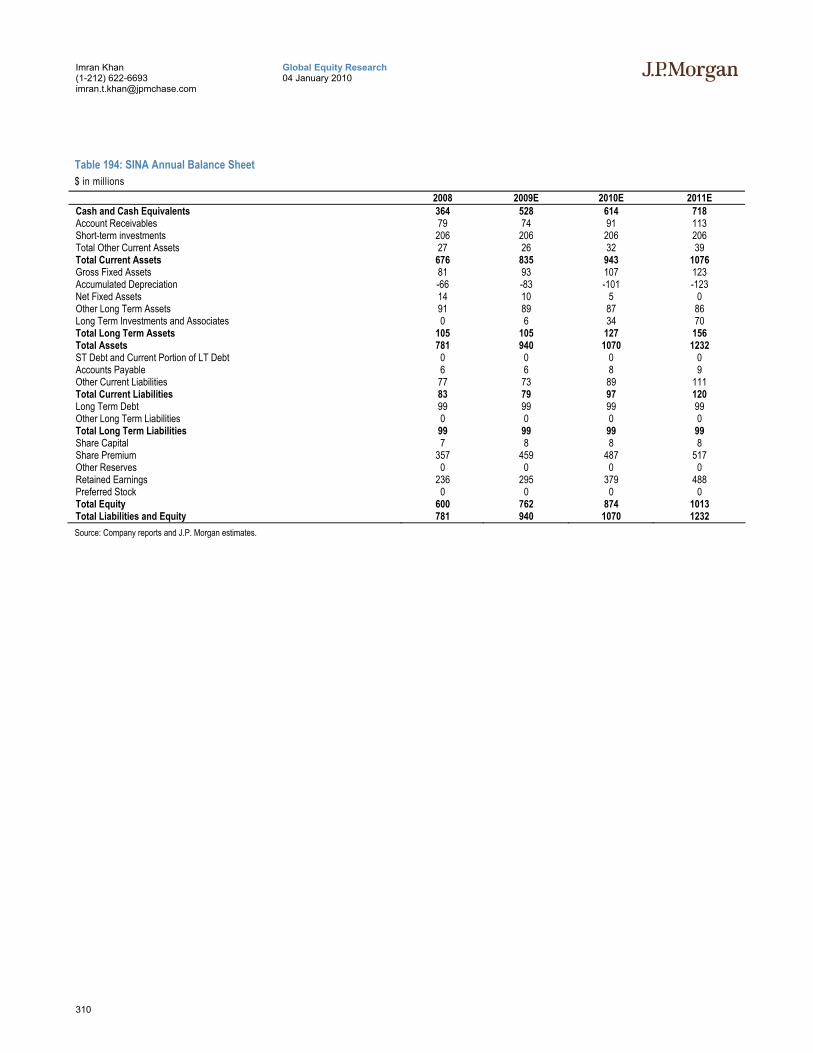
310
Global Equity Research 04 January 2010
Imran Khan (1-212) 622-6693 [email protected]
Table 194: SINA Annual Balance Sheet $ in millions
2008 2009E 2010E 2011E Cash and Cash Equivalents 364 528 614 718 Account Receivables 79 74 91 113 Short-term investments 206 206 206 206 Total Other Current Assets 27 26 32 39 Total Current Assets 676 835 943 1076 Gross Fixed Assets 81 93 107 123 Accumulated Depreciation -66 -83 -101 -123 Net Fixed Assets 14 10 5 0 Other Long Term Assets 91 89 87 86 Long Term Investments and Associates 0 6 34 70 Total Long Term Assets 105 105 127 156 Total Assets 781 940 1070 1232 ST Debt and Current Portion of LT Debt 0 0 0 0 Accounts Payable 6 6 8 9 Other Current Liabilities 77 73 89 111 Total Current Liabilities 83 79 97 120 Long Term Debt 99 99 99 99 Other Long Term Liabilities 0 0 0 0 Total Long Term Liabilities 99 99 99 99 Share Capital 7 8 8 8 Share Premium 357 459 487 517 Other Reserves 0 0 0 0 Retained Earnings 236 295 379 488 Preferred Stock 0 0 0 0 Total Equity 600 762 874 1013 Total Liabilities and Equity 781 940 1070 1232 Source: Company reports and J.P. Morgan estimates.
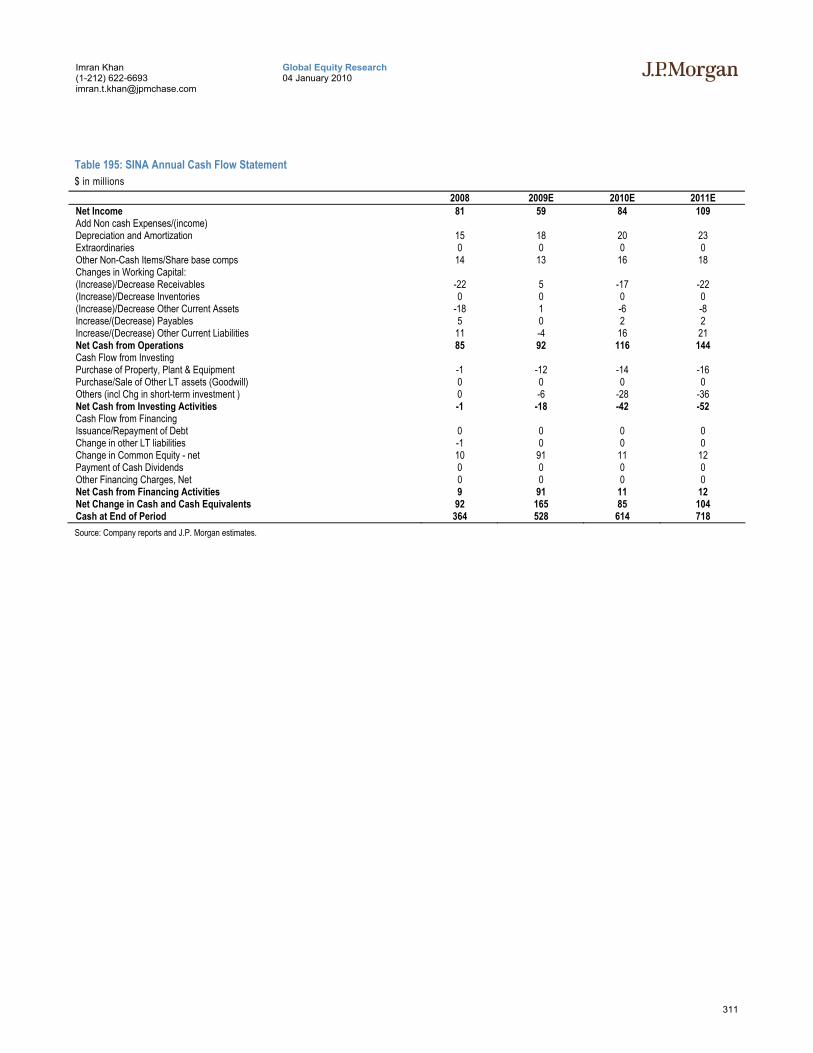
311
Global Equity Research 04 January 2010
Imran Khan (1-212) 622-6693 [email protected]
Table 195: SINA Annual Cash Flow Statement $ in millions
2008 2009E 2010E 2011E Net Income 81 59 84 109 Add Non cash Expenses/(income) Depreciation and Amortization 15 18 20 23 Extraordinaries 0 0 0 0 Other Non-Cash Items/Share base comps 14 13 16 18 Changes in Working Capital: (Increase)/Decrease Receivables -22 5 -17 -22 (Increase)/Decrease Inventories 0 0 0 0 (Increase)/Decrease Other Current Assets -18 1 -6 -8 Increase/(Decrease) Payables 5 0 2 2 Increase/(Decrease) Other Current Liabilities 11 -4 16 21 Net Cash from Operations 85 92 116 144 Cash Flow from Investing Purchase of Property, Plant & Equipment -1 -12 -14 -16 Purchase/Sale of Other LT assets (Goodwill) 0 0 0 0 Others (incl Chg in short-term investment ) 0 -6 -28 -36 Net Cash from Investing Activities -1 -18 -42 -52 Cash Flow from Financing Issuance/Repayment of Debt 0 0 0 0 Change in other LT liabilities -1 0 0 0 Change in Common Equity - net 10 91 11 12 Payment of Cash Dividends 0 0 0 0 Other Financing Charges, Net 0 0 0 0 Net Cash from Financing Activities 9 91 11 12 Net Change in Cash and Cash Equivalents 92 165 85 104 Cash at End of Period 364 528 614 718 Source: Company reports and J.P. Morgan estimates.
312
Global Equity Research 04 January 2010
Imran Khan (1-212) 622-6693 [email protected]
Sohu, Overweight, ($57.51) We maintain our Overweight rating on Sohu, which also remains our top pick in the online advertising sector in China. We believe upside potential in online ads and online games have not been factored in the share price due to conservative guidance given by management. Our Dec-10 price target is US$74, which implies 16.3x 2010E and 13.3x 2011E diluted non-GAAP P/E.
Online Advertising • Sohu remains among the leading internet portals in China, and is likely to remain
among the key beneficiaries of the continued uptrend in online advertising in China. We expect a cyclical upturn and increase in internet penetration to drive online ad revenue growth by at least 30%. We believe with improving execution and better brand awareness, Sohu can continue to deliver solid online ad growth going forward. In addition, the company continues to expand its contents, such as movies, TV shows, exclusive interviews (video and text), as well as deeper content verticals coverage.
• We believe an increase in ad revenues for Sohu could come from strong growth in Autos, Telecom, and FMCG ad allocations. With the pick-up in the economy, high-end car sales could improve in 2010. This should help internet auto ads in 2010. Competition among 3G operators likely to continue to drive telecom sector ad spend. World Expo in Shanghai and Asian Games in Guangzhou could also bring revenue upside in 2010.
• Company’s Oct-09 rate card is up 25% from Apr-09. Sohu portal also saw strong traffic growth of 30% YoY in 3Q09 from a high 3Q08 level (Olympics).
Online Gaming • The continuing success of Sohu’s online game TLBB remains an additional
growth driver for the company (with beneficial impact on revenues and margins). TLBB active paying accounts were 2.4 million as of 3Q09. The company has been experiencing strong response to its expansion packs and we believe TLBB will continue to be a long-term driver for the company. International game licensing fees (currently from HK, Taiwan and Vietnam) are also expected to contribute to incremental revenue. Blade online series also saw a strong surge in PCU (30% QoQ in 3Q09) after the launch of Blade Online 2, a sequel to Blade Online.
• Duke of Mountain Deer is on track to be launched in 3Q10. The company believes a good amount of game content has been accumulated in games over the past three years. Zhong Hua Ying Xiong is also on track to be launched in 2Q10. This game has become one of the most successful games in Taiwan now with 180k PCU vs. 150k PCU in initial launch in Taiwan in 2Q09.
• Company has a strong focus on game development. It has increased its game development workforce to 470 at the end of 3Q09 vs. 220 at the end of 4Q08. It plans to expand R&D workforce to 600 by the end of this year.
• Management plans to launch two to three games every year and believes multiple game engines would help in differentiating the games in their visual and graphics experience. Sohu currently has three 3-D engines: 1) in-house developed, 2) BigWorld, and 3) Crytek. The reason the company owns 3 3-D engines is due to
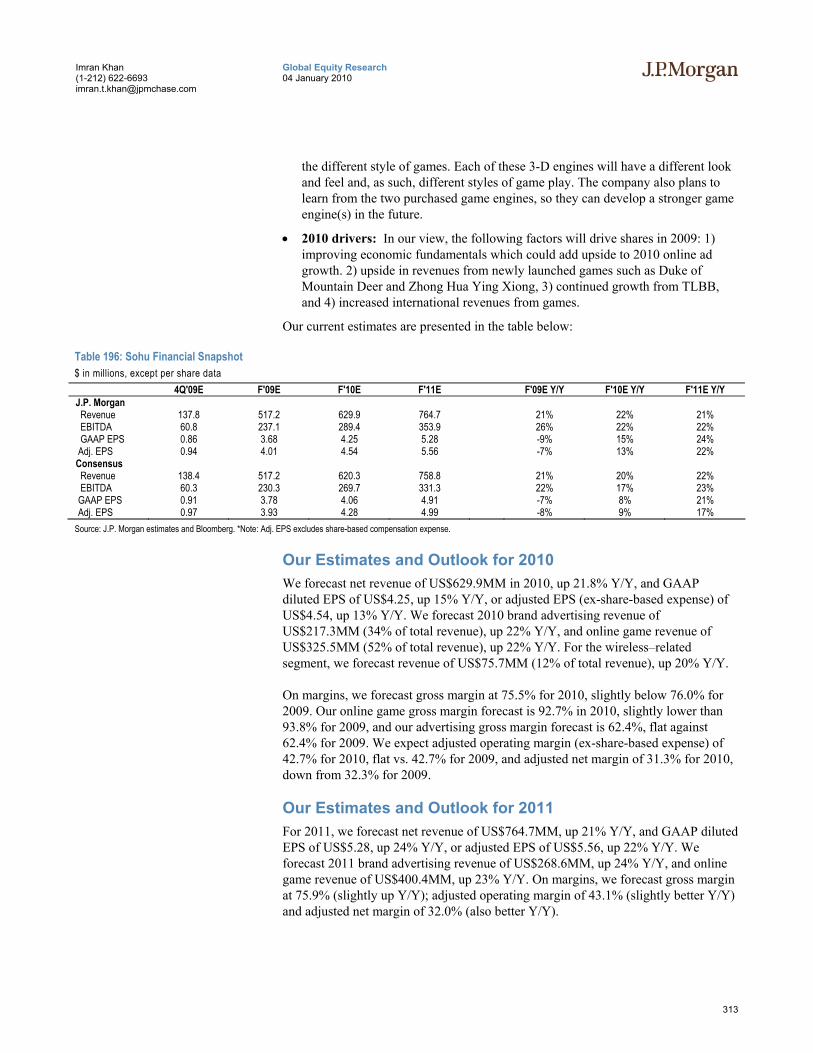
313
Global Equity Research 04 January 2010
Imran Khan (1-212) 622-6693 [email protected]
the different style of games. Each of these 3-D engines will have a different look and feel and, as such, different styles of game play. The company also plans to learn from the two purchased game engines, so they can develop a stronger game engine(s) in the future.
• 2010 drivers: In our view, the following factors will drive shares in 2009: 1) improving economic fundamentals which could add upside to 2010 online ad growth. 2) upside in revenues from newly launched games such as Duke of Mountain Deer and Zhong Hua Ying Xiong, 3) continued growth from TLBB, and 4) increased international revenues from games.
Our current estimates are presented in the table below:
Table 196: Sohu Financial Snapshot $ in millions, except per share data 4Q'09E F'09E F'10E F'11E F'09E Y/Y F'10E Y/Y F'11E Y/Y J.P. Morgan Revenue 137.8 517.2 629.9 764.7 21% 22% 21% EBITDA 60.8 237.1 289.4 353.9 26% 22% 22% GAAP EPS 0.86 3.68 4.25 5.28 -9% 15% 24% Adj. EPS 0.94 4.01 4.54 5.56 -7% 13% 22% Consensus Revenue 138.4 517.2 620.3 758.8 21% 20% 22% EBITDA 60.3 230.3 269.7 331.3 22% 17% 23% GAAP EPS 0.91 3.78 4.06 4.91 -7% 8% 21% Adj. EPS 0.97 3.93 4.28 4.99 -8% 9% 17% Source: J.P. Morgan estimates and Bloomberg. *Note: Adj. EPS excludes share-based compensation expense.
Our Estimates and Outlook for 2010 We forecast net revenue of US$629.9MM in 2010, up 21.8% Y/Y, and GAAP diluted EPS of US$4.25, up 15% Y/Y, or adjusted EPS (ex-share-based expense) of US$4.54, up 13% Y/Y. We forecast 2010 brand advertising revenue of US$217.3MM (34% of total revenue), up 22% Y/Y, and online game revenue of US$325.5MM (52% of total revenue), up 22% Y/Y. For the wireless–related segment, we forecast revenue of US$75.7MM (12% of total revenue), up 20% Y/Y.
On margins, we forecast gross margin at 75.5% for 2010, slightly below 76.0% for 2009. Our online game gross margin forecast is 92.7% in 2010, slightly lower than 93.8% for 2009, and our advertising gross margin forecast is 62.4%, flat against 62.4% for 2009. We expect adjusted operating margin (ex-share-based expense) of 42.7% for 2010, flat vs. 42.7% for 2009, and adjusted net margin of 31.3% for 2010, down from 32.3% for 2009.
Our Estimates and Outlook for 2011 For 2011, we forecast net revenue of US$764.7MM, up 21% Y/Y, and GAAP diluted EPS of US$5.28, up 24% Y/Y, or adjusted EPS of US$5.56, up 22% Y/Y. We forecast 2011 brand advertising revenue of US$268.6MM, up 24% Y/Y, and online game revenue of US$400.4MM, up 23% Y/Y. On margins, we forecast gross margin at 75.9% (slightly up Y/Y); adjusted operating margin of 43.1% (slightly better Y/Y) and adjusted net margin of 32.0% (also better Y/Y).
314
Global Equity Research 04 January 2010
Imran Khan (1-212) 622-6693 [email protected]
Price Target, Valuation and Rating Analysis We maintain our Overweight stance on Sohu, which also remains our top pick in the online ad sector in China. We are introducing our Dec-10 PT of US$74 (from US$74 for Dec-09). The Dec-10 price target of US$ 74 implies 16.3x 2010E and 13.3x 2011E diluted non-GAAP PE.
Our price target is based on the midpoint of our sum-of-the-parts valuation of US$62.8-US$85.2. Our Dec-10 DCF value for Sohu is US$74.9, based on a 10-year DCF forecast, WACC of 12%, and terminal growth rate of 0%.
We maintain Sohu as our top pick in the online ad sector. We expect online advertising to see solid growth next year, driven by improving economic fundamentals. In addition, we expect next year’s ad growth to be driven by: 1) video channel advertising, and 2) events such as the World Cup and World Expo.
As a result of 1) improving economic fundamentals which could add upside to 2010 online ad growth, and 2) launch of Duke of Mountain Deer, we believe the stock could trade toward the high end of our SOTP valuation range.
Sohu has consolidated cash of US$596MM (or gross cash of US$15.5 per diluted share).
Risks to Our Rating and Price Target Risks to our price target include a slowdown in the Chinese economy, which could result in lower online advertising revenue growth, significant market share loss in online advertising to other websites, and volatility in wireless revenue due to policy change at mobile operators. For online games business, delays in upgrades and new game launches, and regulatory changes also add to downside risks.
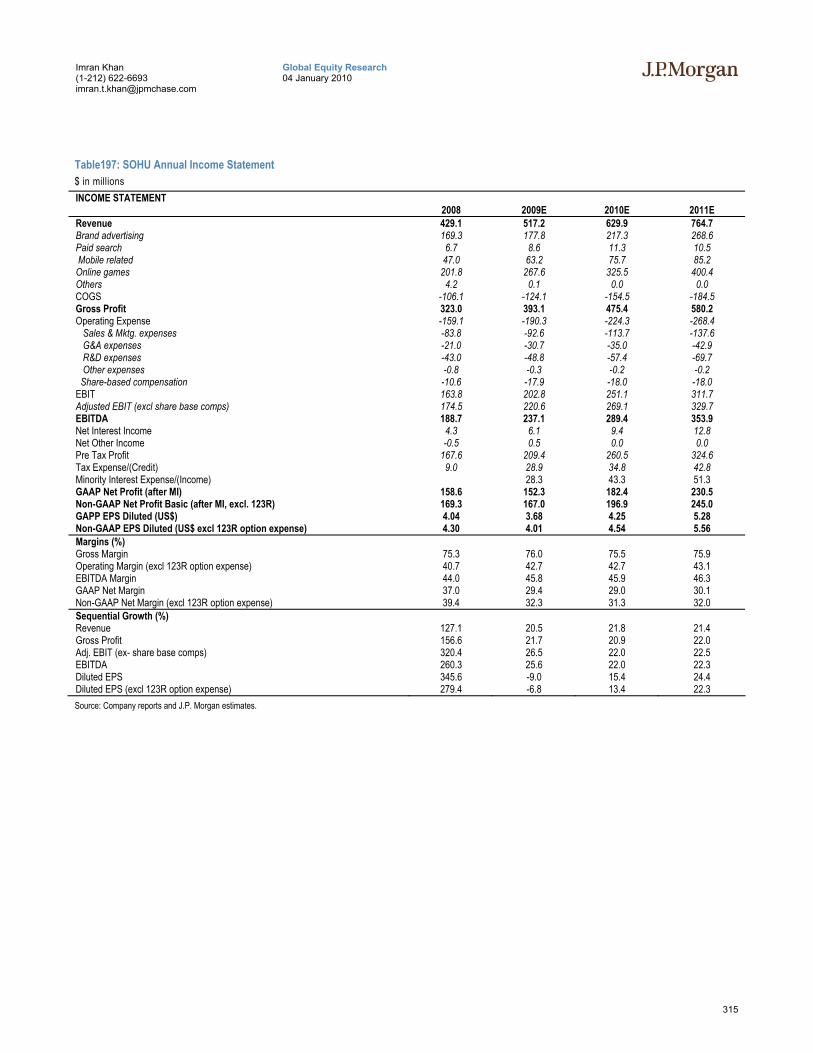
315
Global Equity Research 04 January 2010
Imran Khan (1-212) 622-6693 [email protected]
Table197: SOHU Annual Income Statement $ in millions INCOME STATEMENT
2008 2009E 2010E 2011E Revenue 429.1 517.2 629.9 764.7 Brand advertising 169.3 177.8 217.3 268.6 Paid search 6.7 8.6 11.3 10.5 Mobile related 47.0 63.2 75.7 85.2 Online games 201.8 267.6 325.5 400.4 Others 4.2 0.1 0.0 0.0 COGS -106.1 -124.1 -154.5 -184.5 Gross Profit 323.0 393.1 475.4 580.2 Operating Expense -159.1 -190.3 -224.3 -268.4 Sales & Mktg. expenses -83.8 -92.6 -113.7 -137.6 G&A expenses -21.0 -30.7 -35.0 -42.9 R&D expenses -43.0 -48.8 -57.4 -69.7 Other expenses -0.8 -0.3 -0.2 -0.2 Share-based compensation -10.6 -17.9 -18.0 -18.0 EBIT 163.8 202.8 251.1 311.7 Adjusted EBIT (excl share base comps) 174.5 220.6 269.1 329.7 EBITDA 188.7 237.1 289.4 353.9 Net Interest Income 4.3 6.1 9.4 12.8 Net Other Income -0.5 0.5 0.0 0.0 Pre Tax Profit 167.6 209.4 260.5 324.6 Tax Expense/(Credit) 9.0 28.9 34.8 42.8 Minority Interest Expense/(Income) 28.3 43.3 51.3 GAAP Net Profit (after MI) 158.6 152.3 182.4 230.5 Non-GAAP Net Profit Basic (after MI, excl. 123R) 169.3 167.0 196.9 245.0 GAPP EPS Diluted (US$) 4.04 3.68 4.25 5.28 Non-GAAP EPS Diluted (US$ excl 123R option expense) 4.30 4.01 4.54 5.56 Margins (%) Gross Margin 75.3 76.0 75.5 75.9 Operating Margin (excl 123R option expense) 40.7 42.7 42.7 43.1 EBITDA Margin 44.0 45.8 45.9 46.3 GAAP Net Margin 37.0 29.4 29.0 30.1 Non-GAAP Net Margin (excl 123R option expense) 39.4 32.3 31.3 32.0 Sequential Growth (%) Revenue 127.1 20.5 21.8 21.4 Gross Profit 156.6 21.7 20.9 22.0 Adj. EBIT (ex- share base comps) 320.4 26.5 22.0 22.5 EBITDA 260.3 25.6 22.0 22.3 Diluted EPS 345.6 -9.0 15.4 24.4 Diluted EPS (excl 123R option expense) 279.4 -6.8 13.4 22.3 Source: Company reports and J.P. Morgan estimates.
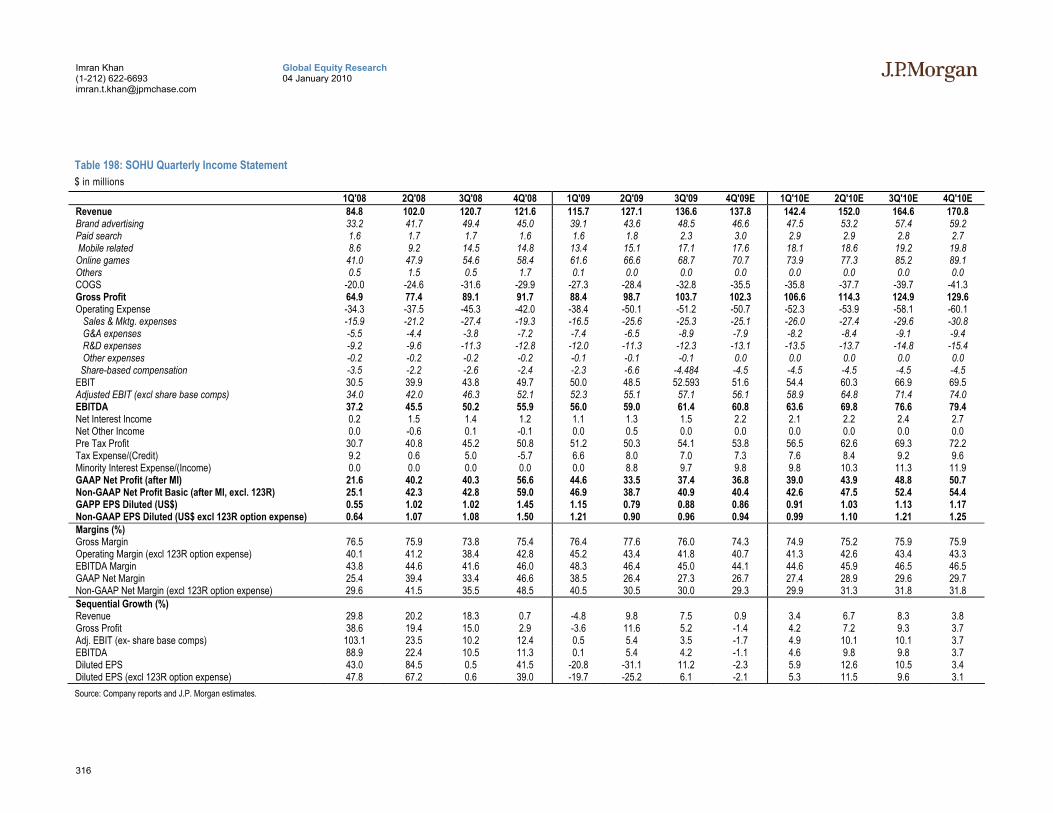
316
Global Equity Research 04 January 2010
Imran Khan (1-212) 622-6693 [email protected]
Table 198: SOHU Quarterly Income Statement $ in millions
1Q'08 2Q'08 3Q'08 4Q'08 1Q'09 2Q'09 3Q'09 4Q'09E 1Q'10E 2Q'10E 3Q'10E 4Q'10E Revenue 84.8 102.0 120.7 121.6 115.7 127.1 136.6 137.8 142.4 152.0 164.6 170.8 Brand advertising 33.2 41.7 49.4 45.0 39.1 43.6 48.5 46.6 47.5 53.2 57.4 59.2 Paid search 1.6 1.7 1.7 1.6 1.6 1.8 2.3 3.0 2.9 2.9 2.8 2.7 Mobile related 8.6 9.2 14.5 14.8 13.4 15.1 17.1 17.6 18.1 18.6 19.2 19.8 Online games 41.0 47.9 54.6 58.4 61.6 66.6 68.7 70.7 73.9 77.3 85.2 89.1 Others 0.5 1.5 0.5 1.7 0.1 0.0 0.0 0.0 0.0 0.0 0.0 0.0 COGS -20.0 -24.6 -31.6 -29.9 -27.3 -28.4 -32.8 -35.5 -35.8 -37.7 -39.7 -41.3 Gross Profit 64.9 77.4 89.1 91.7 88.4 98.7 103.7 102.3 106.6 114.3 124.9 129.6 Operating Expense -34.3 -37.5 -45.3 -42.0 -38.4 -50.1 -51.2 -50.7 -52.3 -53.9 -58.1 -60.1 Sales & Mktg. expenses -15.9 -21.2 -27.4 -19.3 -16.5 -25.6 -25.3 -25.1 -26.0 -27.4 -29.6 -30.8 G&A expenses -5.5 -4.4 -3.8 -7.2 -7.4 -6.5 -8.9 -7.9 -8.2 -8.4 -9.1 -9.4 R&D expenses -9.2 -9.6 -11.3 -12.8 -12.0 -11.3 -12.3 -13.1 -13.5 -13.7 -14.8 -15.4 Other expenses -0.2 -0.2 -0.2 -0.2 -0.1 -0.1 -0.1 0.0 0.0 0.0 0.0 0.0 Share-based compensation -3.5 -2.2 -2.6 -2.4 -2.3 -6.6 -4.484 -4.5 -4.5 -4.5 -4.5 -4.5 EBIT 30.5 39.9 43.8 49.7 50.0 48.5 52.593 51.6 54.4 60.3 66.9 69.5 Adjusted EBIT (excl share base comps) 34.0 42.0 46.3 52.1 52.3 55.1 57.1 56.1 58.9 64.8 71.4 74.0 EBITDA 37.2 45.5 50.2 55.9 56.0 59.0 61.4 60.8 63.6 69.8 76.6 79.4 Net Interest Income 0.2 1.5 1.4 1.2 1.1 1.3 1.5 2.2 2.1 2.2 2.4 2.7 Net Other Income 0.0 -0.6 0.1 -0.1 0.0 0.5 0.0 0.0 0.0 0.0 0.0 0.0 Pre Tax Profit 30.7 40.8 45.2 50.8 51.2 50.3 54.1 53.8 56.5 62.6 69.3 72.2 Tax Expense/(Credit) 9.2 0.6 5.0 -5.7 6.6 8.0 7.0 7.3 7.6 8.4 9.2 9.6 Minority Interest Expense/(Income) 0.0 0.0 0.0 0.0 0.0 8.8 9.7 9.8 9.8 10.3 11.3 11.9 GAAP Net Profit (after MI) 21.6 40.2 40.3 56.6 44.6 33.5 37.4 36.8 39.0 43.9 48.8 50.7 Non-GAAP Net Profit Basic (after MI, excl. 123R) 25.1 42.3 42.8 59.0 46.9 38.7 40.9 40.4 42.6 47.5 52.4 54.4 GAPP EPS Diluted (US$) 0.55 1.02 1.02 1.45 1.15 0.79 0.88 0.86 0.91 1.03 1.13 1.17 Non-GAAP EPS Diluted (US$ excl 123R option expense) 0.64 1.07 1.08 1.50 1.21 0.90 0.96 0.94 0.99 1.10 1.21 1.25 Margins (%) Gross Margin 76.5 75.9 73.8 75.4 76.4 77.6 76.0 74.3 74.9 75.2 75.9 75.9 Operating Margin (excl 123R option expense) 40.1 41.2 38.4 42.8 45.2 43.4 41.8 40.7 41.3 42.6 43.4 43.3 EBITDA Margin 43.8 44.6 41.6 46.0 48.3 46.4 45.0 44.1 44.6 45.9 46.5 46.5 GAAP Net Margin 25.4 39.4 33.4 46.6 38.5 26.4 27.3 26.7 27.4 28.9 29.6 29.7 Non-GAAP Net Margin (excl 123R option expense) 29.6 41.5 35.5 48.5 40.5 30.5 30.0 29.3 29.9 31.3 31.8 31.8 Sequential Growth (%) Revenue 29.8 20.2 18.3 0.7 -4.8 9.8 7.5 0.9 3.4 6.7 8.3 3.8 Gross Profit 38.6 19.4 15.0 2.9 -3.6 11.6 5.2 -1.4 4.2 7.2 9.3 3.7 Adj. EBIT (ex- share base comps) 103.1 23.5 10.2 12.4 0.5 5.4 3.5 -1.7 4.9 10.1 10.1 3.7 EBITDA 88.9 22.4 10.5 11.3 0.1 5.4 4.2 -1.1 4.6 9.8 9.8 3.7 Diluted EPS 43.0 84.5 0.5 41.5 -20.8 -31.1 11.2 -2.3 5.9 12.6 10.5 3.4 Diluted EPS (excl 123R option expense) 47.8 67.2 0.6 39.0 -19.7 -25.2 6.1 -2.1 5.3 11.5 9.6 3.1 Source: Company reports and J.P. Morgan estimates.

317
Global Equity Research 04 January 2010
Imran Khan (1-212) 622-6693 [email protected]
Table 199: SOHU Annual Balance Sheet $ in millions
2008 2009E 2010E 2011E Cash and Cash Equivalents 314 555 765 1021 Account Receivables 37 42 52 63 Inventory 0 0 0 0 Total Other Current Assets 28 34 43 52 Total Current Assets 379 632 860 1136 Gross Fixed Assets 118 139 185 239 Accumulated Depreciation -41 -57 -77 -101 Net Fixed Assets 76 82 107 138 Other Long Term Assets 67 64 63 63 Long Term Investments and Associates 0 0 0 0 Total Long Term Assets 143 145 171 201 Total Assets 522 777 1031 1338 ST Debt and Current Portion of LT Debt 0 0 0 0 Accounts Payable 4 5 6 7 Other Current Liabilities 126 145 180 217 Total Current Liabilities 131 150 186 224 Long Term Debt 0 0 0 0 Other Long Term Liabilities 5 55 55 55 Total Long Term Liabilities 5 55 55 55 Share Capital 0 0 0 0 Share Premium 148 182 218 255 Other Reserves 0 0 0 0 Retained Earnings 238 390 573 803 Preferred Stock 0 0 0 0 Total Equity 386 572 791 1059 Total Liabilities and Equity 522 777 1031 1338 Source: Company reports and J.P. Morgan estimates.
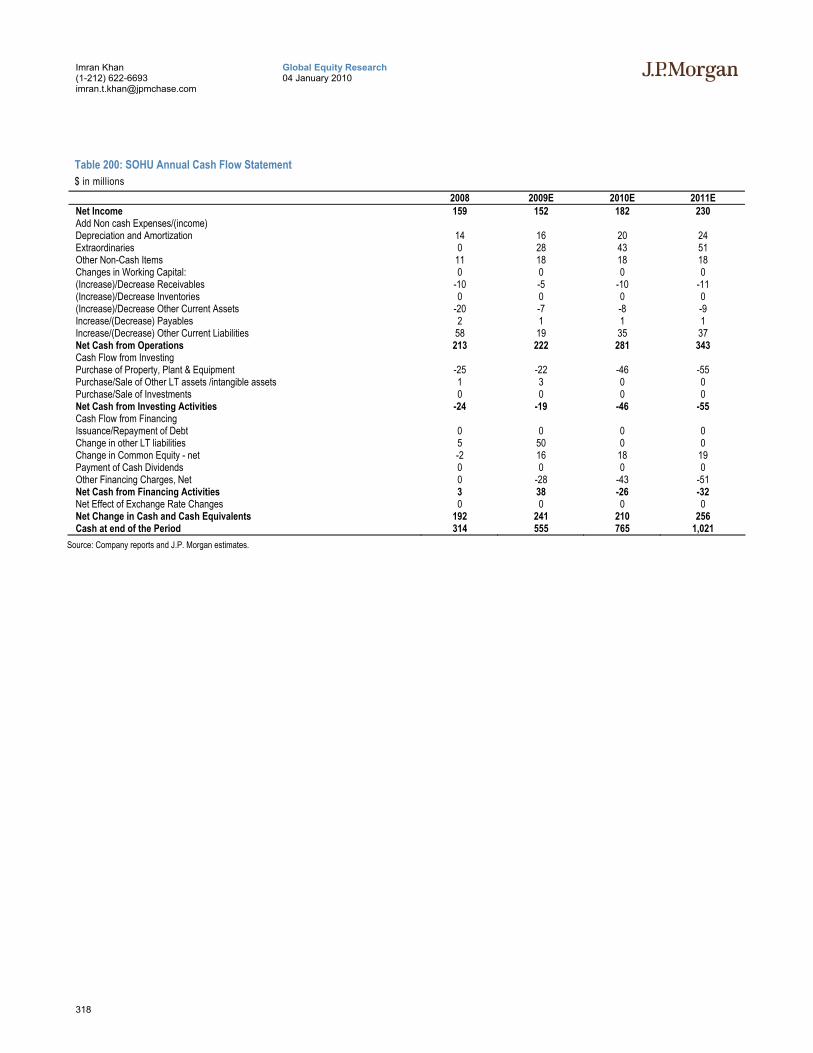
318
Global Equity Research 04 January 2010
Imran Khan (1-212) 622-6693 [email protected]
Table 200: SOHU Annual Cash Flow Statement $ in millions
2008 2009E 2010E 2011E Net Income 159 152 182 230 Add Non cash Expenses/(income) Depreciation and Amortization 14 16 20 24 Extraordinaries 0 28 43 51 Other Non-Cash Items 11 18 18 18 Changes in Working Capital: 0 0 0 0 (Increase)/Decrease Receivables -10 -5 -10 -11 (Increase)/Decrease Inventories 0 0 0 0 (Increase)/Decrease Other Current Assets -20 -7 -8 -9 Increase/(Decrease) Payables 2 1 1 1 Increase/(Decrease) Other Current Liabilities 58 19 35 37 Net Cash from Operations 213 222 281 343 Cash Flow from Investing Purchase of Property, Plant & Equipment -25 -22 -46 -55 Purchase/Sale of Other LT assets /intangible assets 1 3 0 0 Purchase/Sale of Investments 0 0 0 0 Net Cash from Investing Activities -24 -19 -46 -55 Cash Flow from Financing Issuance/Repayment of Debt 0 0 0 0 Change in other LT liabilities 5 50 0 0 Change in Common Equity - net -2 16 18 19 Payment of Cash Dividends 0 0 0 0 Other Financing Charges, Net 0 -28 -43 -51 Net Cash from Financing Activities 3 38 -26 -32 Net Effect of Exchange Rate Changes 0 0 0 0 Net Change in Cash and Cash Equivalents 192 241 210 256 Cash at end of the Period 314 555 765 1,021
Source: Company reports and J.P. Morgan estimates.
319
Global Equity Research 04 January 2010
Imran Khan (1-212) 622-6693 [email protected]
The9, Neutral, ($7.15) We remain Neutral on The9 due to the lack of visibility on new revenue drivers post the closure of WoW. Our Dec10 DCF-based price target is US$6.5 (earnings multiples not meaningful due to negative EPS) and below current cash of US$10.4 per share. We expect The9 to lose a significant amount of cash on new investments in R&D and marketing for future games.
• WoW used to contribute more than 90% of The9’s revenues. In addition, most of its previous games are also experiencing a revenue decline as of 3Q09. We believe the company will likely see an operating loss for the next two years, given the high fixed G&A cost as a listed company and R&D investments for future games. Due to lack of visibility for future earnings drivers, we remain Neutral on the stock at this time.
• While the company has net cash of US$10.4/share, we expect The9 to use a significant amount of the cash to invest in small game studios and upfront licensing fees. We expect cash to go down to US$ 6.3/share by end 2010. As such, cash as the support of the share price will be weakened.
• The9 reported net revenues of US$3.7 MM in 3Q09, down 91.1% QoQ and down 93.8% YoY. Diluted GAAP EPS were down to a loss of US$ 0.43 against consensus estimates of US$0.40 vs. our estimate of a loss of US$ 0.37. Revenues were mainly down because of the expiry of WoW license in 2Q09. 3Q09 was the first quarter with no contribution from WoW.
• 2010 drivers: In our view, the following factors will drive the shares in 2010: 1) success of new games and expansion packs for older games, 2) investments in R&D, and 3) cost-saving initiatives.
Our current estimates are presented in the table below:
Table 201: The9 Financial Snapshot $ in millions, except per share data
4Q'09E F'09E F'10E F'11E F'09E Y/Y F'10E Y/Y F'11E Y/Y J.P. Morgan Revenue 4.2 112.6 30.7 54.2 -55% -73% 77% EBITDA -9.4 -21.8 -35.1 -24.4 n.m. n.m. n.m. GAAP EPS -0.52 -1.66 -2.07 -1.72 n.m. n.m. n.m. Adj. EPS -0.42 -1.23 -1.72 -1.41 n.m. n.m. n.m. Consensus Revenue 4.3 115.8 48.1 85.1 -53% -59% 77% EBITDA -10.7 -24.4 -38.8 -24.4 n.m. n.m. n.m. GAAP EPS -0.54 -1.62 -1.82 -1.82 n.m. n.m. n.m. Adj. EPS -0.43 -1.40 -1.64 -1.41 n.m. n.m. n.m. Source: Bloomberg and J.P. Morgan estimates. Note: Adj. EPS excludes share-based compensation expense.
Our Estimates and Outlook for 2010 We forecast net revenue of US$30.7MM in 2010, down 73% Y/Y, and GAAP diluted EPS of US$(2.07), expanding from a loss of US$1.66 in 2009 , or adjusted EPS (ex-share-based expense) of US$(1.72), expanding from 2009’s loss of US$1.23. We forecast gross margin at 10.6% for 2010, down from 15.3% for 2009 due to no contribution from WoW. We expect adjusted operating margin (ex-share-based expense) of -167.4% for 2010, due to closure of WoW, and adjusted net margin of -143.3% for 2010, loss margin expanding from -27.9% for 2009.

320
Global Equity Research 04 January 2010
Imran Khan (1-212) 622-6693 [email protected]
Our Estimates and Outlook for 2011 For 2011, we forecast net revenue of US$54.2MM, up 77% Y/Y, and GAAP diluted EPS of US$(1.72), or adjusted EPS of US$(1.41). On margins, we forecast gross margin at 29.4% (better Y/Y with impact of contribution from new games); adjusted operating margin of -78.8% (down Y/Y) and adjusted net margin of -67.1% (also down Y/Y).
Price Target, Valuation and Rating Analysis We remain Neutral on The9 due to low earning visibility and expectations of cash decline from operating losses and R&D investments.
Our DCF-based price target is derived using WACC of 12.1% and terminal growth of 0%. The company has net cash of ~US$10.4 per share but we expect it to go down to US$6.3 per share by the end of 2010 on account of operating losses and R&D investments.
Risks to Our Rating and Price Target Risks to our price target and rating include: 1) larger-than-expected investments in game titles and studios, 2) new game launches could disappoint on the downside. We expect the positive share price drivers to be 1) better-than-expected performance of The9’s new game launches, and 2) the company being an acquisition target (due to its high cash).
321
Global Equity Research 04 January 2010
Imran Khan (1-212) 622-6693 [email protected]
Table 202: NCTY Annual Income Statement $ in millions INCOME STATEMENT 2008 2009E 2010E 2011E Revenue 249.1 112.6 30.7 54.2 Online games services 248.2 111.5 29.4 36.5 Game operation support 0.1 0.0 0.0 0.0 SMS services 0.0 0.0 0.0 0.0 Other revenue 0.7 1.0 1.3 1.3 COGS -145.2 -95.3 -27.5 -38.3 Gross Profit 103.9 17.3 3.3 16.0 Operating Expenses -84.3 -71.1 -63.5 -66.7 Sales & Mktg. expenses -15.1 -16.8 -12.6 -12.7 G&A expenses -46.5 -33.5 -30.6 -31.4 R&D expenses -10.7 -16.4 -19.3 -22.7 Other expenses -12.0 -4.4 0.0 0.0 Share-based compensation -7.6 -4.4 -8.8 -8.0 EBIT 19.6 -53.9 -60.2 -50.8 Adj. EBIT (ex-share-based comps.) 27.2 -49.5 -51.4 -42.8 EBITDA 60.7 -21.8 -35.1 -24.4 Equity earnings in affiliates -0.3 -0.3 -0.5 -0.5 Net Other Income 5.5 12.5 2.1 0.9 Pre Tax Profit 24.7 -41.7 -58.7 -50.4 Tax Expense/(Credit) 7.0 -0.6 -5.9 -6.1 Net Profit (after MI) 14.1 -42.3 -52.8 -44.4 Net Profit (excl 123R option exp.) 21.7 -31.4 -44.0 -36.4 Pre Tax EPS (US$) 0.89 -1.58 -2.34 -2.01 After Tax EPS (US$) 0.51 -1.61 -2.11 -1.76 After Tax EPS Diluted (US$) 0.51 -1.66 -2.07 -1.72 After Tax EPS Diluted excl 123R option exp. (US$) 0.78 -1.23 -1.72 -1.41 Margins (%) Gross Margin 41.7 15.3 10.6 29.4 Operating Margin (excl 123R option expense) 10.9 -43.9 -167.4 -78.8 EBITDA Margin 24.4 -19.3 -114.2 -45.0 Net Margin 5.7 -37.6 -171.9 -81.8 Net Margin (excl 123R option expense) 8.7 -27.9 -143.3 -67.1 Sequential Growth (%) Revenue 46.6 -54.8 -72.7 76.6 Gross Profit 34.9 -83.4 -81.1 389.6 Adj. EBIT -28.0 n.m. n.m. n.m. Pre Tax Profit -25.7 n.m. n.m. n.m. Net Profit -55.9 n.m. n.m. n.m. After Tax EPS Diluted -56.0 n.m. n.m. n.m. After Tax EPS Diluted excl 123R option exp. -43.5 n.m. n.m. n.m. Source: Company reports and J.P. Morgan estimates.
322
Global Equity Research 04 January 2010
Imran Khan (1-212) 622-6693 [email protected]
Table 203: NCTY Quarterly Income Statement $ in millions
1Q'08 2Q'08 3Q'08 4Q'08 1Q'09 2Q'09 3Q'09 4Q'09E 1Q'10E 2Q'10E 3Q'10E 4Q'10E Revenue 62.7 66.3 60.2 59.9 62.5 42.2 3.7 4.2 5.0 5.4 9.6 10.7 Online games services 62.5 66.2 59.9 59.7 62.2 41.9 3.6 3.9 4.7 5.1 9.2 10.4 Game operation support 0.0 0.0 0.0 0.0 0.0 0.0 0.0 0.0 0.0 0.0 0.0 0.0 SMS services 0.0 0.0 0.0 0.0 0.0 0.0 0.0 0.0 0.0 0.0 0.0 0.0 Other revenue 0.2 0.1 0.2 0.2 0.3 0.3 0.2 0.3 0.3 0.3 0.3 0.3 COGS -35.0 -37.6 -36.2 -36.5 -52.5 -32.8 -4.9 -5.1 -5.6 -5.9 -7.7 -8.3 Gross Profit 27.7 28.7 24.0 23.4 10.0 9.4 -1.2 -0.9 -0.6 -0.4 1.8 2.4 Operating Expenses -13.4 -14.6 -15.2 -41.3 -18.3 -22.3 -16.0 -14.5 -15.1 -15.9 -16.1 -16.4 Sales & Mktg. expenses -3.2 -3.9 -3.7 -4.4 -5.2 -5.6 -3.0 -3.1 -3.1 -3.2 -3.2 -3.2 G&A expenses -8.4 -8.5 -8.4 -21.3 -9.3 -7.8 -9.1 -7.3 -7.5 -7.7 -7.7 -7.8 R&D expenses -1.8 -2.3 -3.1 -3.6 -3.9 -4.6 -3.9 -4.1 -4.4 -4.8 -5.0 -5.1 Other expenses 0.0 0.0 0.0 -12.0 0.0 -4.4 0.0 0.0 0.0 0.0 0.0 0.0 Share-based compensation -1.7 -1.8 -1.8 -2.3 -2.3 -2.2 -3.9 -2.5 -2.2 -2.2 -2.2 -2.2 EBIT 14.3 14.1 8.8 -17.9 -8.4 -12.9 -17.2 -15.4 -15.8 -16.3 -14.2 -13.9 Adj. EBIT (ex-share-based comps.) 16.0 15.9 10.6 -15.6 -6.1 -10.7 -13.3 -12.9 -13.6 -14.1 -12.0 -11.7 EBITDA 24.1 24.5 19.4 -7.6 5.1 -0.8 -10.2 -9.4 -9.7 -10.2 -7.8 -7.3 Equity earnings in affiliates -0.1 -0.1 0.0 -0.1 0.0 -0.1 -0.1 -0.1 -0.1 -0.1 -0.1 -0.1 Net Other Income -1.7 1.4 3.9 1.9 1.3 1.0 9.3 1.0 0.7 0.6 0.4 0.4 Pre Tax Profit 12.5 15.5 12.7 -16.2 -7.1 -12.0 -8.0 -14.5 -15.2 -15.9 -13.9 -13.7 Tax Expense/(Credit) 1.5 1.0 0.9 3.5 0.1 0.0 0.7 -1.5 -1.5 -1.6 -1.4 -1.4 Net Profit (after MI) 10.8 14.4 11.9 -23.2 -6.9 -11.6 -10.8 -13.1 -13.7 -14.3 -12.5 -12.3 Net Profit (excl 123R option exp.) 12.5 16.2 13.7 -20.9 -4.6 -9.4 -6.9 -10.6 -11.5 -12.1 -10.3 -10.1 Pre Tax EPS (US$) 0.45 0.56 0.46 -0.59 -0.26 -0.43 -0.32 -0.58 -0.61 -0.63 -0.56 -0.55 After Tax EPS (US$) 0.39 0.52 0.43 -0.84 -0.25 -0.42 -0.43 -0.52 -0.55 -0.57 -0.50 -0.49 After Tax EPS Diluted (US$) 0.39 0.52 0.43 -0.85 -0.26 -0.46 -0.43 -0.52 -0.54 -0.56 -0.49 -0.48 After Tax EPS Diluted excl 123R option exp. (US$) 0.45 0.59 0.49 -0.76 -0.17 -0.37 -0.27 -0.42 -0.45 -0.47 -0.40 -0.40 Margins (%) Gross Margin 44.1 43.3 39.9 39.0 15.9 22.3 -31.8 -22.0 -12.5 -7.5 19.3 22.8 Operating Margin (excl 123R option expense) 25.5 23.9 17.7 -26.1 -9.7 -25.4 -355.4 -308.2 -271.5 -259.1 -125.7 -109.6 EBITDA Margin 38.4 36.9 32.3 -12.7 8.2 -2.0 -272.7 -223.8 -195.1 -187.7 -81.4 -68.5 Net Margin 17.2 21.8 19.7 -38.8 -11.0 -27.5 -288.9 -313.0 -273.9 -262.0 -131.0 -115.2 Net Margin (excl 123R option expense) 19.9 24.4 22.7 -34.9 -7.3 -22.3 -184.1 -253.2 -229.8 -221.6 -108.0 -94.6 Sequential Growth (%) 62.7 66.3 60.2 59.9 62.5 42.2 3.7 4.2 5.0 5.4 9.6 10.7 Revenue 62.5 66.2 59.9 59.7 62.2 41.9 3.6 3.9 4.7 5.1 9.2 10.4 Gross Profit 0.0 0.0 0.0 0.0 0.0 0.0 0.0 0.0 0.0 0.0 0.0 0.0 Adj. EBIT 0.0 0.0 0.0 0.0 0.0 0.0 0.0 0.0 0.0 0.0 0.0 0.0 Pre Tax Profit 0.2 0.1 0.2 0.2 0.3 0.3 0.2 0.3 0.3 0.3 0.3 0.3 Net Profit -35.0 -37.6 -36.2 -36.5 -52.5 -32.8 -4.9 -5.1 -5.6 -5.9 -7.7 -8.3 After Tax EPS Diluted 27.7 28.7 24.0 23.4 10.0 9.4 -1.2 -0.9 -0.6 -0.4 1.8 2.4 After Tax EPS Diluted excl 123R option exp. -13.4 -14.6 -15.2 -41.3 -18.3 -22.3 -16.0 -14.5 -15.1 -15.9 -16.1 -16.4 Source: Company reports and J.P. Morgan estimates.
323
Global Equity Research 04 January 2010
Imran Khan (1-212) 622-6693 [email protected]
Table 204: NCTY Annual Balance Sheet $ in millions
2008 2009E 2010E 2011E Cash and Cash Equivalents 325.1 197.7 156.1 134.6 Account Receivables 1.3 0.3 0.8 1.2 Inventory 18.4 0.9 2.3 3.3 Total Other Current Assets 20.3 9.3 9.3 9.3 Total Current Assets 365.2 208.2 168.5 148.3 Gross Fixed Assets 100.5 111.2 114.8 118.5 Accumulated Depreciation -71.2 -75.2 -81.9 -88.6 Net Fixed Assets 29.3 36.0 32.9 29.9 Other Long Term Assets (Intangibles + Goodwill) 24.4 14.4 22.5 16.5 Long Term Investments and Associates 59.0 58.7 58.2 57.6 Total Long Term Assets 112.6 109.1 113.6 104.1 Total Assets 385.4 385.5 385.7 385.8 ST Debt and Current Portion of LT Debt 18.9 0.0 0.0 0.0 Accounts Payable 50.5 3.7 9.4 13.2 Other Current Liabilities 10.2 0.7 1.9 2.6 Total Current Liabilities 79.6 4.4 11.2 15.8 Long Term Debt 0.0 0.0 0.0 0.0 Other Long Term Liabilities 0.0 0.1 0.1 0.1 Total Long Term Liabilities 0.0 0.1 0.1 0.1 Share Capital 0.3 0.3 0.3 0.3 Share Premium 311.7 304.3 315.0 325.1 Other Reserves 3.6 4.1 4.1 4.1 Retained Earnings 82.5 4.1 -48.7 -93.0 Preferred Stock 0.0 0.0 0.0 0.0 Total Equity 398.1 312.8 270.7 236.5 Total Liabilities and Equity 477.7 317.3 282.1 252.4 Source: Company reports and J.P. Morgan estimates.
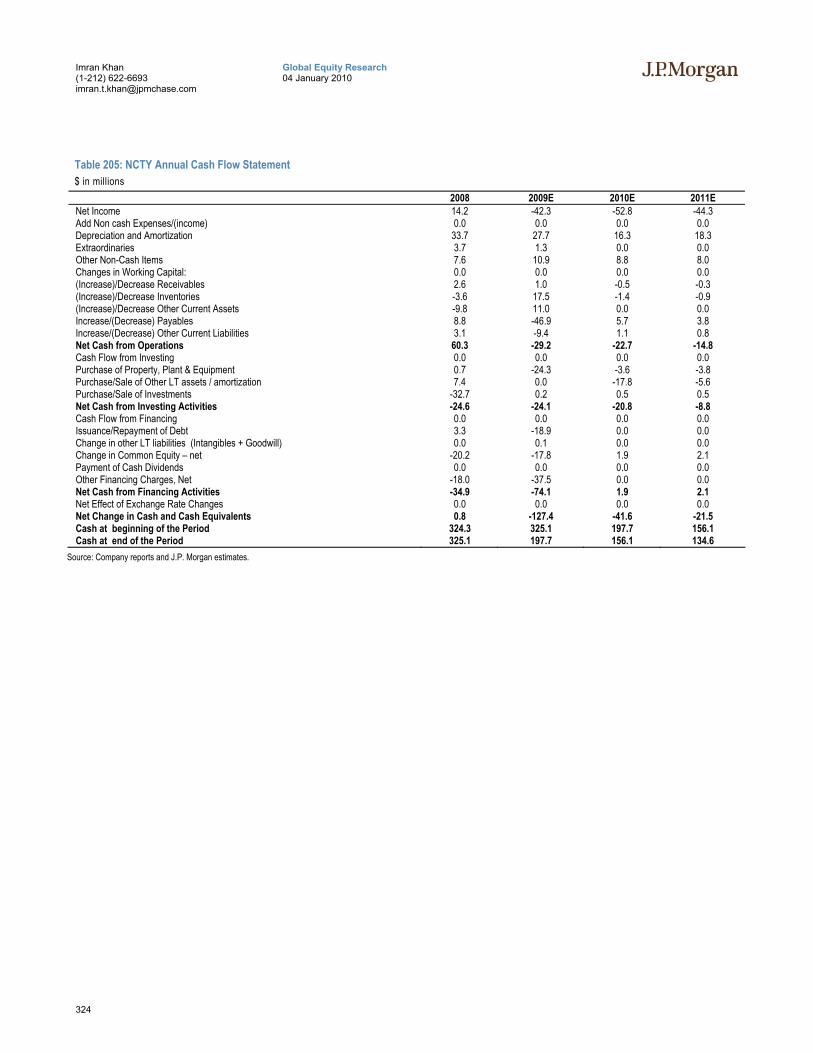
324
Global Equity Research 04 January 2010
Imran Khan (1-212) 622-6693 [email protected]
Table 205: NCTY Annual Cash Flow Statement $ in millions
2008 2009E 2010E 2011E Net Income 14.2 -42.3 -52.8 -44.3 Add Non cash Expenses/(income) 0.0 0.0 0.0 0.0 Depreciation and Amortization 33.7 27.7 16.3 18.3 Extraordinaries 3.7 1.3 0.0 0.0 Other Non-Cash Items 7.6 10.9 8.8 8.0 Changes in Working Capital: 0.0 0.0 0.0 0.0 (Increase)/Decrease Receivables 2.6 1.0 -0.5 -0.3 (Increase)/Decrease Inventories -3.6 17.5 -1.4 -0.9 (Increase)/Decrease Other Current Assets -9.8 11.0 0.0 0.0 Increase/(Decrease) Payables 8.8 -46.9 5.7 3.8 Increase/(Decrease) Other Current Liabilities 3.1 -9.4 1.1 0.8 Net Cash from Operations 60.3 -29.2 -22.7 -14.8 Cash Flow from Investing 0.0 0.0 0.0 0.0 Purchase of Property, Plant & Equipment 0.7 -24.3 -3.6 -3.8 Purchase/Sale of Other LT assets / amortization 7.4 0.0 -17.8 -5.6 Purchase/Sale of Investments -32.7 0.2 0.5 0.5 Net Cash from Investing Activities -24.6 -24.1 -20.8 -8.8 Cash Flow from Financing 0.0 0.0 0.0 0.0 Issuance/Repayment of Debt 3.3 -18.9 0.0 0.0 Change in other LT liabilities (Intangibles + Goodwill) 0.0 0.1 0.0 0.0 Change in Common Equity – net -20.2 -17.8 1.9 2.1 Payment of Cash Dividends 0.0 0.0 0.0 0.0 Other Financing Charges, Net -18.0 -37.5 0.0 0.0 Net Cash from Financing Activities -34.9 -74.1 1.9 2.1 Net Effect of Exchange Rate Changes 0.0 0.0 0.0 0.0 Net Change in Cash and Cash Equivalents 0.8 -127.4 -41.6 -21.5 Cash at beginning of the Period 324.3 325.1 197.7 156.1 Cash at end of the Period 325.1 197.7 156.1 134.6
Source: Company reports and J.P. Morgan estimates.
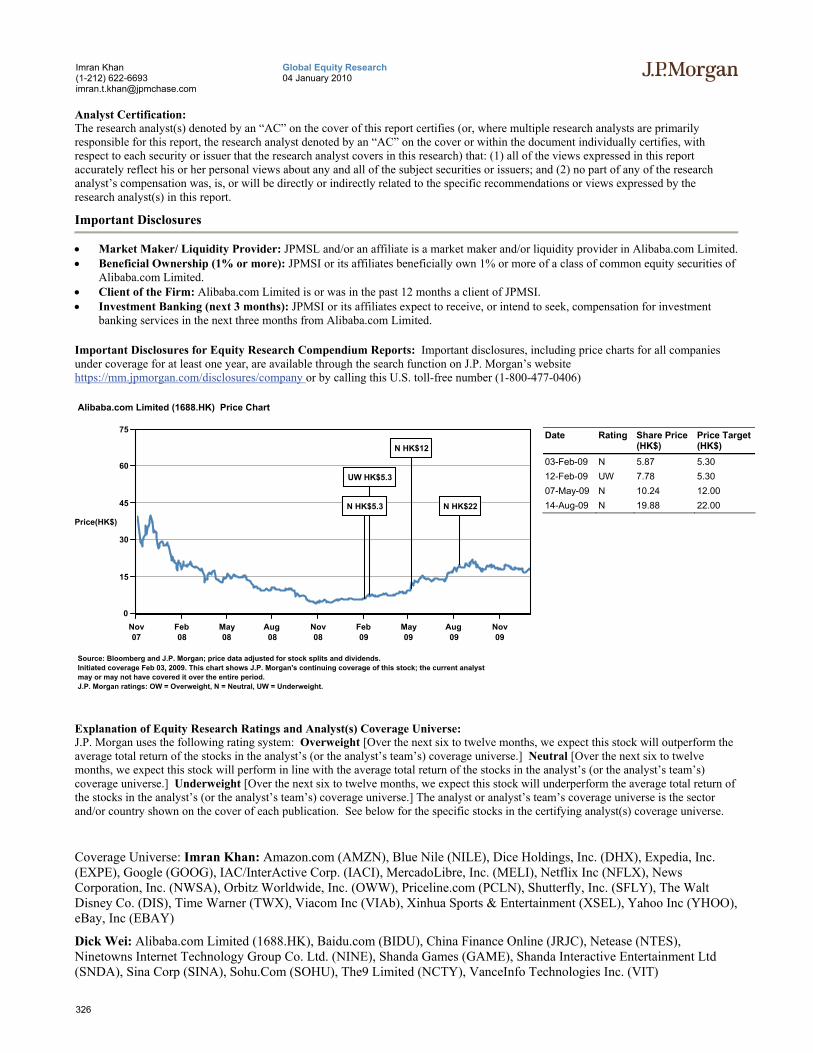
326
Global Equity Research 04 January 2010
Imran Khan (1-212) 622-6693 [email protected]
Analyst Certification: The research analyst(s) denoted by an “AC” on the cover of this report certifies (or, where multiple research analysts are primarily responsible for this report, the research analyst denoted by an “AC” on the cover or within the document individually certifies, with respect to each security or issuer that the research analyst covers in this research) that: (1) all of the views expressed in this report accurately reflect his or her personal views about any and all of the subject securities or issuers; and (2) no part of any of the research analyst’s compensation was, is, or will be directly or indirectly related to the specific recommendations or views expressed by the research analyst(s) in this report.
Important Disclosures
• Market Maker/ Liquidity Provider: JPMSL and/or an affiliate is a market maker and/or liquidity provider in Alibaba.com Limited. • Beneficial Ownership (1% or more): JPMSI or its affiliates beneficially own 1% or more of a class of common equity securities of
Alibaba.com Limited. • Client of the Firm: Alibaba.com Limited is or was in the past 12 months a client of JPMSI. • Investment Banking (next 3 months): JPMSI or its affiliates expect to receive, or intend to seek, compensation for investment
banking services in the next three months from Alibaba.com Limited.
Important Disclosures for Equity Research Compendium Reports: Important disclosures, including price charts for all companies under coverage for at least one year, are available through the search function on J.P. Morgan’s website https://mm.jpmorgan.com/disclosures/company or by calling this U.S. toll-free number (1-800-477-0406)
0
15
30
45
60
75
Price(HK$)
Nov07
Feb08
May08
Aug08
Nov08
Feb09
May09
Aug09
Nov09
Alibaba.com Limited (1688.HK) Price Chart
N HK$12
UW HK$5.3
N HK$5.3 N HK$22
Source: Bloomberg and J.P. Morgan; price data adjusted for stock splits and dividends.Initiated coverage Feb 03, 2009. This chart shows J.P. Morgan's continuing coverage of this stock; the current analystmay or may not have covered it over the entire period.J.P. Morgan ratings: OW = Overweight, N = Neutral, UW = Underweight.
Date Rating Share Price (HK$)
Price Target (HK$)
03-Feb-09 N 5.87 5.30 12-Feb-09 UW 7.78 5.30 07-May-09 N 10.24 12.00 14-Aug-09 N 19.88 22.00
Explanation of Equity Research Ratings and Analyst(s) Coverage Universe: J.P. Morgan uses the following rating system: Overweight [Over the next six to twelve months, we expect this stock will outperform the average total return of the stocks in the analyst’s (or the analyst’s team’s) coverage universe.] Neutral [Over the next six to twelve months, we expect this stock will perform in line with the average total return of the stocks in the analyst’s (or the analyst’s team’s) coverage universe.] Underweight [Over the next six to twelve months, we expect this stock will underperform the average total return of the stocks in the analyst’s (or the analyst’s team’s) coverage universe.] The analyst or analyst’s team’s coverage universe is the sector and/or country shown on the cover of each publication. See below for the specific stocks in the certifying analyst(s) coverage universe.
Coverage Universe: Imran Khan: Amazon.com (AMZN), Blue Nile (NILE), Dice Holdings, Inc. (DHX), Expedia, Inc. (EXPE), Google (GOOG), IAC/InterActive Corp. (IACI), MercadoLibre, Inc. (MELI), Netflix Inc (NFLX), News Corporation, Inc. (NWSA), Orbitz Worldwide, Inc. (OWW), Priceline.com (PCLN), Shutterfly, Inc. (SFLY), The Walt Disney Co. (DIS), Time Warner (TWX), Viacom Inc (VIAb), Xinhua Sports & Entertainment (XSEL), Yahoo Inc (YHOO), eBay, Inc (EBAY)
Dick Wei: Alibaba.com Limited (1688.HK), Baidu.com (BIDU), China Finance Online (JRJC), Netease (NTES), Ninetowns Internet Technology Group Co. Ltd. (NINE), Shanda Games (GAME), Shanda Interactive Entertainment Ltd (SNDA), Sina Corp (SINA), Sohu.Com (SOHU), The9 Limited (NCTY), VanceInfo Technologies Inc. (VIT)
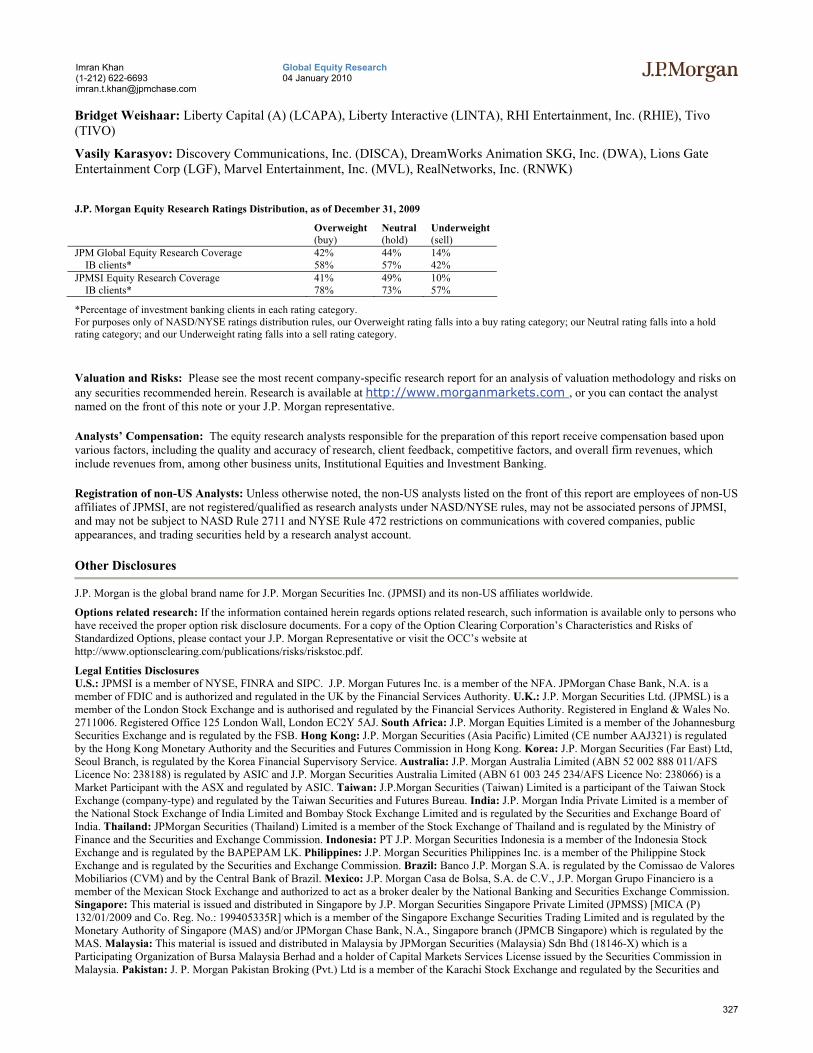
327
Global Equity Research 04 January 2010
Imran Khan (1-212) 622-6693 [email protected]
Bridget Weishaar: Liberty Capital (A) (LCAPA), Liberty Interactive (LINTA), RHI Entertainment, Inc. (RHIE), Tivo (TIVO)
Vasily Karasyov: Discovery Communications, Inc. (DISCA), DreamWorks Animation SKG, Inc. (DWA), Lions Gate Entertainment Corp (LGF), Marvel Entertainment, Inc. (MVL), RealNetworks, Inc. (RNWK)
J.P. Morgan Equity Research Ratings Distribution, as of December 31, 2009
Overweight (buy)
Neutral (hold)
Underweight (sell)
JPM Global Equity Research Coverage 42% 44% 14% IB clients* 58% 57% 42% JPMSI Equity Research Coverage 41% 49% 10% IB clients* 78% 73% 57%
*Percentage of investment banking clients in each rating category. For purposes only of NASD/NYSE ratings distribution rules, our Overweight rating falls into a buy rating category; our Neutral rating falls into a hold rating category; and our Underweight rating falls into a sell rating category.
Valuation and Risks: Please see the most recent company-specific research report for an analysis of valuation methodology and risks on any securities recommended herein. Research is available at http://www.morganmarkets.com , or you can contact the analyst named on the front of this note or your J.P. Morgan representative.
Analysts’ Compensation: The equity research analysts responsible for the preparation of this report receive compensation based upon various factors, including the quality and accuracy of research, client feedback, competitive factors, and overall firm revenues, which include revenues from, among other business units, Institutional Equities and Investment Banking.
Registration of non-US Analysts: Unless otherwise noted, the non-US analysts listed on the front of this report are employees of non-US affiliates of JPMSI, are not registered/qualified as research analysts under NASD/NYSE rules, may not be associated persons of JPMSI, and may not be subject to NASD Rule 2711 and NYSE Rule 472 restrictions on communications with covered companies, public appearances, and trading securities held by a research analyst account.
Other Disclosures
J.P. Morgan is the global brand name for J.P. Morgan Securities Inc. (JPMSI) and its non-US affiliates worldwide.
Options related research: If the information contained herein regards options related research, such information is available only to persons who have received the proper option risk disclosure documents. For a copy of the Option Clearing Corporation’s Characteristics and Risks of Standardized Options, please contact your J.P. Morgan Representative or visit the OCC’s website at http://www.optionsclearing.com/publications/risks/riskstoc.pdf.
Legal Entities Disclosures U.S.: JPMSI is a member of NYSE, FINRA and SIPC. J.P. Morgan Futures Inc. is a member of the NFA. JPMorgan Chase Bank, N.A. is a member of FDIC and is authorized and regulated in the UK by the Financial Services Authority. U.K.: J.P. Morgan Securities Ltd. (JPMSL) is a member of the London Stock Exchange and is authorised and regulated by the Financial Services Authority. Registered in England & Wales No. 2711006. Registered Office 125 London Wall, London EC2Y 5AJ. South Africa: J.P. Morgan Equities Limited is a member of the Johannesburg Securities Exchange and is regulated by the FSB. Hong Kong: J.P. Morgan Securities (Asia Pacific) Limited (CE number AAJ321) is regulated by the Hong Kong Monetary Authority and the Securities and Futures Commission in Hong Kong. Korea: J.P. Morgan Securities (Far East) Ltd, Seoul Branch, is regulated by the Korea Financial Supervisory Service. Australia: J.P. Morgan Australia Limited (ABN 52 002 888 011/AFS Licence No: 238188) is regulated by ASIC and J.P. Morgan Securities Australia Limited (ABN 61 003 245 234/AFS Licence No: 238066) is a Market Participant with the ASX and regulated by ASIC. Taiwan: J.P.Morgan Securities (Taiwan) Limited is a participant of the Taiwan Stock Exchange (company-type) and regulated by the Taiwan Securities and Futures Bureau. India: J.P. Morgan India Private Limited is a member of the National Stock Exchange of India Limited and Bombay Stock Exchange Limited and is regulated by the Securities and Exchange Board of India. Thailand: JPMorgan Securities (Thailand) Limited is a member of the Stock Exchange of Thailand and is regulated by the Ministry of Finance and the Securities and Exchange Commission. Indonesia: PT J.P. Morgan Securities Indonesia is a member of the Indonesia Stock Exchange and is regulated by the BAPEPAM LK. Philippines: J.P. Morgan Securities Philippines Inc. is a member of the Philippine Stock Exchange and is regulated by the Securities and Exchange Commission. Brazil: Banco J.P. Morgan S.A. is regulated by the Comissao de Valores Mobiliarios (CVM) and by the Central Bank of Brazil. Mexico: J.P. Morgan Casa de Bolsa, S.A. de C.V., J.P. Morgan Grupo Financiero is a member of the Mexican Stock Exchange and authorized to act as a broker dealer by the National Banking and Securities Exchange Commission. Singapore: This material is issued and distributed in Singapore by J.P. Morgan Securities Singapore Private Limited (JPMSS) [MICA (P) 132/01/2009 and Co. Reg. No.: 199405335R] which is a member of the Singapore Exchange Securities Trading Limited and is regulated by the Monetary Authority of Singapore (MAS) and/or JPMorgan Chase Bank, N.A., Singapore branch (JPMCB Singapore) which is regulated by the MAS. Malaysia: This material is issued and distributed in Malaysia by JPMorgan Securities (Malaysia) Sdn Bhd (18146-X) which is a Participating Organization of Bursa Malaysia Berhad and a holder of Capital Markets Services License issued by the Securities Commission in Malaysia. Pakistan: J. P. Morgan Pakistan Broking (Pvt.) Ltd is a member of the Karachi Stock Exchange and regulated by the Securities and
328
Global Equity Research 04 January 2010
Imran Khan (1-212) 622-6693 [email protected]
Exchange Commission of Pakistan. Saudi Arabia: J.P. Morgan Saudi Arabia Ltd. is authorised by the Capital Market Authority of the Kingdom of Saudi Arabia (CMA) to carry out dealing as an agent, arranging, advising and custody, with respect to securities business under licence number 35-07079 and its registered address is at 8th Floor, Al-Faisaliyah Tower, King Fahad Road, P.O. Box 51907, Riyadh 11553, Kingdom of Saudi Arabia. Dubai: JPMorgan Chase Bank, N.A., Dubai Branch is regulated by the Dubai Financial Services Authority (DFSA) and its registered address is Dubai International Financial Centre - Building 3, Level 7, PO Box 506551, Dubai, UAE.
Country and Region Specific Disclosures U.K. and European Economic Area (EEA): Unless specified to the contrary, issued and approved for distribution in the U.K. and the EEA by JPMSL. Investment research issued by JPMSL has been prepared in accordance with JPMSL's policies for managing conflicts of interest arising as a result of publication and distribution of investment research. Many European regulators require that a firm to establish, implement and maintain such a policy. This report has been issued in the U.K. only to persons of a kind described in Article 19 (5), 38, 47 and 49 of the Financial Services and Markets Act 2000 (Financial Promotion) Order 2005 (all such persons being referred to as "relevant persons"). This document must not be acted on or relied on by persons who are not relevant persons. Any investment or investment activity to which this document relates is only available to relevant persons and will be engaged in only with relevant persons. In other EEA countries, the report has been issued to persons regarded as professional investors (or equivalent) in their home jurisdiction. Australia: This material is issued and distributed by JPMSAL in Australia to “wholesale clients” only. JPMSAL does not issue or distribute this material to “retail clients.” The recipient of this material must not distribute it to any third party or outside Australia without the prior written consent of JPMSAL. For the purposes of this paragraph the terms “wholesale client” and “retail client” have the meanings given to them in section 761G of the Corporations Act 2001. Germany: This material is distributed in Germany by J.P. Morgan Securities Ltd., Frankfurt Branch and J.P.Morgan Chase Bank, N.A., Frankfurt Branch which are regulated by the Bundesanstalt für Finanzdienstleistungsaufsicht. Hong Kong: The 1% ownership disclosure as of the previous month end satisfies the requirements under Paragraph 16.5(a) of the Hong Kong Code of Conduct for Persons Licensed by or Registered with the Securities and Futures Commission. (For research published within the first ten days of the month, the disclosure may be based on the month end data from two months’ prior.) J.P. Morgan Broking (Hong Kong) Limited is the liquidity provider for derivative warrants issued by J.P. Morgan Structured Products B.V. and listed on the Stock Exchange of Hong Kong Limited. An updated list can be found on HKEx website: http://www.hkex.com.hk/prod/dw/Lp.htm. Japan: There is a risk that a loss may occur due to a change in the price of the shares in the case of share trading, and that a loss may occur due to the exchange rate in the case of foreign share trading. In the case of share trading, JPMorgan Securities Japan Co., Ltd., will be receiving a brokerage fee and consumption tax (shouhizei) calculated by multiplying the executed price by the commission rate which was individually agreed between JPMorgan Securities Japan Co., Ltd., and the customer in advance. Financial Instruments Firms: JPMorgan Securities Japan Co., Ltd., Kanto Local Finance Bureau (kinsho) No. 82 Participating Association / Japan Securities Dealers Association, The Financial Futures Association of Japan. Korea: This report may have been edited or contributed to from time to time by affiliates of J.P. Morgan Securities (Far East) Ltd, Seoul Branch. Singapore: JPMSS and/or its affiliates may have a holding in any of the securities discussed in this report; for securities where the holding is 1% or greater, the specific holding is disclosed in the Important Disclosures section above. India: For private circulation only, not for sale. Pakistan: For private circulation only, not for sale. New Zealand: This material is issued and distributed by JPMSAL in New Zealand only to persons whose principal business is the investment of money or who, in the course of and for the purposes of their business, habitually invest money. JPMSAL does not issue or distribute this material to members of "the public" as determined in accordance with section 3 of the Securities Act 1978. The recipient of this material must not distribute it to any third party or outside New Zealand without the prior written consent of JPMSAL. Canada: The information contained herein is not, and under no circumstances is to be construed as, a prospectus, an advertisement, a public offering, an offer to sell securities described herein, or solicitation of an offer to buy securities described herein, in Canada or any province or territory thereof. Any offer or sale of the securities described herein in Canada will be made only under an exemption from the requirements to file a prospectus with the relevant Canadian securities regulators and only by a dealer properly registered under applicable securities laws or, alternatively, pursuant to an exemption from the dealer registration requirement in the relevant province or territory of Canada in which such offer or sale is made. The information contained herein is under no circumstances to be construed as investment advice in any province or territory of Canada and is not tailored to the needs of the recipient. To the extent that the information contained herein references securities of an issuer incorporated, formed or created under the laws of Canada or a province or territory of Canada, any trades in such securities must be conducted through a dealer registered in Canada. No securities commission or similar regulatory authority in Canada has reviewed or in any way passed judgment upon these materials, the information contained herein or the merits of the securities described herein, and any representation to the contrary is an offence. Dubai: This report has been issued to persons regarded as professional clients as defined under the DFSA rules.
General: Additional information is available upon request. Information has been obtained from sources believed to be reliable but JPMorgan Chase & Co. or its affiliates and/or subsidiaries (collectively J.P. Morgan) do not warrant its completeness or accuracy except with respect to any disclosures relative to JPMSI and/or its affiliates and the analyst’s involvement with the issuer that is the subject of the research. All pricing is as of the close of market for the securities discussed, unless otherwise stated. Opinions and estimates constitute our judgment as of the date of this material and are subject to change without notice. Past performance is not indicative of future results. This material is not intended as an offer or solicitation for the purchase or sale of any financial instrument. The opinions and recommendations herein do not take into account individual client circumstances, objectives, or needs and are not intended as recommendations of particular securities, financial instruments or strategies to particular clients. The recipient of this report must make its own independent decisions regarding any securities or financial instruments mentioned herein. JPMSI distributes in the U.S. research published by non-U.S. affiliates and accepts responsibility for its contents. Periodic updates may be provided on companies/industries based on company specific developments or announcements, market conditions or any other publicly available information. Clients should contact analysts and execute transactions through a J.P. Morgan subsidiary or affiliate in their home jurisdiction unless governing law permits otherwise.
“Other Disclosures” last revised December 7, 2009.
Copyright 2009 JPMorgan Chase & Co. All rights reserved. This report or any portion hereof may not be reprinted, sold or redistributed without the written consent of J.P. Morgan.