Embed Size (px)
Citation preview

Quantitative StrategiesMarket Risk, Asset Allocation, Security
Selection
MTA Educational Web SeriesFebruary 14, 2012
Kevin G. Hockert, CMT
Quantitative Research
• formal systematic process in which numerical data are used to obtain information about securities and financial markets
• describe variables
• examine relationships among variables
• assess probabilities associated with cause and effect interactions between variables
strategy development considerations
• know thyself
• time frame- frequency of trades
• absolute or relative returns
• drawdowns
• simplicity
• practicality
• sweetspot and limitations
Testing
• Hypothesis
• Test – in sample, out of sample
• Indicators
• Strategy
Quantitative Strategy
• quantitative process can improve ability to collect, assimilate and apply information
• scientific repeatable process with definable prospects
• methodical, systematic approaches to managing market risk, allocating portfolio capital and security selection
• reduce emotional and subjective components of investment decision making process
Quantitative strategies
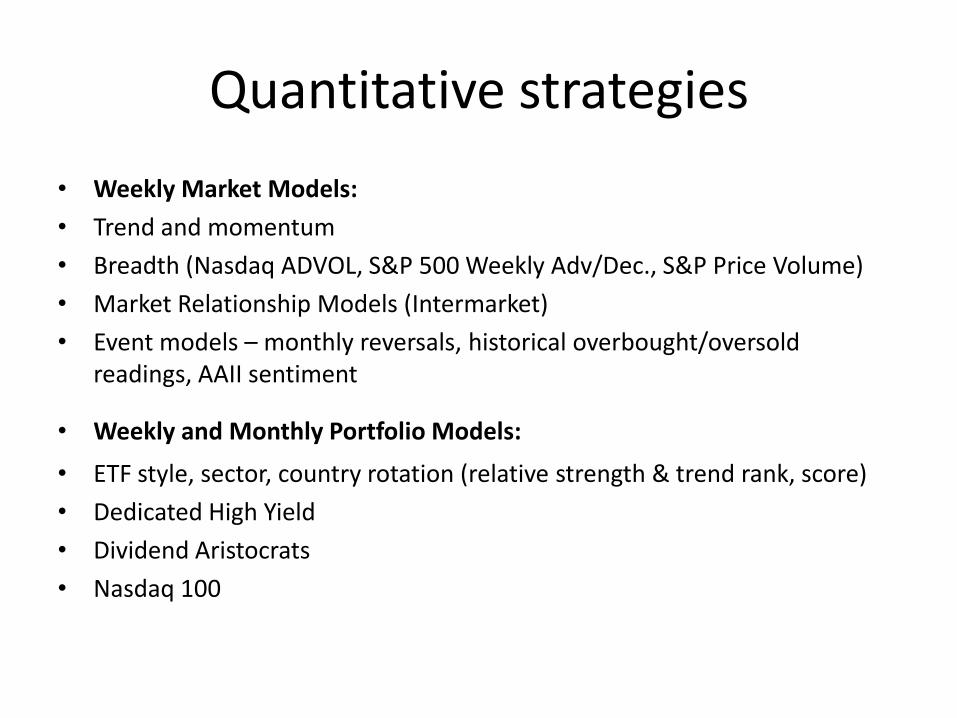
• Weekly Market Models:
• Trend and momentum
• Breadth (Nasdaq ADVOL, S&P 500 Weekly Adv/Dec., S&P Price Volume)
• Market Relationship Models (Intermarket)
• Event models – monthly reversals, historical overbought/oversold readings, AAII sentiment
• Weekly and Monthly Portfolio Models:
• ETF style, sector, country rotation (relative strength & trend rank, score)
• Dedicated High Yield
• Dividend Aristocrats
• Nasdaq 100
Monthly Reversals
• Definition =
• Low of current month < prior monthly low
• Close of current month > close of prior month
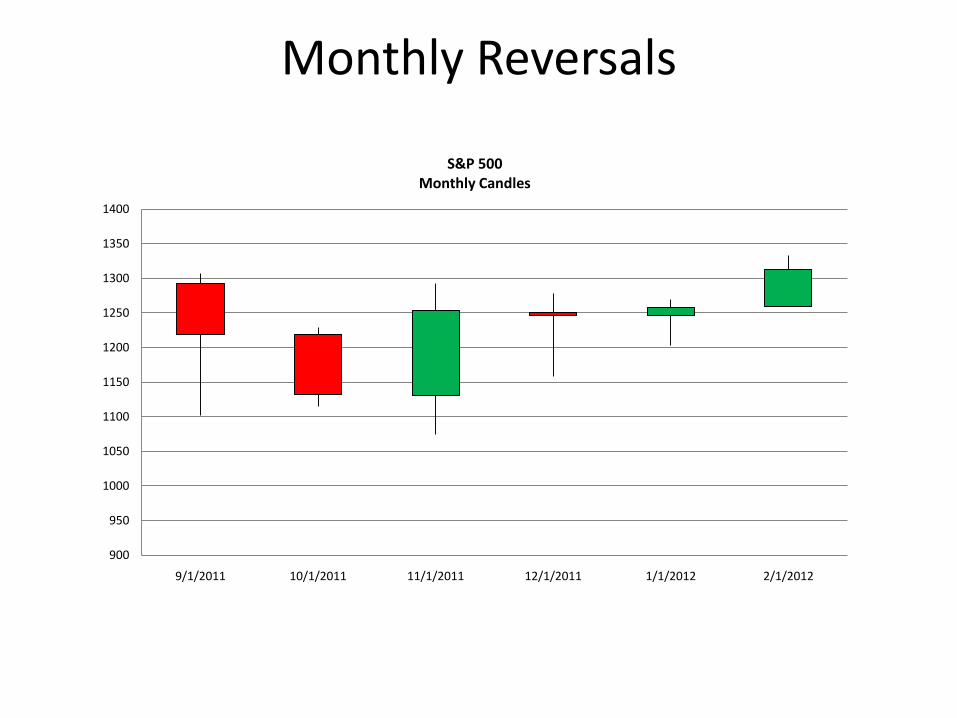
Monthly Reversals
900
950
1000
1050
1100
1150
1200
1250
1300
1350
1400
9/1/2011 10/1/2011 11/1/2011 12/1/2011 1/1/2012 2/1/2012
S&P 500 Monthly Candles
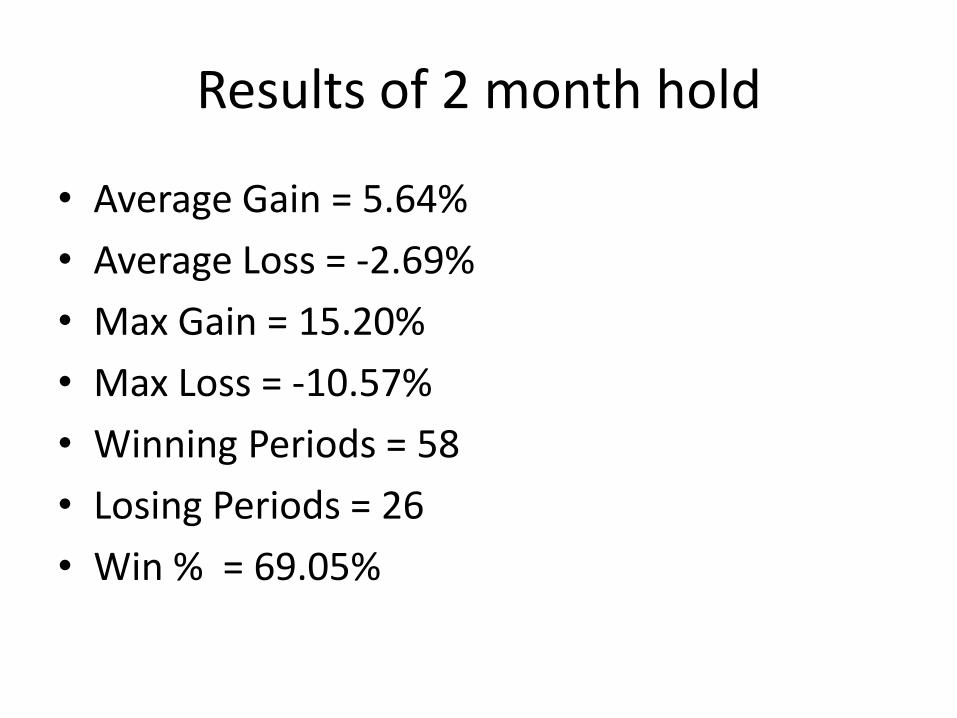
Results of 2 month hold
• Average Gain = 5.64%
• Average Loss = -2.69%
• Max Gain = 15.20%
• Max Loss = -10.57%
• Winning Periods = 58
• Losing Periods = 26
• Win % = 69.05%
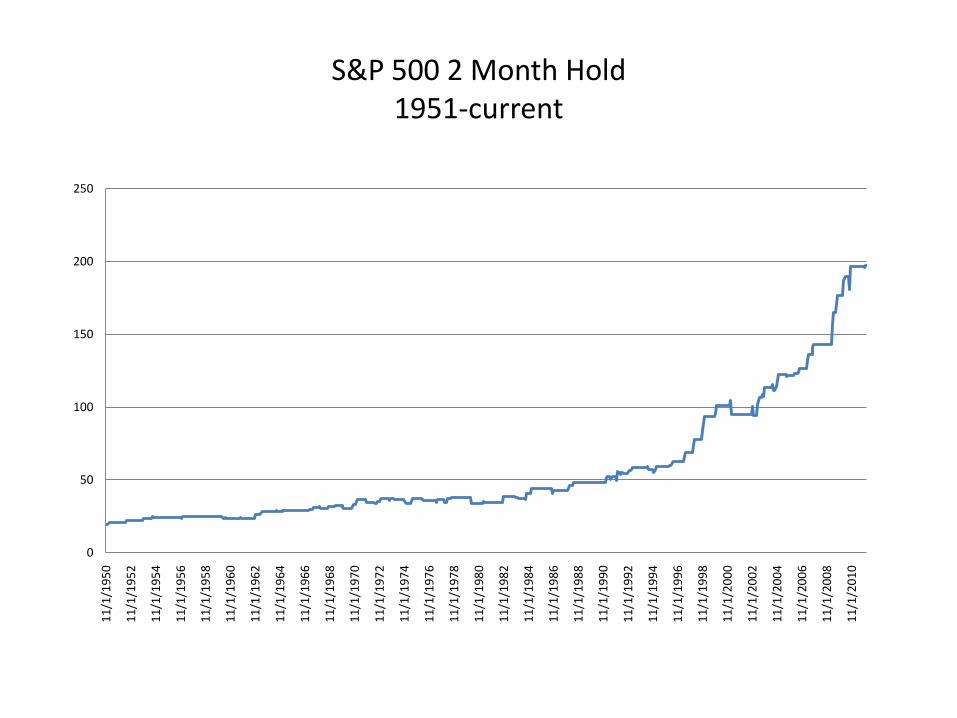
S&P 500 2 Month Hold1951-current
0
50
100
150
200
250
11
/1/1
95
0
11
/1/1
95
2
11
/1/1
95
4
11
/1/1
95
6
11
/1/1
95
8
11
/1/1
96
0
11
/1/1
96
2
11
/1/1
96
4
11
/1/1
96
6
11
/1/1
96
8
11
/1/1
97
0
11
/1/1
97
2
11
/1/1
97
4
11
/1/1
97
6
11
/1/1
97
8
11
/1/1
98
0
11
/1/1
98
2
11
/1/1
98
4
11
/1/1
98
6
11
/1/1
98
8
11
/1/1
99
0
11
/1/1
99
2
11
/1/1
99
4
11
/1/1
99
6
11
/1/1
99
8
11
/1/2
00
0
11
/1/2
00
2
11
/1/2
00
4
11
/1/2
00
6
11
/1/2
00
8
11
/1/2
01
0

The magnitude of the October rally has made the history books as the 11th largest since 1950. Needless to say, it is likely that U.S. equities will digest their recent gains over the next several days before attempting a move higher. Large rallies such as this are rare and typically occur in prolonged downtrends. Results are mixed 1 to 3 months out unless we look at periods where trailing
12 month trailing returns are positive (like now) in which case returns are generally higher 2 to 3 months out.
Date Lo-Hi%12M ROC 1 M Out 2 M Out 3 M Out
11/2/1987 51.96% 3.20% -8.53% -1.87% 2.10%
11/3/2008 38.97% -37.47% -7.48% -6.76% -14.75%
12/1/2008 35.96% -39.49% 0.78% -7.85% -17.98%
8/1/2002 28.20% -24.74% 0.49% -10.57% -2.84%
6/1/1962 25.97% -10.41% -8.18% -2.35% -0.86%
4/1/2009 24.92% -39.68% 9.39% 15.20% 15.22%
11/1/1974 24.51% -31.76% -5.32% -7.23% 4.17%
10/1/2001 22.30% -27.54% 1.81% 9.46% 10.29%
4/1/1980 21.34% 0.49% 4.11% 8.96% 11.90%
9/3/1974 20.41% -30.79% -11.93% 2.43% -3.02%
11/1/2011 20.27% 5.92% ? ? ?
Date Lo-Hi%12M ROC 1 M Out 2 M Out 3 M Out
6/1/1970 19.98% -26.01% -5.00% 1.96% 6.49%
11/2/1998 19.54% 20.12% 5.91% 11.88% 16.47%
3/2/2009 19.13% -44.76% 8.54% 18.74% 25.04%
9/1/2011 18.69% 16.16% -7.18% 2.82% ?
11/1/2002 18.06% -16.42% 5.71% -0.67% -3.39%
10/1/2008 17.77% -23.61% -16.94% -23.16% -22.56%
9/1/1982 17.67% -2.67% 0.76% 11.89% 15.91%
2/2/2009 17.35% -40.09% -10.99% -3.39% 5.68%
4/2/2001 17.22% -22.57% 7.68% 8.23% 5.52%
9/1/1998 17.19% 6.43% 6.24% 14.77% 21.56%
11/1/1982 16.85% 9.71% 3.60% 5.17% 8.66%
November 1, 2011
• Many strategists, have drawn comparisons to the May 2008 high which was also preceded by a 5 month decline.
• There are several differences however: May of 2008 was not an upside monthly reversal
• The recent rally off of the October 4th, 1074 low has retraced more than 61.8% of the decline from the 1370 high earlier this year while the rally off of the March 2008 low did not.
• Market internals (acceleration of advance vs. declines and up volume vs. down volume) have achieved levels typically associated with intermediate term advances
Monthly Reversals
• Simple pattern
• Rare occurrence (84 of past 720 months)
• Little or no interpretation
Market Risk
• Market trend and momentum
• Market Internals (breadth adv/dec., Hi-Low, % of 10 and 30 Week)
• Market externals (intermarket relationships –stocks vs. bonds, large vs. small, commodities vs. bonds, high yield vs. treasury)

Advance Decline
• represents the amount of liquidity in the markets
• one stock – one vote
• Nasdaq preferred over NYSE
• advance decline line – moves too slow
• acceleration/deceleration in advancing vs. declining issues tends to expand and contract representing “liquidity waves”

McClellan
• Sherman and Marion McClellan created the McClellan Oscillator and Summation Index (son Tom continues on tradition of innovative indicator development)
• Oscillator – difference of the 10% and 5% trend of advances minus declines divided by advances plus declines
• Summation Index – addition of the daily oscillator values

Nasdaq Summation Index at a 20 day high and Nasdaq 50 day MA positive slope
Test Period Nasdaq Average 21 Day Return Strategy Average 21 Day Return
1978-2000 1.55% 1.88%
2000-current 0.09% 0.49%
1978 - current 1.03% 1.43%
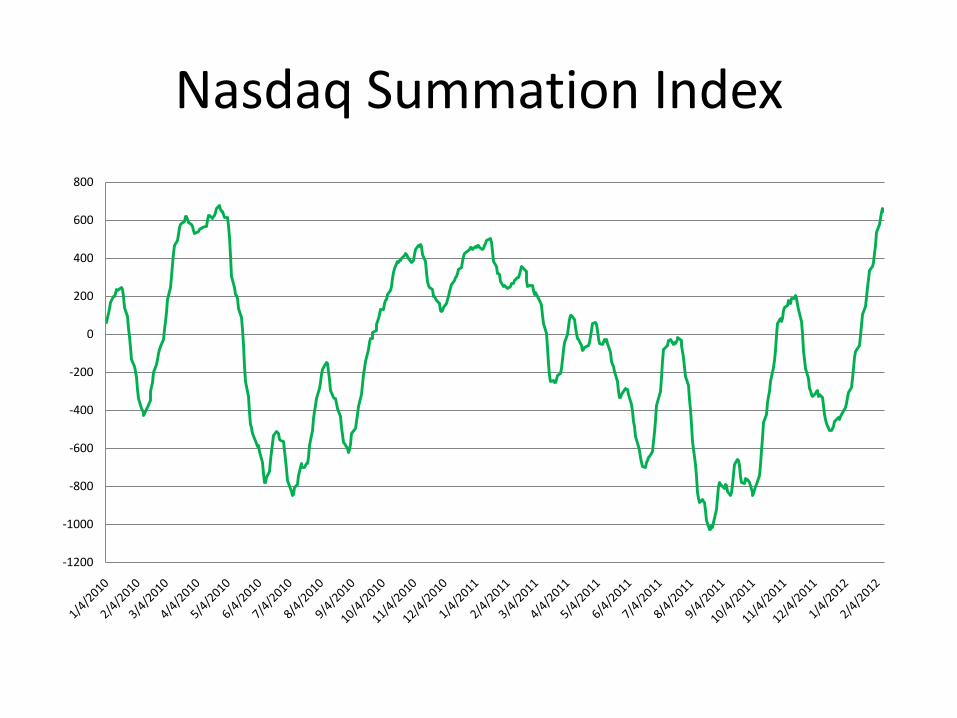
Nasdaq Summation Index
-1200
-1000
-800
-600
-400
-200
0
200
400
600
800
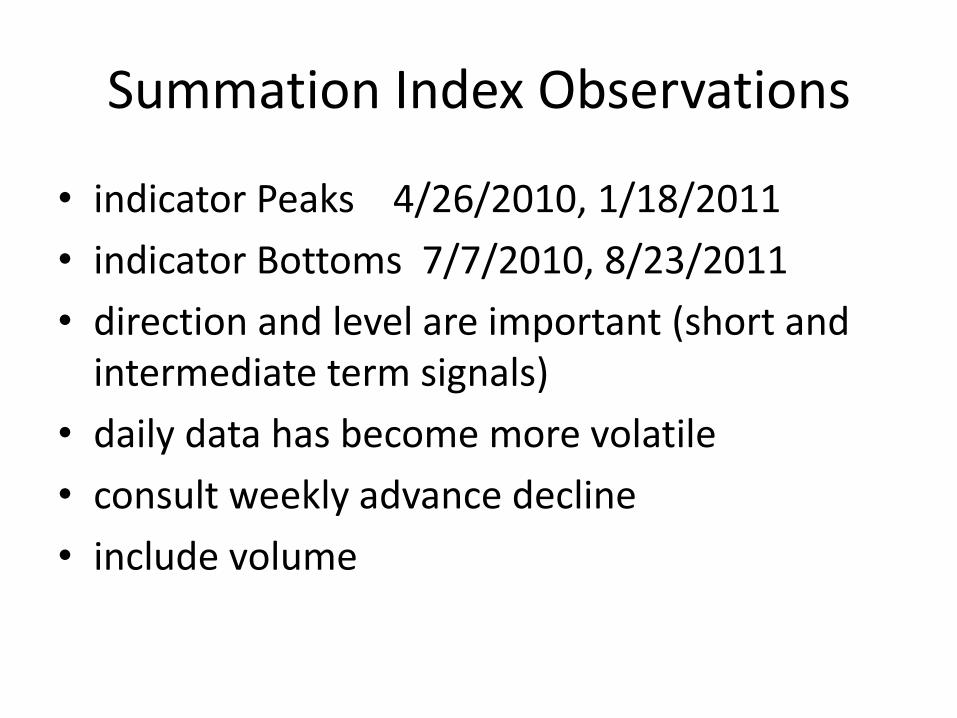
Summation Index Observations
• indicator Peaks 4/26/2010, 1/18/2011
• indicator Bottoms 7/7/2010, 8/23/2011
• direction and level are important (short and intermediate term signals)
• daily data has become more volatile
• consult weekly advance decline
• include volume

Asset Allocation
• investment strategy that attempts to balance risk and reward by adjusting % of each asset in an investment portfolio
• common asset classes – equities (large, mid, small) bonds (government, corporate, high yield), REITS, commodities (industrial and precious metals, grains, currencies)
• Core
• Tactical
• Satellite
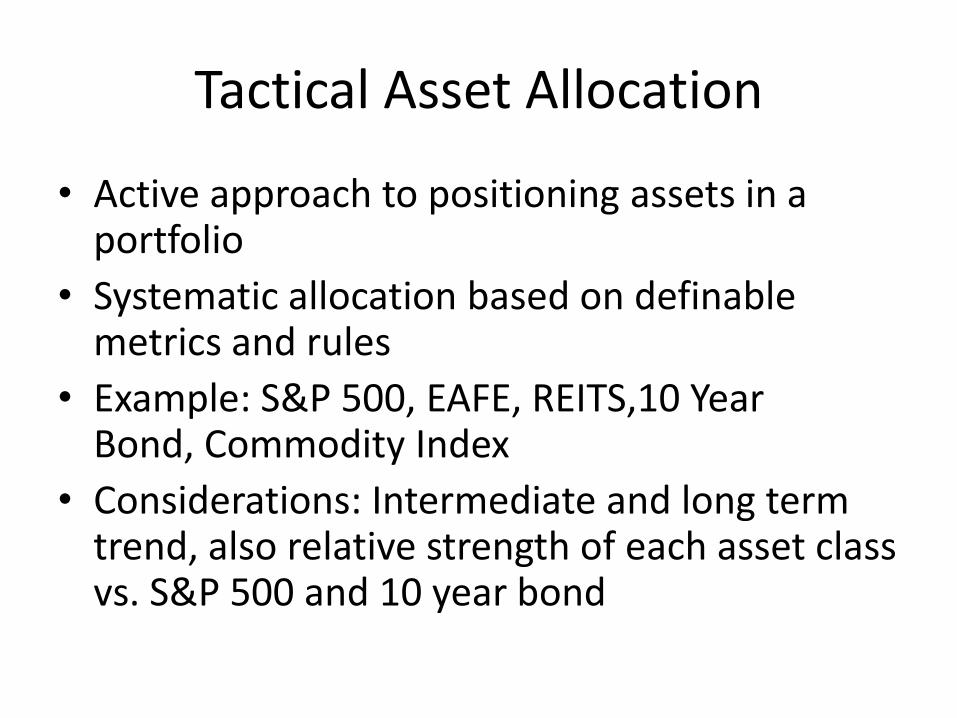
Tactical Asset Allocation
• Active approach to positioning assets in a portfolio
• Systematic allocation based on definable metrics and rules
• Example: S&P 500, EAFE, REITS,10 Year Bond, Commodity Index
• Considerations: Intermediate and long term trend, also relative strength of each asset class vs. S&P 500 and 10 year bond
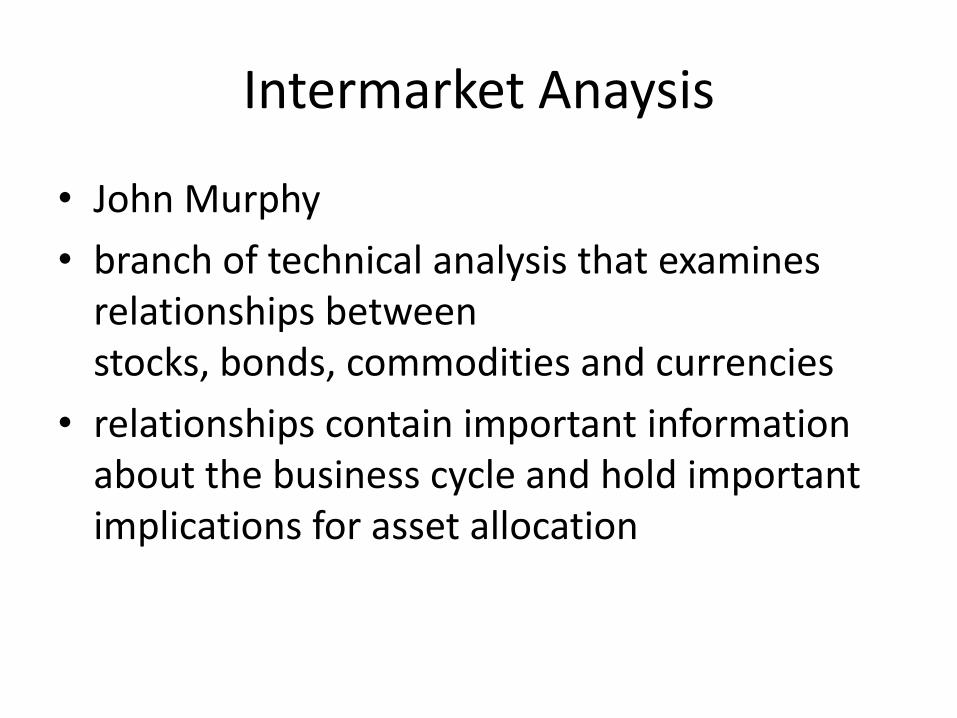
Intermarket Anaysis
• John Murphy
• branch of technical analysis that examines relationships between stocks, bonds, commodities and currencies
• relationships contain important information about the business cycle and hold important implications for asset allocation
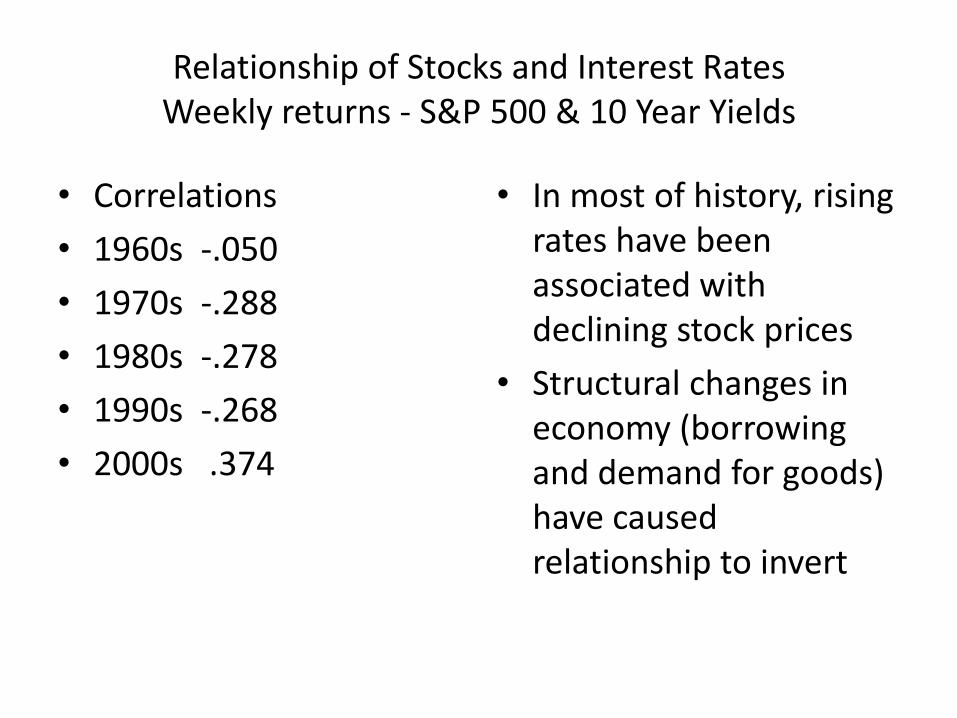
Relationship of Stocks and Interest RatesWeekly returns - S&P 500 & 10 Year Yields
• Correlations
• 1960s -.050
• 1970s -.288
• 1980s -.278
• 1990s -.268
• 2000s .374
• In most of history, rising rates have been associated with declining stock prices
• Structural changes in economy (borrowing and demand for goods) have caused relationship to invert
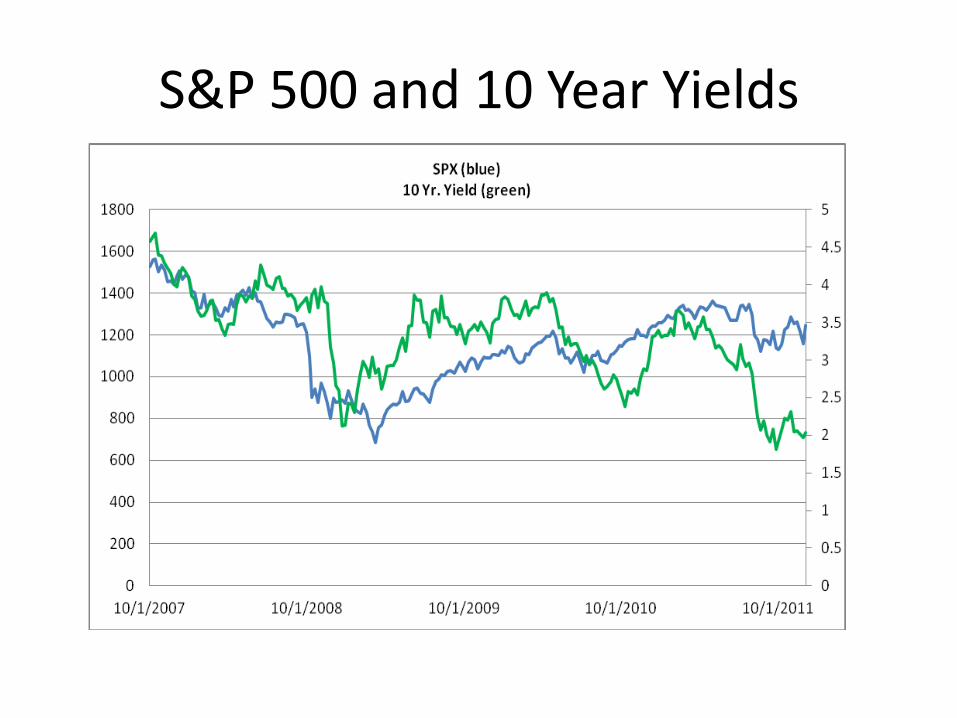
S&P 500 and 10 Year Yields
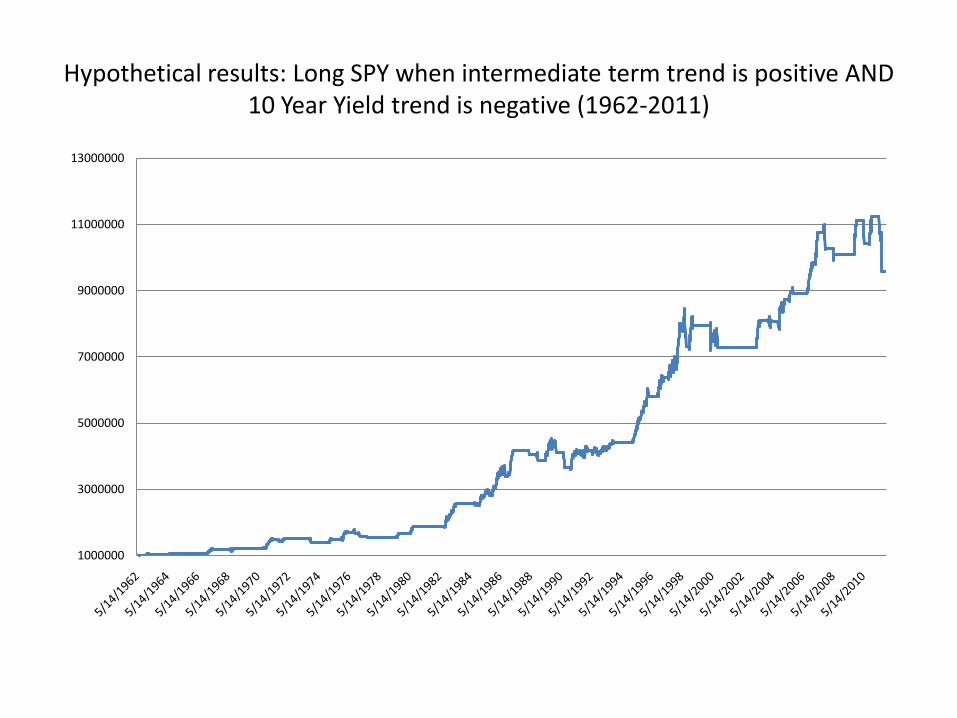
Hypothetical results: Long SPY when intermediate term trend is positive AND 10 Year Yield trend is negative (1962-2011)
1000000
3000000
5000000
7000000
9000000
11000000
13000000
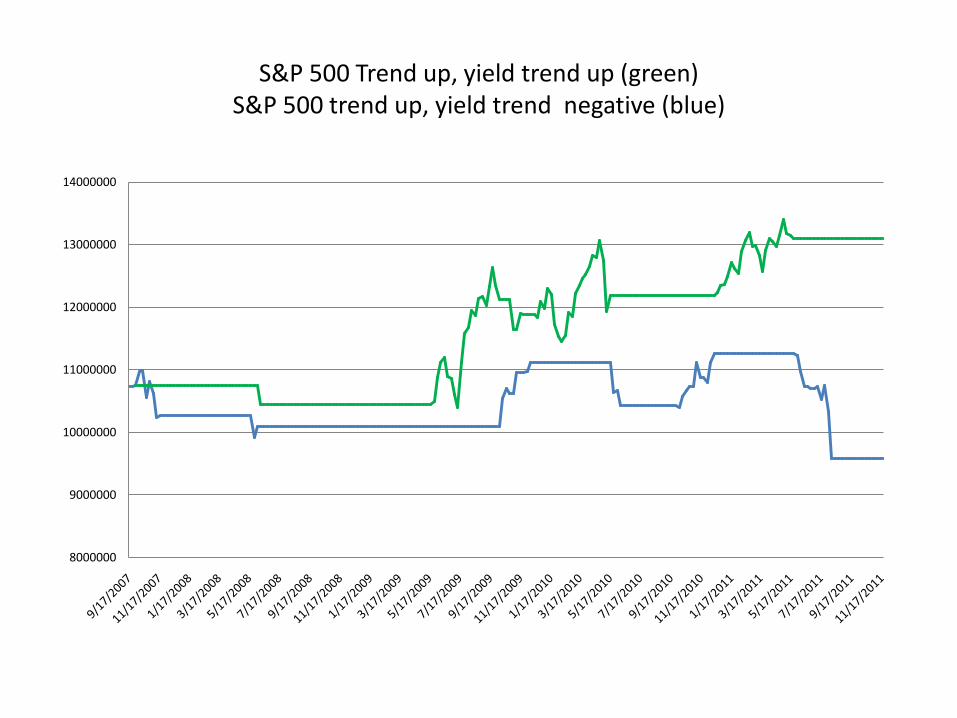
S&P 500 Trend up, yield trend up (green)S&P 500 trend up, yield trend negative (blue)
8000000
9000000
10000000
11000000
12000000
13000000
14000000
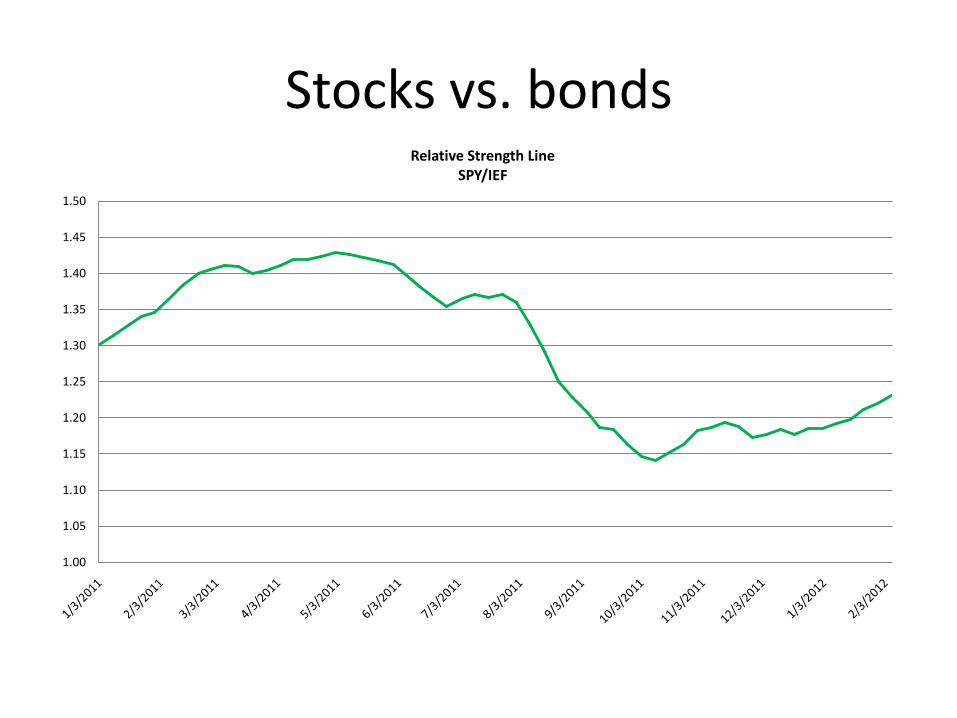
Stocks vs. bonds
1.00
1.05
1.10
1.15
1.20
1.25
1.30
1.35
1.40
1.45
1.50
Relative Strength Line SPY/IEF
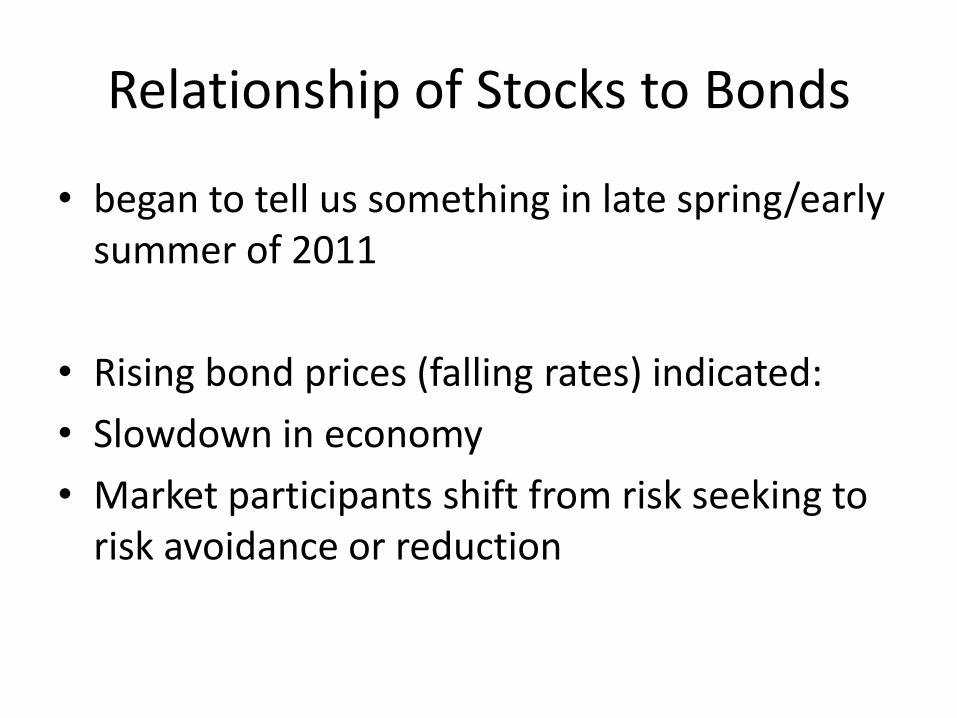
Relationship of Stocks to Bonds
• began to tell us something in late spring/early summer of 2011
• Rising bond prices (falling rates) indicated:
• Slowdown in economy
• Market participants shift from risk seeking to risk avoidance or reduction
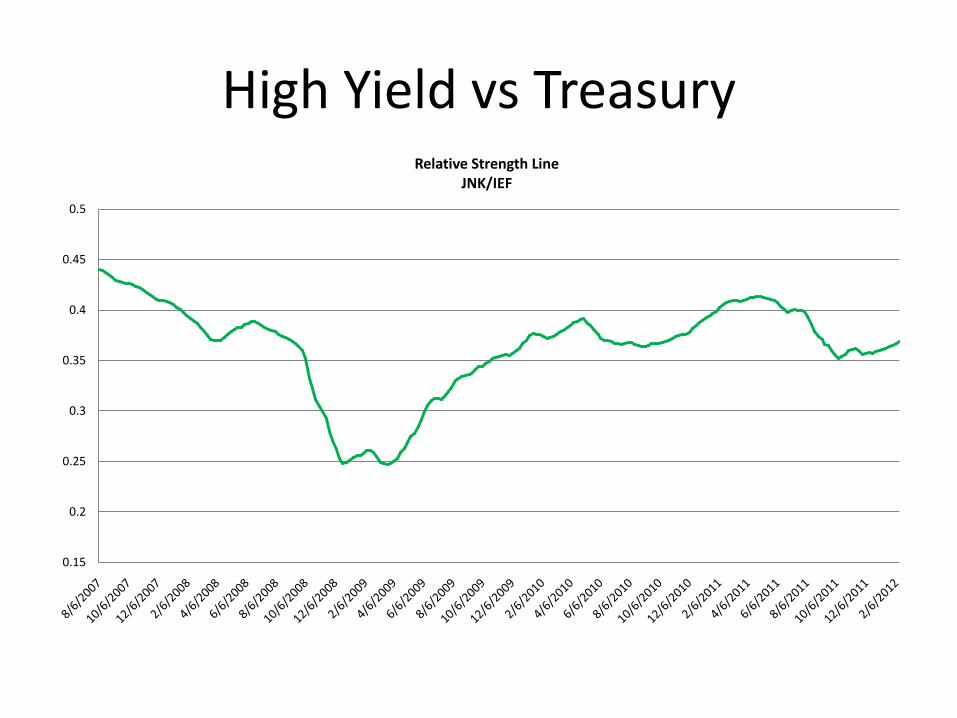
High Yield vs Treasury
0.15
0.2
0.25
0.3
0.35
0.4
0.45
0.5
Relative Strength Line JNK/IEF
High Yield bond characteristics
• a distinct asset class:
• due to higher coupon rates and shorter maturities, high yield bond prices are less impacted by interest rate changes than investment grade corporate or treasury bonds
• low correlation to other financial asset classes
• sensitivity to business cycle and credit conditions
• tend to appreciate in economic expansions and decline in periods of economic contractions
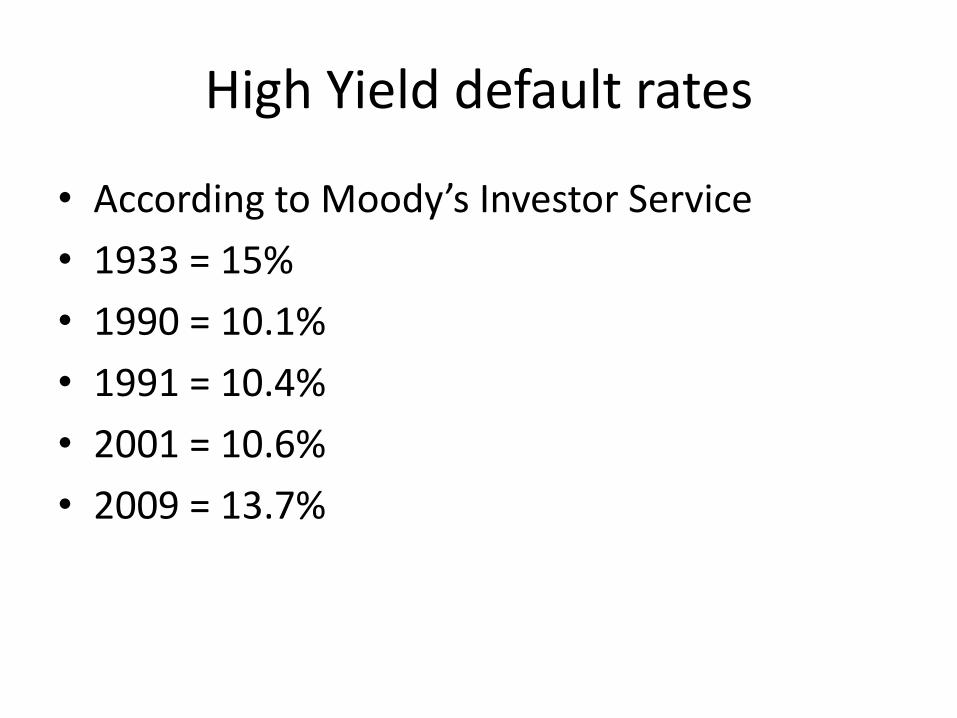
High Yield default rates
• According to Moody’s Investor Service
• 1933 = 15%
• 1990 = 10.1%
• 1991 = 10.4%
• 2001 = 10.6%
• 2009 = 13.7%
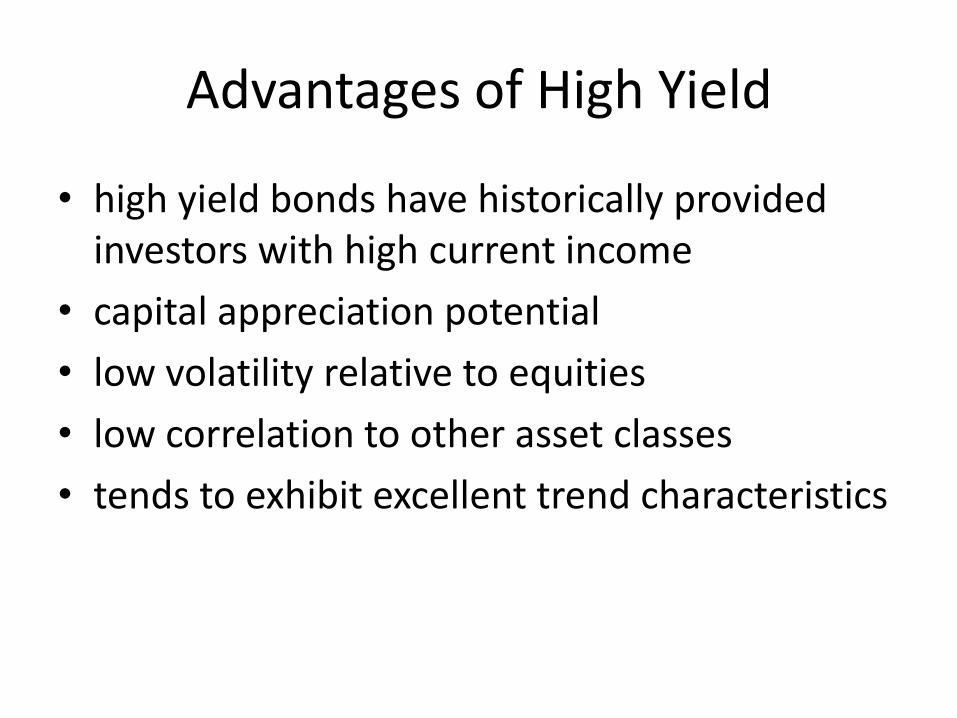
Advantages of High Yield
• high yield bonds have historically provided investors with high current income
• capital appreciation potential
• low volatility relative to equities
• low correlation to other asset classes
• tends to exhibit excellent trend characteristics
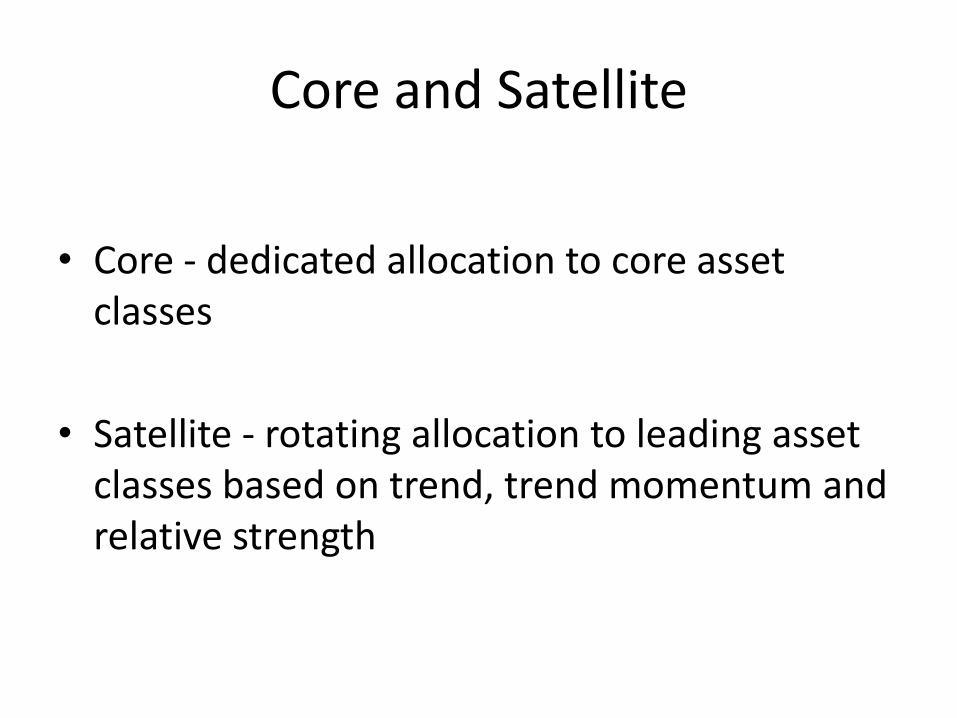
Core and Satellite
• Core - dedicated allocation to core asset classes
• Satellite - rotating allocation to leading asset classes based on trend, trend momentum and relative strength

Security Selection
• Trend
• Trend Momentum
• Relative Strength

Trend
• Moving averages –simple, exponential, weighted
• Considerations - position of short, intermediate, long term moving averages
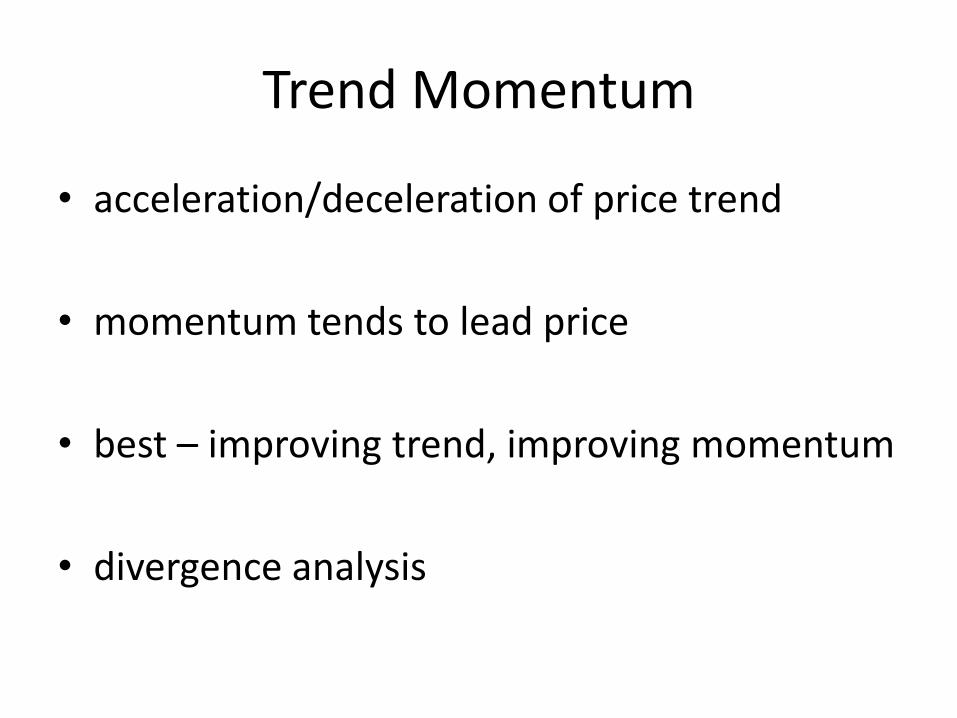
Trend Momentum
• acceleration/deceleration of price trend
• momentum tends to lead price
• best – improving trend, improving momentum
• divergence analysis

S&P 500 weekly price – blueS&P 500 - trend momentum green
-5
-4
-3
-2
-1
0
1
2
3
4
5
110
115
120
125
130
135
140
Relative Strength
• performance of a security relative to:
• index or benchmark
• similar asset or group of similar assets
• different asset (stocks versus bonds)
Scoring System
• uniform way to objectively assess the merits of buying, selling or holding a security at any point in time
• score weights are based on trend, trend momentum and relative strength
• metric weighting = 1 point if positive
• maximum score =7, minimum score = 0
• max score for SPY = 5, cannot achieve 2 additional from RS vs. itself

Scoring system
• Short term trend
• Intermediate term trend
• Long term trend
• Intermediate term momentum
• Long term momentum
• Intermediate term relative strength
• Long term relative strength
characteristics of scoring system
• Score = ideally 4 or higher (move from below 4 to above 4 is generally important
• Score direction – improving trend in score tends to correlate with improving price trend
• Turnaround – a score of 0 that improves to 1 or 2 is indicative of improving trend momentum (momentum precedes price)
• high score represents positive relative strength
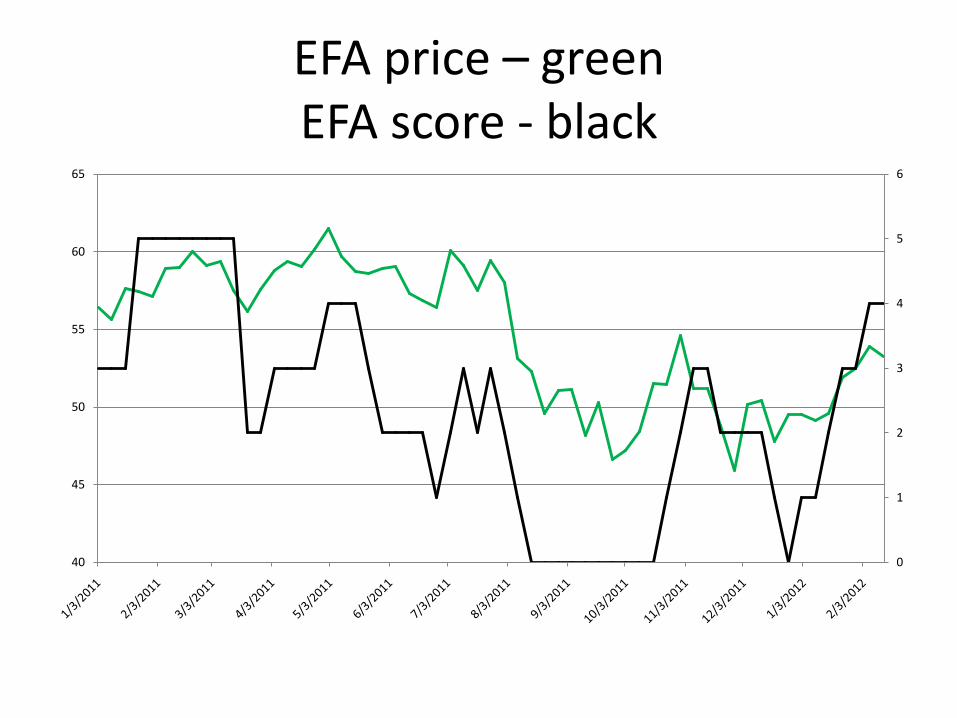
EFA price – greenEFA score - black
0
1
2
3
4
5
6
40
45
50
55
60
65
Equity Scores
• generally declining in May –July
• on 8.1.2011 equity ETFs lost a total of 7 points combined
• began to improve in October - December
Bond ETF Scoring
• similar to equity ETF in trend and trend momentum
• exception is relative strength: i.e. one metric compares a bond ETF to an equity benchmark (SPY)
• the other compares each bond ETF to a fixed income benchmark – (IEF) iShares 7-10 year Treasury
• max score = 7, exception is SPY and IEF as Max = 6, (each cannot score a point on RS vs. itself)
Bond ETF Universe
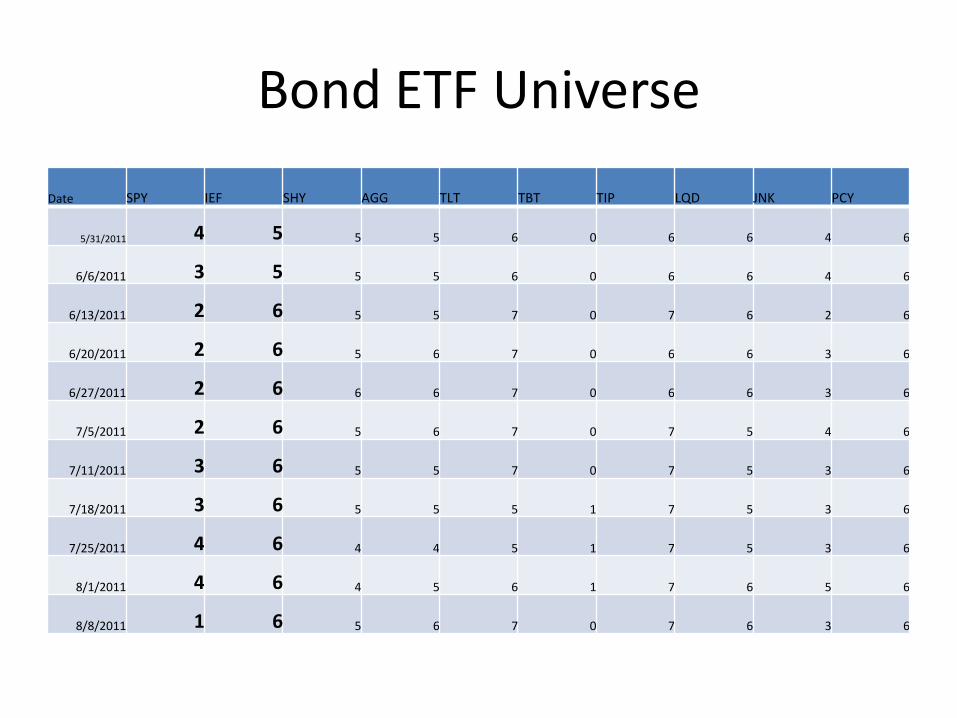
Date SPY IEF SHY AGG TLT TBT TIP LQD JNK PCY
5/31/2011 4 5 5 5 6 0 6 6 4 6
6/6/2011 3 5 5 5 6 0 6 6 4 6
6/13/2011 2 6 5 5 7 0 7 6 2 6
6/20/2011 2 6 5 6 7 0 6 6 3 6
6/27/2011 2 6 6 6 7 0 6 6 3 6
7/5/2011 2 6 5 6 7 0 7 5 4 6
7/11/2011 3 6 5 5 7 0 7 5 3 6
7/18/2011 3 6 5 5 5 1 7 5 3 6
7/25/2011 4 6 4 4 5 1 7 5 3 6
8/1/2011 4 6 4 5 6 1 7 6 5 6
8/8/2011 1 6 5 6 7 0 7 6 3 6
Bond ETF Universe
• generally rising in score in June and July (IEF moved to a buy signal on 5.2.2011)
• scores of Bond ETFs higher than SPY (IEF’s max score of 6 from 6.13.2011 through 10.17.2011 carried an important message)
• strategy metrics called for a tactical shift in satellite allocations from equity to fixed income
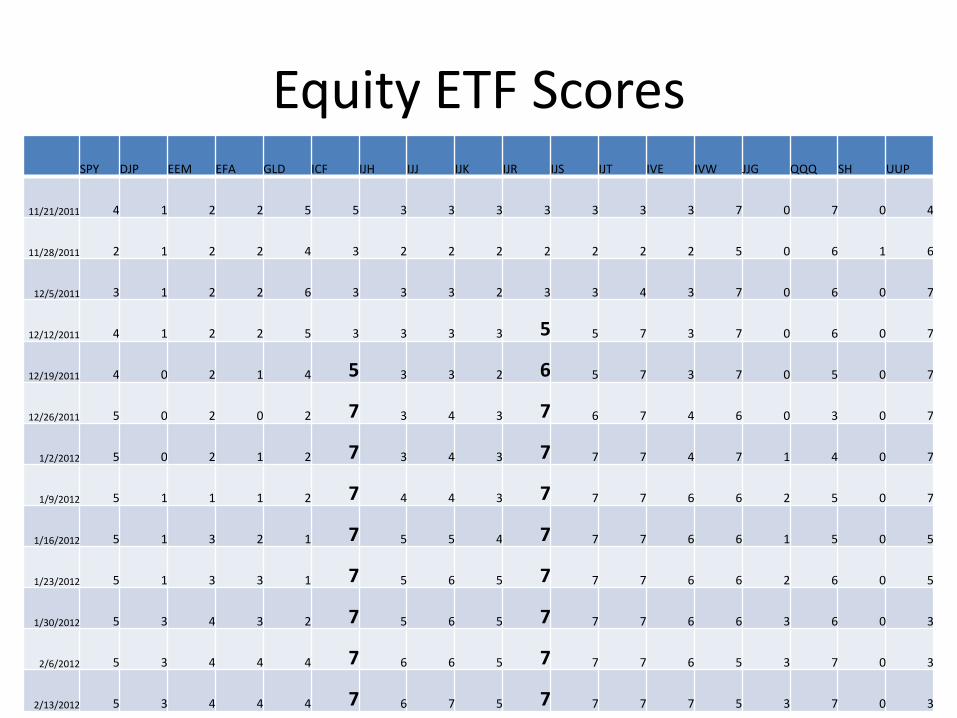
Equity ETF ScoresSPY DJP EEM EFA GLD ICF IJH IJJ IJK IJR IJS IJT IVE IVW JJG QQQ SH UUP
11/21/2011 4 1 2 2 5 5 3 3 3 3 3 3 3 7 0 7 0 4
11/28/2011 2 1 2 2 4 3 2 2 2 2 2 2 2 5 0 6 1 6
12/5/2011 3 1 2 2 6 3 3 3 2 3 3 4 3 7 0 6 0 7
12/12/2011 4 1 2 2 5 3 3 3 3 5 5 7 3 7 0 6 0 7
12/19/2011 4 0 2 1 4 5 3 3 2 6 5 7 3 7 0 5 0 7
12/26/2011 5 0 2 0 2 7 3 4 3 7 6 7 4 6 0 3 0 7
1/2/2012 5 0 2 1 2 7 3 4 3 7 7 7 4 7 1 4 0 7
1/9/2012 5 1 1 1 2 7 4 4 3 7 7 7 6 6 2 5 0 7
1/16/2012 5 1 3 2 1 7 5 5 4 7 7 7 6 6 1 5 0 5
1/23/2012 5 1 3 3 1 7 5 6 5 7 7 7 6 6 2 6 0 5
1/30/2012 5 3 4 3 2 7 5 6 5 7 7 7 6 6 3 6 0 3
2/6/2012 5 3 4 4 4 7 6 6 5 7 7 7 6 5 3 7 0 3
2/13/2012 5 3 4 4 4 7 6 7 5 7 7 7 7 5 3 7 0 3
Equity ETF scores
• examples of a few recent buy signals (crossover from below 4 to 4 or higher)
• 10.17.2011 – IVW
• 11.14.2011 “false signal”, 12.12.2011 SPY
• 12.5.2011 IJT
• 12.12.2011 IJR, IJS
• 1.30.2012 EEM, 2.6.2012 EFA
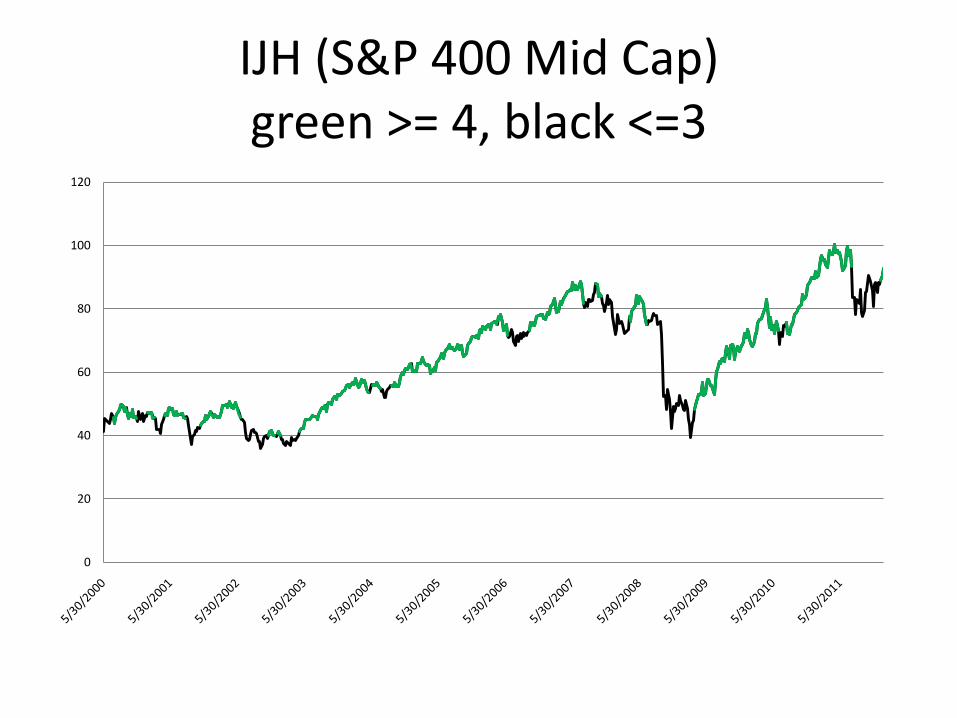
IJH (S&P 400 Mid Cap)green >= 4, black <=3
0
20
40
60
80
100
120
Prospero Market and Portfolio Strategy Report
• quantitative approaches to technical analysis
• market models
• portfolio models
• bridge gap between hiring 3rd party money managers and allocating portfolios on your own
• save time, money and improve risk adjusted performance
Biography
• Kevin Hockert, CMT, is the Director of Strategies for Prospero Institute, Inc. an investment advisory firm founded in 2005. Prospero delivers quantitative investment solutions to RIAs and portfolio managers ranging from Barron’ Top 100 advisors to HNW wealth management firms. Several proprietary rules based strategies have been developed that are designed to help financial advisors and portfolio managers systematically allocate portfolios into and out of various asset classes. By providing a broad spectrum of solutions ranging from market breadth models, broad asset allocation, sector rotation, dedicated high yield, fixed income, alternative asset classes and individual security selection, Prospero’s strategies are designed to help financial advisors bridge the gap between hiring third party money managers and tackling the monumental task of managing client assets on their own.
• Kevin is a 21 year veteran of the financial markets. He was awarded the CMT designation in 2008 and the culmination of his research at that time included his CMT 3 paper titled “IntermarketAnalysis and Dynamic Asset Allocation”. Kevin also serves as a Co-Chair of the Minnesota Chapter of the Market Technicians Association.


![cMT-G01 Startup Guide - · PDF file[cMT Series] » [Maintenance] » [cMT-G01 OS Upgrade]. ... cMT Gateway Viewer can read from or write to PLC. ... cMT-G01 Startup Guide](https://img.pdfslide.net/doc/110x75/5ab85bac7f8b9ad13d8c70d9/cmt-g01-startup-guide-cmt-series-maintenance-cmt-g01-os-upgrade-cmt.jpg)