Embed Size (px)
Citation preview


ww
.sxc
.hu
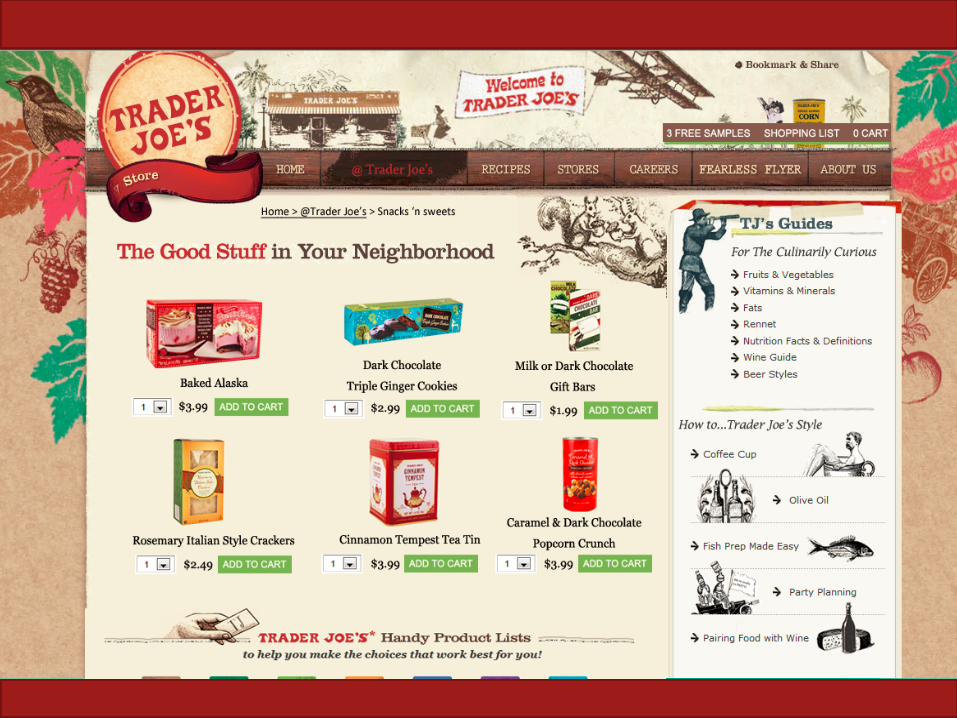
Shop
Everything you love about our store
Now online and brought right to your door.
Nari Ely
Graham Perkins
Ben Grieser
Erika Maguire
Teresa Chai
ww
.sxc
.hu
ww
.sxc
.hu

Industry Research Market Research Recommendations
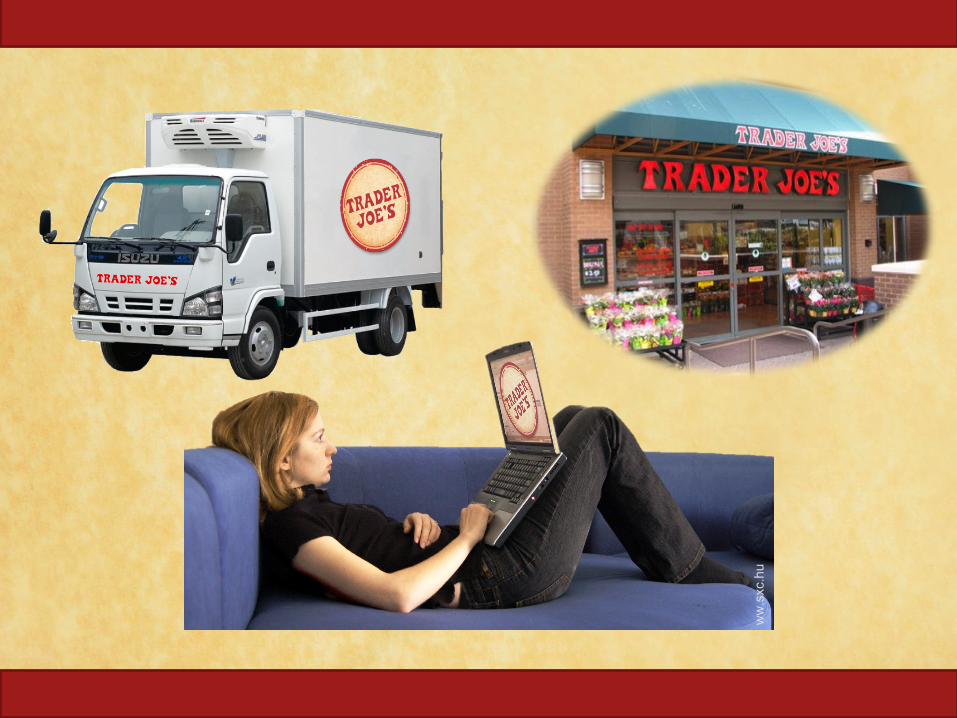
• Industry research
Growing poten?al for online grocery retail
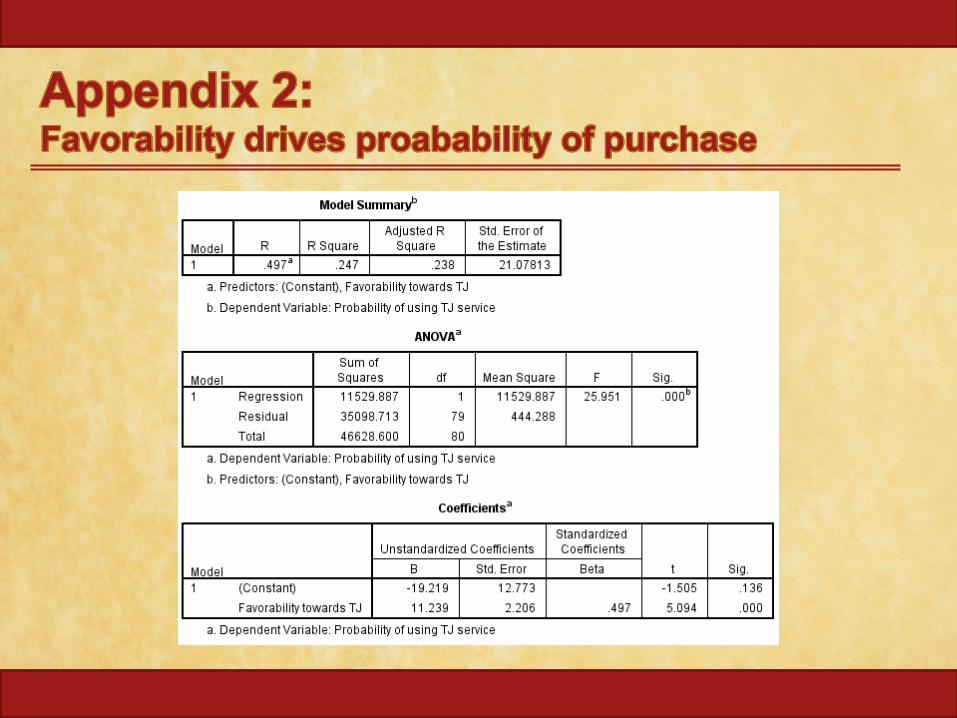
• Market research Probability of purchase driven by brand favorability
• Recommenda?ons Improve aDributes driving favorability Launch pilot in select stores

• Urbaniza(on • Heightened price sensi(vity • Rising demand for convenience
Industry Research Market Research Recommendations
Industry Research Market Research Recommendations
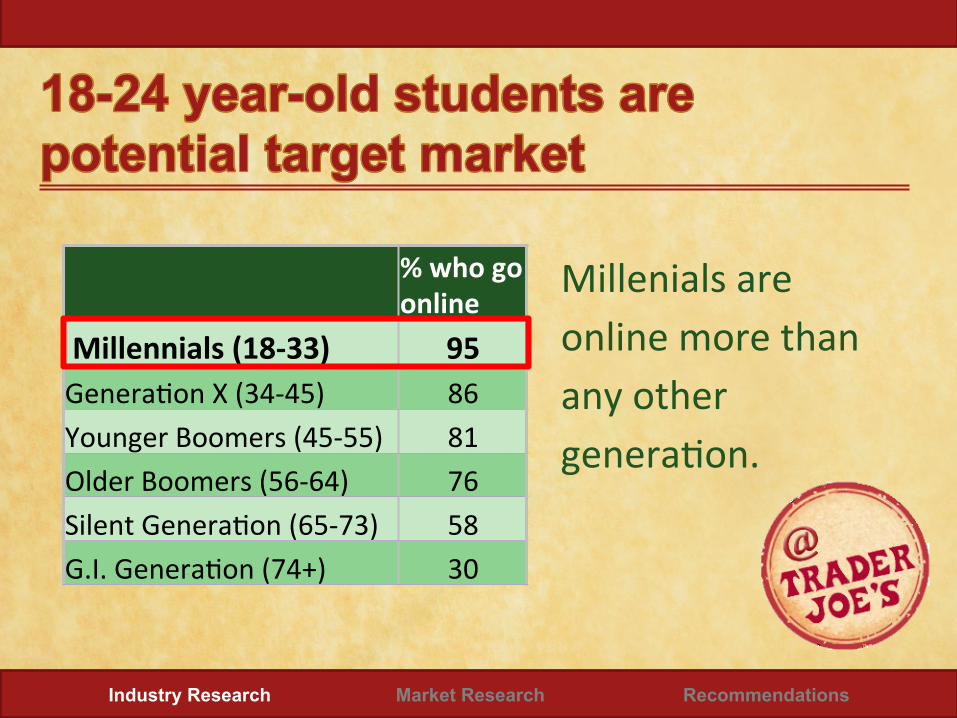
Millenials are online more than any other genera(on.
% who go online
Millennials (18-‐33) 95 Genera(on X (34-‐45) 86 Younger Boomers (45-‐55) 81 Older Boomers (56-‐64) 76 Silent Genera(on (65-‐73) 58 G.I. Genera(on (74+) 30
Industry Research Market Research Recommendations
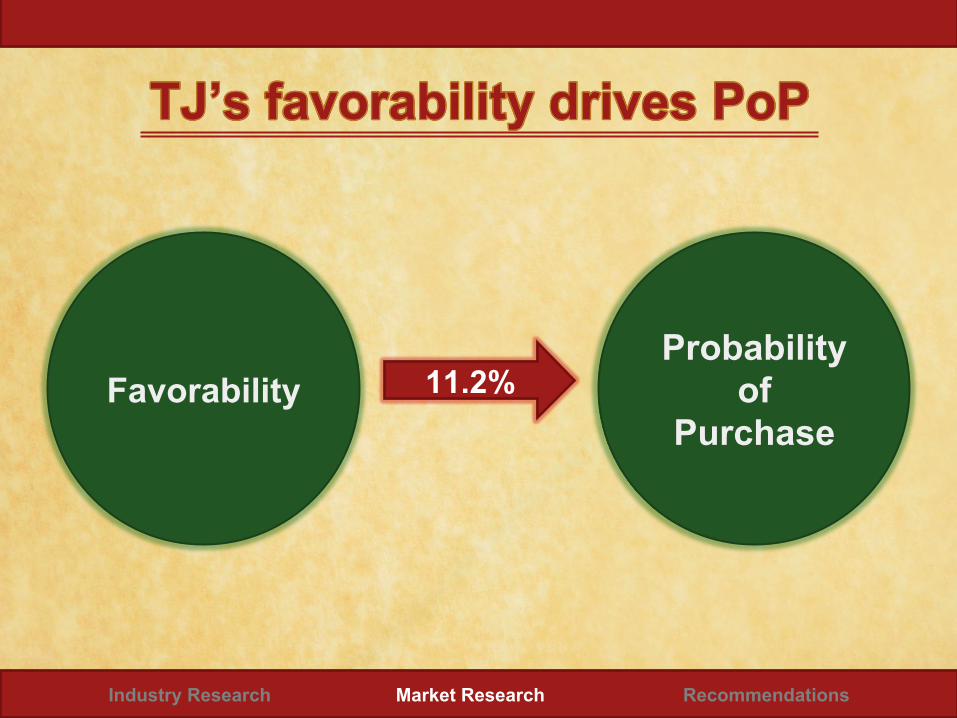
Favorability Probability
of Purchase
11.2%
Industry Research Market Research Recommendations
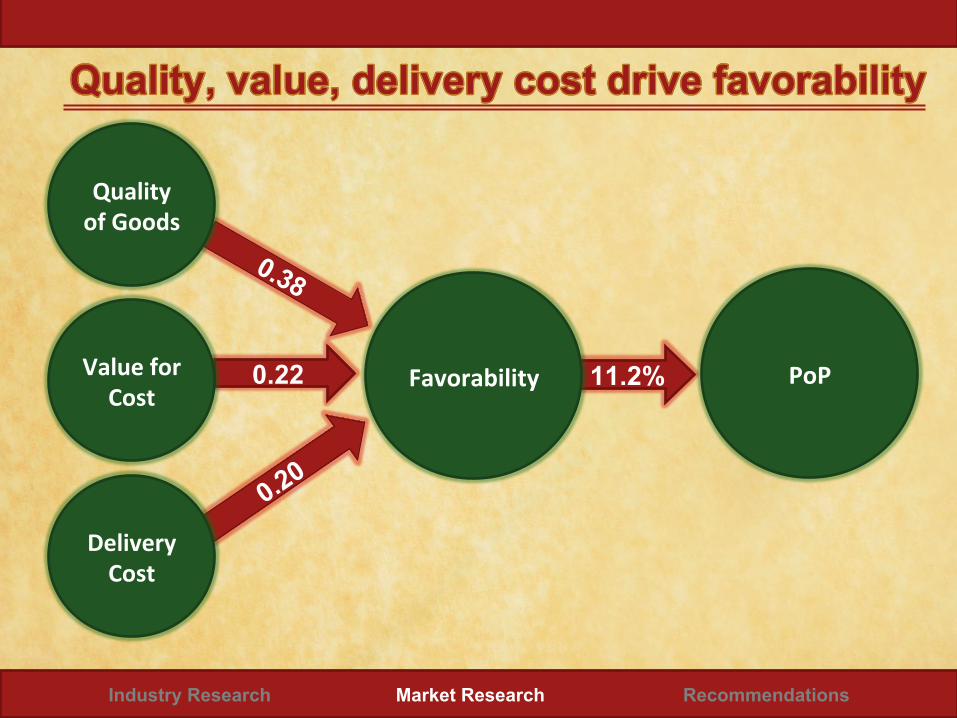
11.2% 0.22 Favorability
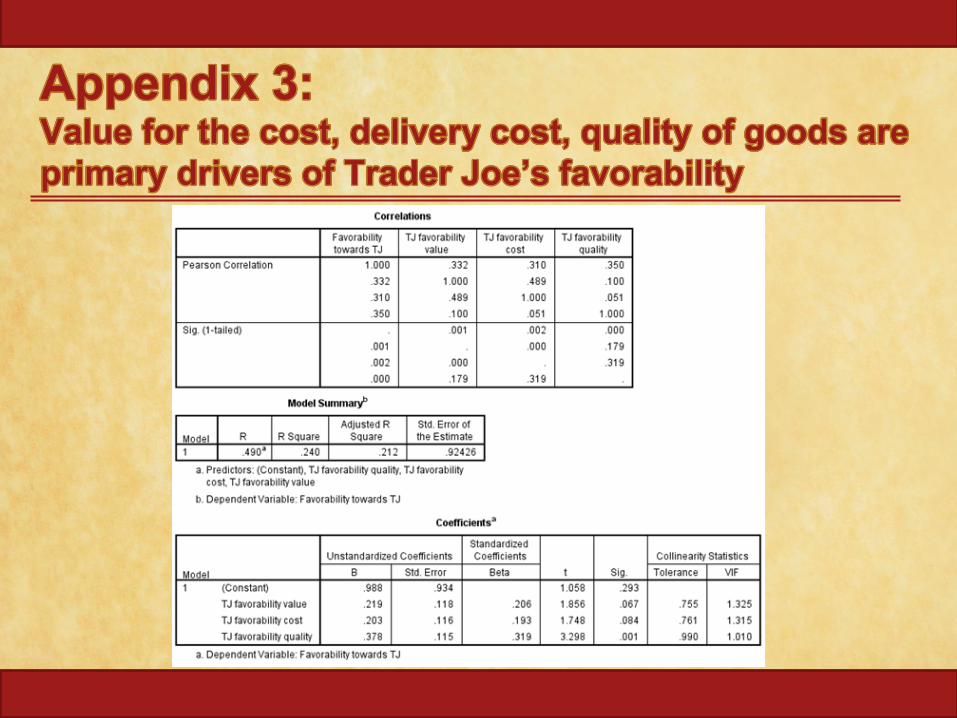
Quality of Goods
Value for Cost
Delivery Cost
PoP
Industry Research Market Research Recommendations

Industry Research Market Research Recommendations


• AQen(on-‐grabbing ads on mass transit • Fearless Flyer • Exclusive online offerings • Free samples with purchases • Free shipping for first two months
Industry Research Market Research Recommendations

• Quality
• Value
• Cost
Industry Research Market Research Recommendations

• Highlight user ra(ngs and reviews
Industry Research Market Research Recommendations
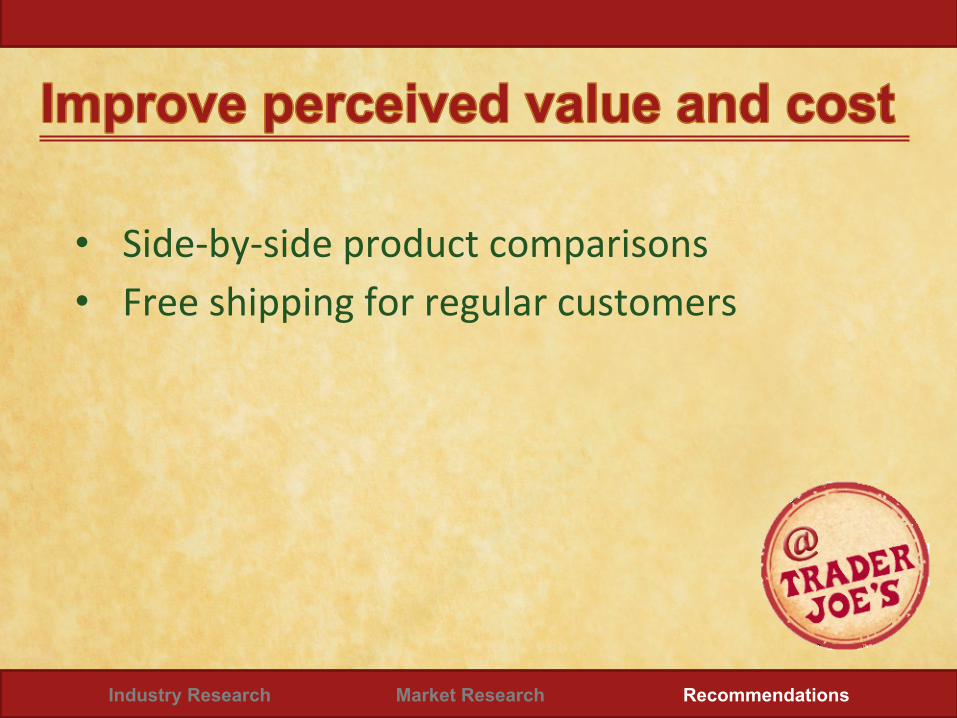
• Side-‐by-‐side product comparisons • Free shipping for regular customers
Industry Research Market Research Recommendations

• Women have higher Trader Joe’s favorability
• People who shop at trader Joe’s spend less per trip
• College-‐town graduate students s(ll strong poten(al market
Industry Research Market Research Recommendations

Industry Research Market Research Recommendations
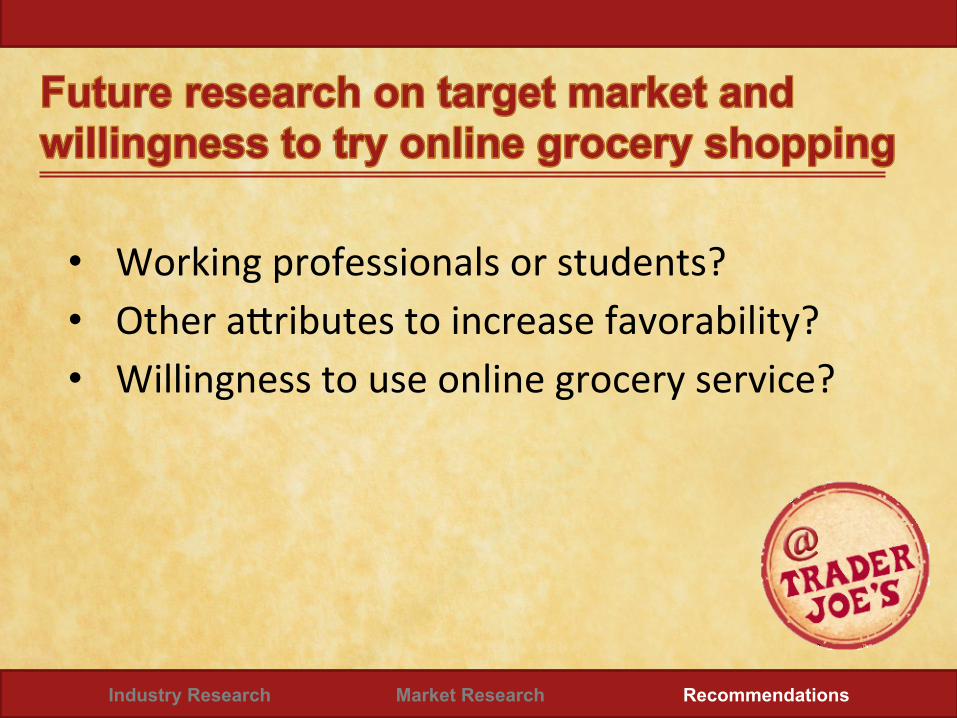
• Working professionals or students? • Other aQributes to increase favorability? • Willingness to use online grocery service?
Industry Research Market Research Recommendations

Trader Joe’s should launch a Shop @Trader Joe’s pilot.
Expanding into online grocery retail will capture a growing market and position Trader Joe’s for success.
Nari Ely
Graham Perkins
Ben Grieser
Erika Maguire
Teresa Chai
Shop

Independent Samples Test
Levene's
Test for
Equality of
Variances
t-test for Equality of Means
Sig. t df Sig. (2-
tailed)
Mean
Difference
Favorability towards TJ
Equal variances
assumed .971 1.676 79 .098 .39377
Equal variances not
assumed
1.683 78.922 .096 .39377
Probability of using WF
service
Equal variances
assumed .326 -2.368 79 .020 -10.80788
Equal variances not
assumed
-2.353 74.580 .021 -10.80788
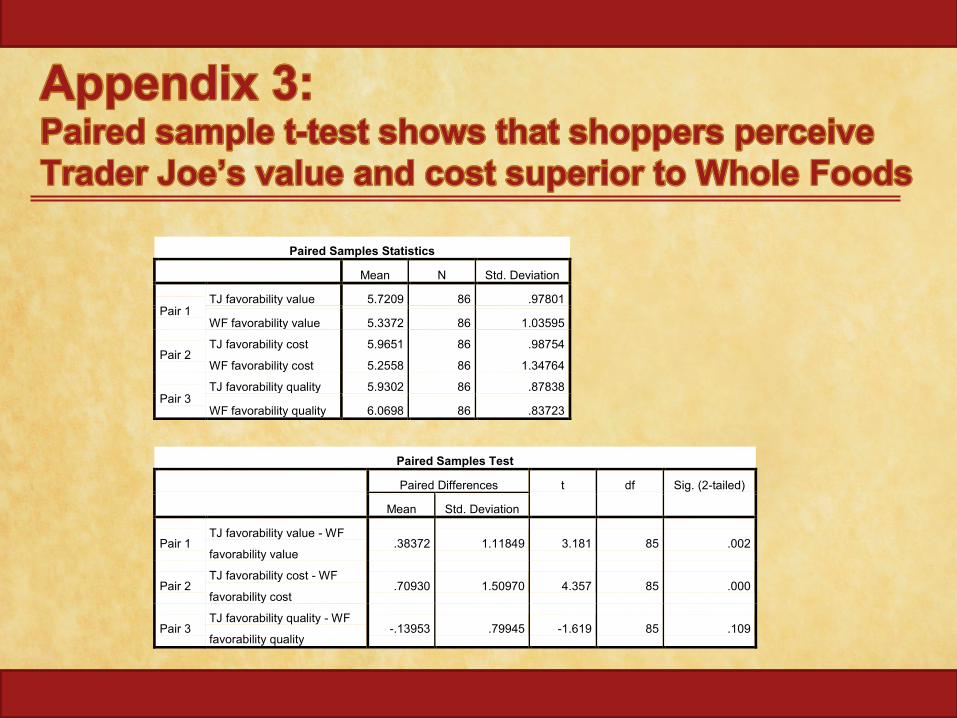
Paired Samples Statistics
Mean N Std. Deviation
Pair 1 TJ favorability value 5.7209 86 .97801
WF favorability value 5.3372 86 1.03595
Pair 2 TJ favorability cost 5.9651 86 .98754
WF favorability cost 5.2558 86 1.34764
Pair 3 TJ favorability quality 5.9302 86 .87838
WF favorability quality 6.0698 86 .83723
Paired Samples Test
Paired Differences t df Sig. (2-tailed)
Mean Std. Deviation
Pair 1 TJ favorability value - WF
favorability value .38372 1.11849 3.181 85 .002
Pair 2 TJ favorability cost - WF
favorability cost .70930 1.50970 4.357 85 .000
Pair 3 TJ favorability quality - WF
favorability quality -.13953 .79945 -1.619 85 .109


![[Group Project] Trader Joe's](https://img.pdfslide.net/doc/110x75/547cf1f95906b575378b45f5/group-project-trader-joes.jpg)