Embed Size (px)
DESCRIPTION
Operations in a carbon constrained environment
Citation preview
El Paso Corporation
Fiji C. George Manager, EH&S
Emissions Accounting and Cap-and-Trade Policy Considerations for
Natural Gas Sector: El Paso Corporation’s Perspective
May 20, 2008
2
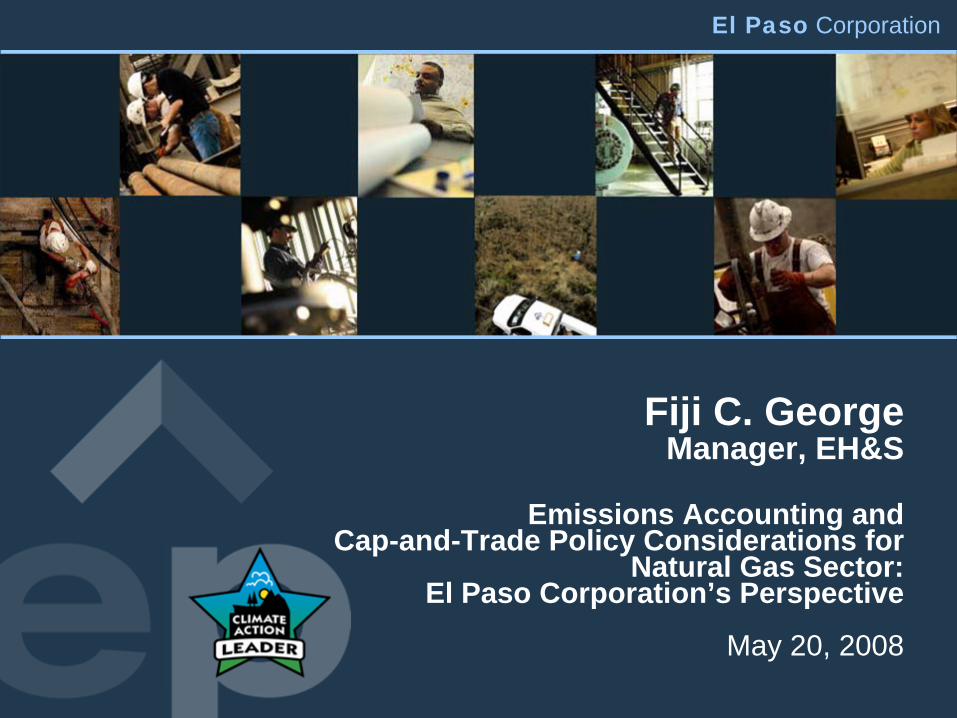
Cautionary Statement Regarding Forward-looking Statements
This presentation includes forward-looking statements and projections, made in reliance on the safe harbor provisions of the Private Securities Litigation Reform Act of 1995. The company has made every reasonable effort to ensure that the information and assumptions on which these statements and projections are based are current, reasonable, and complete. However, a variety of factors could cause actual results to differ materially from the projections, anticipated results or other expectations expressed in this presentation, including, without limitation, changes in unaudited and/or unreviewed financial information; our ability to implement and achieve our objectives in the 2008 plan, including earnings and cash flow targets; the effects of any changes in accounting rules and guidance; our ability to meet production volume targets in our E&P segment; uncertainties and potential consequences associated with the outcome of governmental investigations, including, without limitation, those related to the reserve revisions; outcome of litigation; our ability to comply with the covenants in our various financing documents; our ability to obtain necessary governmental approvals for proposed pipeline projects and our ability to successfully construct and operate such projects; the risks associated with recontracting of transportation commitments by our pipelines; regulatory uncertainties associated with pipeline rate cases; actions by the credit rating agencies; the successful close of our financing transactions; our ability to successfully exit the energy trading business; our ability to close our announced asset sales on a timely basis; changes in commodity prices and basis differentials for oil, natural gas, and power and relevant basis spreads; inability to realize anticipated synergies and cost savings associated with restructurings and divestitures on a timely basis; general economic and weather conditions in geographic regions or markets served by the company and its affiliates, or where operations of the company and its affiliates are located; the uncertainties associated with governmental regulation; political and currency risks associated with international operations of the company and its affiliates; competition; and other factors described in the company’s (and its affiliates’) Securities and Exchange Commission filings. While the company makes these statements and projections in good faith, neither the company nor its management can guarantee that anticipated future results will be achieved. Reference must be made to those filings for additional important factors that may affect actual results. The company assumes no obligation to publicly update or revise any forward-looking statements made herein or any other forward-looking statements made by the company, whether as a result of new information, future events, or otherwise.
3
Agenda
OverviewEmissions Accounting & ReportingCap and trade policy issues
4
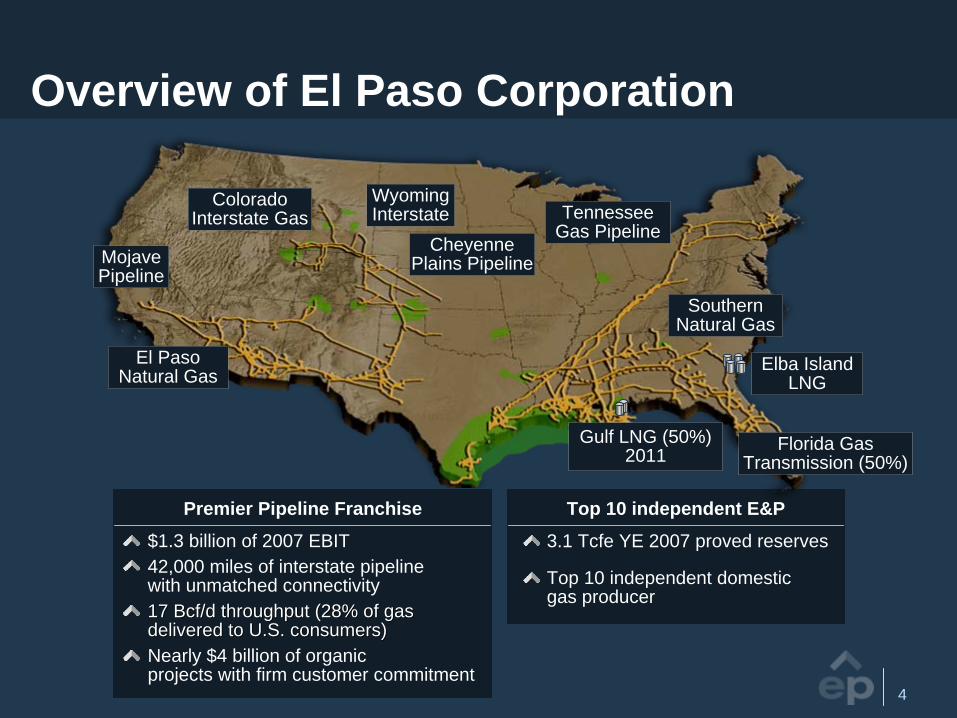
Overview of El Paso Corporation
$1.3 billion of 2007 EBIT42,000 miles of interstate pipeline with unmatched connectivity17 Bcf/d throughput (28% of gas17 Bcf/d throughput (28% of gas delivered to U.S. consumers)delivered to U.S. consumers)Nearly $4 billion of organic projects with firm customer commitment
Premier Pipeline Franchise
El Paso Natural Gas
Mojave Pipeline
Colorado Interstate Gas
Wyoming Interstate
Cheyenne Plains Pipeline
Tennessee Gas Pipeline
Southern Natural Gas
Florida Gas Transmission (50%)
Elba Island LNG
Gulf LNG (50%) 2011
3.1 Tcfe YE 2007 proved reserves
Top 10 independent domestic gas producer
Top 10 independent E&P
5
El Paso Corporate: Greenhouse Gas Commitment
“Assess, engage and act”Commitment statement http://elpaso.com/profile/mainneighbor.shtm
Carbon Disclosure Project (CDP) 5 responsehttp://www.cdproject.net/online_response_pf.asp?cid=558&year=2
California Climate Action Registry (CCAR)First company in CCAR history to certify without significant errorsFirst company to achieve Climate Action Leader™ for 2007First natural gas company to join CCAR
Reported third party verified entity wide emissions to DoE’s 1605(b) program in 2007Serves on Advisory Committee—The Climate Registry (TCR)
El Paso Natural Gas and Colorado Interstate Gas are TCR “Founding Reporters”
2008 Southern Gas Association (SGA) Environmental Excellence Award for leadership on GHG matters
6
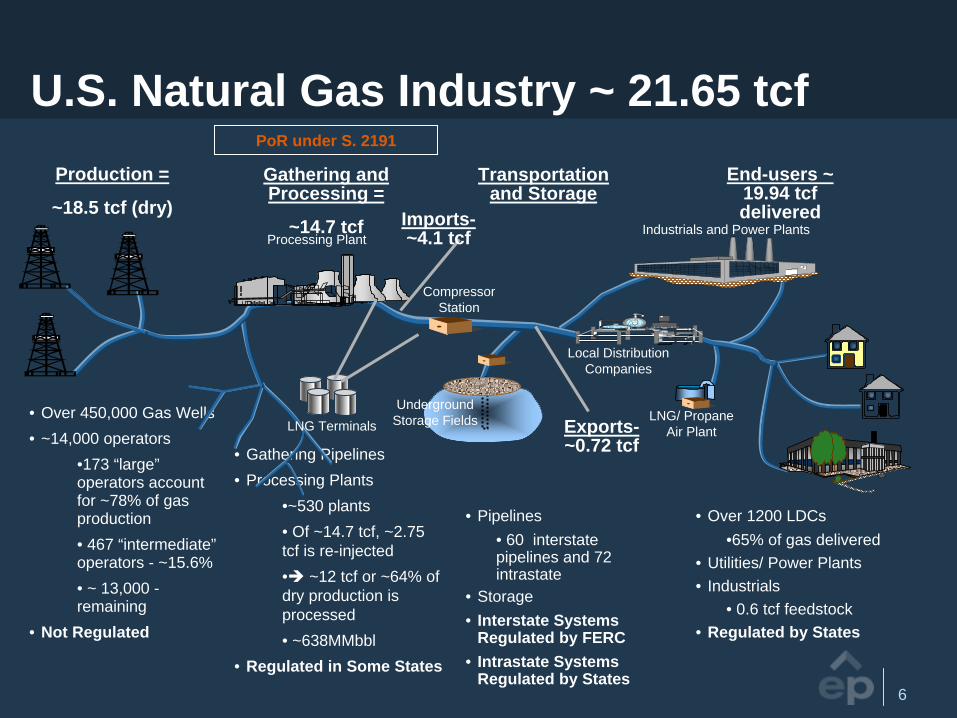
U.S. Natural Gas Industry ~ 21.65 tcfProduction =
~18.5 tcf (dry)
Gathering and Processing =
~14.7 tcf
Transportation and Storage
End-users ~ 19.94 tcf delivered
• Over 450,000 Gas Wells• ~14,000 operators
•173 “large” operators account for ~78% of gas production• 467 “intermediate” operators - ~15.6%• ~ 13,000 - remaining
• Not Regulated
• Gathering Pipelines• Processing Plants
•~530 plants• Of ~14.7 tcf, ~2.75 tcf is re-injected• ~12 tcf or ~64% of dry production is processed• ~638MMbbl
• Regulated in Some States
• Pipelines• 60 interstate pipelines and 72 intrastate
• Storage • Interstate Systems
Regulated by FERC• Intrastate Systems
Regulated by States
• Over 1200 LDCs•65% of gas delivered
• Utilities/ Power Plants• Industrials
• 0.6 tcf feedstock• Regulated by States
Local Distribution Companies
Industrials and Power Plants
LNG/ Propane Air Plant
Processing Plant
Compressor Station
Underground Storage Fields
PoR under S. 2191
LNG Terminals
Imports- ~4.1 tcf
Exports- ~0.72 tcf
7
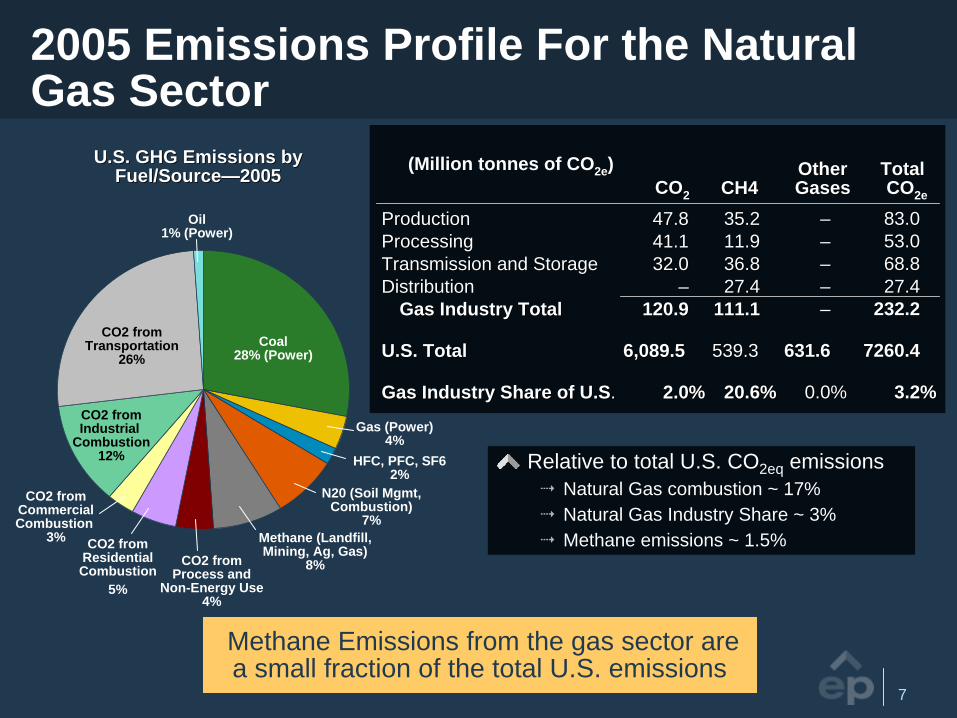
2005 Emissions Profile For the Natural Gas Sector
U.S. GHG Emissions byU.S. GHG Emissions by Fuel/SourceFuel/Source——20052005
Relative to total U.S. CO2eq emissionsNatural Gas combustion ~ 17% Natural Gas Industry Share ~ 3%Methane emissions ~ 1.5%
ProductionProductionProcessingProcessingTransmission and StorageTransmission and StorageDistributionDistribution
Gas Industry TotalGas Industry Total
U.S. TotalU.S. Total
Gas Industry Share of U.SGas Industry Share of U.S..
47.847.841.141.132.032.0
––120.9120.9
6,089.56,089.5
2.02.0%%
35.235.211.911.936.836.827.427.4
111.1111.1
539.3539.3
20.620.6%%
––––––––––
631.6631.6
0.00.0%%
83.083.053.053.068.868.827.427.4
232.2232.2
7260.47260.4
3.23.2%%
COCO22 CH4CH4OtherOther GasesGases
TotalTotal CO2e
(Million tonnes of CO2e )
Coal 28% (Power)
Gas (Power) 4%
HFC, PFC, SF6 2%
N20 (Soil Mgmt, Combustion)
7%Methane (Landfill, Mining, Ag, Gas)
8%CO2 from Process and
Non-Energy Use 4%
CO2 from Residential Combustion
5%
CO2 from Commercial Combustion
3%
CO2 from Industrial
Combustion 12%
CO2 from Transportation
26%
Oil 1% (Power)
Methane Emissions from the gas sector are a small fraction of the total U.S. emissions

8
Emissions Accounting & Reporting
9
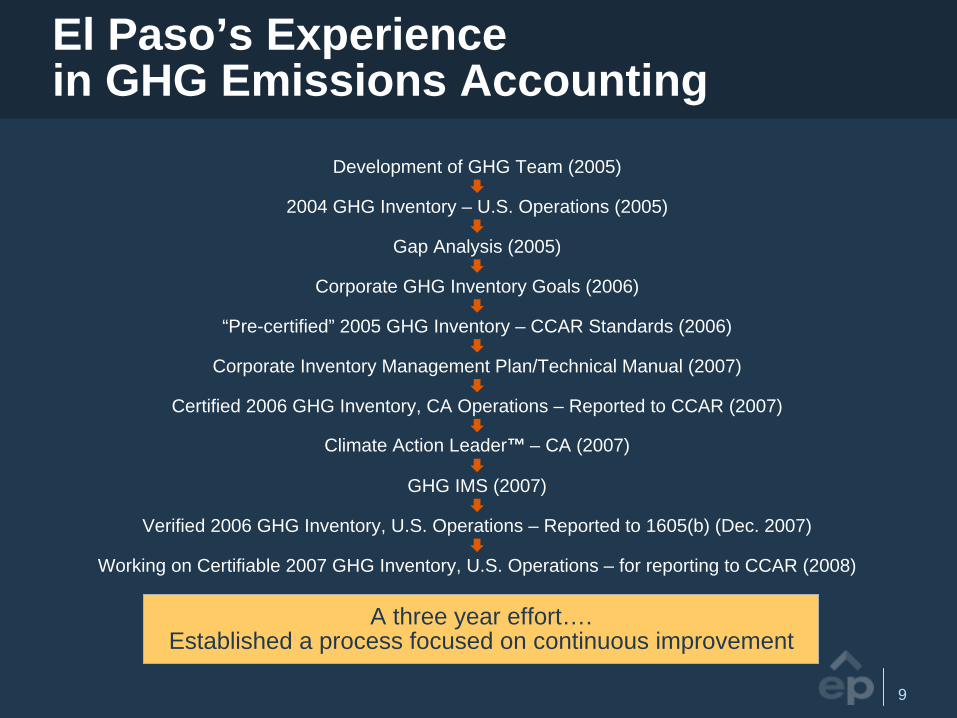
El Paso’s Experience in GHG Emissions Accounting
A three year effort…. Established a process focused on continuous improvement
Development of GHG Team (2005)
2004 GHG Inventory – U.S. Operations (2005)
Gap Analysis (2005)
Corporate GHG Inventory Goals (2006)
“Pre-certified” 2005 GHG Inventory – CCAR Standards (2006)
Corporate Inventory Management Plan/Technical Manual (2007)
Certified 2006 GHG Inventory, CA Operations – Reported to CCAR (2007)
Climate Action Leader™ – CA (2007)
GHG IMS (2007)
Verified 2006 GHG Inventory, U.S. Operations – Reported to 1605(b) (Dec. 2007)
Working on Certifiable 2007 GHG Inventory, U.S. Operations – for reporting to CCAR (2008)
10
Stationary Combustion
6.5842.3%
Indirects0.714.6%
Mobile Combustion
0.050.3%
Process & Fugitive
8.2152.8%
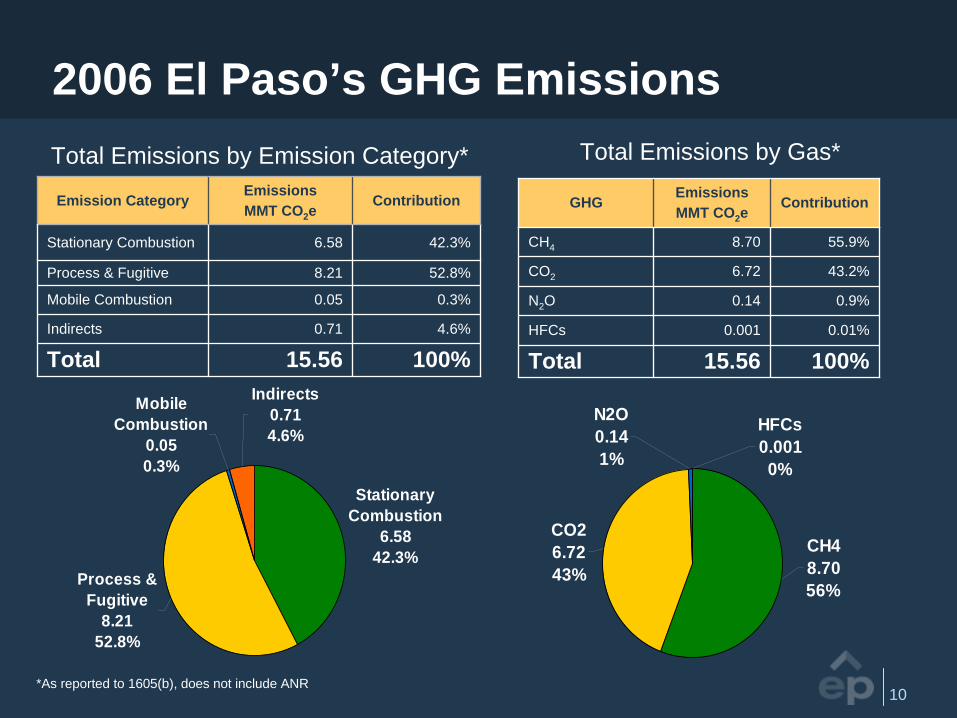
2006 El Paso’s GHG Emissions
GHGEmissionsMMT CO2 e
Contribution
CH4 8.70 55.9%
CO2 6.72 43.2%
N2 O 0.14 0.9%
HFCs 0.001 0.01%
Total 15.56 100%
Emission CategoryEmissionsMMT CO2 e
Contribution
Stationary Combustion 6.58 42.3%
Process & Fugitive 8.21 52.8%
Mobile Combustion 0.05 0.3%
Indirects 0.71 4.6%
Total 15.56 100%
*As reported to 1605(b), does not include ANR
Total Emissions by Emission Category* Total Emissions by Gas*
CH48.7056%
N2O0.141%
HFCs0.0010%
CO26.7243%
11
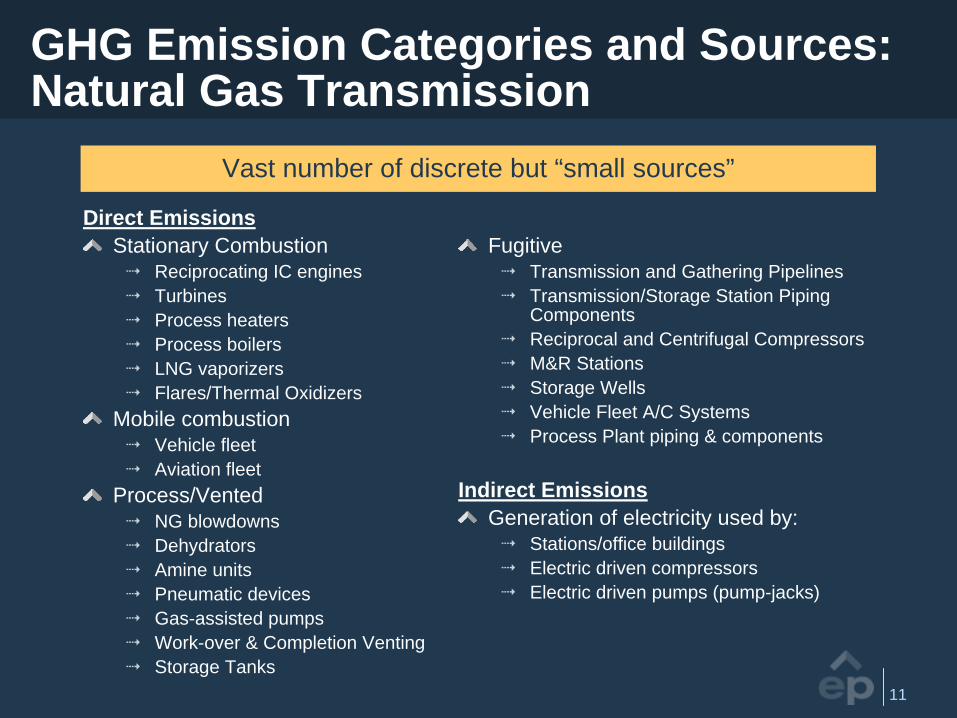
GHG Emission Categories and Sources: Natural Gas Transmission
Direct EmissionsStationary Combustion
Reciprocating IC enginesTurbinesProcess heatersProcess boilersLNG vaporizersFlares/Thermal Oxidizers
Mobile combustionVehicle fleetAviation fleet
Process/VentedNG blowdowns Dehydrators Amine units Pneumatic devicesGas-assisted pumpsWork-over & Completion VentingStorage Tanks
FugitiveTransmission and Gathering PipelinesTransmission/Storage Station Piping ComponentsReciprocal and Centrifugal CompressorsM&R StationsStorage WellsVehicle Fleet A/C Systems Process Plant piping & components
Indirect EmissionsGeneration of electricity used by:
Stations/office buildingsElectric driven compressorsElectric driven pumps (pump-jacks)
Vast number of discrete but “small sources”
12
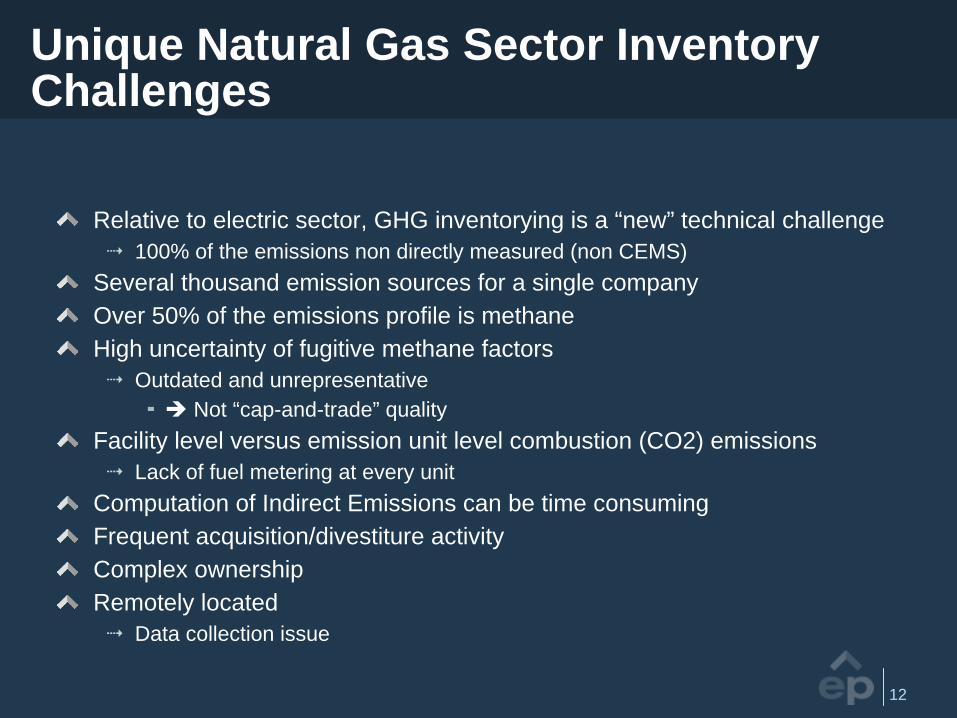
Unique Natural Gas Sector Inventory Challenges
Relative to electric sector, GHG inventorying is a “new” technical challenge100% of the emissions non directly measured (non CEMS)
Several thousand emission sources for a single companyOver 50% of the emissions profile is methaneHigh uncertainty of fugitive methane factors
Outdated and unrepresentativeNot “cap-and-trade” quality
Facility level versus emission unit level combustion (CO2) emissionsLack of fuel metering at every unit
Computation of Indirect Emissions can be time consumingFrequent acquisition/divestiture activityComplex ownershipRemotely located
Data collection issue
13
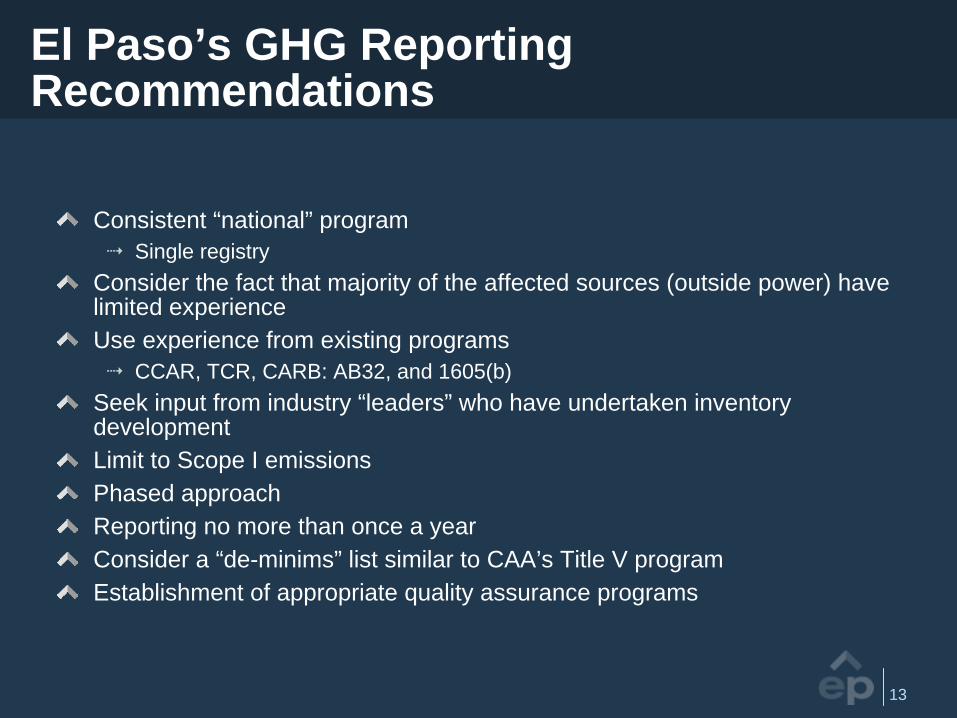
El Paso’s GHG Reporting Recommendations
Consistent “national” programSingle registry
Consider the fact that majority of the affected sources (outside power) have limited experienceUse experience from existing programs
CCAR, TCR, CARB: AB32, and 1605(b)Seek input from industry “leaders” who have undertaken inventory developmentLimit to Scope I emissionsPhased approachReporting no more than once a yearConsider a “de-minims” list similar to CAA’s Title V programEstablishment of appropriate quality assurance programs
14
Natural Gas Policy Considerations
15
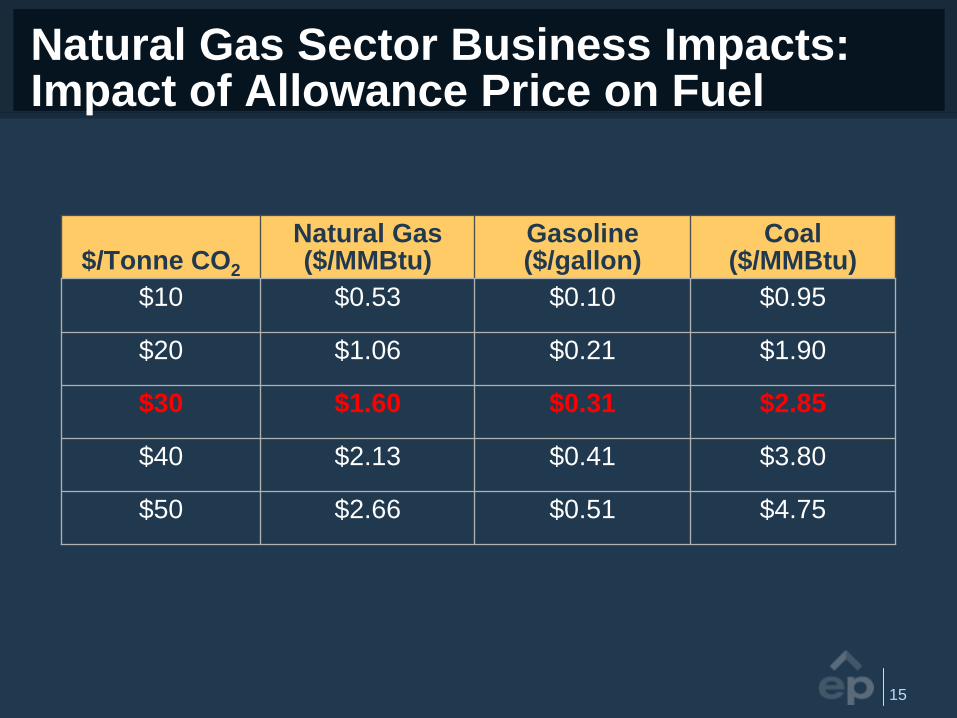
Natural Gas Sector Business Impacts: Impact of Allowance Price on Fuel
$/Tonne CO2
Natural Gas ($/MMBtu)
Gasoline ($/gallon)
Coal ($/MMBtu)
$10 $0.53 $0.10 $0.95
$20 $1.06 $0.21 $1.90
$30 $1.60 $0.31 $2.85
$40 $2.13 $0.41 $3.80
$50 $2.66 $0.51 $4.75
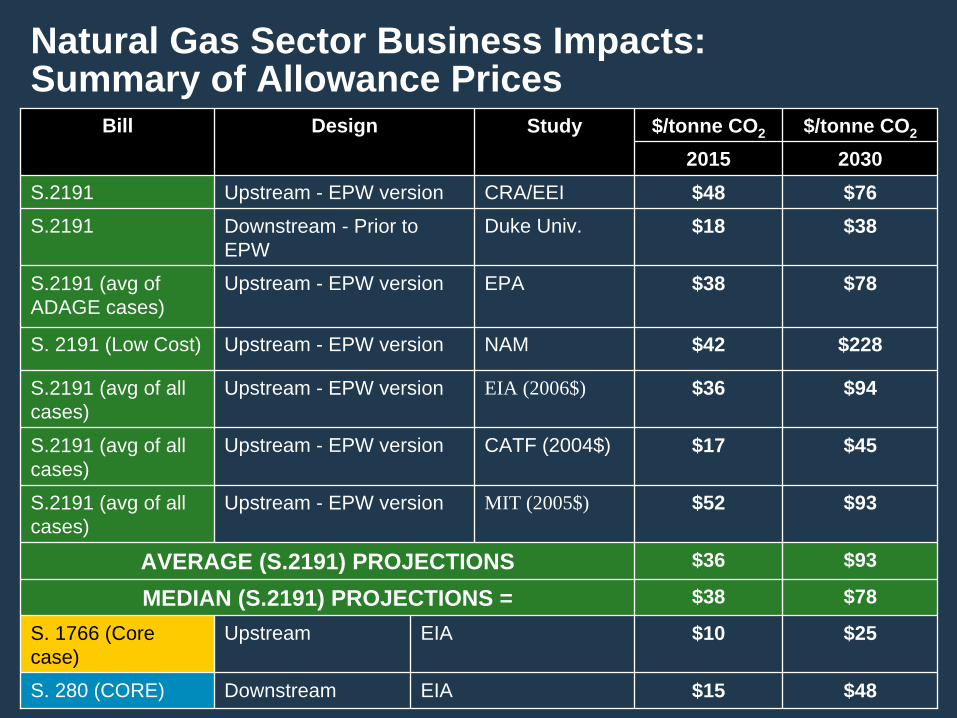
Natural Gas Sector Business Impacts: Summary of Allowance Prices
Bill Design Study $/tonne CO2 $/tonne CO2
2015 2030S.2191 Upstream - EPW version CRA/EEI $48 $76 S.2191 Downstream - Prior to
EPWDuke Univ. $18 $38
S.2191 (avg of ADAGE cases)
Upstream - EPW version EPA $38 $78
S. 2191 (Low Cost) Upstream - EPW version NAM $42 $228
S.2191 (avg of all cases)
Upstream - EPW version EIA (2006$) $36 $94
S.2191 (avg of all cases)
Upstream - EPW version CATF (2004$) $17 $45
S.2191 (avg of all cases)
Upstream - EPW version MIT (2005$) $52 $93
AVERAGE (S.2191) PROJECTIONS $36 $93
MEDIAN (S.2191) PROJECTIONS = $38 $78
S. 1766 (Core case)
Upstream EIA $10 $25
S. 280 (CORE) Downstream EIA $15 $48
17
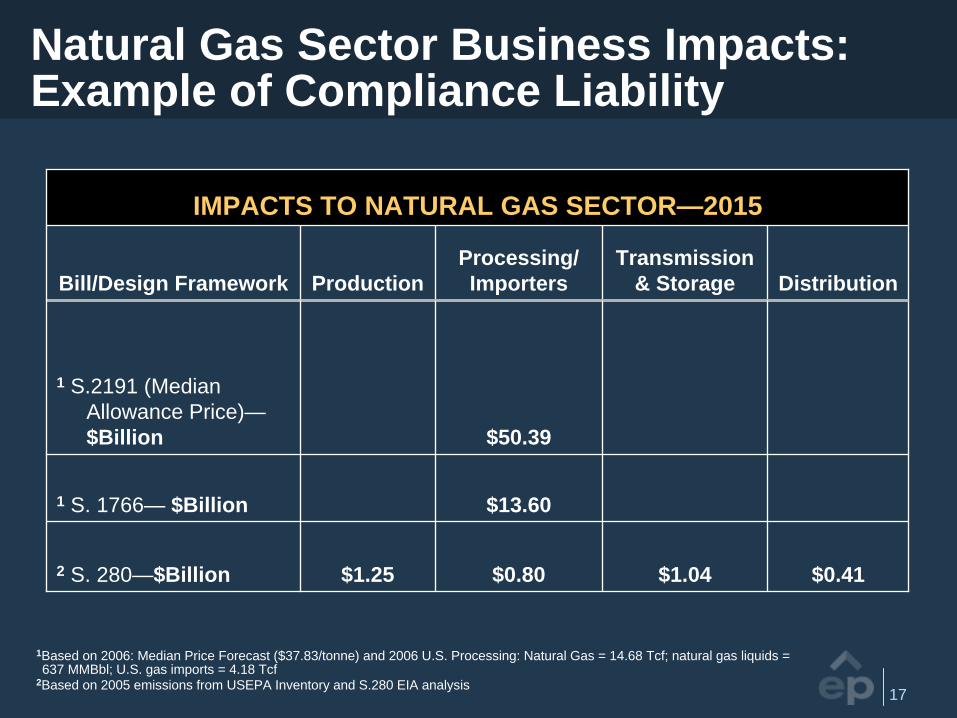
Natural Gas Sector Business Impacts: Example of Compliance Liability
1Based on 2006: Median Price Forecast ($37.83/tonne) and 2006 U.S. Processing: Natural Gas = 14.68 Tcf; natural gas liquids = 637 MMBbl; U.S. gas imports = 4.18 Tcf
2Based on 2005 emissions from USEPA Inventory and S.280 EIA analysis
IMPACTS TO NATURAL GAS SECTOR—2015
Bill/Design Framework ProductionProcessing/ Importers
Transmission & Storage Distribution
1 S.2191 (Median Allowance Price)— $Billion $50.39
1 S. 1766— $Billion $13.60
2 S. 280—$Billion $1.25 $0.80 $1.04 $0.41

18
Natural Gas in a Carbon Constrained Environment: “Mega” Design Issues
Point of regulationUpstream (fuel proxy method) ORDownstream (actual emissions) ORHybrid
Treatment of fugitive emissionsIn the cap or via offsets?
Treatment residential and commercial sectorIn the cap or via codes/standards?
Emissions reportingProtocols? Frequency?
Existing regulatory frameworkFERC, PUC
Transitional assistanceFree Allocation vs. Auctions
Supply/demand dynamics
19
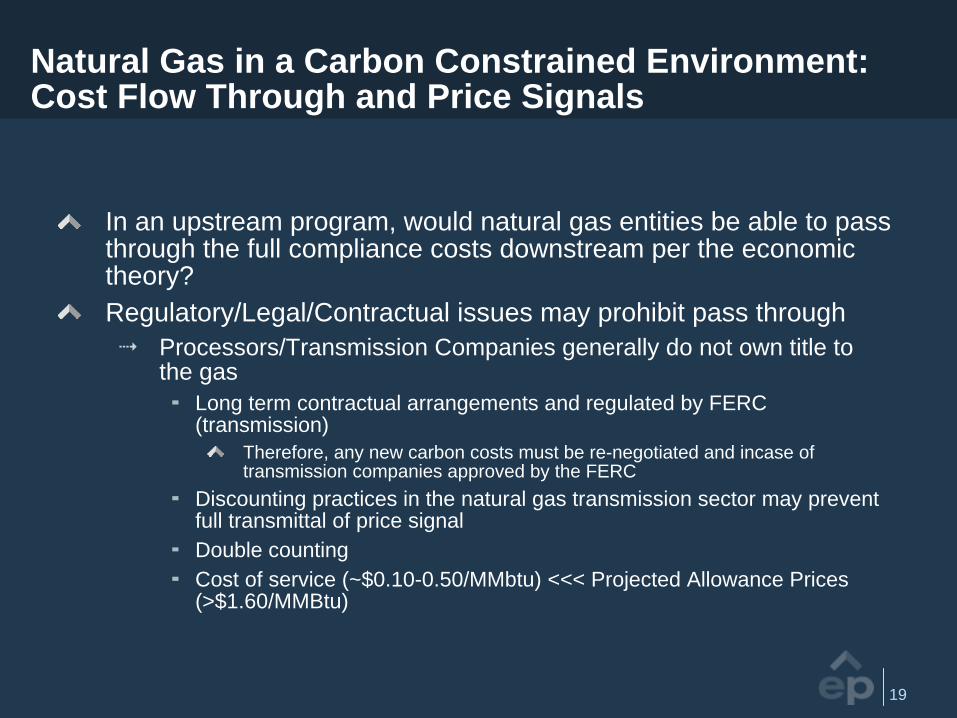
Natural Gas in a Carbon Constrained Environment: Cost Flow Through and Price Signals
In an upstream program, would natural gas entities be able to pass through the full compliance costs downstream per the economic theory?Regulatory/Legal/Contractual issues may prohibit pass through
Processors/Transmission Companies generally do not own title tothe gas
Long term contractual arrangements and regulated by FERC (transmission)
Therefore, any new carbon costs must be re-negotiated and incase of transmission companies approved by the FERC
Discounting practices in the natural gas transmission sector may prevent full transmittal of price signalDouble counting Cost of service (~$0.10-0.50/MMbtu) <<< Projected Allowance Prices (>$1.60/MMBtu)
20
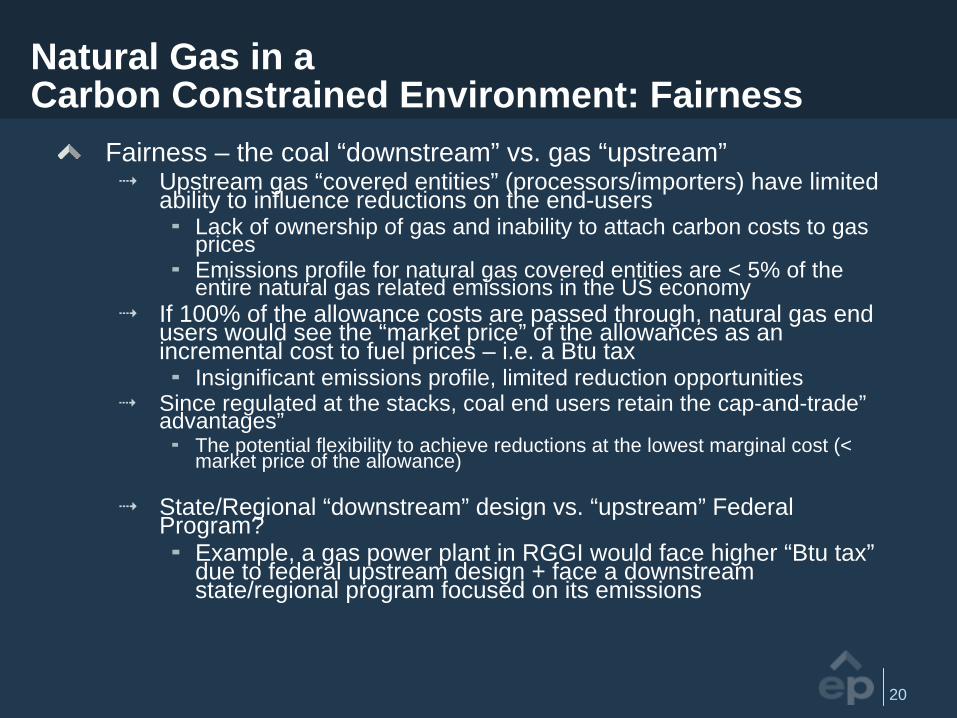
Natural Gas in a Carbon Constrained Environment: Fairness
Fairness – the coal “downstream” vs. gas “upstream”Upstream gas “covered entities” (processors/importers) have limited ability to influence reductions on the end-users
Lack of ownership of gas and inability to attach carbon costs to gas pricesEmissions profile for natural gas covered entities are < 5% of the entire natural gas related emissions in the US economy
If 100% of the allowance costs are passed through, natural gas end users would see the “market price” of the allowances as an incremental cost to fuel prices – i.e. a Btu tax
Insignificant emissions profile, limited reduction opportunitiesSince regulated at the stacks, coal end users retain the cap-and-trade”advantages”
The potential flexibility to achieve reductions at the lowest marginal cost (< market price of the allowance)
State/Regional “downstream” design vs. “upstream” Federal Program?
Example, a gas power plant in RGGI would face higher “Btu tax”due to federal upstream design + face a downstream state/regional program focused on its emissions
21
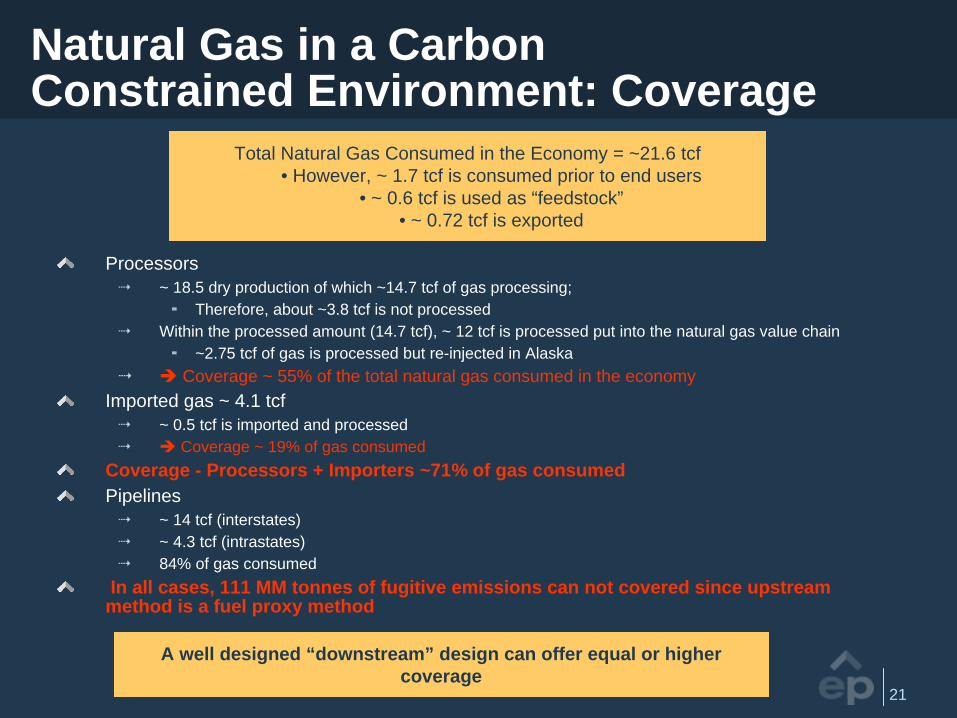
Natural Gas in a Carbon Constrained Environment: Coverage
Processors~ 18.5 dry production of which ~14.7 tcf of gas processing;
Therefore, about ~3.8 tcf is not processed Within the processed amount (14.7 tcf), ~ 12 tcf is processed put into the natural gas value chain
~2.75 tcf of gas is processed but re-injected in AlaskaCoverage ~ 55% of the total natural gas consumed in the economy
Imported gas ~ 4.1 tcf~ 0.5 tcf is imported and processed
Coverage ~ 19% of gas consumedCoverage - Processors + Importers ~71% of gas consumedPipelines
~ 14 tcf (interstates)~ 4.3 tcf (intrastates)84% of gas consumed
In all cases, 111 MM tonnes of fugitive emissions can not covered since upstream method is a fuel proxy method
Total Natural Gas Consumed in the Economy = ~21.6 tcf • However, ~ 1.7 tcf is consumed prior to end users
• ~ 0.6 tcf is used as “feedstock”• ~ 0.72 tcf is exported
A well designed “downstream” design can offer equal or higher coverage
22
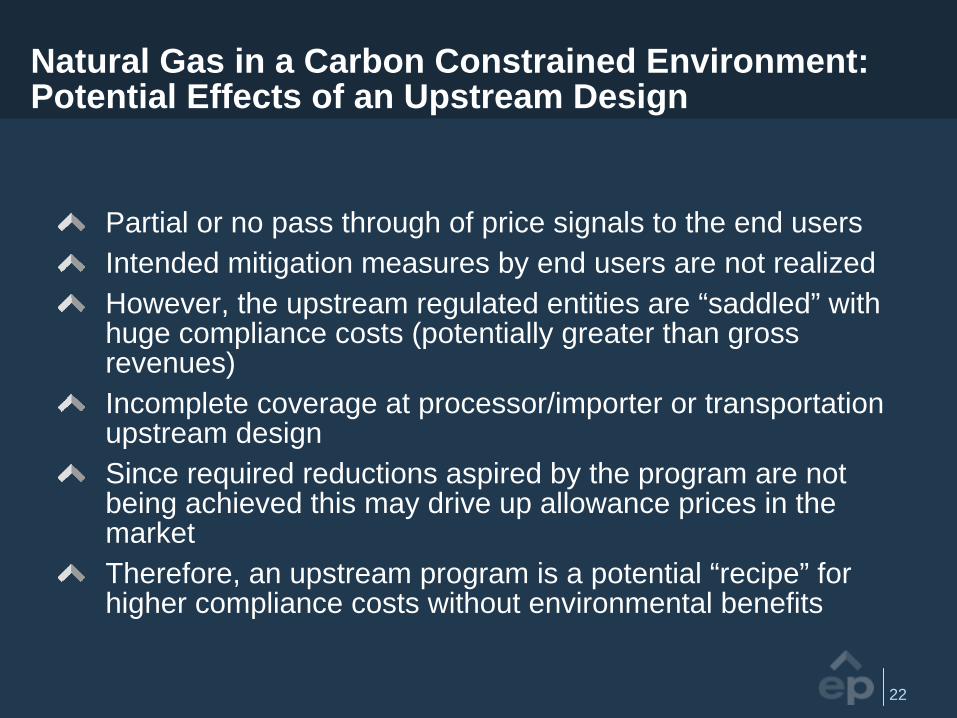
Natural Gas in a Carbon Constrained Environment: Potential Effects of an Upstream Design
Partial or no pass through of price signals to the end usersIntended mitigation measures by end users are not realizedHowever, the upstream regulated entities are “saddled” with huge compliance costs (potentially greater than gross revenues) Incomplete coverage at processor/importer or transportation upstream designSince required reductions aspired by the program are not being achieved this may drive up allowance prices in the marketTherefore, an upstream program is a potential “recipe” for higher compliance costs without environmental benefits
23
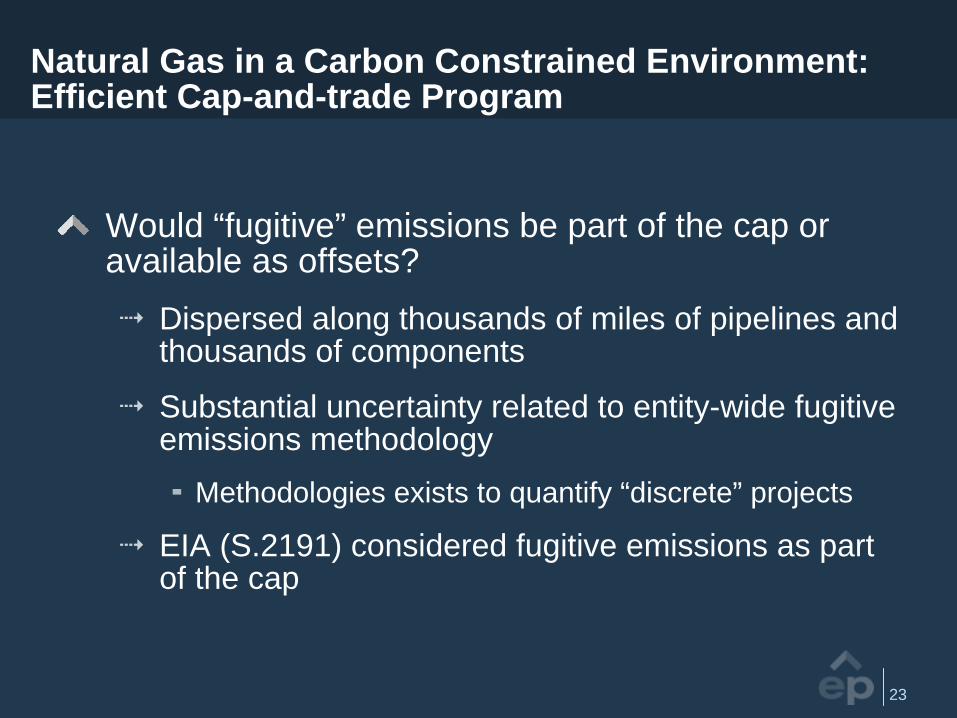
Natural Gas in a Carbon Constrained Environment: Efficient Cap-and-trade Program
Would “fugitive” emissions be part of the cap or available as offsets?
Dispersed along thousands of miles of pipelines and thousands of components
Substantial uncertainty related to entity-wide fugitive emissions methodology
Methodologies exists to quantify “discrete” projects
EIA (S.2191) considered fugitive emissions as part of the cap
24
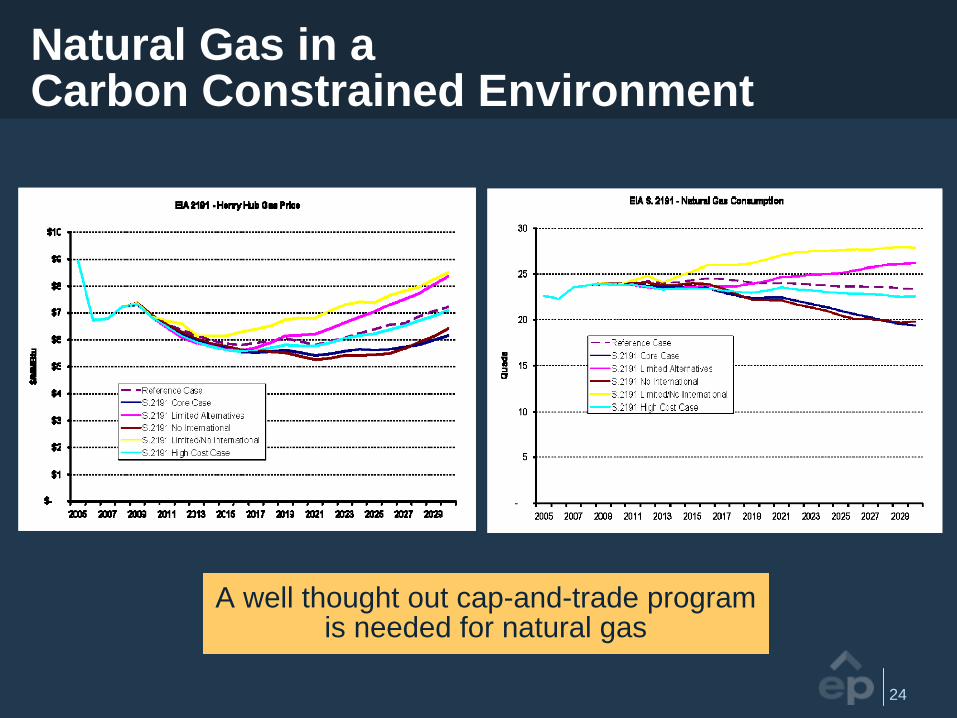
Natural Gas in a Carbon Constrained Environment
A well thought out cap-and-trade program is needed for natural gas
25
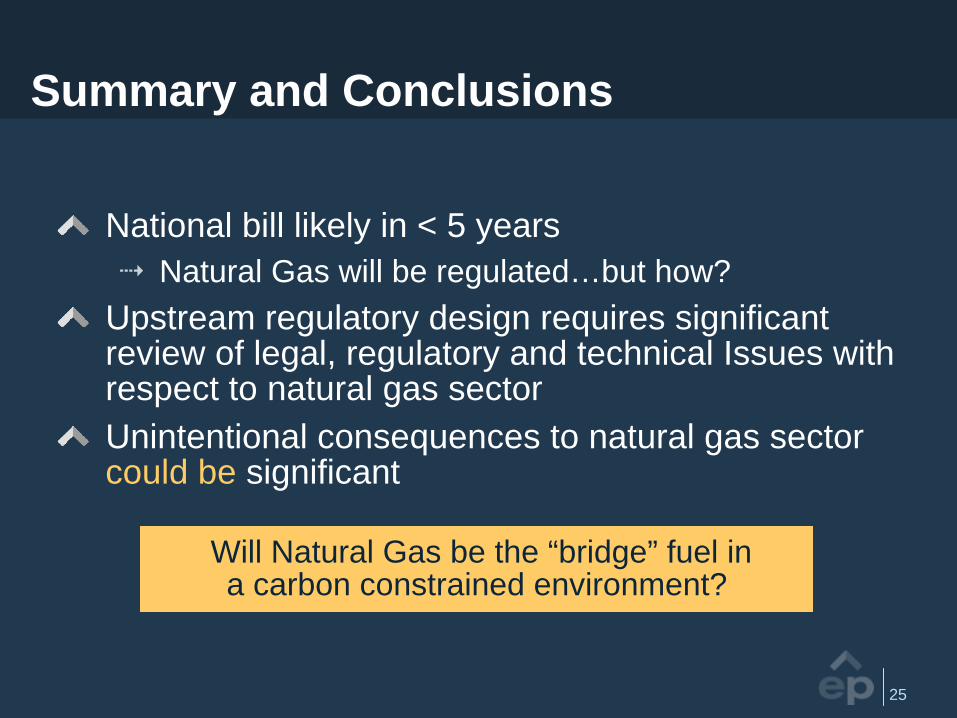
Summary and Conclusions
National bill likely in < 5 yearsNatural Gas will be regulated…but how?
Upstream regulatory design requires significant review of legal, regulatory and technical Issues with respect to natural gas sectorUnintentional consequences to natural gas sector could be significant
Will Natural Gas be the “bridge” fuel in a carbon constrained environment?

El Paso Corporation
Fiji C. George Manager, EH&S
Emissions Accounting and Cap-and-Trade Policy Considerations for
Natural Gas Sector: El Paso Corporation’s Perspective
May 20, 2008