Embed Size (px)
Citation preview

D
Q12019
POWERED BY
Commercial Construction Index
USG CORPORATION + U.S. CHAMBER OF COMMERCE
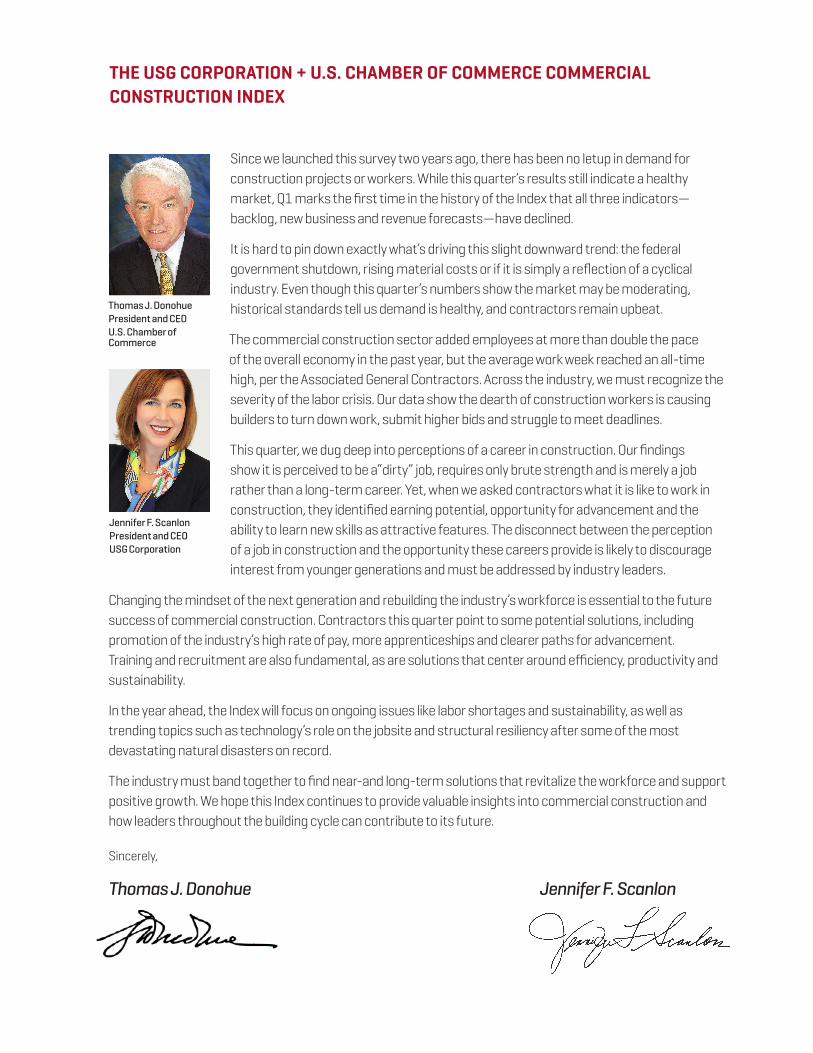
Since we launched this survey two years ago, there has been no letup in demand for construction projects or workers. While this quarter’s results still indicate a healthy market, Q1 marks the first time in the history of the Index that all three indicators—backlog, new business and revenue forecasts—have declined.
It is hard to pin down exactly what’s driving this slight downward trend: the federal government shutdown, rising material costs or if it is simply a reflection of a cyclical industry. Even though this quarter’s numbers show the market may be moderating, historical standards tell us demand is healthy, and contractors remain upbeat.
The commercial construction sector added employees at more than double the pace of the overall economy in the past year, but the average work week reached an all-time high, per the Associated General Contractors. Across the industry, we must recognize the severity of the labor crisis. Our data show the dearth of construction workers is causing builders to turn down work, submit higher bids and struggle to meet deadlines.
This quarter, we dug deep into perceptions of a career in construction. Our findings show it is perceived to be a“dirty” job, requires only brute strength and is merely a job rather than a long-term career. Yet, when we asked contractors what it is like to work in construction, they identified earning potential, opportunity for advancement and the ability to learn new skills as attractive features. The disconnect between the perception of a job in construction and the opportunity these careers provide is likely to discourage interest from younger generations and must be addressed by industry leaders.
Changing the mindset of the next generation and rebuilding the industry’s workforce is essential to the future success of commercial construction. Contractors this quarter point to some potential solutions, including promotion of the industry’s high rate of pay, more apprenticeships and clearer paths for advancement. Training and recruitment are also fundamental, as are solutions that center around efficiency, productivity and sustainability.
In the year ahead, the Index will focus on ongoing issues like labor shortages and sustainability, as well as trending topics such as technology’s role on the jobsite and structural resiliency after some of the most devastating natural disasters on record.
The industry must band together to find near-and long-term solutions that revitalize the workforce and support positive growth. We hope this Index continues to provide valuable insights into commercial construction and how leaders throughout the building cycle can contribute to its future.
Sincerely,
Thomas J. Donohue Jennifer F. Scanlon
THE USG CORPORATION + U.S. CHAMBER OF COMMERCE COMMERCIAL CONSTRUCTION INDEX
Jennifer F. ScanlonPresident and CEOUSG Corporation
Thomas J. DonohuePresident and CEOU.S. Chamber of Commerce
1COMMERCIAL CONSTRUCTION INDEX ∫ Q1 2019Powered by
TABLE OF CONTENTS
The USG Corporation + U.S. Chamber of Commerce Commercial Construction Index (CCI) is a quarterly economic index designed to gauge the outlook for and resulting confidence in the commercial construction industry. Recognizing a need to highlight the important contributions of this sector to the nation’s economy, USG Corporation and the U.S. Chamber of Commerce partnered to produce this first-of-its-kind index. Each quarter, contractors across the country are surveyed in order to better understand their levels of confidence in the industry and top-of-mind concerns.
EXECUTIVE SUMMARY
DRIVERS OF CONFIDENCE
4 Backlog
5 New Business
6 Revenue/Profit Margins
QUARTERLY SPOTLIGHT
7 Perception of Construction Careers
MARKET TRENDS
12 Workforce
15 Access to Financing
16 Materials & Equipment
METHODOLOGY
1
2
3
4
5
commercial
construction
i n d e x
usg + us chamber
72
11
Powered by2
11
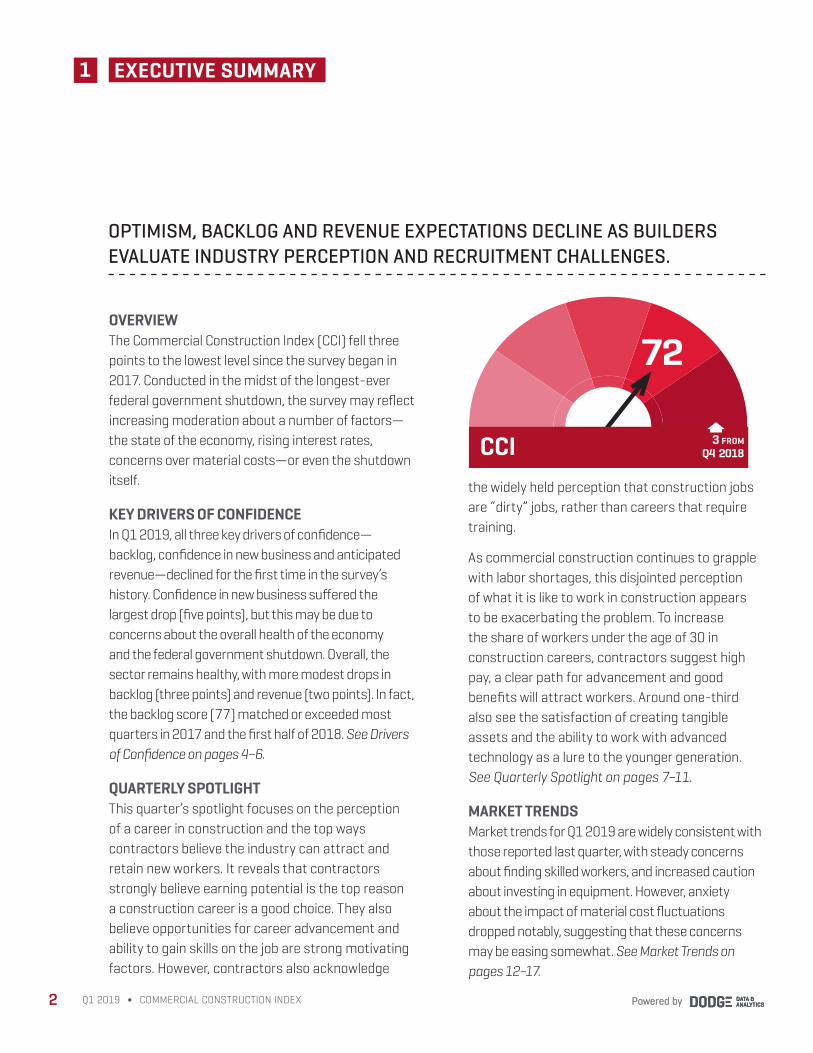
OVERVIEW The Commercial Construction Index (CCI) fell three points to the lowest level since the survey began in 2017. Conducted in the midst of the longest-ever federal government shutdown, the survey may reflect increasing moderation about a number of factors—the state of the economy, rising interest rates, concerns over material costs—or even the shutdown itself.
KEY DRIVERS OF CONFIDENCEIn Q1 2019, all three key drivers of confidence—backlog, confidence in new business and anticipated revenue—declined for the first time in the survey’s history. Confidence in new business suffered the largest drop (five points), but this may be due to concerns about the overall health of the economy and the federal government shutdown. Overall, the sector remains healthy, with more modest drops in backlog (three points) and revenue (two points). In fact, the backlog score (77) matched or exceeded most quarters in 2017 and the first half of 2018. See Drivers of Confidence on pages 4–6.
QUARTERLY SPOTLIGHTThis quarter’s spotlight focuses on the perception of a career in construction and the top ways contractors believe the industry can attract and retain new workers. It reveals that contractors strongly believe earning potential is the top reason a construction career is a good choice. They also believe opportunities for career advancement and ability to gain skills on the job are strong motivating factors. However, contractors also acknowledge
Powered by2 Q1 2019 ∫ COMMERCIAL CONSTRUCTION INDEX
OPTIMISM, BACKLOG AND REVENUE EXPECTATIONS DECLINE AS BUILDERS EVALUATE INDUSTRY PERCEPTION AND RECRUITMENT CHALLENGES.
CCI
EXECUTIVE SUMMARY
3 FROM Q4 2018
the widely held perception that construction jobs are “dirty” jobs, rather than careers that require training.
As commercial construction continues to grapple with labor shortages, this disjointed perception of what it is like to work in construction appears to be exacerbating the problem. To increase the share of workers under the age of 30 in construction careers, contractors suggest high pay, a clear path for advancement and good benefits will attract workers. Around one-third also see the satisfaction of creating tangible assets and the ability to work with advanced technology as a lure to the younger generation. See Quarterly Spotlight on pages 7–11.
MARKET TRENDSMarket trends for Q1 2019 are widely consistent with those reported last quarter, with steady concerns about finding skilled workers, and increased caution about investing in equipment. However, anxiety about the impact of material cost fluctuations dropped notably, suggesting that these concerns may be easing somewhat. See Market Trends on pages 12–17.
➧
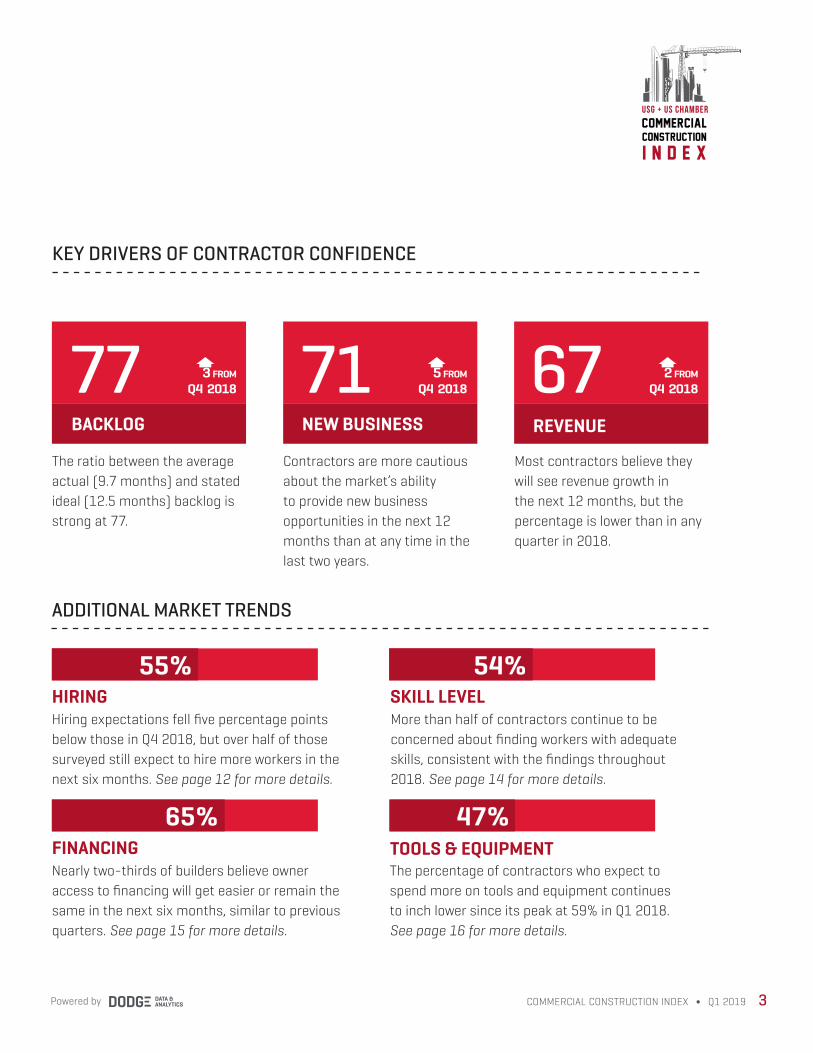
KEY DRIVERS OF CONTRACTOR CONFIDENCE
2 FROM Q4 201867
REVENUE
3 FROM Q4 201877
BACKLOG
5 FROM Q4 201871
NEW BUSINESS
The ratio between the average actual (9.7 months) and stated ideal (12.5 months) backlog is strong at 77.
Contractors are more cautious about the market’s ability to provide new business opportunities in the next 12 months than at any time in the last two years.
Most contractors believe they will see revenue growth in the next 12 months, but the percentage is lower than in any quarter in 2018.
3COMMERCIAL CONSTRUCTION INDEX ∫ Q1 2019Powered by
ADDITIONAL MARKET TRENDS
HIRING
FINANCING
SKILL LEVELHiring expectations fell five percentage points below those in Q4 2018, but over half of those surveyed still expect to hire more workers in the next six months. See page 12 for more details.
More than half of contractors continue to be concerned about finding workers with adequate skills, consistent with the findings throughout 2018. See page 14 for more details.
55%
TOOLS & EQUIPMENT Nearly two-thirds of builders believe owner access to financing will get easier or remain the same in the next six months, similar to previous quarters. See page 15 for more details.
The percentage of contractors who expect to spend more on tools and equipment continues to inch lower since its peak at 59% in Q1 2018. See page 16 for more details.
65%
54%
47%
commercial
construction
i n d e x
usg + us chamber
➧ ➧ ➧
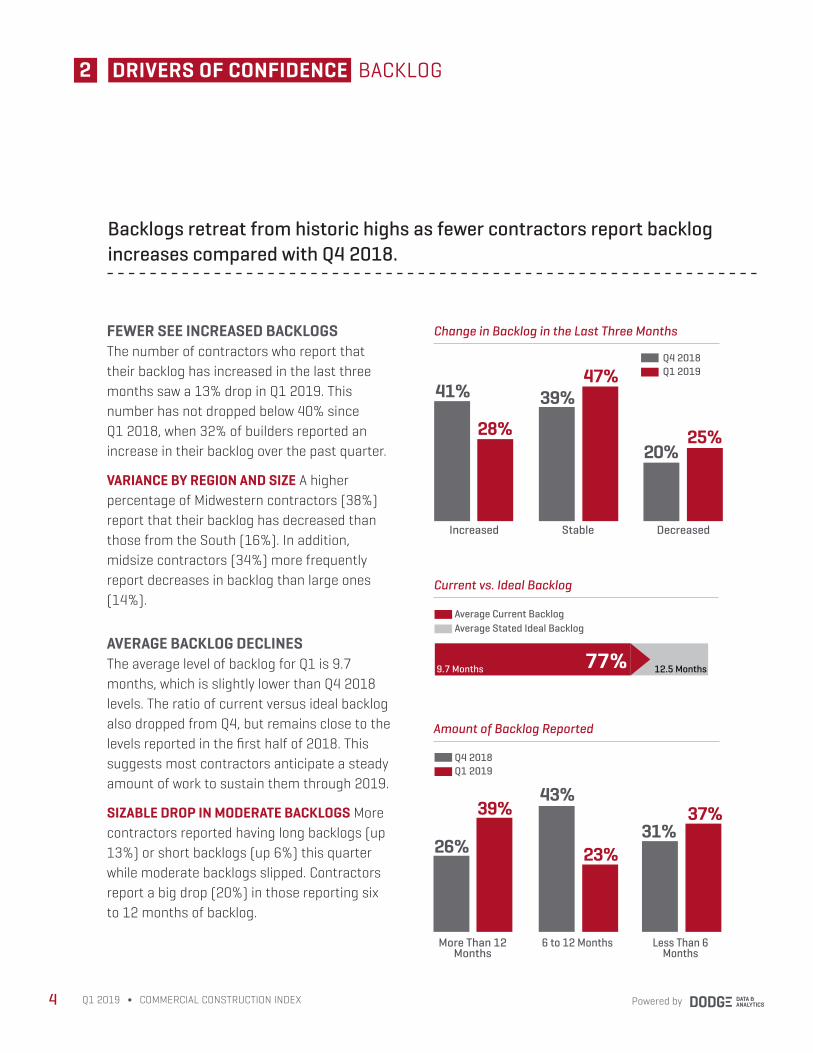
BACKLOG 2 DRIVERS OF CONFIDENCE
FEWER SEE INCREASED BACKLOGSThe number of contractors who report that their backlog has increased in the last three months saw a 13% drop in Q1 2019. This number has not dropped below 40% since Q1 2018, when 32% of builders reported an increase in their backlog over the past quarter.
VARIANCE BY REGION AND SIZE A higher percentage of Midwestern contractors (38%) report that their backlog has decreased than those from the South (16%). In addition, midsize contractors (34%) more frequently report decreases in backlog than large ones (14%).
AVERAGE BACKLOG DECLINESThe average level of backlog for Q1 is 9.7 months, which is slightly lower than Q4 2018 levels. The ratio of current versus ideal backlog also dropped from Q4, but remains close to the levels reported in the first half of 2018. This suggests most contractors anticipate a steady amount of work to sustain them through 2019.
SIZABLE DROP IN MODERATE BACKLOGS More contractors reported having long backlogs (up 13%) or short backlogs (up 6%) this quarter while moderate backlogs slipped. Contractors report a big drop (20%) in those reporting six to 12 months of backlog.
Amount of Backlog Reported
Change in Backlog in the Last Three Months
28%
Increased Decreased
Q1 2019Q4 2018
Stable
Powered by4
9.7 Months 12.5 Months
Average Current BacklogAverage Stated Ideal Backlog
Current vs. Ideal Backlog
47%
25%
39%
20%
Backlogs retreat from historic highs as fewer contractors report backlog increases compared with Q4 2018.
Q1 2019 ∫ COMMERCIAL CONSTRUCTION INDEX
39%
More Than 12 Months
Less Than 6 Months
Q1 2019Q4 2018
6 to 12 Months
23%
37%
26%
43%
31%
77%
41%
NEW BUSINESS 2
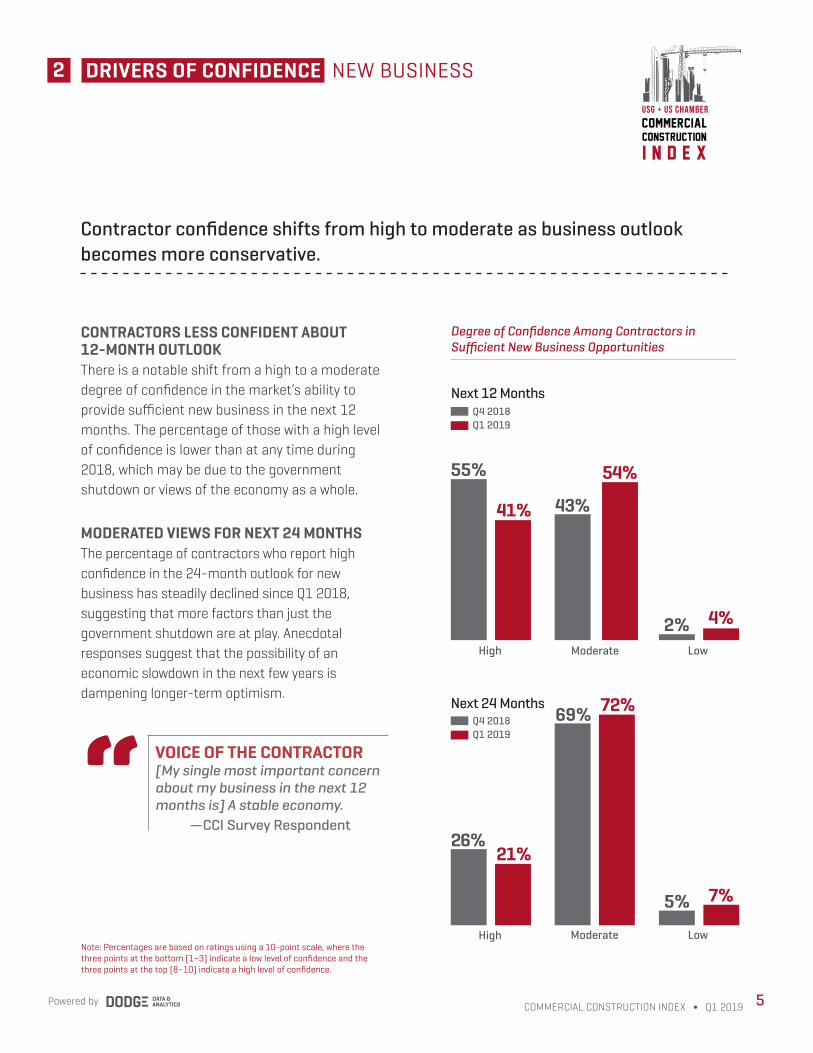
CONTRACTORS LESS CONFIDENT ABOUT 12-MONTH OUTLOOKThere is a notable shift from a high to a moderate degree of confidence in the market’s ability to provide sufficient new business in the next 12 months. The percentage of those with a high level of confidence is lower than at any time during 2018, which may be due to the government shutdown or views of the economy as a whole.
MODERATED VIEWS FOR NEXT 24 MONTHSThe percentage of contractors who report high confidence in the 24-month outlook for new business has steadily declined since Q1 2018, suggesting that more factors than just the government shutdown are at play. Anecdotal responses suggest that the possibility of an economic slowdown in the next few years is dampening longer-term optimism.
Degree of Confidence Among Contractors in Sufficient New Business Opportunities
7%5%
Low
72%69%
Moderate
21%26%
High
4%2%Low
54%
Moderate
41%
55%
High
Next 12 Months
Next 24 Months
Note: Percentages are based on ratings using a 10-point scale, where the three points at the bottom (1–3) indicate a low level of confidence and the three points at the top (8–10) indicate a high level of confidence.
43%
DRIVERS OF CONFIDENCE
Contractor confidence shifts from high to moderate as business outlook becomes more conservative.
Q1 2019Q4 2018
Q1 2019Q4 2018
5COMMERCIAL CONSTRUCTION INDEX ∫ Q1 2019Powered by
commercial
construction
i n d e x
usg + us chamber
VOICE OF THE CONTRACTOR[My single most important concern about my business in the next 12 months is] A stable economy. —CCI Survey Respondent
“
REVENUE/PROFIT MARGINS2 DRIVERS OF CONFIDENCE
Powered by6 Q1 2019 ∫ COMMERCIAL CONSTRUCTION INDEX
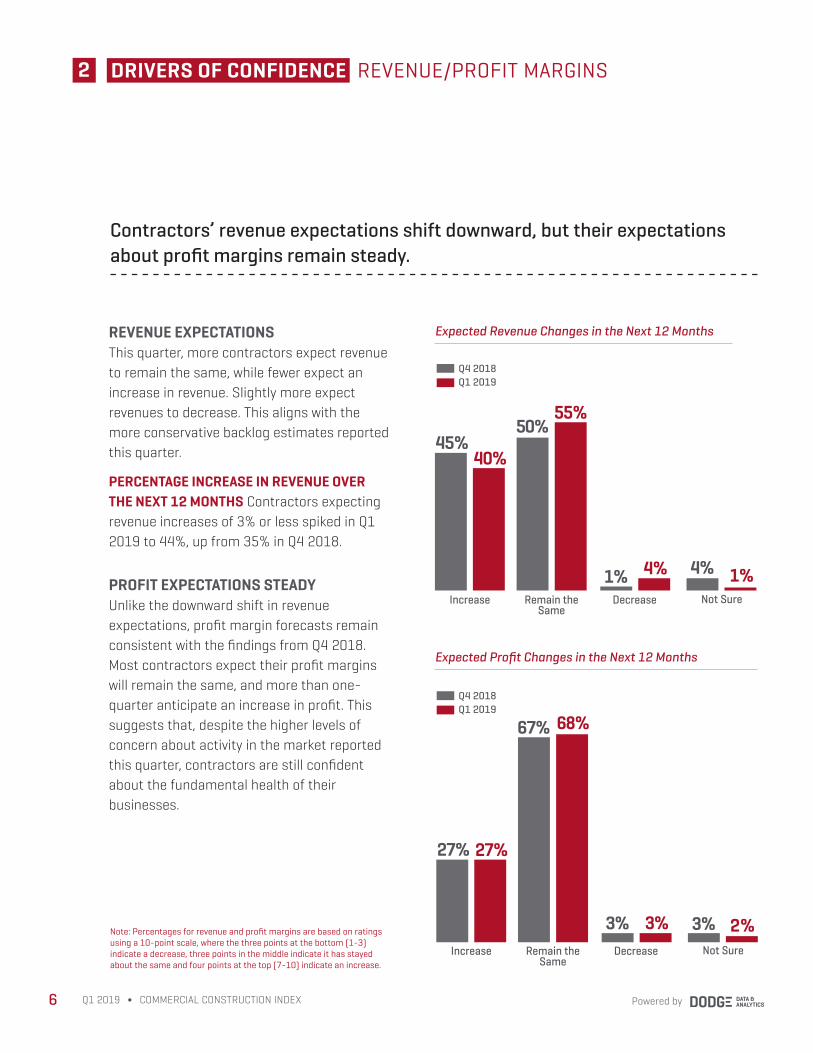
REVENUE EXPECTATIONS This quarter, more contractors expect revenue to remain the same, while fewer expect an increase in revenue. Slightly more expect revenues to decrease. This aligns with the more conservative backlog estimates reported this quarter.
PERCENTAGE INCREASE IN REVENUE OVER THE NEXT 12 MONTHS Contractors expecting revenue increases of 3% or less spiked in Q1 2019 to 44%, up from 35% in Q4 2018.
PROFIT EXPECTATIONS STEADYUnlike the downward shift in revenue expectations, profit margin forecasts remain consistent with the findings from Q4 2018. Most contractors expect their profit margins will remain the same, and more than one-quarter anticipate an increase in profit. This suggests that, despite the higher levels of concern about activity in the market reported this quarter, contractors are still confident about the fundamental health of their businesses.
Note: Percentages for revenue and profit margins are based on ratings using a 10-point scale, where the three points at the bottom (1-3) indicate a decrease, three points in the middle indicate it has stayed about the same and four points at the top (7-10) indicate an increase.
Contractors’ revenue expectations shift downward, but their expectations about profit margins remain steady.
Expected Revenue Changes in the Next 12 Months
Expected Profit Changes in the Next 12 Months
27% 27%
Increase
67% 68%
3% 3%Remain the
SameDecrease
Q1 2019Q4 2018
3% 2%Not Sure
45%40%
Increase
50%55%
1% 4%Remain the
SameDecrease
Q1 2019Q4 2018
4% 1%Not Sure
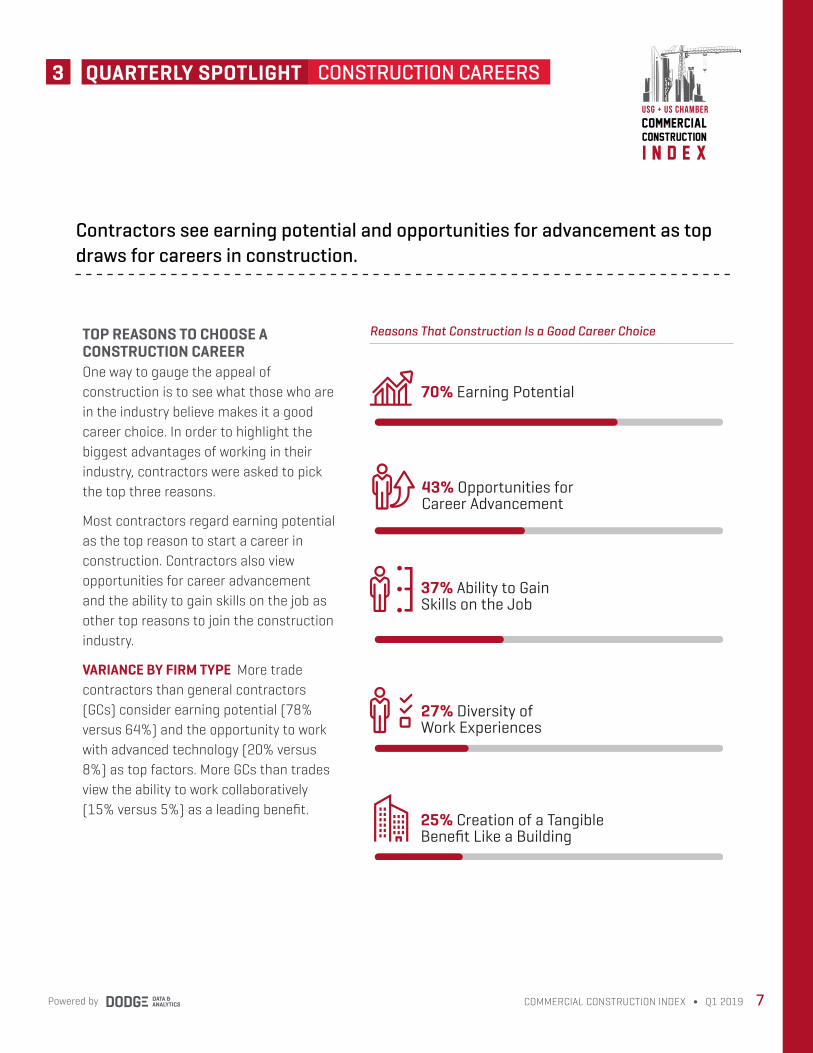
TOP REASONS TO CHOOSE A CONSTRUCTION CAREEROne way to gauge the appeal of construction is to see what those who are in the industry believe makes it a good career choice. In order to highlight the biggest advantages of working in their industry, contractors were asked to pick the top three reasons.
Most contractors regard earning potential as the top reason to start a career in construction. Contractors also view opportunities for career advancement and the ability to gain skills on the job as other top reasons to join the construction industry.
VARIANCE BY FIRM TYPE More trade contractors than general contractors (GCs) consider earning potential (78% versus 64%) and the opportunity to work with advanced technology (20% versus 8%) as top factors. More GCs than trades view the ability to work collaboratively (15% versus 5%) as a leading benefit.
Contractors see earning potential and opportunities for advancement as top draws for careers in construction.
7COMMERCIAL CONSTRUCTION INDEX ∫ Q1 2019Powered by
33 CONSTRUCTION CAREERSQUARTERLY SPOTLIGHT
Reasons That Construction Is a Good Career Choice
commercial
construction
i n d e x
usg + us chamber
70% Earning Potential
43% Opportunities for Career Advancement
37% Ability to Gain Skills on the Job
27% Diversity of Work Experiences
25% Creation of a Tangible Benefit Like a Building
Powered by8 Q1 2019 ∫ COMMERCIAL CONSTRUCTION INDEX
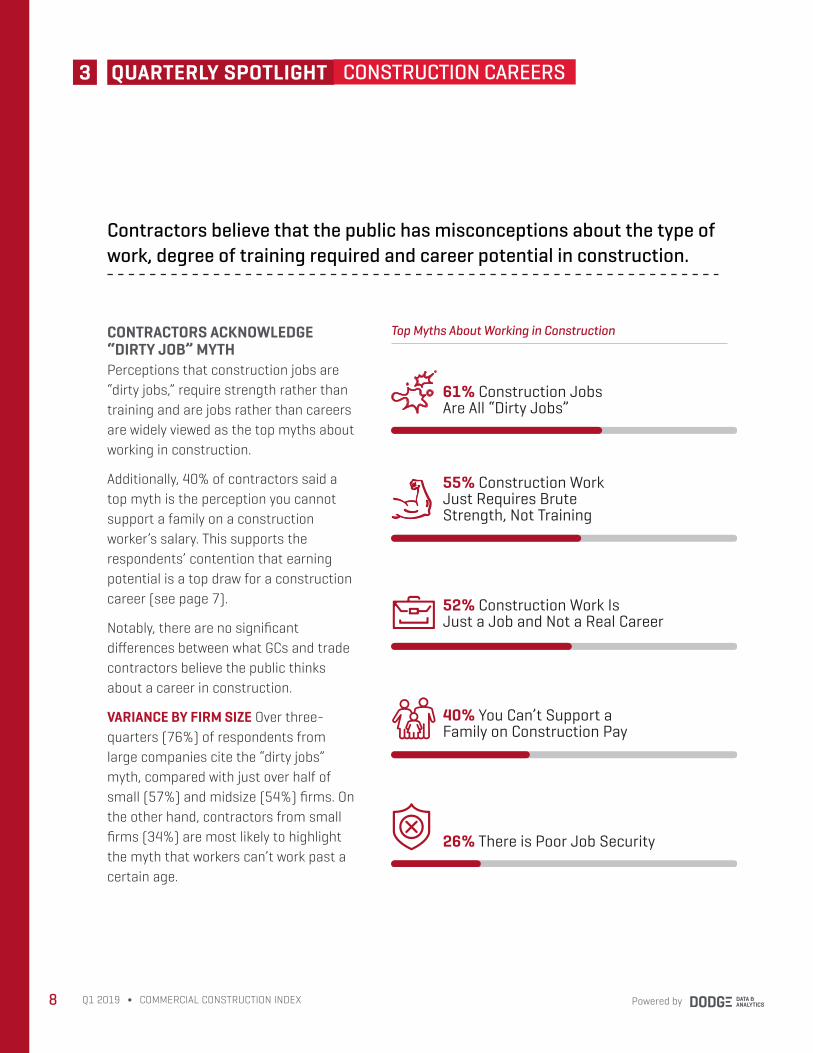
CONTRACTORS ACKNOWLEDGE “DIRTY JOB” MYTHPerceptions that construction jobs are “dirty jobs,” require strength rather than training and are jobs rather than careers are widely viewed as the top myths about working in construction.
Additionally, 40% of contractors said a top myth is the perception you cannot support a family on a construction worker’s salary. This supports the respondents’ contention that earning potential is a top draw for a construction career (see page 7).
Notably, there are no significant differences between what GCs and trade contractors believe the public thinks about a career in construction.
VARIANCE BY FIRM SIZE Over three-quarters (76%) of respondents from large companies cite the “dirty jobs” myth, compared with just over half of small (57%) and midsize (54%) firms. On the other hand, contractors from small firms (34%) are most likely to highlight the myth that workers can’t work past a certain age.
Contractors believe that the public has misconceptions about the type of work, degree of training required and career potential in construction.
3 QUARTERLY SPOTLIGHT CONSTRUCTION CAREERS
Top Myths About Working in Construction
61% Construction Jobs Are All “Dirty Jobs”
55% Construction Work Just Requires Brute Strength, Not Training
52% Construction Work Is Just a Job and Not a Real Career
40% You Can’t Support a Family on Construction Pay
26% There is Poor Job Security
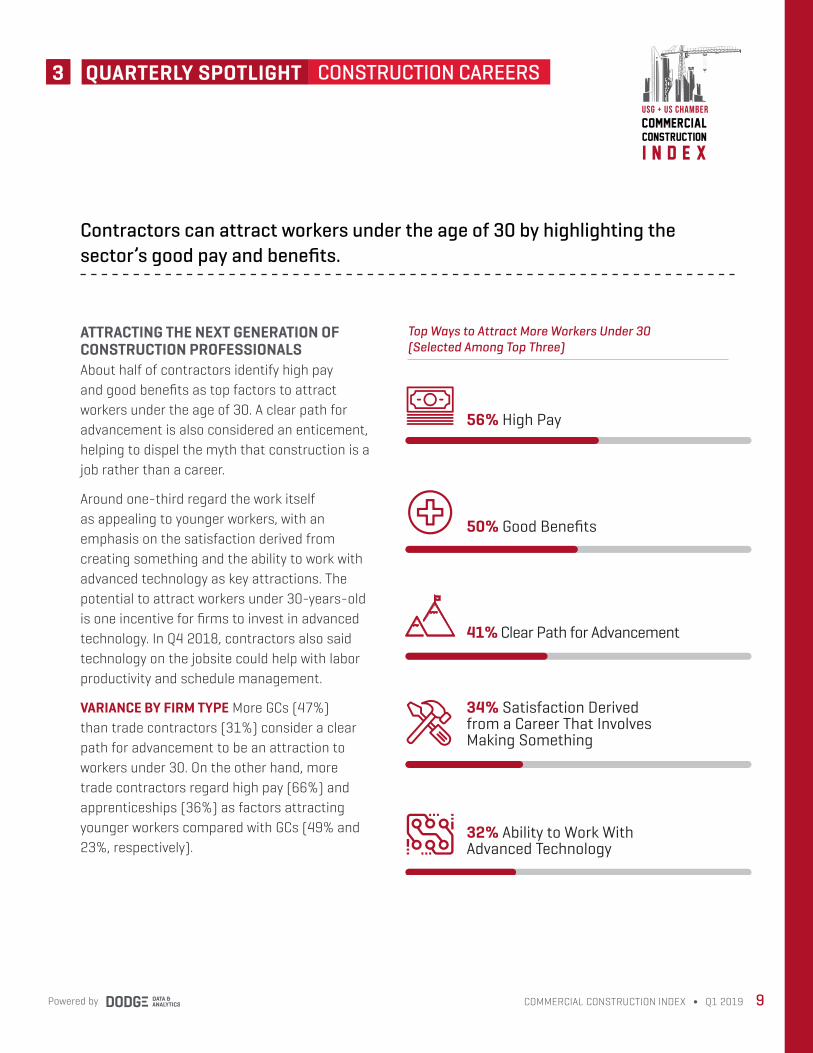
ATTRACTING THE NEXT GENERATION OF CONSTRUCTION PROFESSIONALSAbout half of contractors identify high pay and good benefits as top factors to attract workers under the age of 30. A clear path for advancement is also considered an enticement, helping to dispel the myth that construction is a job rather than a career.
Around one-third regard the work itself as appealing to younger workers, with an emphasis on the satisfaction derived from creating something and the ability to work with advanced technology as key attractions. The potential to attract workers under 30-years-old is one incentive for firms to invest in advanced technology. In Q4 2018, contractors also said technology on the jobsite could help with labor productivity and schedule management.
VARIANCE BY FIRM TYPE More GCs (47%) than trade contractors (31%) consider a clear path for advancement to be an attraction to workers under 30. On the other hand, more trade contractors regard high pay (66%) and apprenticeships (36%) as factors attracting younger workers compared with GCs (49% and 23%, respectively).
Contractors can attract workers under the age of 30 by highlighting the sector’s good pay and benefits.
9COMMERCIAL CONSTRUCTION INDEX ∫ Q1 2019Powered by
Top Ways to Attract More Workers Under 30 (Selected Among Top Three)
commercial
construction
i n d e x
usg + us chamber
33 CONSTRUCTION CAREERSQUARTERLY SPOTLIGHT
56% High Pay
50% Good Benefits
41% Clear Path for Advancement
34% Satisfaction Derived from a Career That Involves Making Something
32% Ability to Work With Advanced Technology
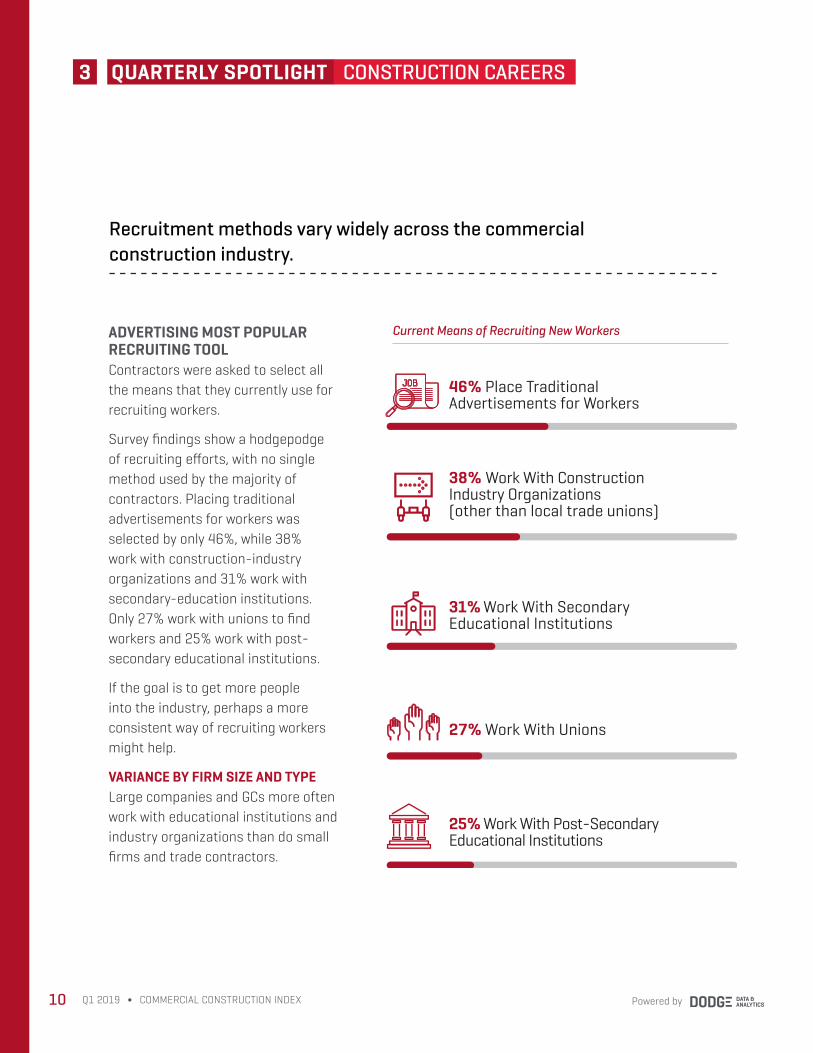
ADVERTISING MOST POPULAR RECRUITING TOOLContractors were asked to select all the means that they currently use for recruiting workers.
Survey findings show a hodgepodge of recruiting efforts, with no single method used by the majority of contractors. Placing traditional advertisements for workers was selected by only 46%, while 38% work with construction-industry organizations and 31% work with secondary-education institutions. Only 27% work with unions to find workers and 25% work with post-secondary educational institutions.
If the goal is to get more people into the industry, perhaps a more consistent way of recruiting workers might help.
VARIANCE BY FIRM SIZE AND TYPE Large companies and GCs more often work with educational institutions and industry organizations than do small firms and trade contractors.
Recruitment methods vary widely across the commercial construction industry.
Powered by10 Q1 2019 ∫ COMMERCIAL CONSTRUCTION INDEX
3 QUARTERLY SPOTLIGHT CONSTRUCTION CAREERS
Current Means of Recruiting New Workers
46% Place Traditional Advertisements for Workers
38% Work With Construction Industry Organizations (other than local trade unions)
31% Work With Secondary Educational Institutions
27% Work With Unions
25% Work With Post-Secondary Educational Institutions
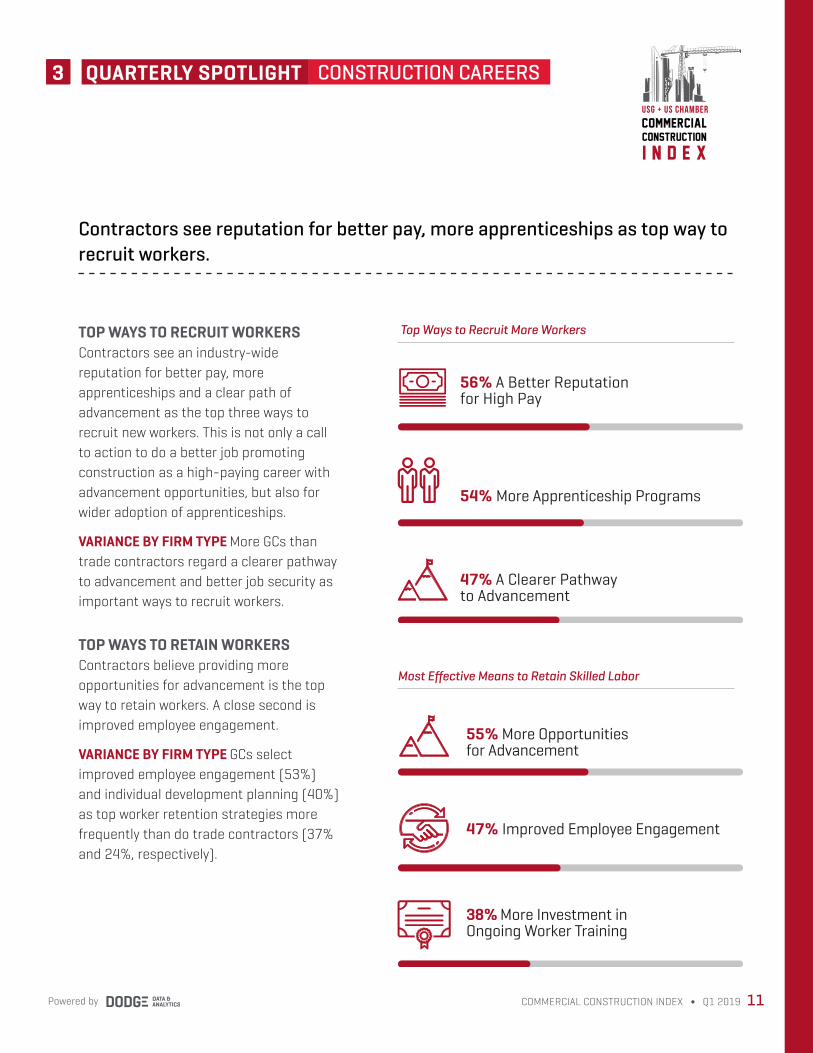
TOP WAYS TO RECRUIT WORKERSContractors see an industry-wide reputation for better pay, more apprenticeships and a clear path of advancement as the top three ways to recruit new workers. This is not only a call to action to do a better job promoting construction as a high-paying career with advancement opportunities, but also for wider adoption of apprenticeships.
VARIANCE BY FIRM TYPE More GCs than trade contractors regard a clearer pathway to advancement and better job security as important ways to recruit workers.
TOP WAYS TO RETAIN WORKERSContractors believe providing more opportunities for advancement is the top way to retain workers. A close second is improved employee engagement.
VARIANCE BY FIRM TYPE GCs select improved employee engagement (53%) and individual development planning (40%) as top worker retention strategies more frequently than do trade contractors (37% and 24%, respectively).
Contractors see reputation for better pay, more apprenticeships as top way to recruit workers.
11COMMERCIAL CONSTRUCTION INDEX ∫ Q1 2019Powered by
commercial
construction
i n d e x
usg + us chamber
Top Ways to Recruit More Workers
Most Effective Means to Retain Skilled Labor
33 CONSTRUCTION CAREERSQUARTERLY SPOTLIGHT
56% A Better Reputation for High Pay
54% More Apprenticeship Programs
47% A Clearer Pathway to Advancement
55% More Opportunities for Advancement
47% Improved Employee Engagement
38% More Investment in Ongoing Worker Training
4 WORKFORCEMARKET TRENDS
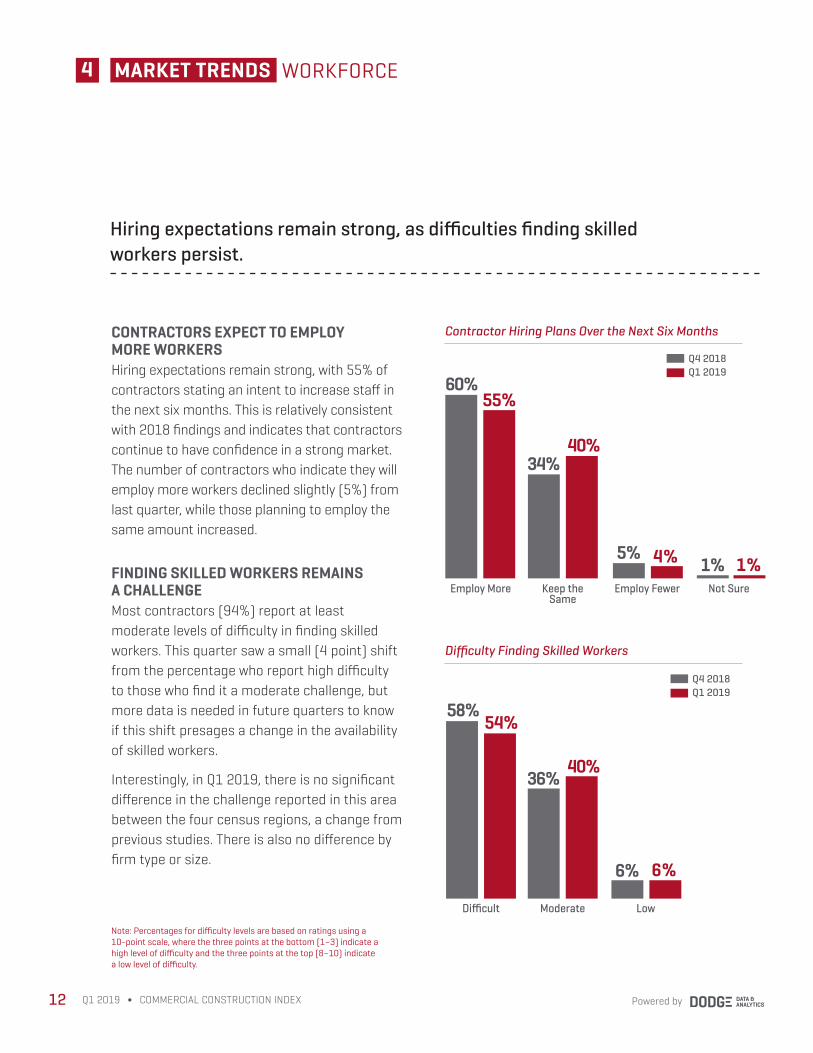
CONTRACTORS EXPECT TO EMPLOY MORE WORKERS Hiring expectations remain strong, with 55% of contractors stating an intent to increase staff in the next six months. This is relatively consistent with 2018 findings and indicates that contractors continue to have confidence in a strong market. The number of contractors who indicate they will employ more workers declined slightly (5%) from last quarter, while those planning to employ the same amount increased.
FINDING SKILLED WORKERS REMAINS A CHALLENGE Most contractors (94%) report at least moderate levels of difficulty in finding skilled workers. This quarter saw a small (4 point) shift from the percentage who report high difficulty to those who find it a moderate challenge, but more data is needed in future quarters to know if this shift presages a change in the availability of skilled workers.
Interestingly, in Q1 2019, there is no significant difference in the challenge reported in this area between the four census regions, a change from previous studies. There is also no difference by firm type or size.
Note: Percentages for difficulty levels are based on ratings using a 10-point scale, where the three points at the bottom (1–3) indicate a high level of difficulty and the three points at the top (8–10) indicate a low level of difficulty.
Contractor Hiring Plans Over the Next Six Months
Difficulty Finding Skilled Workers
60%55%
Employ More Not Sure
34%40%
1% 1%5% 4%
Keep the Same
Employ Fewer
58%54%
Difficult
36%40%
6% 6%
Moderate Low
Hiring expectations remain strong, as difficulties finding skilled workers persist.
Q1 2019Q4 2018
Q1 2019Q4 2018
Powered by12 Q1 2019 ∫ COMMERCIAL CONSTRUCTION INDEX
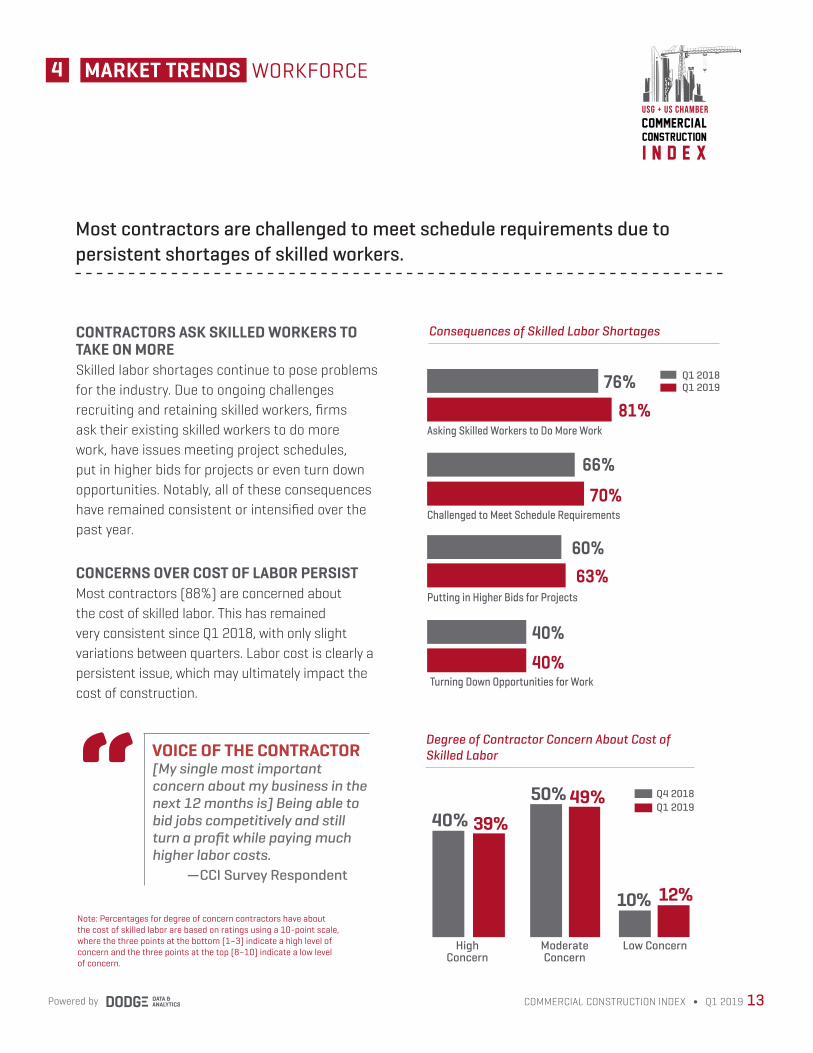
CONTRACTORS ASK SKILLED WORKERS TO TAKE ON MORE Skilled labor shortages continue to pose problems for the industry. Due to ongoing challenges recruiting and retaining skilled workers, firms ask their existing skilled workers to do more work, have issues meeting project schedules, put in higher bids for projects or even turn down opportunities. Notably, all of these consequences have remained consistent or intensified over the past year.
CONCERNS OVER COST OF LABOR PERSISTMost contractors (88%) are concerned about the cost of skilled labor. This has remained very consistent since Q1 2018, with only slight variations between quarters. Labor cost is clearly a persistent issue, which may ultimately impact the cost of construction.
Note: Percentages for degree of concern contractors have about the cost of skilled labor are based on ratings using a 10-point scale, where the three points at the bottom (1–3) indicate a high level of concern and the three points at the top (8–10) indicate a low level of concern.
Degree of Contractor Concern About Cost of Skilled Labor
50% 49%
Moderate Concern
High Concern
40% 39%
10% 12%
Low Concern
VOICE OF THE CONTRACTOR[My single most important concern about my business in the next 12 months is] Being able to bid jobs competitively and still turn a profit while paying much higher labor costs. —CCI Survey Respondent
Most contractors are challenged to meet schedule requirements due to persistent shortages of skilled workers.
Q1 2019Q4 2018
4 WORKFORCEMARKET TRENDS
13COMMERCIAL CONSTRUCTION INDEX ∫ Q1 2019Powered by
commercial
construction
i n d e x
usg + us chamber
“
Consequences of Skilled Labor Shortages
70%
66%
81%Asking Skilled Workers to Do More Work
Challenged to Meet Schedule Requirements
63%Putting in Higher Bids for Projects
40%40%
Turning Down Opportunities for Work
60%
76% Q1 2019Q1 2018
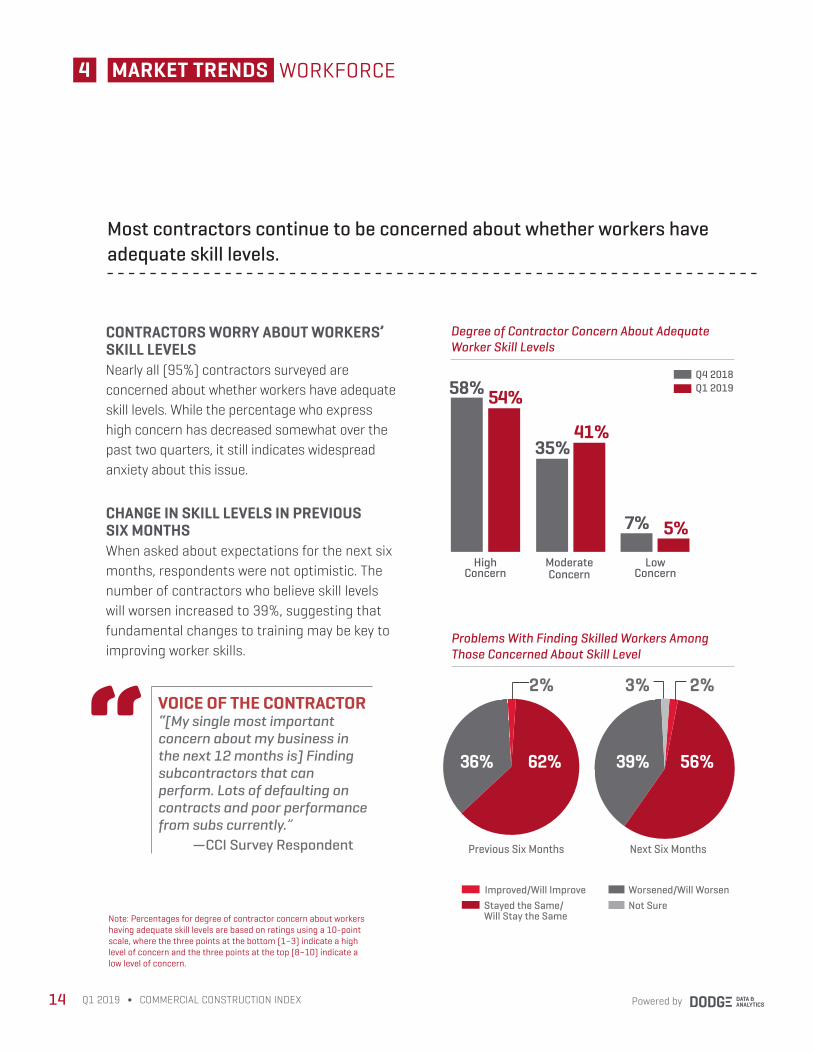
CONTRACTORS WORRY ABOUT WORKERS’ SKILL LEVELS Nearly all (95%) contractors surveyed are concerned about whether workers have adequate skill levels. While the percentage who express high concern has decreased somewhat over the past two quarters, it still indicates widespread anxiety about this issue.
CHANGE IN SKILL LEVELS IN PREVIOUS SIX MONTHSWhen asked about expectations for the next six months, respondents were not optimistic. The number of contractors who believe skill levels will worsen increased to 39%, suggesting that fundamental changes to training may be key to improving worker skills.
Note: Percentages for degree of contractor concern about workers having adequate skill levels are based on ratings using a 10-point scale, where the three points at the bottom (1–3) indicate a high level of concern and the three points at the top (8–10) indicate a low level of concern.
Degree of Contractor Concern About Adequate Worker Skill Levels
35%41%
Moderate Concern
High Concern
58% 54%
7%
Low Concern
WORKFORCE4 MARKET TRENDS
5%
Improved/Will Improve Worsened/Will Worsen
Most contractors continue to be concerned about whether workers have adequate skill levels.
Q1 2019Q4 2018
Powered by14 Q1 2019 ∫ COMMERCIAL CONSTRUCTION INDEX
Problems With Finding Skilled Workers Among Those Concerned About Skill Level
62%
Previous Six Months Next Six Months
36% 39%
Improved/Will ImproveStayed the Same/ Will Stay the Same
Worsened/Will WorsenNot Sure
56%
2% 3% 2%VOICE OF THE CONTRACTOR“[My single most important concern about my business in the next 12 months is] Finding subcontractors that can perform. Lots of defaulting on contracts and poor performance from subs currently.” —CCI Survey Respondent
“
ACCESS TO FINANCING 4 MARKET TRENDS
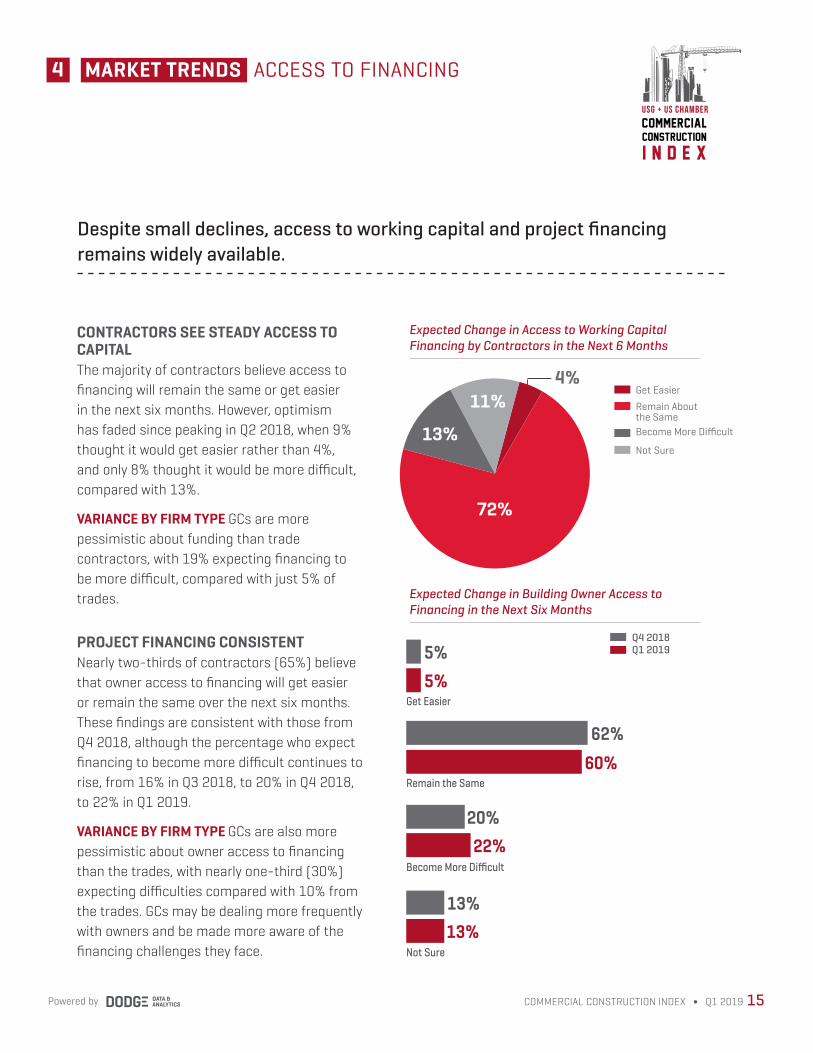
CONTRACTORS SEE STEADY ACCESS TO CAPITAL The majority of contractors believe access to financing will remain the same or get easier in the next six months. However, optimism has faded since peaking in Q2 2018, when 9% thought it would get easier rather than 4%, and only 8% thought it would be more difficult, compared with 13%.
VARIANCE BY FIRM TYPE GCs are more pessimistic about funding than trade contractors, with 19% expecting financing to be more difficult, compared with just 5% of trades.
PROJECT FINANCING CONSISTENTNearly two-thirds of contractors (65%) believe that owner access to financing will get easier or remain the same over the next six months. These findings are consistent with those from Q4 2018, although the percentage who expect financing to become more difficult continues to rise, from 16% in Q3 2018, to 20% in Q4 2018, to 22% in Q1 2019.
VARIANCE BY FIRM TYPE GCs are also more pessimistic about owner access to financing than the trades, with nearly one-third (30%) expecting difficulties compared with 10% from the trades. GCs may be dealing more frequently with owners and be made more aware of the financing challenges they face.
Expected Change in Building Owner Access to Financing in the Next Six Months
Despite small declines, access to working capital and project financing remains widely available.
60%62%
5%Get Easier
Remain the Same
22%Become More Difficult
13%13%
Not Sure
20%
5% Q1 2019Q4 2018
15COMMERCIAL CONSTRUCTION INDEX ∫ Q1 2019Powered by
commercial
construction
i n d e x
usg + us chamber
Not Sure
Get Easier
Become More Difficult
Remain About the Same
Expected Change in Access to Working Capital Financing by Contractors in the Next 6 Months
72%
11%9%
13%
4%
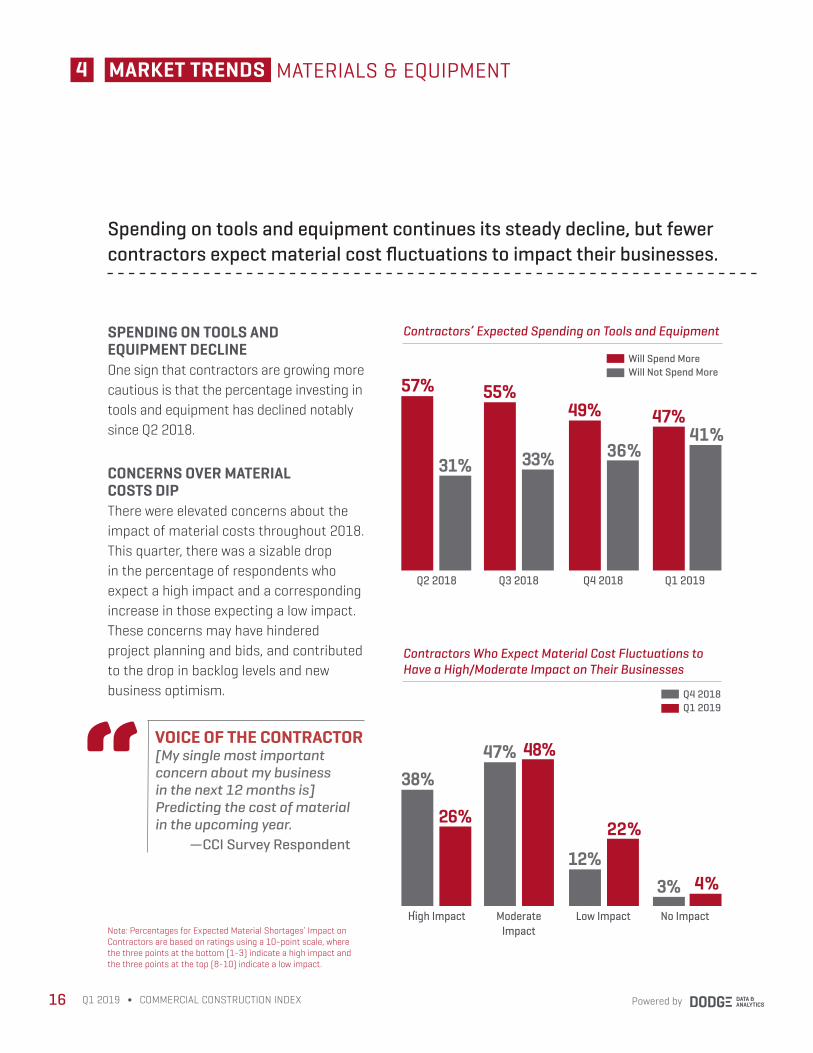
SPENDING ON TOOLS AND EQUIPMENT DECLINEOne sign that contractors are growing more cautious is that the percentage investing in tools and equipment has declined notably since Q2 2018.
CONCERNS OVER MATERIAL COSTS DIPThere were elevated concerns about the impact of material costs throughout 2018. This quarter, there was a sizable drop in the percentage of respondents who expect a high impact and a corresponding increase in those expecting a low impact. These concerns may have hindered project planning and bids, and contributed to the drop in backlog levels and new business optimism.
MATERIALS & EQUIPMENT4 MARKET TRENDS
Spending on tools and equipment continues its steady decline, but fewer contractors expect material cost fluctuations to impact their businesses.
Note: Percentages for Expected Material Shortages’ Impact on Contractors are based on ratings using a 10-point scale, where the three points at the bottom (1-3) indicate a high impact and the three points at the top (8-10) indicate a low impact.
Powered by16 Q1 2019 ∫ COMMERCIAL CONSTRUCTION INDEX
Contractors Who Expect Material Cost Fluctuations to Have a High/Moderate Impact on Their Businesses
Contractors’ Expected Spending on Tools and Equipment
38%
26%
High Impact No Impact
47% 48%
3% 4%12%
22%
Moderate Impact
Low Impact
Q1 2019Q4 2018
57%
31%
Q2 2018 Q1 2019
55%
33%
47%41%
49%
36%
Q3 2018 Q4 2018
Will Not Spend MoreWill Spend More
VOICE OF THE CONTRACTOR[My single most important concern about my business in the next 12 months is] Predicting the cost of material in the upcoming year. —CCI Survey Respondent
“
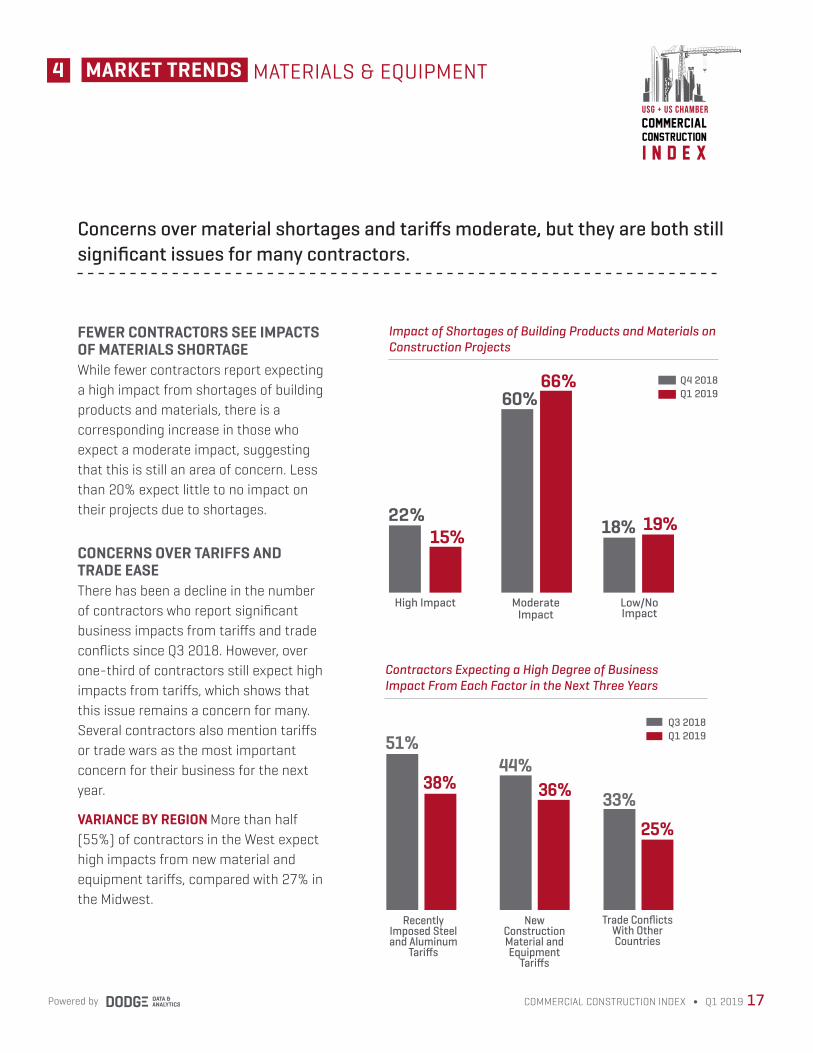
FEWER CONTRACTORS SEE IMPACTS OF MATERIALS SHORTAGEWhile fewer contractors report expecting a high impact from shortages of building products and materials, there is a corresponding increase in those who expect a moderate impact, suggesting that this is still an area of concern. Less than 20% expect little to no impact on their projects due to shortages.
CONCERNS OVER TARIFFS AND TRADE EASEThere has been a decline in the number of contractors who report significant business impacts from tariffs and trade conflicts since Q3 2018. However, over one-third of contractors still expect high impacts from tariffs, which shows that this issue remains a concern for many. Several contractors also mention tariffs or trade wars as the most important concern for their business for the next year.
VARIANCE BY REGION More than half (55%) of contractors in the West expect high impacts from new material and equipment tariffs, compared with 27% in the Midwest.
4 MATERIALS & EQUIPMENTMARKET TRENDS
Impact of Shortages of Building Products and Materials on Construction Projects
Concerns over material shortages and tariffs moderate, but they are both still significant issues for many contractors.
17COMMERCIAL CONSTRUCTION INDEX ∫ Q1 2019Powered by
Contractors Expecting a High Degree of Business Impact From Each Factor in the Next Three Years
Q1 2019Q3 2018
51%
38%44%
36%
Recently Imposed Steel and Aluminum
Tariffs
New Construction Material and Equipment
Tariffs
33%25%
Trade Conflicts With Other Countries
commercial
construction
i n d e x
usg + us chamber
60%66%
Moderate Impact
High Impact
22%15% 18% 19%
Low/No Impact
Q1 2019Q4 2018
5 METHODOLOGY
Powered by18 Q1 2019 ∫ COMMERCIAL CONSTRUCTION INDEX
Job Functions of Respondents
C-Level (CEO/Owner/Partner/ President/Principal/other C-Level)
Involved Directly on Projects (Project Executive, Project Manager, etc.)
Estimator
Other
35%
32%
25%
8%
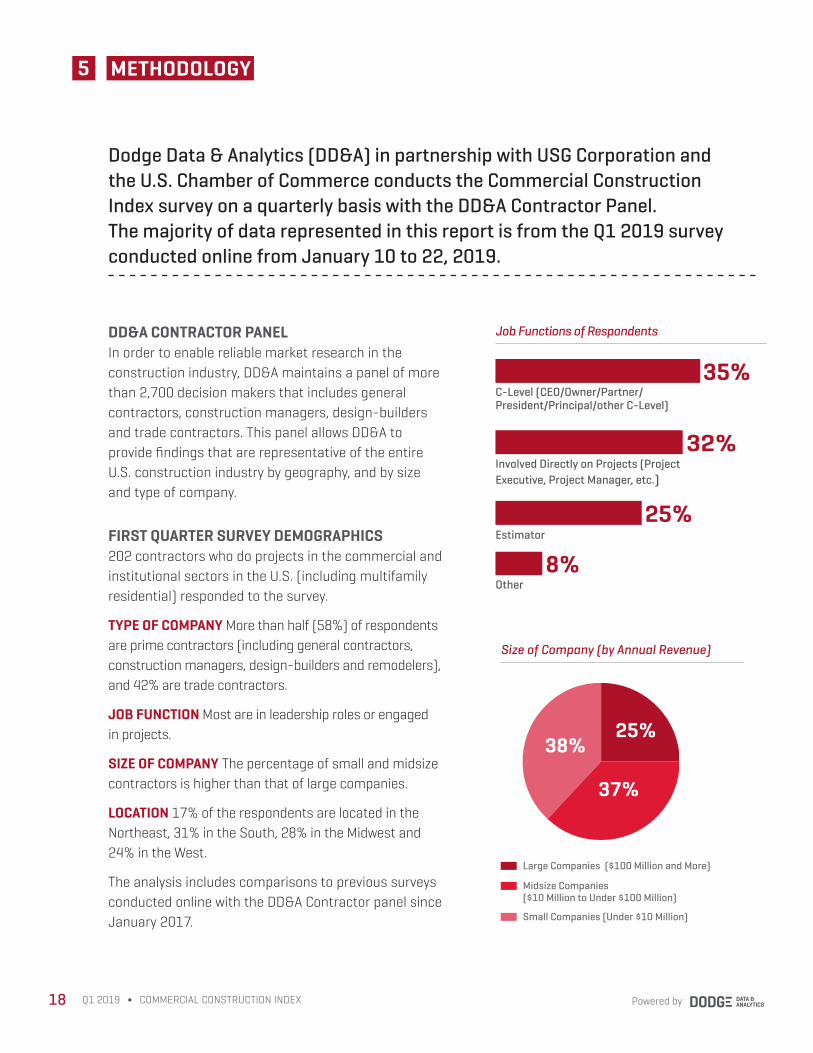
Dodge Data & Analytics (DD&A) in partnership with USG Corporation and the U.S. Chamber of Commerce conducts the Commercial Construction Index survey on a quarterly basis with the DD&A Contractor Panel. The majority of data represented in this report is from the Q1 2019 survey conducted online from January 10 to 22, 2019.
DD&A CONTRACTOR PANELIn order to enable reliable market research in the construction industry, DD&A maintains a panel of more than 2,700 decision makers that includes general contractors, construction managers, design-builders and trade contractors. This panel allows DD&A to provide findings that are representative of the entire U.S. construction industry by geography, and by size and type of company.
FIRST QUARTER SURVEY DEMOGRAPHICS202 contractors who do projects in the commercial and institutional sectors in the U.S. (including multifamily residential) responded to the survey.
TYPE OF COMPANY More than half (58%) of respondents are prime contractors (including general contractors, construction managers, design-builders and remodelers), and 42% are trade contractors.
JOB FUNCTION Most are in leadership roles or engaged in projects.
SIZE OF COMPANY The percentage of small and midsize contractors is higher than that of large companies.
LOCATION 17% of the respondents are located in the Northeast, 31% in the South, 28% in the Midwest and 24% in the West.
The analysis includes comparisons to previous surveys conducted online with the DD&A Contractor panel since January 2017.
Size of Company (by Annual Revenue)
38%
37%
25%
Large Companies ($100 Million and More)
Midsize Companies ($10 Million to Under $100 Million)
Small Companies (Under $10 Million)
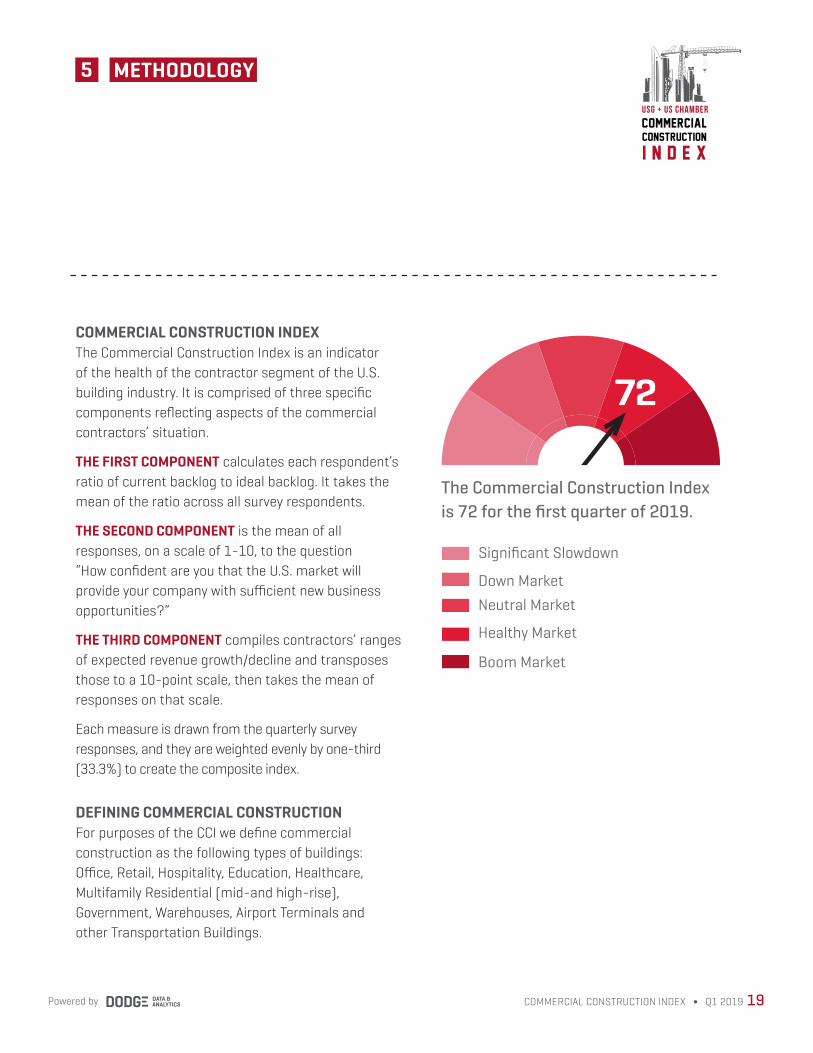
COMMERCIAL CONSTRUCTION INDEXThe Commercial Construction Index is an indicator of the health of the contractor segment of the U.S. building industry. It is comprised of three specific components reflecting aspects of the commercial contractors’ situation.
THE FIRST COMPONENT calculates each respondent’s ratio of current backlog to ideal backlog. It takes the mean of the ratio across all survey respondents.
THE SECOND COMPONENT is the mean of all responses, on a scale of 1-10, to the question “How confident are you that the U.S. market will provide your company with sufficient new business opportunities?”
THE THIRD COMPONENT compiles contractors’ ranges of expected revenue growth/decline and transposes those to a 10-point scale, then takes the mean of responses on that scale.
Each measure is drawn from the quarterly survey responses, and they are weighted evenly by one-third (33.3%) to create the composite index.
DEFINING COMMERCIAL CONSTRUCTIONFor purposes of the CCI we define commercial construction as the following types of buildings: Office, Retail, Hospitality, Education, Healthcare, Multifamily Residential (mid-and high-rise), Government, Warehouses, Airport Terminals and other Transportation Buildings.
5 METHODOLOGY
19COMMERCIAL CONSTRUCTION INDEX ∫ Q1 2019Powered by
75
The Commercial Construction Index is 72 for the first quarter of 2019.
commercial
construction
i n d e x
usg + us chamber
72
Significant Slowdown
Neutral MarketDown Market
Healthy Market
Boom Market
USG Corporation is an industry-leading manufacturer of building products and innovative solutions. Headquartered in Chicago, USG serves construction markets around the world through its Gypsum, Performance Materials, Ceilings and USG Boral Divisions. Its wall, ceiling, flooring, sheathing and roofing products provide the solutions that enable customers to build the outstanding spaces where people live, work and play. Its USG Boral Building Products joint venture is a leading plasterboard and ceilings producer across Asia, Australasia and the Middle East. For additional information, visit www.usg.com.
The U.S. Chamber of Commerce is the world’s largest business federation representing the interests of more than 3 million businesses of all sizes, sectors and regions, as well as state and local chambers and industry associations. Its International Affairs division includes more than 70 regional and policy experts and 25 country- and region-specific business councils and initiatives. The U.S. Chamber also works closely with 117 American Chambers of Commerce abroad.
Dodge Data & Analytics is North America’s leading provider of analytics and software-based workflow integration solutions for the construction industry. Building product manufacturers, architects, engineers, contractors and service providers leverage Dodge to identify and pursue unseen growth opportunities and execute on those opportunities for enhanced business performance. Whether it’s on a local, regional or national level, Dodge makes the hidden obvious, empowering its clients to better understand their markets, uncover key relationships, size growth opportunities and pursue those opportunities with success. The company’s construction project information is the most comprehensive and verified in the industry. Dodge is leveraging its 100-year-old legacy of continuous innovation to help the industry meet the building challenges of the future. To learn more, visit www.construction.com.
This report is intended for general informational purposes only. It is not intended to support an investment decision with respect to USG Corporation, nor is it intended to be used for marketing purposes to any existing or prospective investor of USG. This report is not a forecast of future results for USG and actual results of USG may differ materially from those of the commercial construction industry.
Powered by20 Q1 2019 ∫ COMMERCIAL CONSTRUCTION INDEX

commercial
g + us chamber
For more information, please visit www.commercialconstructionindex.com.
USG Corporation550 W. Adams Street
Chicago, IL 60661www.usg.com
U.S. Chamber of Commerce1615 H Street NW
Washington, DC 20062www.uschamber.com


![[NOT YET SCHEDULED FOR ORAL ARGUMENT]...Commerce, the Scottsdale Chamber of Commerce, the Superstition Region Chamber of Commerce, and the Tempe Chamber of Commerce. USCA Case #19-5125](https://img.pdfslide.net/doc/110x75/5f47b680ba1d83408f39933d/not-yet-scheduled-for-oral-argument-commerce-the-scottsdale-chamber-of-commerce.jpg)