Embed Size (px)
Citation preview

1
Results Announcement 3rd Quarter 2011
(IFRS)
Conference Call/Webcast
Almir Guilherme Barbassa CFO and Investor Relations Officer
November 16th, 2011

2
DISCLAIMER
FORWARD-LOOKING STATEMENTS:
DISCLAIMER
The presentation may contain forward-looking statements about future events within the meaning of Section 27A of the Securities Act of 1933, as amended, and Section 21E of the Securities Exchange Act of 1934, as amended, that are not based on historical facts and are not assurances of future results. Such forward-looking statements merely reflect the Company’s current views and estimates of future economic circumstances, industry conditions, company performance and financial results. Such terms as "anticipate", "believe", "expect", "forecast", "intend", "plan", "project", "seek", "should", along with similar or analogous expressions, are used to identify such forward-looking statements. Readers are cautioned that these statements are only projections and may differ materially from actual future results or events. Readers are referred to the documents filed by the Company with the SEC, specifically the Company’s most recent Annual Report on Form 20-F, which identify important risk factors that could cause actual results to differ from those contained in the forward-looking statements, including, among other things, risks relating to general economic and business conditions, including crude oil and other commodity prices, refining margins and prevailing exchange rates, uncertainties inherent in making estimates of our oil and gas reserves including recently discovered oil and gas reserves, international and Brazilian political, economic and social developments, receipt of governmental approvals and licenses and our ability to obtain financing.
We undertake no obligation to publicly update or revise any forward-looking statements, whether as a result of new information or future events or for any other reason. Figures for 2011 on are estimates or targets.
All forward-looking statements are expressly qualified in their entirety by this cautionary statement, and you should not place reliance on any forward-looking statement contained in this presentation.
NON-SEC COMPLIANT OIL AND GAS RESERVES:
CAUTIONARY STATEMENT FOR US INVESTORS
We present certain data in this presentation, such as oil and gas resources, that we are not permitted to present in documents filed with the United States Securities and Exchange Commission (SEC) under new Subpart 1200 to Regulation S-K because such terms do not qualify as proved, probable or possible reserves under Rule 4-10(a) of Regulation S-X.

3
3Q11 HIGHLIGHTS
o Operating income (+2%) and EBITDA (+3%) stable in 3Q11.
o Net income of R$ 6,336 million in 3Q11, affected by the Real devaluation of 19% at quarter end.
o Start-up of P-56, in Marlim Sul field (Campos Basin), projected to reach peak production in 1Q12.
o Pre-salt: Lula-Mexilhão Gas Pipeline start-up, conclusion of Guará EWT (Extended Well Test), start-up of Carioca NE EWT, and 2nd well of Franco, confirming the potential of the area.
o Petrobras was included in the Dow Jones Sustainability Index (DJSI) for the sixth consecutive year.
P-56 Lula-Mexilhão Gas Pipeline
Dynamic Producer

4
MAIN INDICATORS
3Q11 2Q11 ∆%
(3Q11 x 2Q11) 3Q10
EBITDA (R$/million) 16,672 16,139 +3% 14,736
OPERATING INCOME¹ (R$/million) 12,322 12,047 +2% 10,673
NET INCOME² (R$/million) 6,336 10,942 -42% 8,566
AVG. REALIZATION PRICE - ARP (R$/bbl) 166.78 167.15 - 158.28
AVG. REALIZATION PRICE - ARP (US$/bbl) 102.66 105.05 -2% 92.54
Brent (US$/bbl) 113.46 117.36 -3% 76.86
Average dollar Realization Price (R$) 1.64 1.60 +2% 1.75
Production (thousand bbl/day) 2,572 2,598 -1% 2,570
Domestic sales (thousand bbl/day) 2,627 2,503 +5% 2,497
¹ Income before financial result, profit sharing and taxes ² Net income attributable to Petrobras shareholders

5
OIL AND GAS PRODUCTION – 9M11 vs. 9M10 Scheduled and unprogrammed stoppages affecting production in the quarter
2,322 2,363 2,568 2,599
(th
ou
san
d b
pd
)
Total Production (daily average)
Domestic Production (daily average)
(th
ou
san
d b
pd
)
+1.2%
2,322 2,363
246 236
9M 2010 9M 2011
Brasil Internacional
+1.8%
1,995 2,013
327 350
9M 2010 9M 2011
Petróleo e LGN Gás Natural Brazil International Oil and LNG Natural Gas
o Main contributors to the increase of domestic production in 2011: Marlim Leste, Cachalote/Baleia Franca, Jubarte, Uruguá, Lula Pilot and EWTs of Tiro, Sidon, Guará, Lula Nordeste and Aruanã.
o International production declined 4% YoY due to the initiation of tax oil in Nigeria (Agbami field) and the termination of E&P agreements in Ecuador.

6
bbl/d
Time
Potential1
Production1 Potential2
Production2
Natural decline of reservoir * Possible causes: - decrease in reservoir pressure - increase jn water production * Assuming 100% efficiency of the equipment installed
Actual production, a combination of: - Natural decline of the reservoir and - Equipment efficiency - problems with lift;
hydrate formation in the collection line;
compression failures;
power outages;
equipment failures;
scheduled and unscheduled maintenance
etc...
PRODUCTION BEHAVIOR Reservoirs and equipments set production over time
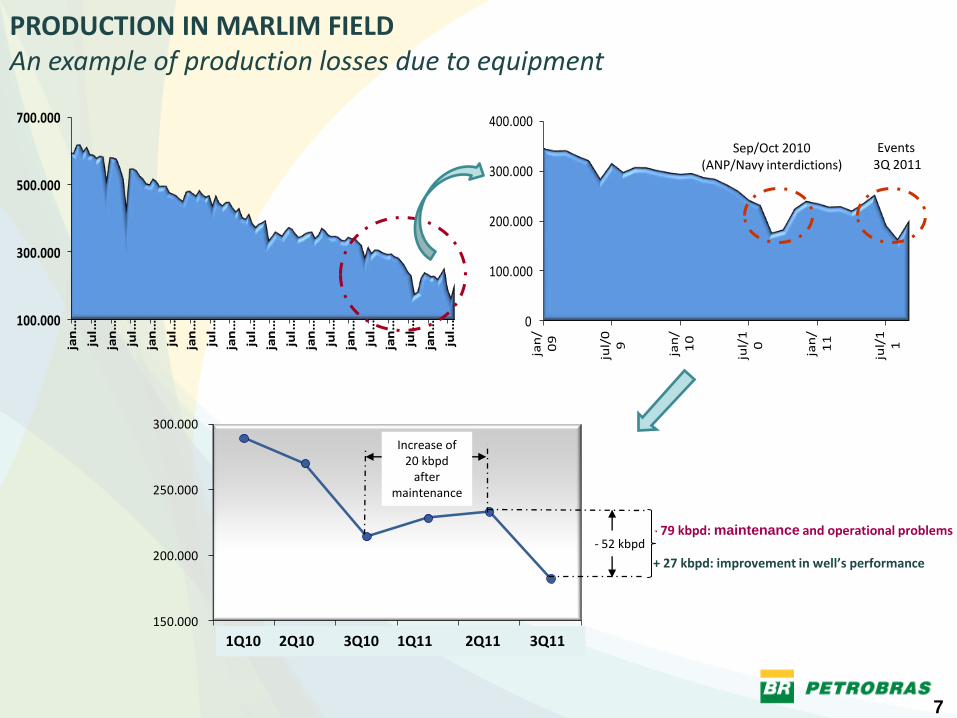
o 2011 production decline in some fields above historical rates was due to reduced equipment efficiency, not geology.
oOn average, reservoir decline was below expected.
t1 t2
7
0
100.000
200.000
300.000
400.000
jan
/0
9
jul/
09
jan
/1
0
jul/
10
jan
/1
1
jul/
11
Sep/Oct 2010 (ANP/Navy interdictions)
Events 3Q 2011
- 79 kbpd: maintenance and operational problems
+ 27 kbpd: improvement in well’s performance
PRODUCTION IN MARLIM FIELD An example of production losses due to equipment
100.000
300.000
500.000
700.000
jan
…
jul…
jan
…
jul…
jan
…
jul…
jan
…
jul…
jan
…
jul…
jan
…
jul…
jan
…
jul…
jan
…
jul…
jan
…
jul…
jan
…
jul…
150.000
200.000
250.000
300.000
1T 2010 2T 2010 3T 2010 1T 2011 2T 2011 3T2011
- 52 kbpd
Increase of 20 kbpd
after maintenance
1Q10 2Q10 3Q10 1Q11 2Q11 3Q11

8
PRODUCTION - 2011 Production below target mostly explained by unplanned maintenance
Other factors that reduced production relative to targets
o Delays in the completion and connection of wells, due to the late arrival of new rigs from international shipyards.
o Logistical and market restrictions reduced production of natural gas, in turn reducing oil production by 20 thousand. Bpd during 9M11 (Uruguá: 10 thousd. bpd; Lula: 10 thousd. bpd)
(th
ou
sd. b
pd
)
Unplanned maintenance and additional time for
planned maintenance in the 9M11 lowered production
by an average of 44 thousand bpd in the year
0
5.000
10.000
15.000
20.000
25.000
1Q 2Q 3Q
Unprogrammed Stoppages
Programmed Stoppages
Production loss due to operational causes – effect on annual production

9
PRODUCTION TARGETS 2011 New wells expected to increase production during the 4th quarter
2,100 (target)
2,050 (-2.5%)
2,150 (+2.5%)
2,013 (Production 9M11: -4%)
• 35 wells on 9M11
– 15 wells on 3Q11
• 4 wells in October with 38 thousd. bpd potential
• Expectations for November/December:
– 16 wells (with a total potential of 175 thousd.bpd)
UMS Cidade de Arraial do Cabo
Minimizing Unprogrammed Stoppages
• Commitment Agreement with ANP, related to schedule of supervision
• Flotels (floting hotels)/UMS - 3 operating
Offshore Production wells 2011
• P-57 and P-56 expected to be producing at 80% of capacity by year end
10
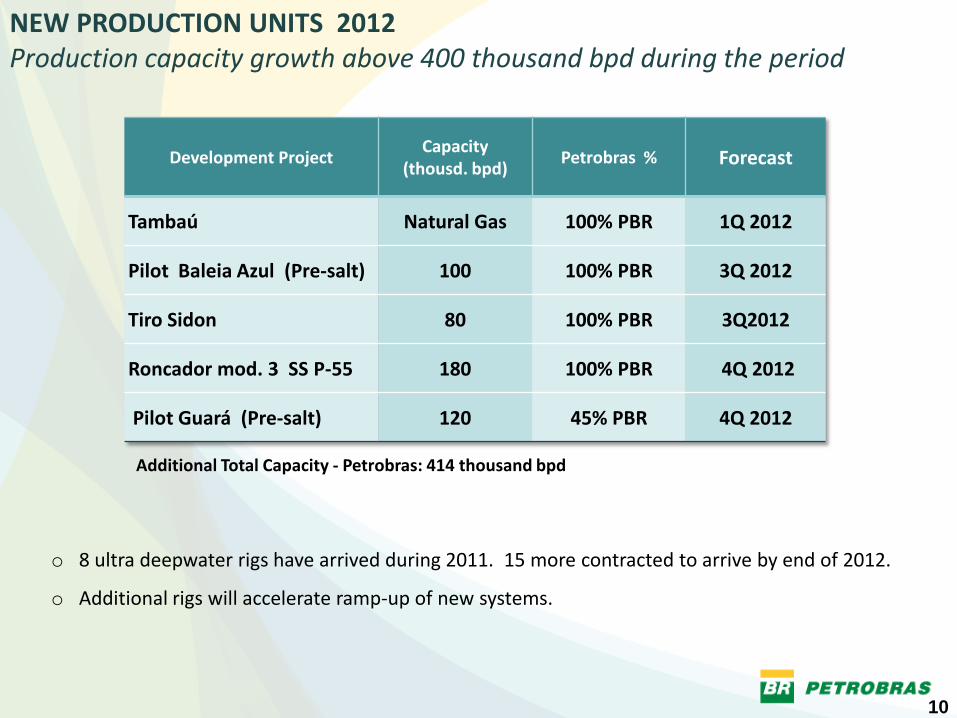
Development Project Capacity
(thousd. bpd) Petrobras % Forecast
Tambaú Natural Gas 100% PBR 1Q 2012
Pilot Baleia Azul (Pre-salt) 100 100% PBR 3Q 2012
Tiro Sidon 80 100% PBR 3Q2012
Roncador mod. 3 SS P-55 180 100% PBR 4Q 2012
Pilot Guará (Pre-salt) 120 45% PBR 4Q 2012
Additional Total Capacity - Petrobras: 414 thousand bpd
NEW PRODUCTION UNITS 2012 Production capacity growth above 400 thousand bpd during the period
o 8 ultra deepwater rigs have arrived during 2011. 15 more contracted to arrive by end of 2012.
o Additional rigs will accelerate ramp-up of new systems.

11
PRE-SALT CLUSTER IN SANTOS BASIN EWT Carioca NE: 24,000 bpd (SPS-74) EWT Lula NE: 14,000 bpd (RJS-662A) Lula Pilot: 53,000 bpd (RJS-660 + RJS-646) TOTAL (Nov/11): 91,000 bpd
CAMPOS BASIN Jubarte: 14,000 bpd (ESS-103) Baleia Franca: 25,000 bpd (BRF-1 + BRF-6) Brava: 7,000 bpd (MRL-199D) Carimbé: 21,000 bpd (CRT-43) Tracajá: 20,000 bpd (MLL-70) TOTAL (Nov/11): 87,000 bpd
INTENSIFYING DEVELOPMENT CAMPAIGN IN THE PRE- SALT SANTOS BASIN
34 wells drilled through Oct 11 (27 Exploratory), with an additional 5 new wells by year end 2011
Lula Pilot: 1st well - 28 thous. bpd, 2nd well - 25 thous. bpd and 3rd well to start producing at the end of Nov.
The number of rigs in the area will double by the end of 2012 ( currently 10 rigs operating)
E&P results confirming the potential of the area
Average production in all Pre-salt wells approximately 20,000 bpd , with no evidence of decline
PRE-SALT ACTIVITY

12
US$/bbl
AVERAGE REALIZATION PRICE (ARP) Pricing policy avoids short term international volatility
6470 73 74 72
80
94
109103
6875 76 78 77
86
105
117113
20.00
40.00
60.00
80.00
100.00
120.00
3Q09 4Q09 1Q10 2Q10 3Q10 4Q10 1Q11 2Q11 3Q11
Petrobras (average) Brent
20
40
60
80
100
120
140
160
180
2Q08 3Q08 4Q08 1Q09 2Q09 3Q09 4Q09 1Q10 2Q10 3Q10 4Q10 1Q11 2Q11 3Q11
US ARP Petrobras ARP
US$/bbl Average
3Q10
Average 3Q11
Average 2Q11
105.05
122.62
82.42
92.54 102.66
118.00
o Decrease of ARP Brazil at the end of 3Q11 due to FX rate depreciation. ARP expressed in Reais was stable.
o Adjustments to gasoline (+10%) and diesel (+2%) prices, effective as of November 1st.
o Petrobras oil price decreased US$ 6/bbl in the 3Q11, US$ 2/bbl more than Brent, due to increase in international light/heavy oil spread.

13
LIFTING COSTS Costs pressured by a combination of factors during first nine months of 2011
US$/barril R$/barril
Lifting cost Brent Government take
o In 3Q11 lifting costs increased by provisioning for 2011 Collective Bargaining Agreement, under negotiation.
o Increasing lifting cost trend in 2011 as a result of start-up of new production systems, increase in planned and unplanned stoppages and higher oil prices affecting service and energy costs.
3Q10 4Q10 1Q11 2Q11 3Q11
18.46 17.34 19.00 20.93 22.31
24.26 26.1331.66
34.21 31.80
3Q10 4Q10 1Q11 2Q11 3Q11
10.60 10.29 11.38 13.12 13.37
14.07 15.2919.10
21.8817.88
76.86
86.48
104.97
117.36113.46
30.48 31.25
24.67 25.58
35.00 50.66
54.11
42.72 43.47
55.14 134.51
147.02
175.30
187.78 186.07

14
9M10 9M11
885 971
388469
10382
552576
Diesel + Jet Fuel Gasoline Fuel Oil Other
9M10 9M11
786 829
343 397
243227
434 425
PRODUCTION AND SALES Adapting the refining system to supply growing domestic market
(Th
ou
san
dl b
arre
ls/d
ay)
1,928 2,098
+9 %
Sales Production
1,878 1,805
+4 %
o 9% increase of oil products sales in the domestic market , driven by diesel (+9%) and gasoline (+21%) during first nine months of 2011.
o Operational improvements: Utilization of installed capacity at 92, with higher output of middle distillates and gasoline, using more domestic oil.

15
9M10 9M11
3038
27
27
51
National Import Bolivia Import LNG
9M10 9M11
37 39
11 9
Non Thermoelectrical Thermoelectrical
NATURAL GAS Growing non-thermoelectric demand supported by increasing domestic production
Mill
ion
cu
.m/d
Supply Production
47 48
o Increase of non-thermoelectric consumption due to higher industrial demand (+12%).
o Lower thermoelectric demand due to high levels in hydroelectric reservoirs.
+8% +2 %
*
* Sales do not consider internal transfers (refineries, thermoelectrical units, fertilizer units ) as well as sales done by BR
Mill
ion
cu
.m/d

16
12,047 12,322
2,710 (2,594)
(60) 219
2Q11 Operating Income
Sales Revenue COGS Expenses Other Expenses 3Q11 Operating Income
OPERATING INCOME 3Q11 vs 2Q11 (CONSOLIDATED)
R$ MilIion
o Revenue increase due to higher sales, mainly diesel, but also gasoline and natural gas.
o Higher COGS due to the increase of import and sales volumes.
o Operating expenses stable despite the increase of sales.

17
10,942
6,336
275 (8,179)
(638)
2,406
1,530
2Q11
Net Income
Operating Income Financial Results Interest in
Investments
Taxes Minority Interest 3Q11
Net Income
NET INCOME 3Q11 vs 2Q11 (CONSOLIDATED)
oThe depreciation of Real against dollar (19%) caused a financial expense in the amount of US$ 6.6 billion.
o Lower income tax and social contribution due to a lower net income.
o Minority Interest variation as a result of the impact of the FX variation on the SPC s debt.
R$ Million

18
16,017 15,680(1,039)(421)
745 (313) 691
2Q11
Operating Income
Price Effect on
Revenue
Cost Effect on COGS Volume Effect on
Revenue
Volume Effect on
COGS
Operat. Expenses 3Q11
Operating Income
EXPLORATION AND PRODUCTION: OPERATING INCOME 3Q11 vs 2Q11
o Lower oil price (2Q11: US$ 108.97/3Q11: US$ 102.86) and reduction in light/heavy oil differential.
o Higher sales volume due to the numbers of days and inventory utilization in the quarter.
o Reduction in exploration expenses (R$ 414 million) and Indemnification from an arbitration dispute (R$339 million) related to P-48.
R$ Million
19
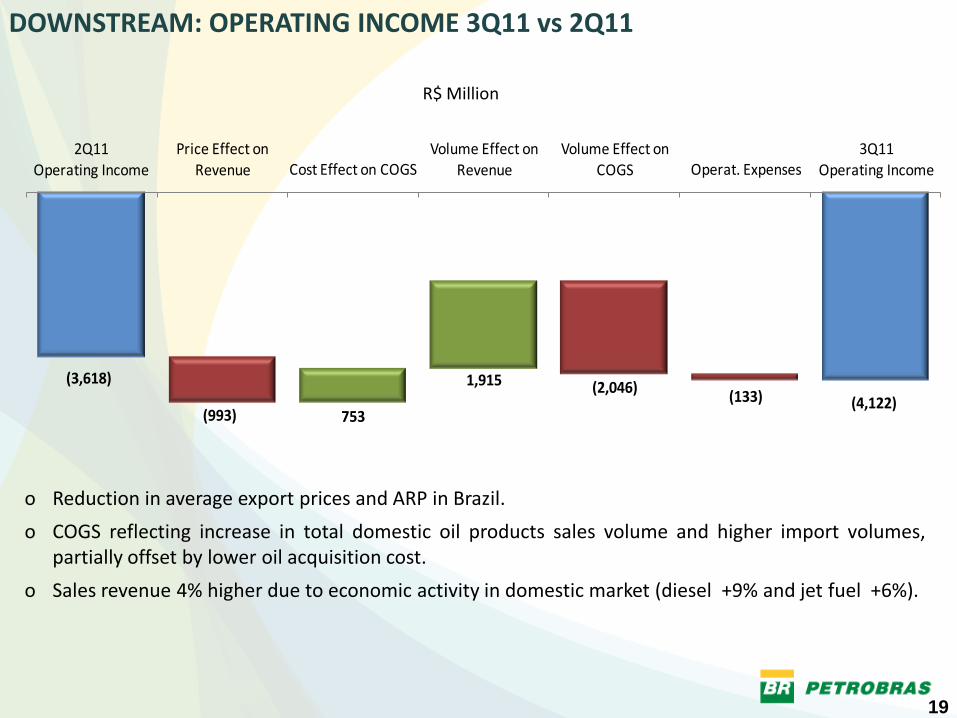
DOWNSTREAM: OPERATING INCOME 3Q11 vs 2Q11
(3,618)
(4,122)(993) 753
1,915 (2,046)(133)
2Q11 Operating Income
Price Effect on Revenue Cost Effect on COGS
Volume Effect on Revenue
Volume Effect on COGS Operat. Expenses
3Q11 Operating Income
R$ Million
o Reduction in average export prices and ARP in Brazil.
o COGS reflecting increase in total domestic oil products sales volume and higher import volumes, partially offset by lower oil acquisition cost.
o Sales revenue 4% higher due to economic activity in domestic market (diesel +9% and jet fuel +6%).

20
Operating Income (R$ milllion)
GAS & POWER, INTERNATIONAL AND DISTRIBUITION (3Q11 vs 2Q11)
3Q11
R$ 2,055
2Q11
R$ 1,131
VS.
Higher income due to increasing natural gas demand from industry and recognition of fiscal credits.
GAS & POWER INTERNACIONAL DISTRIBUTION
Operating Income (R$ milllion)
Operating Income (R$ milllion)
3Q11
R$ 377
2Q11
R $ 649
VS. 3Q11
R$ 467
2Q11
R $ 336
VS.
Income reduction due to adjustment of inventories to market value and lower realization prices for oil production.
Higher income due to 7% and 12% increase, respectively, in sales volume and margin

21
CAPEX Investment stable after adjusting for the exchange rate
24.3
18.9
2.92.9
0.3 0.7 0.8
9M2010
24.3
21.0
5.4
3.4
0.9 0.5 1.0
E&P *
RTM
Gas&Power *
International
Biofuels
Distribution*
Corporate
9M2011
R$ 50.8 billion R$ 56.5 billion
o Stable investments in 9M11 vs 9M10. Lower spending in Reais is largely due to appreciation of the Real against the Dollar (+6%).
o Gas&Power investments in complementary phase of the investment’s cycle in infrastructure.
*Includes projects developed by SPCs

22
LEVERAGE AND LIQUIDITY Exchange rate was the main reason for leverage increase
1.520.94 1.03
1.03 1.071.41
34%
16% 17% 17% 17%22%
-20%
-10%
0%
10%
20%
30%
40%
50%
-0,5
0,5
1,5
2,5
3,5
4,5
5,5
2Q10 3Q10 4Q10 1Q11 2Q11 3Q11
Net Debt/EBITDA Net Debt/Net Cap.
R$ Billion 09/30/11 06/30/11
Short-term debt 20.0 16.7
Long-term debt 126.8 111.6
Total Debt 146.8 128.3
Cash and Cash Equivalents 33.7 34.7
Tradeable Securities (maturing in more than 90 days)
21.4 24.8
Adjusted Cash and Cash Equivalents 55.0 59.5
Net Debt 91.8 6.8
Net Debt/EBITDA 1.41X 1.07X
US$ Billion 09/30/11 06/30/11
Net Debt 49.5 44.1
o Higher net debt, mainly due to the depreciation of the Real against the Dollar. The exchange rate effect was responsible for 3 p.p increase in leverage, in 3Q11 vs 2Q11 comparison.
o Net Debt/EBITDA increased due to stable cash generation and higher net debt.
o Maintenance of high cash and equivalents position.


![FY16 3rd Quarter Financial Results [IFRS] · FY16 3rd Quarter Financial Results [IFRS] Hitachi High-Technologies Corporation January 27, 2017 ... FY15/Q1 FY15/Q2 FY15/Q3 FY15/Q4 FY16/Q1](https://img.pdfslide.net/doc/110x75/5ec630f9034f80098f725dcb/fy16-3rd-quarter-financial-results-ifrs-fy16-3rd-quarter-financial-results-ifrs.jpg)