Embed Size (px)
Citation preview

NAVIGATING �EMPLOYMENT TRENDS A Monster Intelligence briefing

JOANIE COURTNEY SVP Global Market Insights @joaniecourtney
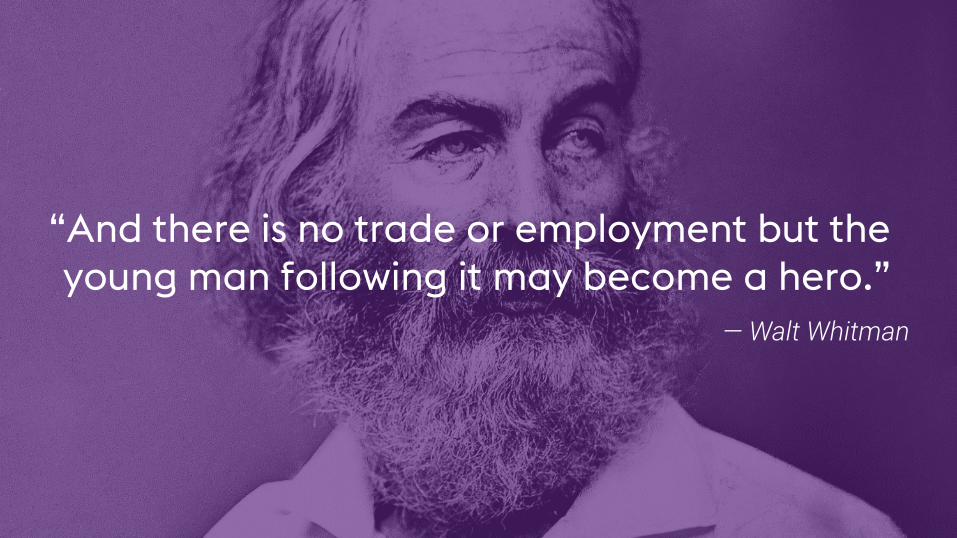
“And there is no trade or employment but the young man following it may become a hero.”
— Walt Whitman
“And there is no trade or employment but the young man following it may become a hero.”
— Walt Whitman
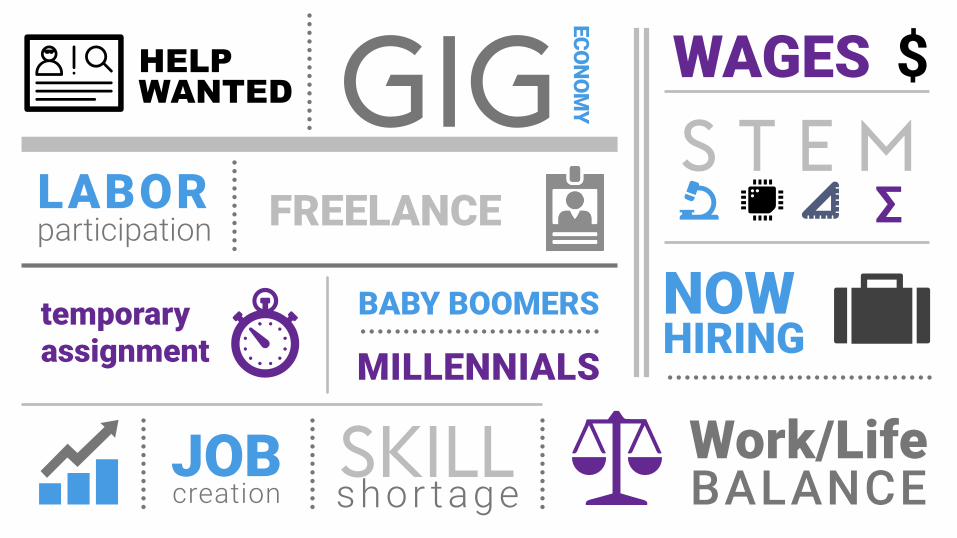
temporary assignment
LABOR participation
HELP WANTED GIG
SKILL
FREELANCE
WAGES
Work/Life�BALANCE
$
ECON
OM
Y MILLENNIALS
BABY BOOMERS
shor tage
S T E M ∑
JOB creation
NOW HIRING

10101010101101001010101011011010110101011010100 11010101101010101010110100101010101101101001011
10101010101101001010010111010101010101011011010 11010101101010101011010101010101010011010010101
10101010101101101010010111001010110100101101101 01010110101010101011010010101010110110100101101
00010110101101010101010101010101101001010101011 01010110101010101011010010101010110110100101101
00010110101101010101010101010101101001010101011 10101010101101001010101011011010110101011010110
11010110101110110101010101011010010101010110111
HOW TO MAKE SENSE OF THE TRENDS AND DATA?

Employment & Economic Data
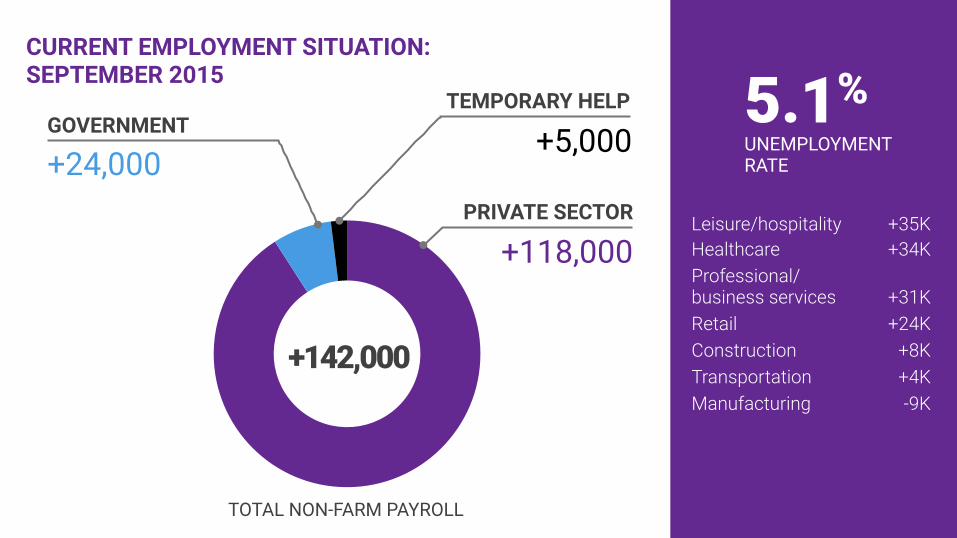
CURRENT EMPLOYMENT SITUATION: �SEPTEMBER 2015
PRIVATE SECTOR
TOTAL NON-FARM PAYROLL
+118,000
GOVERNMENT
+24,000
+142,000
UNEMPLOYMENT RATE
5.1%
Leisure/hospitality +35K Healthcare +34K Professional/�business services +31K Retail +24K Construction +8K Transportation +4K Manufacturing -9K
TEMPORARY HELP
+5,000
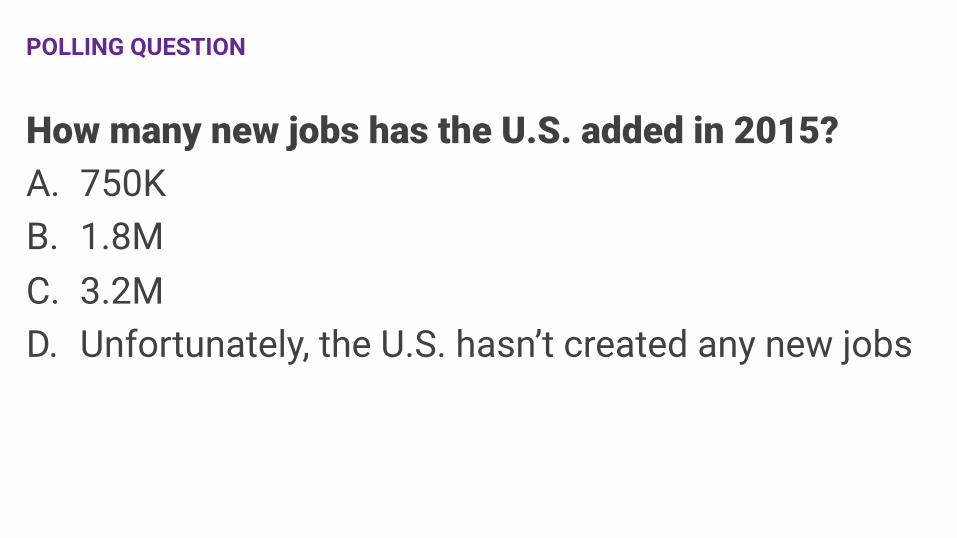
POLLING QUESTION
How many new jobs has the U.S. added in 2015? A. 750K B. 1.8M C. 3.2M D. Unfortunately, the U.S. hasn’t created any new jobs
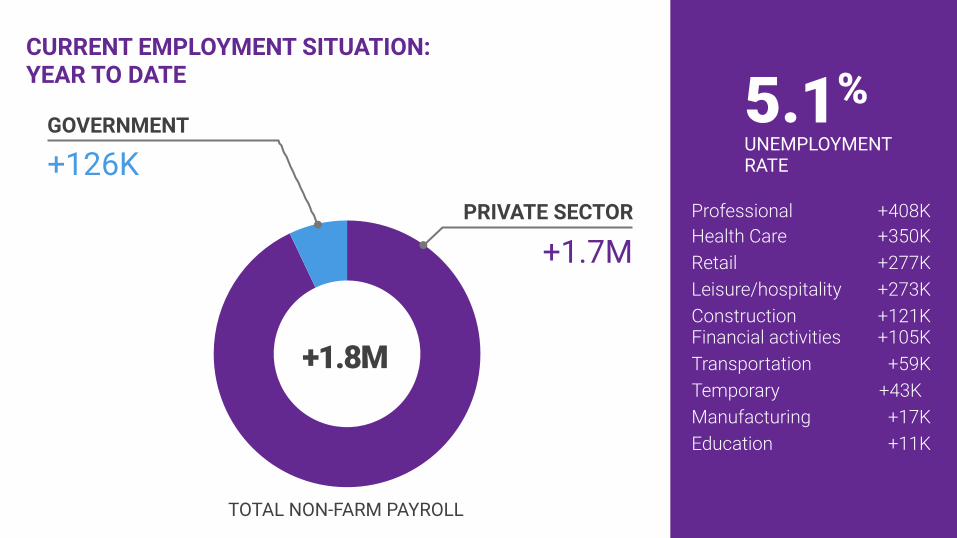
CURRENT EMPLOYMENT SITUATION: �YEAR TO DATE
PRIVATE SECTOR
TOTAL NON-FARM PAYROLL
+1.7M
GOVERNMENT
+126K
+1.8M
UNEMPLOYMENT RATE
5.1%
Professional +408K Health Care +350K Retail +277K Leisure/hospitality +273K Construction +121K�Financial activities +105K Transportation +59K Temporary +43K Manufacturing +17K Education +11K

CURRENT EMPLOYMENT SITUATION
5.8M available jobs
7.9M unemployed people in the U.S.
+3.9% GDP IN �Q2 2015
labor participation rate 62.4%
$
157M in the US workforce
September 2015

10101010101101001010101011011010110101011010100 11010101101010101010110100101010101101101001011
10101010101101001010010111010101010101011011010 11010101101010101011010101010101010011010010101
10101010101101101010010111001010110100101101101 01010110101010101011010010101010110110100101101
00010110101101010101010101010101101001010101011 01010110101010101011010010101010110110100101101
00010110101101010101010101010101101001010101011 10101010101101001010101011011010110101011010110
11010110101110110101010101011010010101010110111
HOW TO MAKE SENSE OF THE TRENDS AND DATA?


2.2%�YoY
WAGE GROWTH FLAT

Source: U.S. Census Bureau, Advanced Monthly Retail Sales
RETAIL SALES DEMONSTRATE MIXED RECOVERY

Source: U.S. Census Bureau, Advanced Monthly Retail Sales
HOME SALES ALSO SHOW MIXED PERFORMANCE

Source: Bureau of Economic Analysis, Personal Consumption Expenditures
POSITIVE GAINS IN CONSUMER SPENDING

Source: Bureau of Economic Analysis, Personal saving as a percentage of disposable personal income
CONSUMER SAVINGS STEADY

Monster �Intelligence
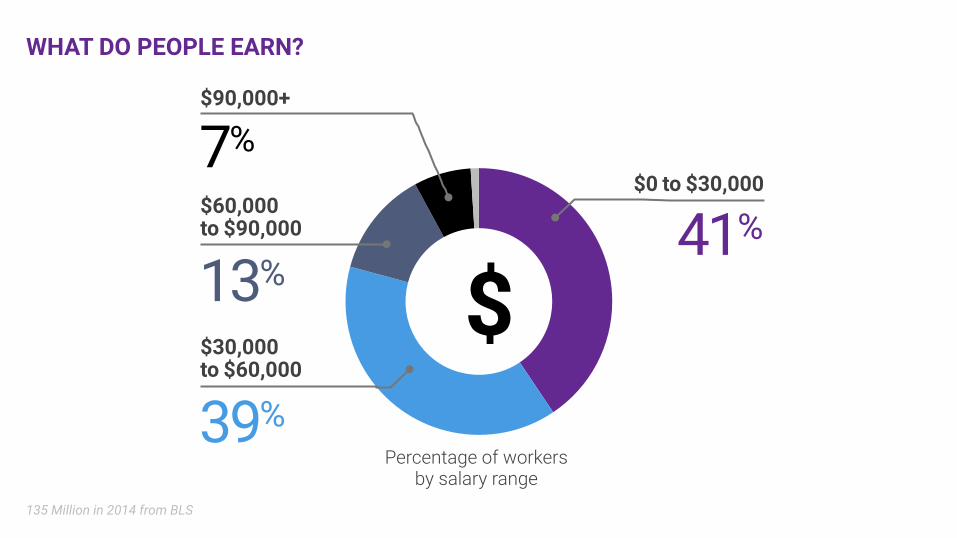
$0 to $30,000
135 Million in 2014 from BLS
WHAT DO PEOPLE EARN?
Percentage of workers �by salary range
41%
$30,000 �to $60,000
39%
$60,000 �to $90,000
13%
$90,000+
7%
$
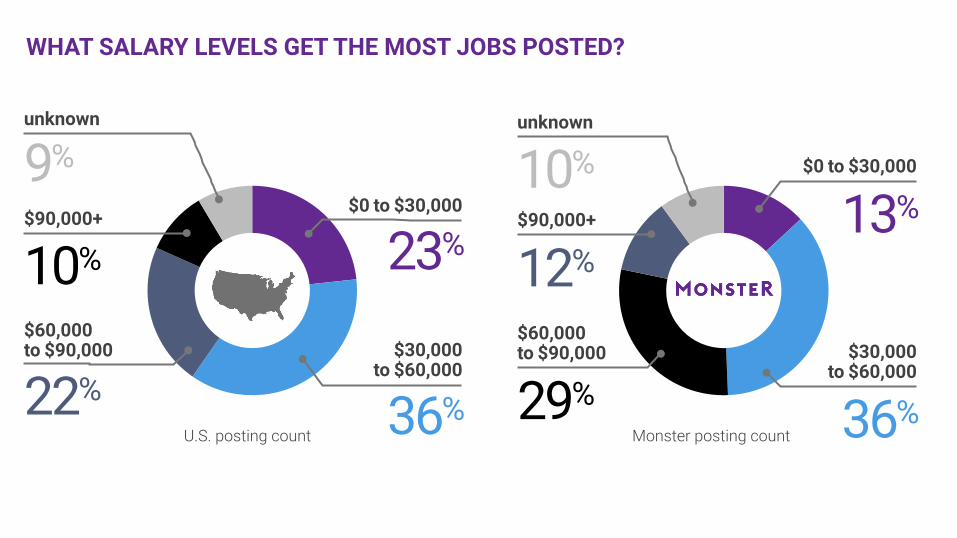
WHAT SALARY LEVELS GET THE MOST JOBS POSTED?
U.S. posting count
$0 to $30,000
23%
$30,000�to $60,000
36%
$90,000+
10%
unknown
9%
$60,000 �to $90,000
22%
$0 to $30,000
13%
$30,000�to $60,000
36%
$90,000+
12%
unknown
10%
$60,000 �to $90,000
29% Monster posting count
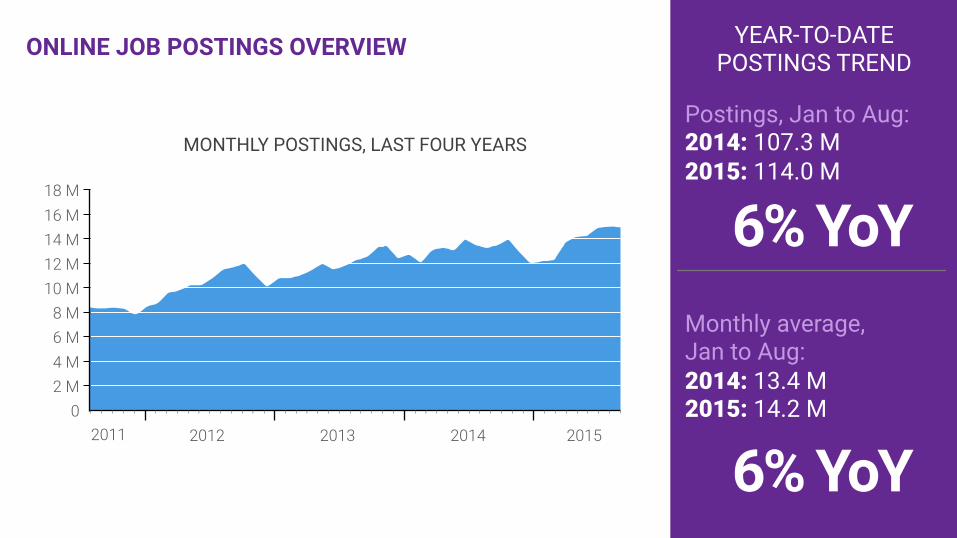
ONLINE JOB POSTINGS OVERVIEW YEAR-TO-DATE�POSTINGS TREND
Postings, Jan to Aug: 2014: 107.3 M 2015: 114.0 M
MONTHLY POSTINGS, LAST FOUR YEARS
6% YoY
Monthly average, �Jan to Aug: 2014: 13.4 M 2015: 14.2 M
6% YoY 2011 2012 2013 2014 2015
0 2 M 4 M 6 M 8 M
10 M 12 M 14 M 16 M 18 M
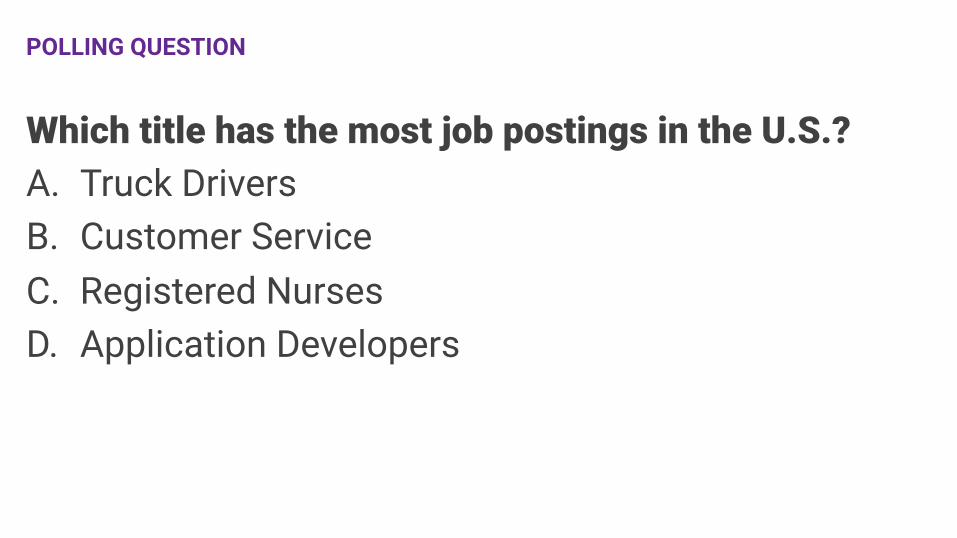
POLLING QUESTION
Which title has the most job postings in the U.S.? A. Truck Drivers B. Customer Service C. Registered Nurses D. Application Developers

TOP 10 OCCUPATIONS FOR JOBS

TOP SEARCHES
Source: Monster Internal Data, Most Recent Job Views, March 2015–August 2015.

TOP VIEWED JOBS
Source: Monster Internal Data, Most Recent Job Views, March 2015–August 2015.

DATA SCIENTISTS
SOCIAL MEDIA MARKETERS

THE POWER SHIFT IN
RECRUITMENT

SOCIAL MEDIA IS A DOMINANT FACTOR
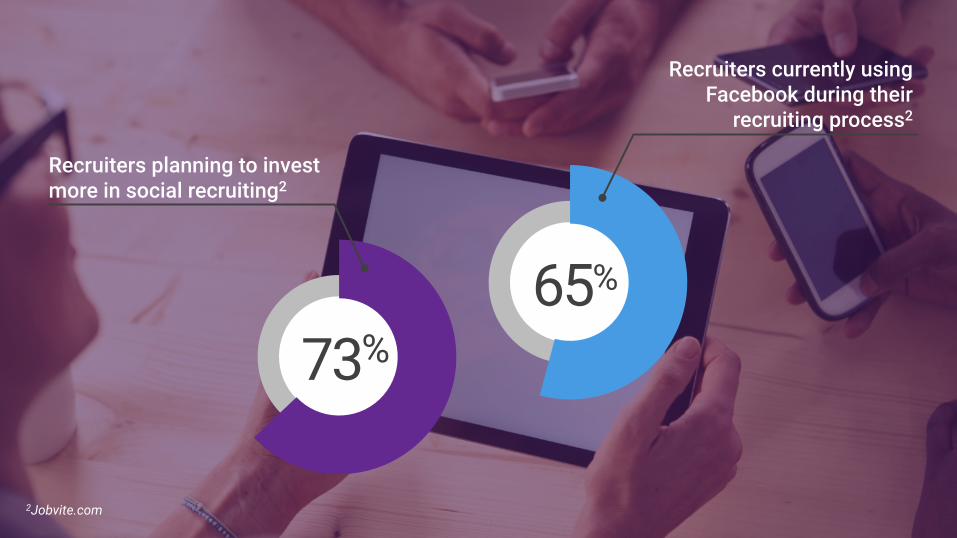
2Jobvite.com
65%
Recruiters currently using Facebook during their
recruiting process2
73%
Recruiters planning to invest more in social recruiting2
Source: Monster Loyalty Survey, November 2014; Note: Surveyed representative sample of adults who work full-time.
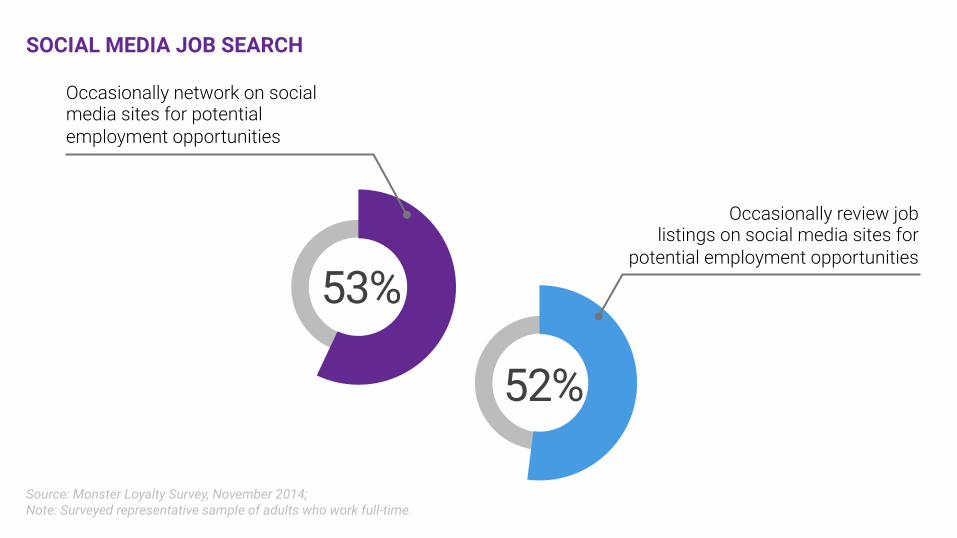
SOCIAL MEDIA JOB SEARCH�
52%
Occasionally review job �listings on social media sites for
potential employment opportunities
53%
Occasionally network on social media sites for potential employment opportunities
Source: Monster Loyalty Survey, November 2014; Note: Surveyed representative sample of adults who work full-time.
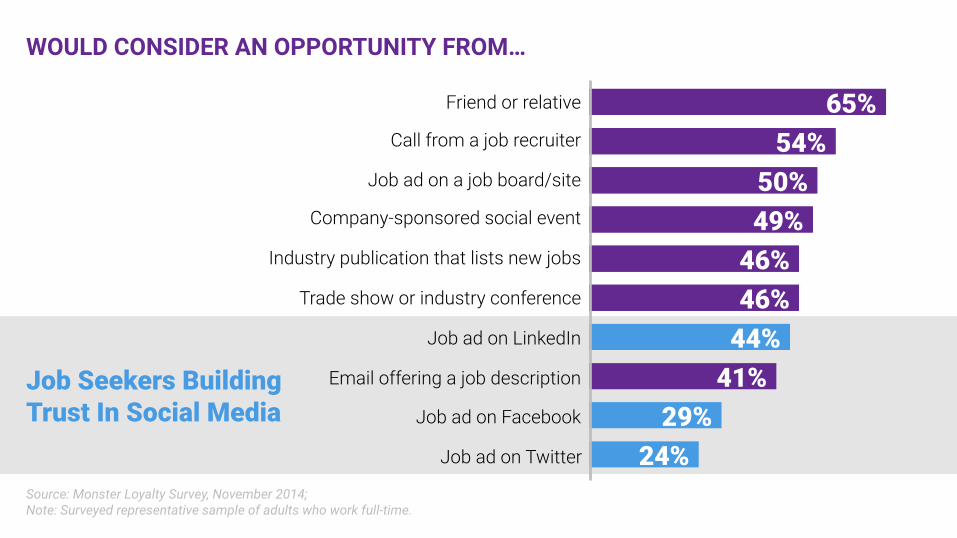
WOULD CONSIDER AN OPPORTUNITY FROM…
24% 29%
41% 44% 46% 46%
49% 50%
54% 65%
Job Seekers Building Trust In Social Media
24% 29%
41% 44% 46% 46%
49% 50%
54% 65% Friend or relative
Call from a job recruiter
Job ad on a job board/site
Company-sponsored social event
Industry publication that lists new jobs
Trade show or industry conference
Job ad on LinkedIn
Email offering a job description
Job ad on Facebook
Job ad on Twitter
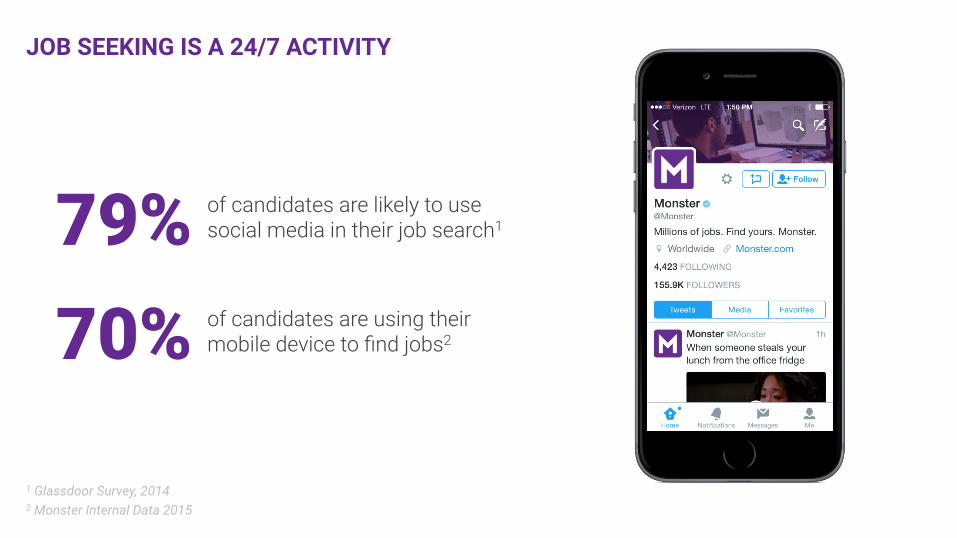
JOB SEEKING IS A 24/7 ACTIVITY
1 Glassdoor Survey, 2014 2 Monster Internal Data 2015
of candidates are likely to use social media in their job search1 79%
70% of candidates are using their mobile device to find jobs2
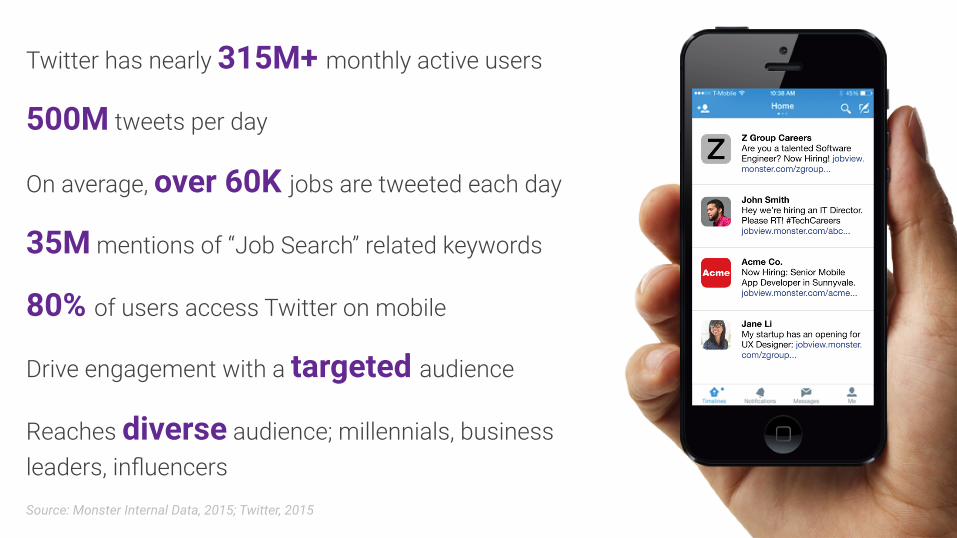
Twitter has nearly 315M+ monthly active users
500M tweets per day
On average, over 60K jobs are tweeted each day
35M mentions of “Job Search” related keywords
80% of users access Twitter on mobile
Drive engagement with a targeted audience
Reaches diverse audience; millennials, business leaders, influencers Source: Monster Internal Data, 2015; Twitter, 2015

What’s Next?

ON DEMAND ECONOMY

ON DEMAND ECONOMY

Workers on Tap?
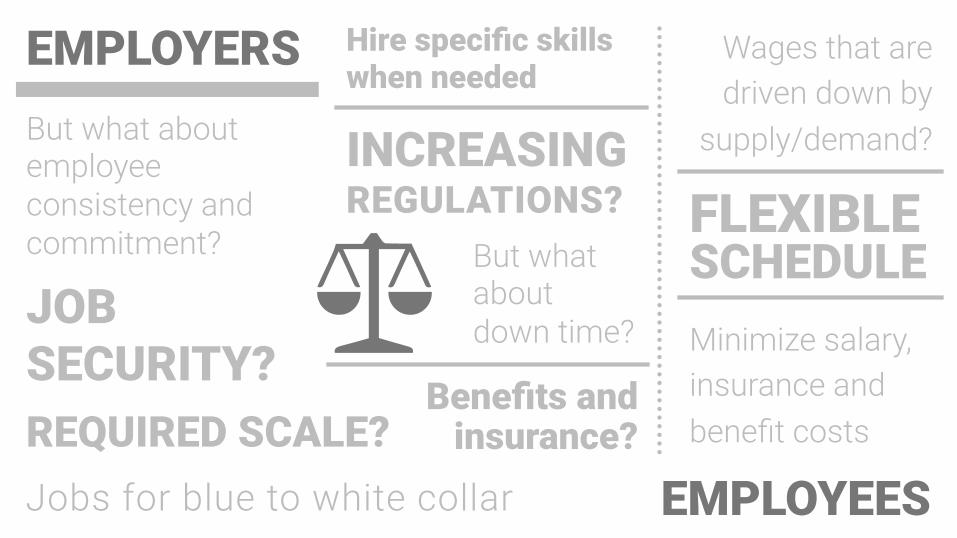
EMPLOYERS
EMPLOYEES
Benefits and insurance?
Jobs for blue to white collar
FLEXIBLE But what about �down time? JOB
SECURITY?
Wages that are driven down by
supply/demand?
REQUIRED SCALE?
Minimize salary, insurance and benefit costs
INCREASING REGULATIONS?
Hire specific skills �when needed
But what about employee consistency and commitment? SCHEDULE
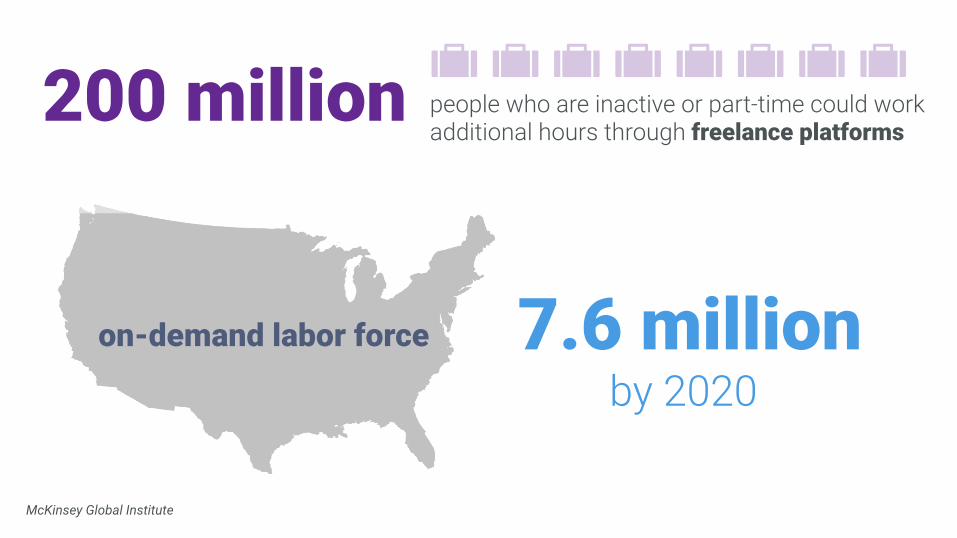
7.6 million
McKinsey Global Institute
people who are inactive or part-time could work additional hours through freelance platforms
200 million
on-demand labor force
by 2020

ROBOTS
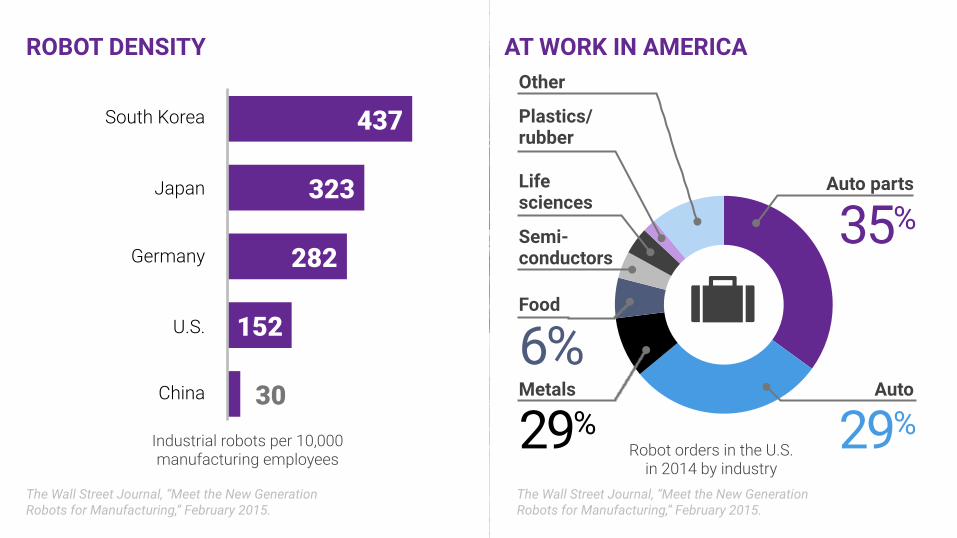
The Wall Street Journal, “Meet the New Generation Robots for Manufacturing,” February 2015.
ROBOT DENSITY
30
152
282
323
437
Industrial robots per 10,000 manufacturing employees
South Korea
Japan
Germany
U.S.
China
Auto parts
35%
Auto
29%
Food
Life �sciences
6%
Other
Metals
29% Robot orders in the U.S. �
in 2014 by industry
Semi-�conductors
Plastics/�rubber
AT WORK IN AMERICA
The Wall Street Journal, “Meet the New Generation Robots for Manufacturing,” February 2015.
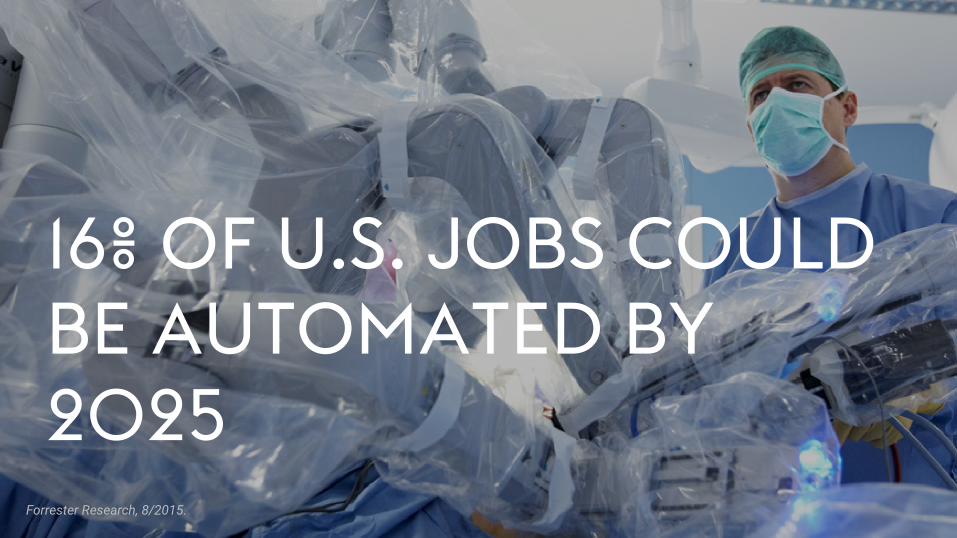
16% OF U.S. JOBS COULD BE AUTOMATED BY 2025
Forrester Research, 8/2015.

GENERATIONS IN THE WORKPLACE
POLLING QUESTION
Which generation makes up the majority of today’s workforce? A. Baby boomers B. Generation X C. Millennials D. Generation Z
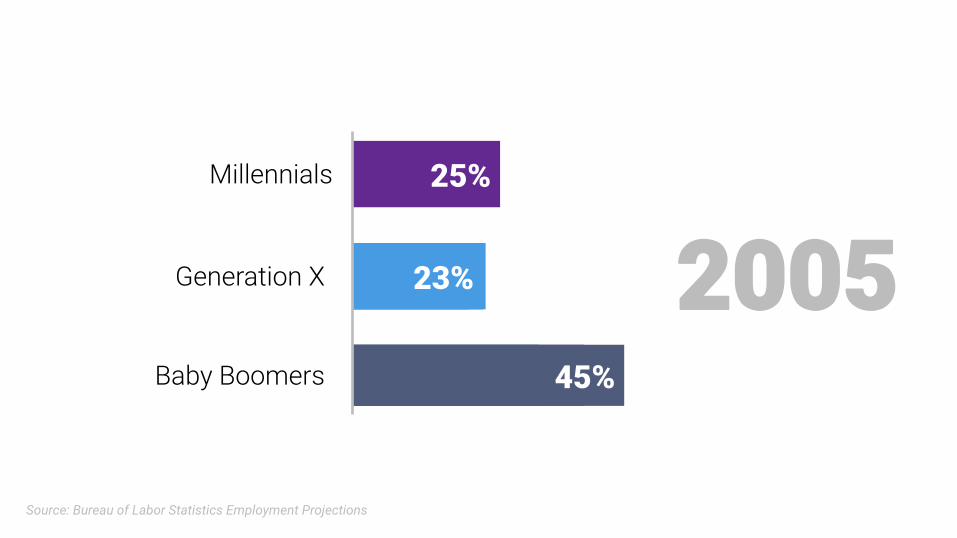
Source: Bureau of Labor Statistics Employment Projections
2005 31%
21%
38%
22%
45%
23%
25% Millennials
Generation X
Baby Boomers
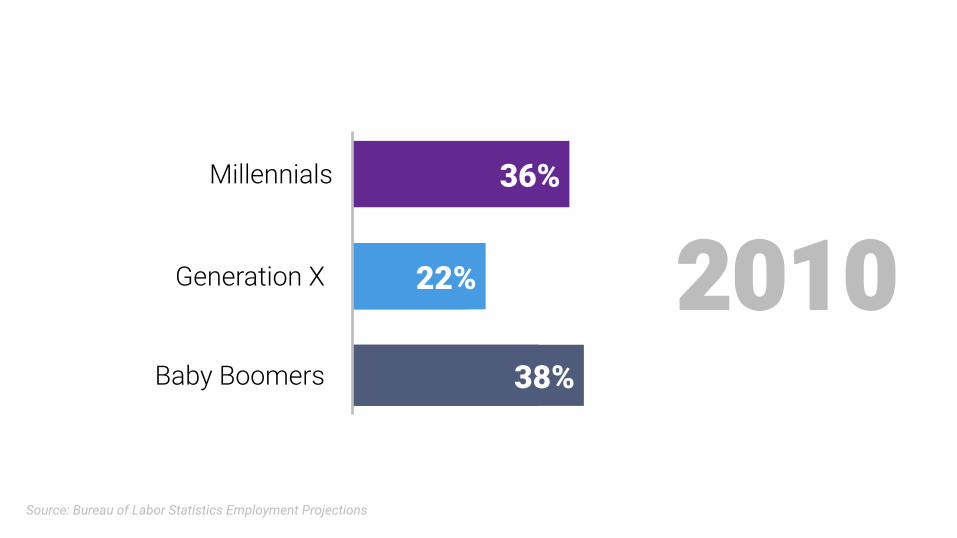
2010
Source: Bureau of Labor Statistics Employment Projections
31%
21%
38%
22%
36% Millennials
Generation X
Baby Boomers
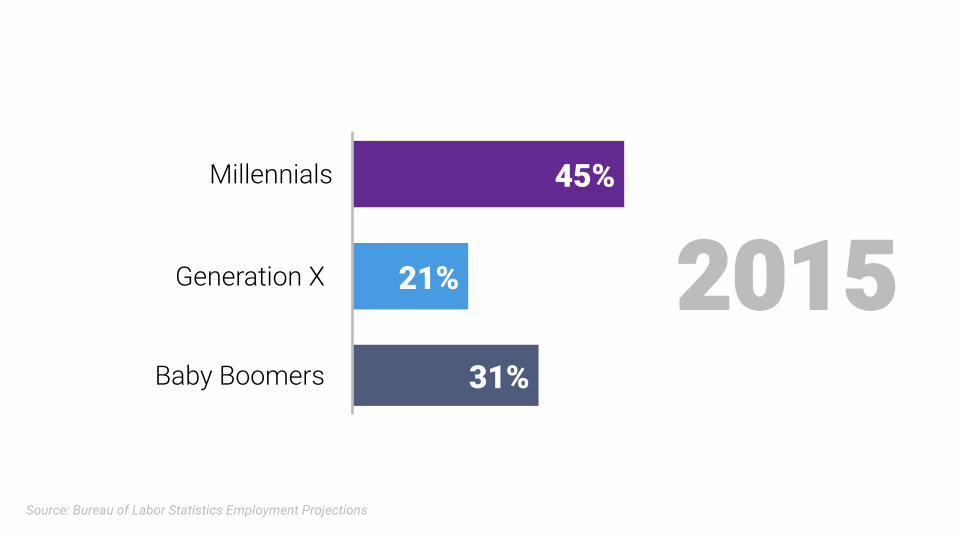
2015
Source: Bureau of Labor Statistics Employment Projections
31%
21%
45% Millennials
Generation X
Baby Boomers

GENERATION Z 80 MILLION
US Census
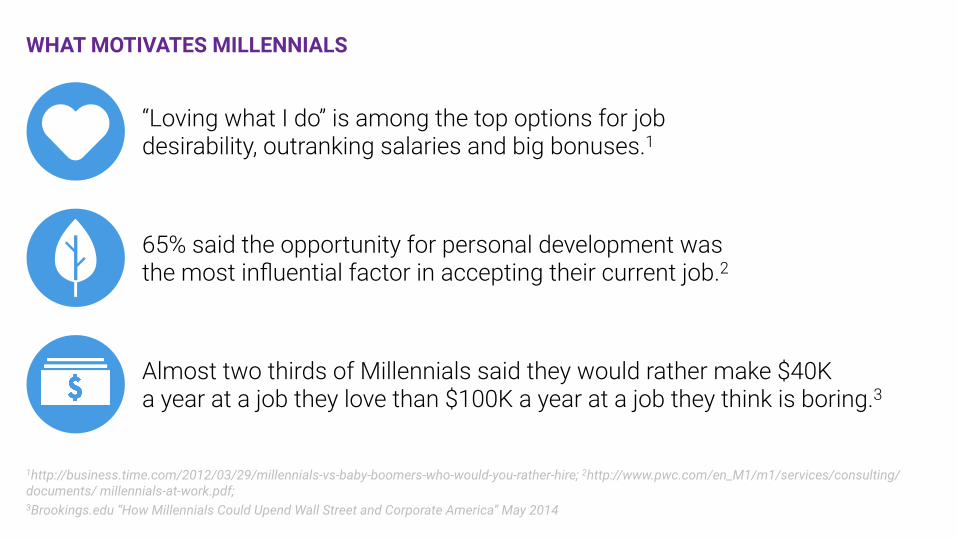
WHAT MOTIVATES MILLENNIALS �
1http://business.time.com/2012/03/29/millennials-vs-baby-boomers-who-would-you-rather-hire; 2http://www.pwc.com/en_M1/m1/services/consulting/documents/ millennials-at-work.pdf; 3Brookings.edu “How Millennials Could Upend Wall Street and Corporate America” May 2014
“Loving what I do” is among the top options for job desirability, outranking salaries and big bonuses.1
65% said the opportunity for personal development was the most influential factor in accepting their current job.2
Almost two thirds of Millennials said they would rather make $40K �a year at a job they love than $100K a year at a job they think is boring.3
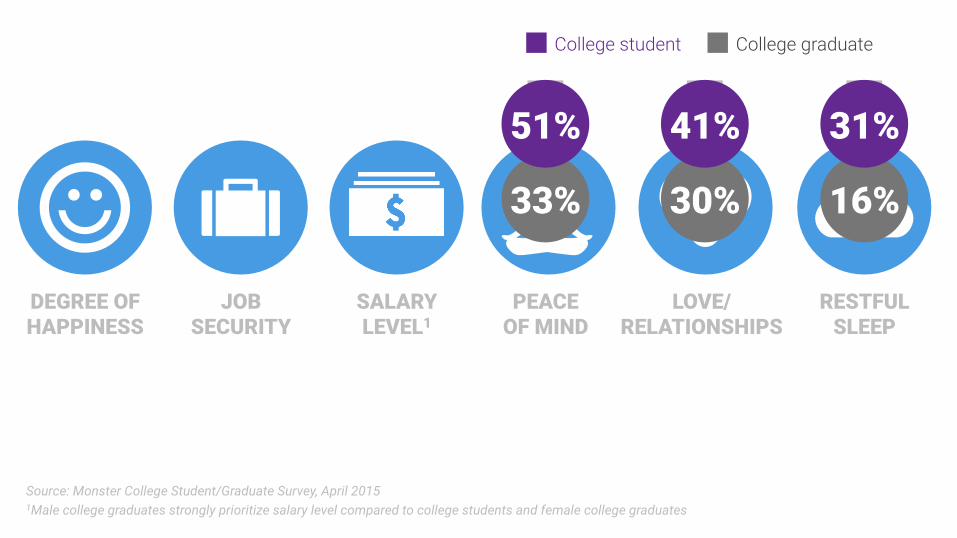
Source: Monster College Student/Graduate Survey, April 2015 1Male college graduates strongly prioritize salary level compared to college students and female college graduates
DEGREE OF HAPPINESS
PEACE �OF MIND
RESTFUL�SLEEP
JOB SECURITY
LOVE/�RELATIONSHIPS
33%
51%
30%
41%
16%
31%
College student College graduate
SALARY �LEVEL1

10101010101101001010101011011010110101011010100 11010101101010101010110100101010101101101001011
10101010101101001010010111010101010101011011010 11010101101010101011010101010101010011010010101
10101010101101101010010111001010110100101101101 01010110101010101011010010101010110110100101101
00010110101101010101010101010101101001010101011 01010110101010101011010010101010110110100101101
00010110101101010101010101010101101001010101011 10101010101101001010101011011010110101011010110
11010110101110110101010101011010010101010110111
HOW TO MAKE SENSE OF THE TRENDS AND DATA?

“Choose a job you love, and you will never have to work a day in your life.”
— Confucius
52

THANK YOU