Embed Size (px)
Citation preview
2013 Salary Survey
of Indian Technical Communicators
Date of publication: 2nd December 2013
Data collected in: October 2013
www.stc-india.org
STC India 2013 Salary Survey
Data collection, analysis, and report by: Paresh Naik
Your feedback and suggestions are welcome. Please write to [email protected]
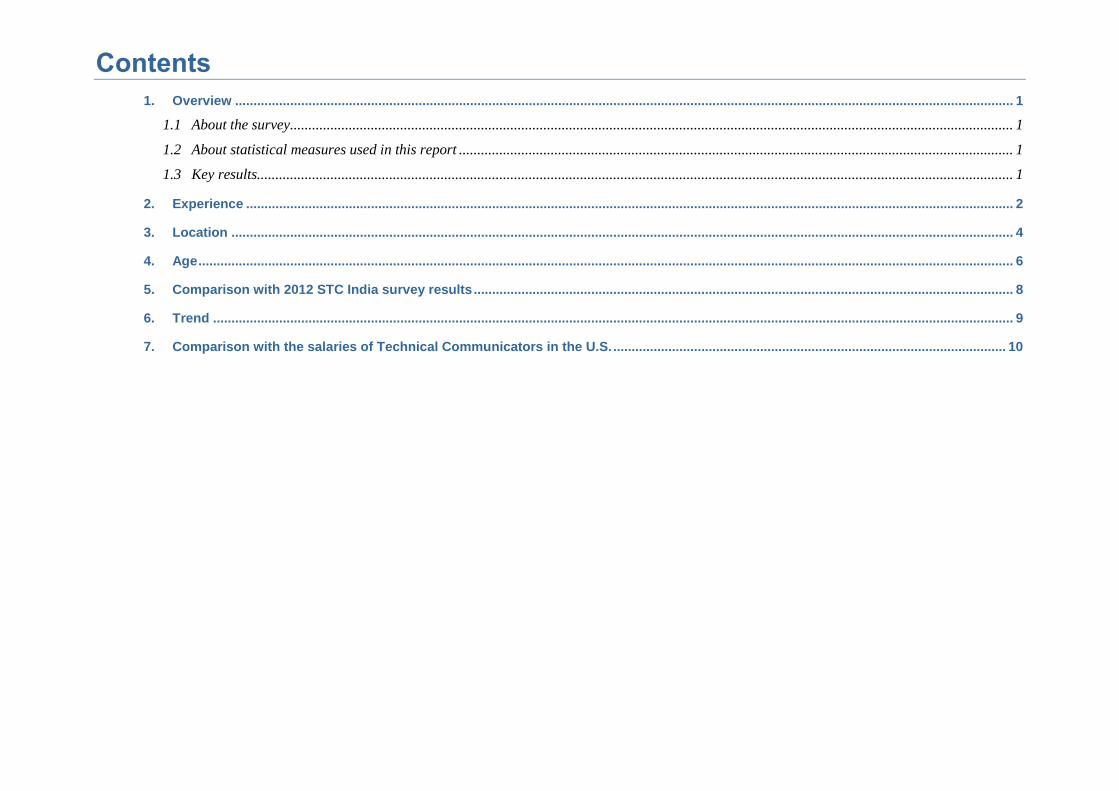
Contents
1. Overview .................................................................................................................................................................................................................... 1
1.1 About the survey ..................................................................................................................................................................................................... 1
1.2 About statistical measures used in this report ....................................................................................................................................................... 1
1.3 Key results.............................................................................................................................................................................................................. 1
2. Experience ................................................................................................................................................................................................................. 2
3. Location ..................................................................................................................................................................................................................... 4
4. Age .............................................................................................................................................................................................................................. 6
5. Comparison with 2012 STC India survey results ................................................................................................................................................... 8
6. Trend .......................................................................................................................................................................................................................... 9
7. Comparison with the salaries of Technical Communicators in the U.S. ........................................................................................................... 10
STC India 2013 Salary Survey 1
1. Overview
1.1 About the survey
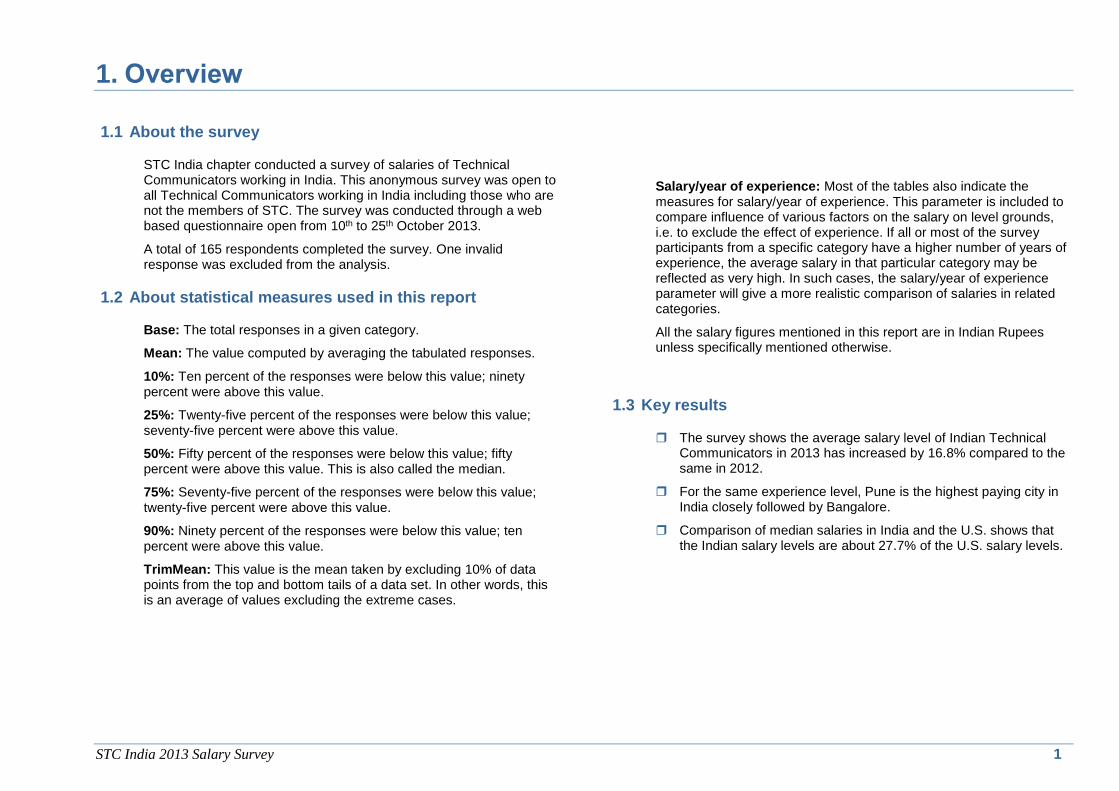
STC India chapter conducted a survey of salaries of Technical Communicators working in India. This anonymous survey was open to all Technical Communicators working in India including those who are not the members of STC. The survey was conducted through a web based questionnaire open from 10th to 25th October 2013.
A total of 165 respondents completed the survey. One invalid response was excluded from the analysis.
1.2 About statistical measures used in this report
Base: The total responses in a given category.
Mean: The value computed by averaging the tabulated responses.
10%: Ten percent of the responses were below this value; ninety percent were above this value.
25%: Twenty-five percent of the responses were below this value; seventy-five percent were above this value.
50%: Fifty percent of the responses were below this value; fifty percent were above this value. This is also called the median.
75%: Seventy-five percent of the responses were below this value; twenty-five percent were above this value.
90%: Ninety percent of the responses were below this value; ten percent were above this value.
TrimMean: This value is the mean taken by excluding 10% of data points from the top and bottom tails of a data set. In other words, this is an average of values excluding the extreme cases.
Salary/year of experience: Most of the tables also indicate the measures for salary/year of experience. This parameter is included to compare influence of various factors on the salary on level grounds, i.e. to exclude the effect of experience. If all or most of the survey participants from a specific category have a higher number of years of experience, the average salary in that particular category may be reflected as very high. In such cases, the salary/year of experience parameter will give a more realistic comparison of salaries in related categories.
All the salary figures mentioned in this report are in Indian Rupees unless specifically mentioned otherwise.
1.3 Key results
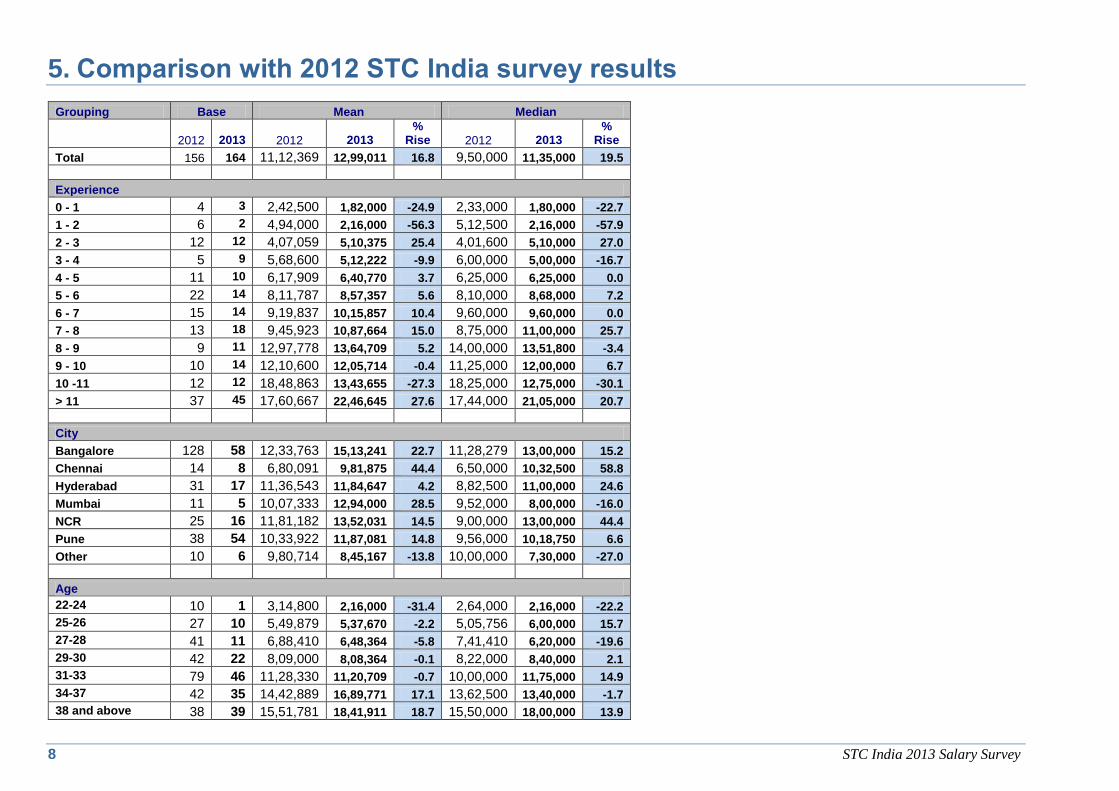
The survey shows the average salary level of Indian Technical Communicators in 2013 has increased by 16.8% compared to the same in 2012.
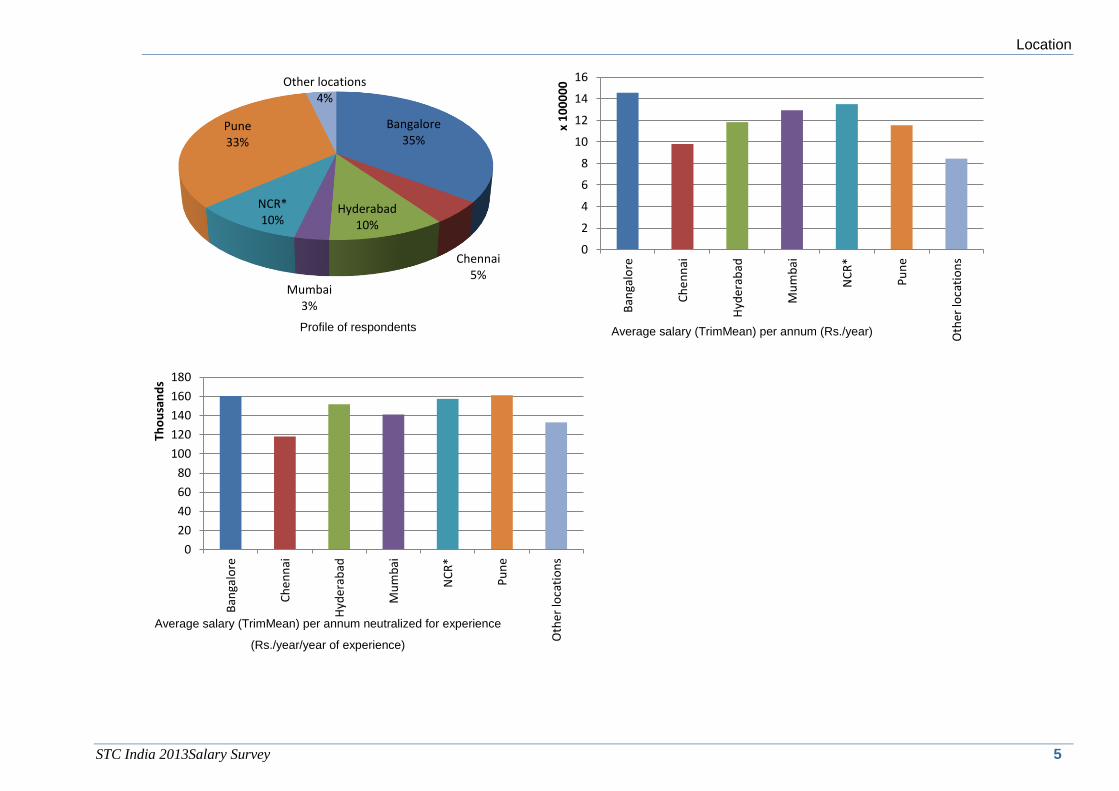
For the same experience level, Pune is the highest paying city in India closely followed by Bangalore.
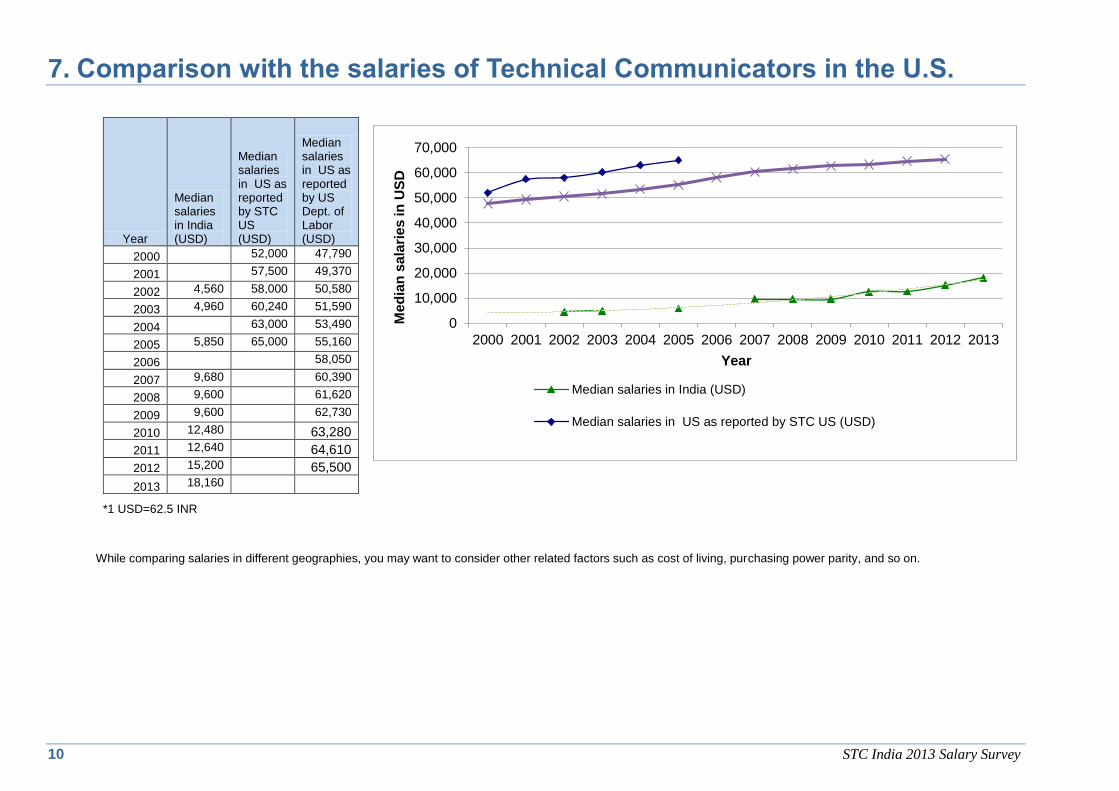
Comparison of median salaries in India and the U.S. shows that the Indian salary levels are about 27.7% of the U.S. salary levels.
2 STC India 2013 Salary Survey
2. Experience
Experience (Years)
Base Salary (Rs. per annum) Salary/year of experience (Rs. per annum)
Average TrimMea
n 10% 25% 50% 75% 90% Average TrimMea
n 10% 25% 50% 75% 90%
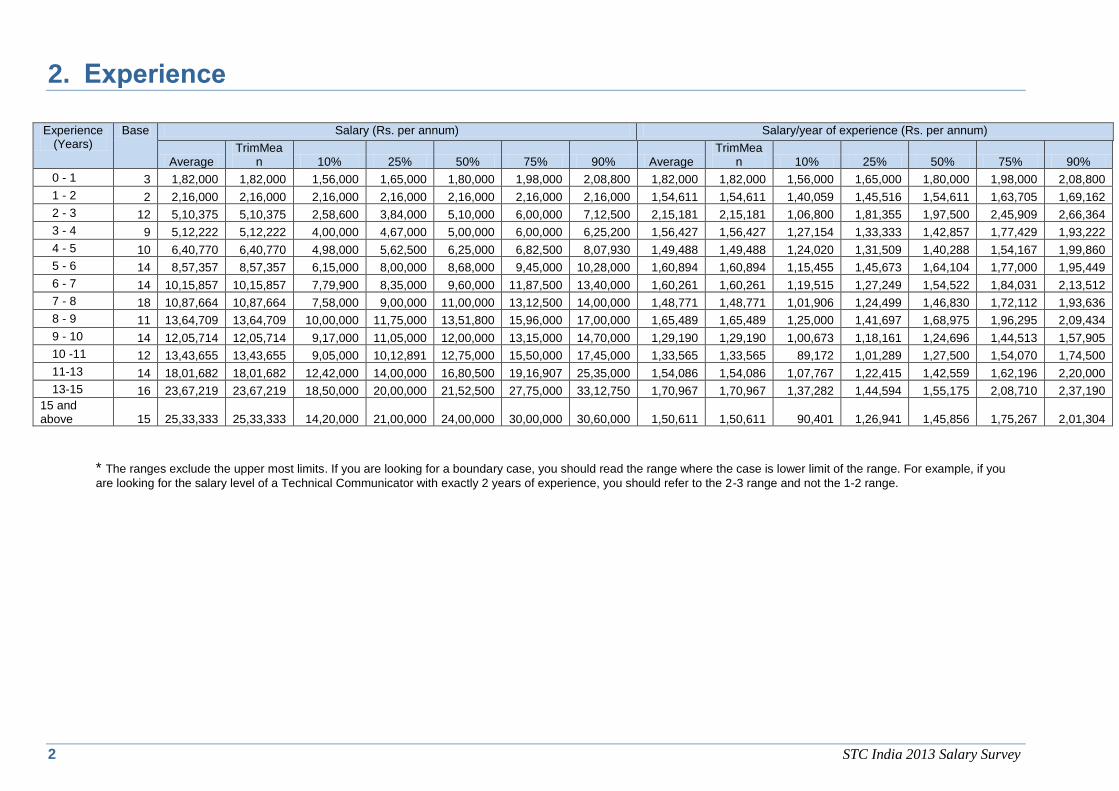
0 - 1 3 1,82,000 1,82,000 1,56,000 1,65,000 1,80,000 1,98,000 2,08,800 1,82,000 1,82,000 1,56,000 1,65,000 1,80,000 1,98,000 2,08,800
1 - 2 2 2,16,000 2,16,000 2,16,000 2,16,000 2,16,000 2,16,000 2,16,000 1,54,611 1,54,611 1,40,059 1,45,516 1,54,611 1,63,705 1,69,162
2 - 3 12 5,10,375 5,10,375 2,58,600 3,84,000 5,10,000 6,00,000 7,12,500 2,15,181 2,15,181 1,06,800 1,81,355 1,97,500 2,45,909 2,66,364
3 - 4 9 5,12,222 5,12,222 4,00,000 4,67,000 5,00,000 6,00,000 6,25,200 1,56,427 1,56,427 1,27,154 1,33,333 1,42,857 1,77,429 1,93,222
4 - 5 10 6,40,770 6,40,770 4,98,000 5,62,500 6,25,000 6,82,500 8,07,930 1,49,488 1,49,488 1,24,020 1,31,509 1,40,288 1,54,167 1,99,860
5 - 6 14 8,57,357 8,57,357 6,15,000 8,00,000 8,68,000 9,45,000 10,28,000 1,60,894 1,60,894 1,15,455 1,45,673 1,64,104 1,77,000 1,95,449
6 - 7 14 10,15,857 10,15,857 7,79,900 8,35,000 9,60,000 11,87,500 13,40,000 1,60,261 1,60,261 1,19,515 1,27,249 1,54,522 1,84,031 2,13,512
7 - 8 18 10,87,664 10,87,664 7,58,000 9,00,000 11,00,000 13,12,500 14,00,000 1,48,771 1,48,771 1,01,906 1,24,499 1,46,830 1,72,112 1,93,636
8 - 9 11 13,64,709 13,64,709 10,00,000 11,75,000 13,51,800 15,96,000 17,00,000 1,65,489 1,65,489 1,25,000 1,41,697 1,68,975 1,96,295 2,09,434
9 - 10 14 12,05,714 12,05,714 9,17,000 11,05,000 12,00,000 13,15,000 14,70,000 1,29,190 1,29,190 1,00,673 1,18,161 1,24,696 1,44,513 1,57,905
10 -11 12 13,43,655 13,43,655 9,05,000 10,12,891 12,75,000 15,50,000 17,45,000 1,33,565 1,33,565 89,172 1,01,289 1,27,500 1,54,070 1,74,500
11-13 14 18,01,682 18,01,682 12,42,000 14,00,000 16,80,500 19,16,907 25,35,000 1,54,086 1,54,086 1,07,767 1,22,415 1,42,559 1,62,196 2,20,000
13-15 16 23,67,219 23,67,219 18,50,000 20,00,000 21,52,500 27,75,000 33,12,750 1,70,967 1,70,967 1,37,282 1,44,594 1,55,175 2,08,710 2,37,190
15 and above 15 25,33,333 25,33,333 14,20,000 21,00,000 24,00,000 30,00,000 30,60,000 1,50,611 1,50,611 90,401 1,26,941 1,45,856 1,75,267 2,01,304
* The ranges exclude the upper most limits. If you are looking for a boundary case, you should read the range where the case is lower limit of the range. For example, if you
are looking for the salary level of a Technical Communicator with exactly 2 years of experience, you should refer to the 2-3 range and not the 1-2 range.
Experience
STC India 2013Salary Survey 3
0 - 12%
1 - 21%
2 - 37%
3 - 45% 4 - 5
6%
5 - 68%
6 - 79%7 - 8
11%8 - 97%
9 - 109%
10 -117%
11-139%
13-1510%
15 and above9%
0
5
10
15
20
25
30
0 - 1 1 - 2 2 - 3 3 - 4 4 - 5 5 - 6 6 - 7 7 - 8 8 - 9 9 - 10 10 -11 11-13 13-15 15and
above
x 1
00
00
0
0
50
100
150
200
250
0 - 1 1 - 2 2 - 3 3 - 4 4 - 5 5 - 6 6 - 7 7 - 8 8 - 9 9 - 10 10 -11 11-13 13-15 15 andabove
Tho
usa
nd
s
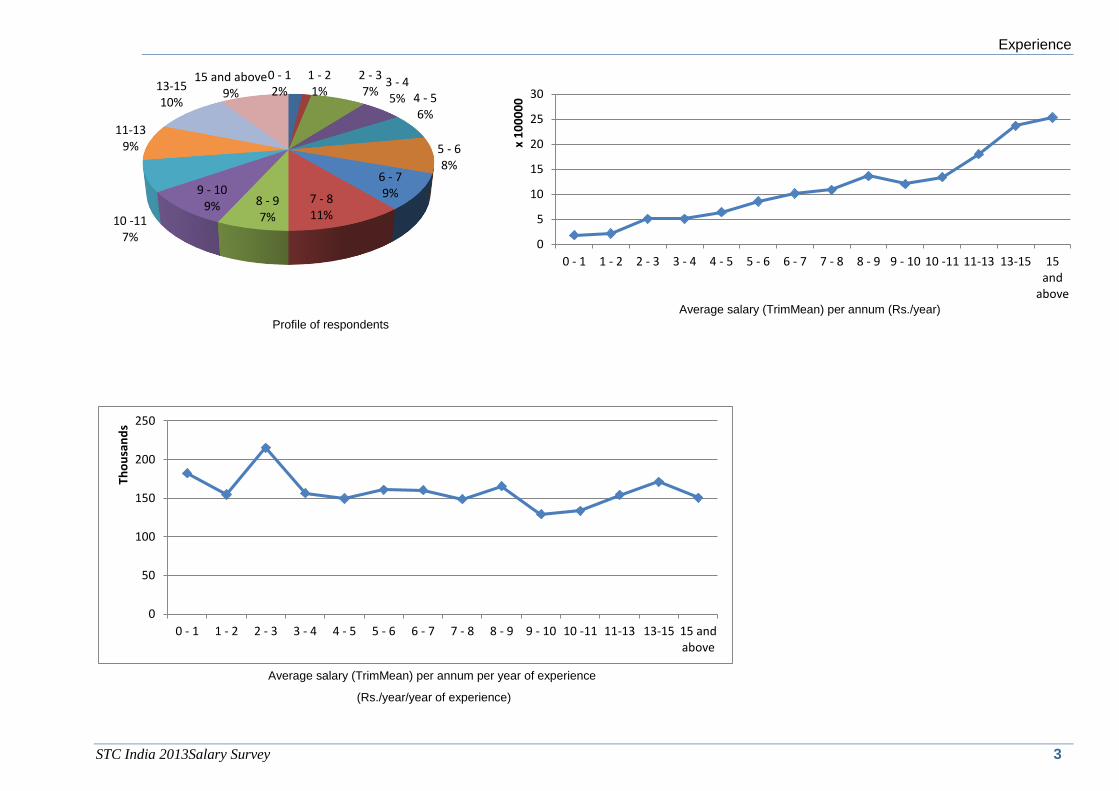
Average salary (TrimMean) per annum (Rs./year)
Average salary (TrimMean) per annum per year of experience
(Rs./year/year of experience)
Profile of respondents
4 STC India 2013 Salary Survey
3. Location
Location Base Salary (Rs. per annum) Salary/year of experience (Rs. per annum)
Average TrimMean 10% 25% 50% 75% 90% Average TrimMean 10% 25% 50% 75% 90%
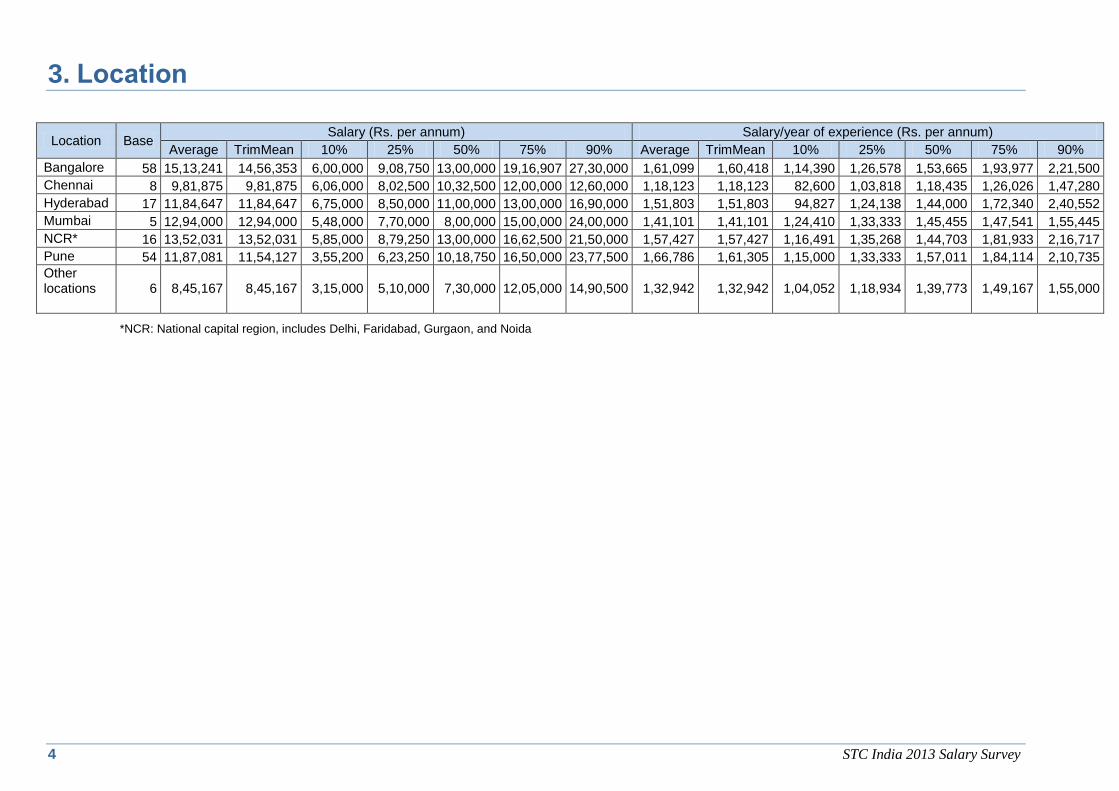
Bangalore 58 15,13,241 14,56,353 6,00,000 9,08,750 13,00,000 19,16,907 27,30,000 1,61,099 1,60,418 1,14,390 1,26,578 1,53,665 1,93,977 2,21,500
Chennai 8 9,81,875 9,81,875 6,06,000 8,02,500 10,32,500 12,00,000 12,60,000 1,18,123 1,18,123 82,600 1,03,818 1,18,435 1,26,026 1,47,280
Hyderabad 17 11,84,647 11,84,647 6,75,000 8,50,000 11,00,000 13,00,000 16,90,000 1,51,803 1,51,803 94,827 1,24,138 1,44,000 1,72,340 2,40,552
Mumbai 5 12,94,000 12,94,000 5,48,000 7,70,000 8,00,000 15,00,000 24,00,000 1,41,101 1,41,101 1,24,410 1,33,333 1,45,455 1,47,541 1,55,445
NCR* 16 13,52,031 13,52,031 5,85,000 8,79,250 13,00,000 16,62,500 21,50,000 1,57,427 1,57,427 1,16,491 1,35,268 1,44,703 1,81,933 2,16,717
Pune 54 11,87,081 11,54,127 3,55,200 6,23,250 10,18,750 16,50,000 23,77,500 1,66,786 1,61,305 1,15,000 1,33,333 1,57,011 1,84,114 2,10,735
Other locations 6 8,45,167 8,45,167 3,15,000 5,10,000 7,30,000 12,05,000 14,90,500 1,32,942 1,32,942 1,04,052 1,18,934 1,39,773 1,49,167 1,55,000
*NCR: National capital region, includes Delhi, Faridabad, Gurgaon, and Noida
Location
STC India 2013Salary Survey 5
Bangalore35%
Chennai5%
Hyderabad10%
Mumbai3%
NCR*10%
Pune33%
Other locations4%
0
2
4
6
8
10
12
14
16
Ban
galo
re
Ch
en
nai
Hyd
era
bad
Mu
mb
ai
NC
R*
Pu
ne
Oth
er lo
cati
on
s
x 1
00
00
00
20
40
60
80
100
120
140
160
180
Ban
galo
re
Ch
en
nai
Hyd
era
bad
Mu
mb
ai
NC
R*
Pu
ne
Oth
er lo
cati
on
s
Tho
usa
nd
s
Average salary (TrimMean) per annum (Rs./year)
Average salary (TrimMean) per annum neutralized for experience
(Rs./year/year of experience)
Profile of respondents
Average salary (TrimMean) per annum neutralized for experience
(Rs./year/year of experience)
6 STC India 2013 Salary Survey
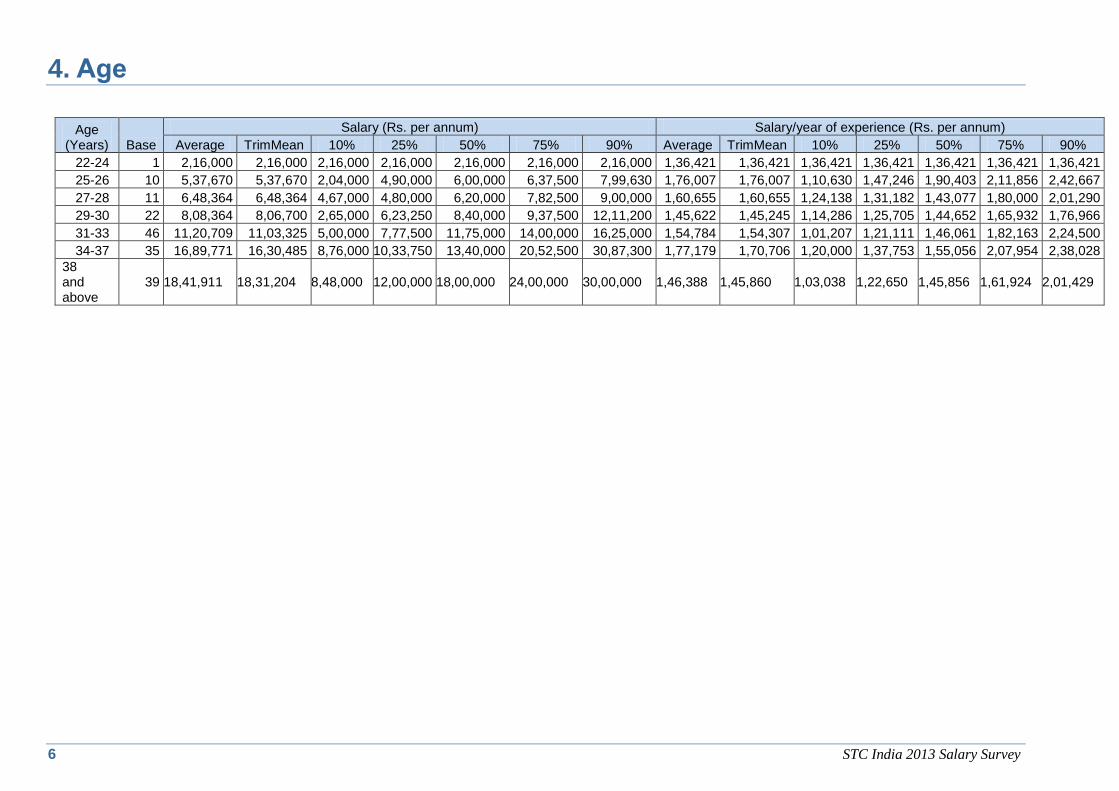
4. Age
Age (Years) Base
Salary (Rs. per annum) Salary/year of experience (Rs. per annum)
Average TrimMean 10% 25% 50% 75% 90% Average TrimMean 10% 25% 50% 75% 90%
22-24 1 2,16,000 2,16,000 2,16,000 2,16,000 2,16,000 2,16,000 2,16,000 1,36,421 1,36,421 1,36,421 1,36,421 1,36,421 1,36,421 1,36,421
25-26 10 5,37,670 5,37,670 2,04,000 4,90,000 6,00,000 6,37,500 7,99,630 1,76,007 1,76,007 1,10,630 1,47,246 1,90,403 2,11,856 2,42,667
27-28 11 6,48,364 6,48,364 4,67,000 4,80,000 6,20,000 7,82,500 9,00,000 1,60,655 1,60,655 1,24,138 1,31,182 1,43,077 1,80,000 2,01,290
29-30 22 8,08,364 8,06,700 2,65,000 6,23,250 8,40,000 9,37,500 12,11,200 1,45,622 1,45,245 1,14,286 1,25,705 1,44,652 1,65,932 1,76,966
31-33 46 11,20,709 11,03,325 5,00,000 7,77,500 11,75,000 14,00,000 16,25,000 1,54,784 1,54,307 1,01,207 1,21,111 1,46,061 1,82,163 2,24,500
34-37 35 16,89,771 16,30,485 8,76,000 10,33,750 13,40,000 20,52,500 30,87,300 1,77,179 1,70,706 1,20,000 1,37,753 1,55,056 2,07,954 2,38,028
38 and above
39 18,41,911 18,31,204 8,48,000 12,00,000 18,00,000 24,00,000 30,00,000 1,46,388 1,45,860 1,03,038 1,22,650 1,45,856 1,61,924 2,01,429
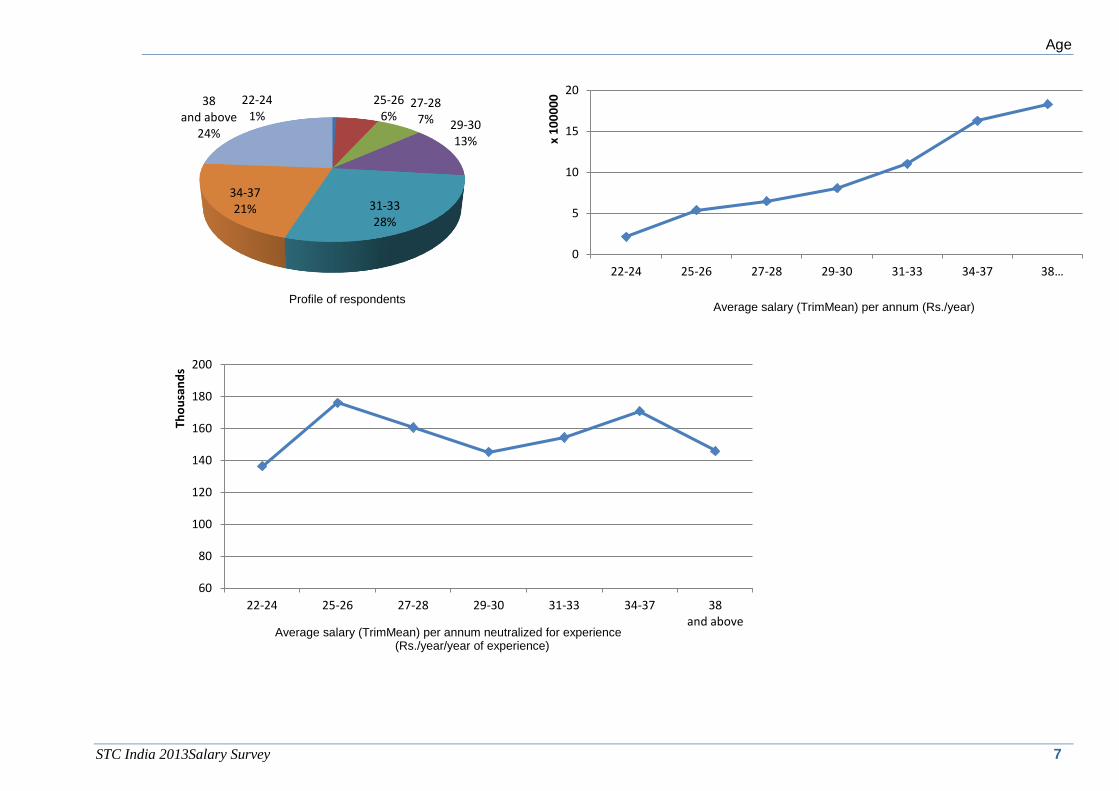
Age
STC India 2013Salary Survey 7
22-241%
25-266%
27-287% 29-30
13%
31-3328%
34-3721%
38 and above
24%
0
5
10
15
20
22-24 25-26 27-28 29-30 31-33 34-37 38…
x 1
00
00
0
60
80
100
120
140
160
180
200
22-24 25-26 27-28 29-30 31-33 34-37 38and above
Tho
usa
nd
s
Average salary (TrimMean) per annum (Rs./year) Profile of respondents
Average salary (TrimMean) per annum neutralized for experience (Rs./year/year of experience)
8 STC India 2013 Salary Survey
5. Comparison with 2012 STC India survey results
Grouping Base Mean Median
2012 2013 2012 2013 %
Rise 2012 2013 %
Rise
Total 156 164 11,12,369 12,99,011 16.8 9,50,000 11,35,000 19.5
Experience
0 - 1 4 3 2,42,500 1,82,000 -24.9 2,33,000 1,80,000 -22.7
1 - 2 6 2 4,94,000 2,16,000 -56.3 5,12,500 2,16,000 -57.9
2 - 3 12 12 4,07,059 5,10,375 25.4 4,01,600 5,10,000 27.0
3 - 4 5 9 5,68,600 5,12,222 -9.9 6,00,000 5,00,000 -16.7
4 - 5 11 10 6,17,909 6,40,770 3.7 6,25,000 6,25,000 0.0
5 - 6 22 14 8,11,787 8,57,357 5.6 8,10,000 8,68,000 7.2
6 - 7 15 14 9,19,837 10,15,857 10.4 9,60,000 9,60,000 0.0
7 - 8 13 18 9,45,923 10,87,664 15.0 8,75,000 11,00,000 25.7
8 - 9 9 11 12,97,778 13,64,709 5.2 14,00,000 13,51,800 -3.4
9 - 10 10 14 12,10,600 12,05,714 -0.4 11,25,000 12,00,000 6.7
10 -11 12 12 18,48,863 13,43,655 -27.3 18,25,000 12,75,000 -30.1
> 11 37 45 17,60,667 22,46,645 27.6 17,44,000 21,05,000 20.7
City
Bangalore 128 58 12,33,763 15,13,241 22.7 11,28,279 13,00,000 15.2
Chennai 14 8 6,80,091 9,81,875 44.4 6,50,000 10,32,500 58.8
Hyderabad 31 17 11,36,543 11,84,647 4.2 8,82,500 11,00,000 24.6
Mumbai 11 5 10,07,333 12,94,000 28.5 9,52,000 8,00,000 -16.0
NCR 25 16 11,81,182 13,52,031 14.5 9,00,000 13,00,000 44.4
Pune 38 54 10,33,922 11,87,081 14.8 9,56,000 10,18,750 6.6
Other 10 6 9,80,714 8,45,167 -13.8 10,00,000 7,30,000 -27.0
Age
22-24 10 1 3,14,800 2,16,000 -31.4 2,64,000 2,16,000 -22.2
25-26 27 10 5,49,879 5,37,670 -2.2 5,05,756 6,00,000 15.7
27-28 41 11 6,88,410 6,48,364 -5.8 7,41,410 6,20,000 -19.6
29-30 42 22 8,09,000 8,08,364 -0.1 8,22,000 8,40,000 2.1
31-33 79 46 11,28,330 11,20,709 -0.7 10,00,000 11,75,000 14.9
34-37 42 35 14,42,889 16,89,771 17.1 13,62,500 13,40,000 -1.7
38 and above 38 39 15,51,781 18,41,911 18.7 15,50,000 18,00,000 13.9
STC India 2013Salary Survey 9
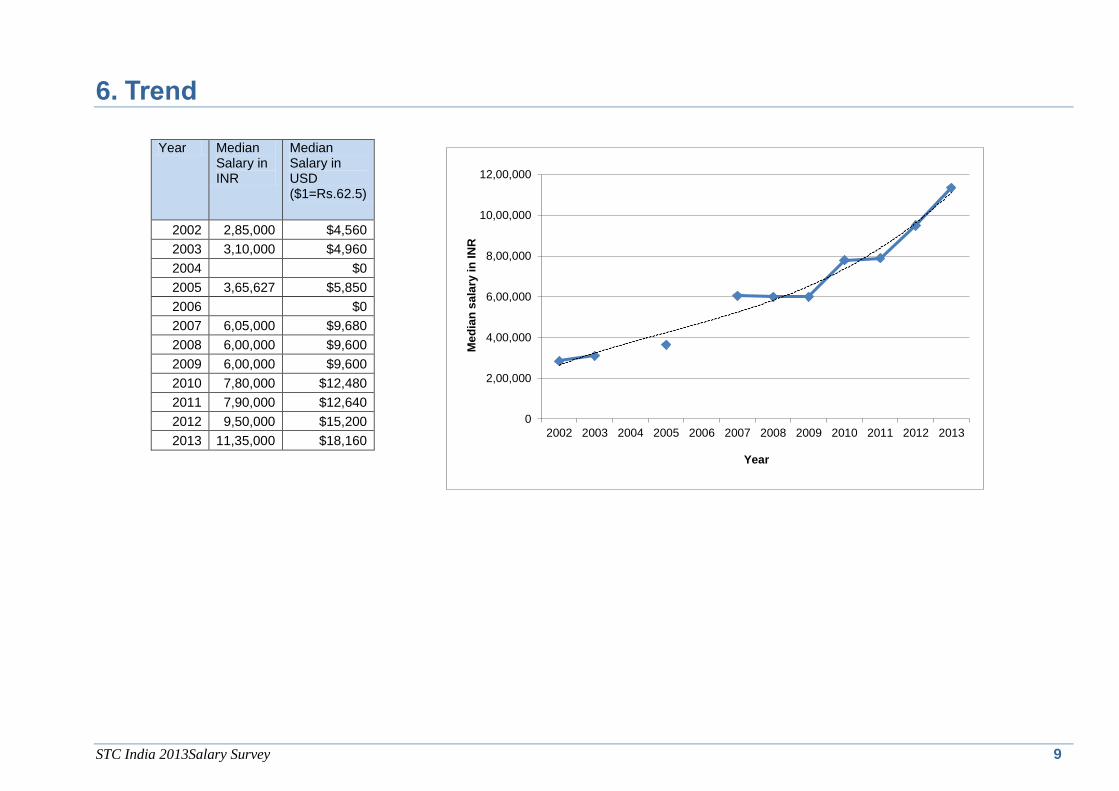
6. Trend
Year Median Salary in INR
Median Salary in USD ($1=Rs.62.5)
2002 2,85,000 $4,560
2003 3,10,000 $4,960
2004 $0
2005 3,65,627 $5,850
2006 $0
2007 6,05,000 $9,680
2008 6,00,000 $9,600
2009 6,00,000 $9,600
2010 7,80,000 $12,480
2011 7,90,000 $12,640
2012 9,50,000 $15,200
2013 11,35,000 $18,160
0
2,00,000
4,00,000
6,00,000
8,00,000
10,00,000
12,00,000
2002 2003 2004 2005 2006 2007 2008 2009 2010 2011 2012 2013
Me
dia
n s
ala
ry i
n IN
RYear
10 STC India 2013 Salary Survey
7. Comparison with the salaries of Technical Communicators in the U.S.
Year
Median salaries in India (USD)
Median salaries in US as reported by STC US (USD)
Median salaries in US as reported by US Dept. of Labor (USD)
2000 52,000 47,790
2001 57,500 49,370
2002 4,560 58,000 50,580
2003 4,960 60,240 51,590
2004 63,000 53,490
2005 5,850 65,000 55,160
2006 58,050
2007 9,680 60,390
2008 9,600 61,620
2009 9,600 62,730
2010 12,480 63,280
2011 12,640 64,610
2012 15,200 65,500
2013 18,160
*1 USD=62.5 INR
While comparing salaries in different geographies, you may want to consider other related factors such as cost of living, purchasing power parity, and so on.
0
10,000
20,000
30,000
40,000
50,000
60,000
70,000
2000 2001 2002 2003 2004 2005 2006 2007 2008 2009 2010 2011 2012 2013
Me
dia
n s
ala
rie
s in
US
D
Year
Median salaries in India (USD)
Median salaries in US as reported by STC US (USD)