Embed Size (px)
Citation preview
EN 25 EN
1. STATE OF THE TELECOMS SERVICES SECTOR IN EUROPE
1.1. Introduction
The European telecoms sector experienced a decline in revenues of -1.1%1 in 2012. While this
decline is less than in 2011 (-2.2%), it contrasts with the trend in other regions such as the US
and the rest of the world, where revenues for telecoms services experienced 5.1% and 5.8%
year-on-year increases respectively in 2012.
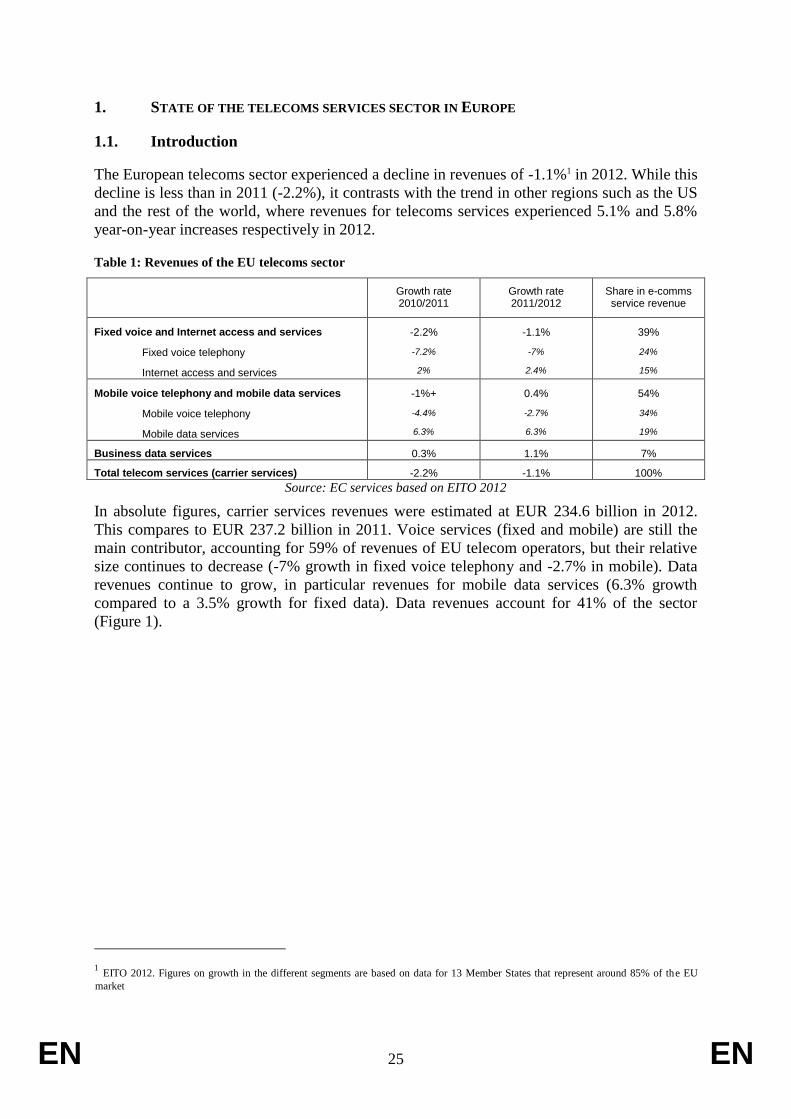
Table 1: Revenues of the EU telecoms sector
Growth rate 2010/2011
Growth rate 2011/2012
Share in e-comms service revenue
Fixed voice and Internet access and services
Fixed voice telephony
Internet access and services
-2.2%
-7.2%
2%
-1.1%
-7%
2.4%
39%
24%
15%
Mobile voice telephony and mobile data services
Mobile voice telephony
Mobile data services
-1%+
-4.4%
6.3%
0.4%
-2.7%
6.3%
54%
34%
19%
Business data services 0.3% 1.1% 7%
Total telecom services (carrier services) -2.2% -1.1% 100%
Source: EC services based on EITO 2012
In absolute figures, carrier services revenues were estimated at EUR 234.6 billion in 2012.
This compares to EUR 237.2 billion in 2011. Voice services (fixed and mobile) are still the
main contributor, accounting for 59% of revenues of EU telecom operators, but their relative
size continues to decrease (-7% growth in fixed voice telephony and -2.7% in mobile). Data
revenues continue to grow, in particular revenues for mobile data services (6.3% growth
compared to a 3.5% growth for fixed data). Data revenues account for 41% of the sector
(Figure 1).
1 EITO 2012. Figures on growth in the different segments are based on data for 13 Member States that represent around 85% of the EU
market

EN 26 EN
Figure 1: Telecommunications revenues by segment
0%
10%
20%
30%
40%
50%
60%
70%
80%
90%
100%
2010 2011 2012
Telecommunications revenues by segment
Fixed voice telephony Mobile voice telephony Business data services
Internet access & services Mobile data services
37% 39% 41%
Source: EC services based on EITO 2012
1.2. Key developments in 2012
In 2012 telecoms operators struggled to reverse the declining trend in revenues and margins,
focusing on retaining customers and increasing ARPU, amidst a combination of challenging
elements:
very high penetration of current generation of fixed and mobile telephony and of
fixed-line broadband access2 in several countries, with limited prospects for organic
growth;
downward pressure on telecoms pricing driven by a number of factors including
competition and shrinking demand for services in several countries heavily affected by
the financial and economic situation3;
rapidly growing demand for fixed and mobile data traffic driven by the fast spread of
smartphones and tablets4. This brought about a further commoditization of voice, both
in fixed and more and more in mobile services, that was not compensated by the
steady increase of mobile data revenues.
1.2.1. Growth of mobile traffic
The gap between the impressive growth in traffic and the much lower growth in data revenues
is having a clear impact on the sector. Between 2010 and 2012, revenues from data services
increased by 8%. By contrast, the proportion of the European population using a mobile
phone to access the Internet nearly doubled, going from 14% to 27% in 20125 and the demand
in traffic has been doubling every year. The volume of mobile data traffic in Europe is
expected to grow more than tenfold in the period from 2010 to 20156 and global growth
2
See chapter on broadband. 3 Especially in Greece, Spain and Ireland. The state of the economy deteriorated in 2012 at European level with a -0.6% GDP growth rate in
the euro area and -0.3% in the EU27 compared to 2011. 4In 2011, tablet shipment volume soared by more than 150% year-on-year in most Western European markets, with France and Italy both
seeing shipment growth more than tripling and Switzerland and Austria seeing shipment volume almost tripling (EITO 2012). In 2012 the
market for tablets was estimated at 117 million units (IDC, 19/09/12). 5 Eurostat
6 Europe clears the way for 4G, ScreenDigest, January 2012
EN 27 EN
surged by an estimated 350% between 2010 and 2012 (Figure 3). It is estimated that, in 2012
alone, mobile data traffic increased by 69%, with 3G data representing almost 50% of the
total and with an acceleration of LTE traffic (+207% y-o-y growth)7. In 2012 a fourth-
generation (4G) connection generated 19 times more traffic on average than a non-4G
connection and although 4G connections represent only 0.9% of mobile connections they
account for 14% of mobile data traffic. At the same time, the price of mobile data in the EU is
amongst the lowest in the world, with some data plans being less expensive in the EU than in
other regions of the world (Figure 4). Since achieving full coverage of 4G networks offering
higher speed access may still take some years, rapid adoption of 4G services at higher prices
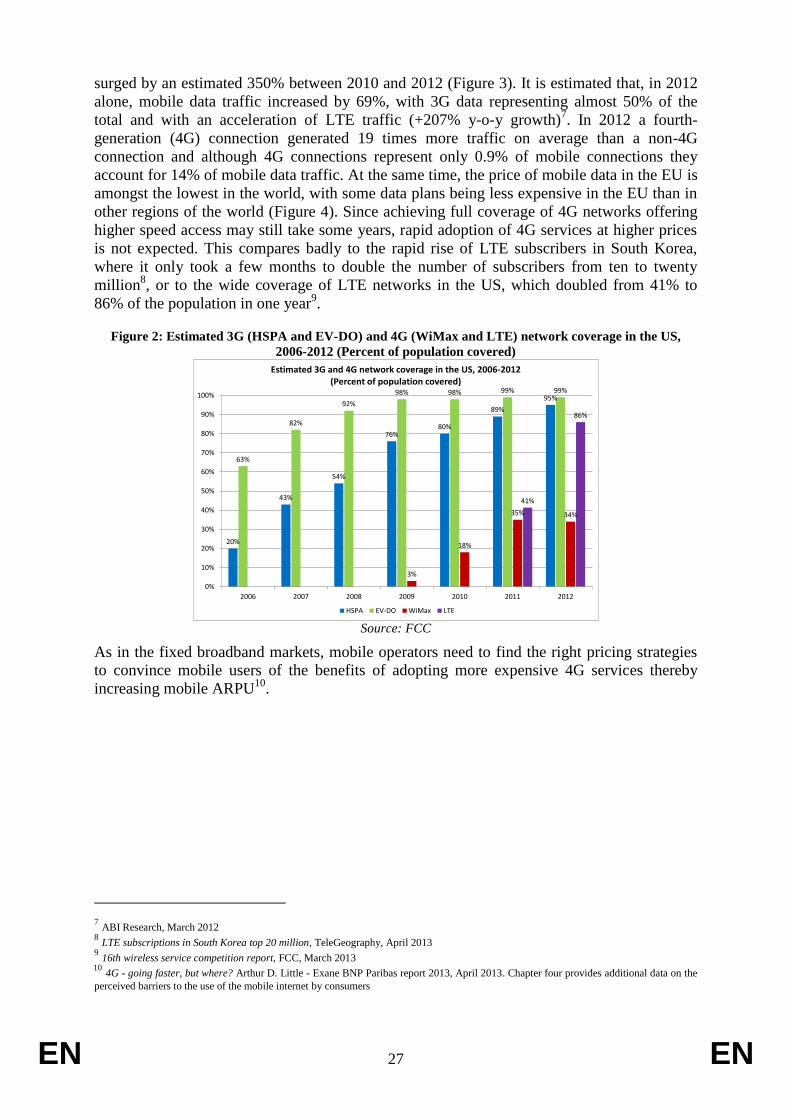
is not expected. This compares badly to the rapid rise of LTE subscribers in South Korea,
where it only took a few months to double the number of subscribers from ten to twenty
million8, or to the wide coverage of LTE networks in the US, which doubled from 41% to
86% of the population in one year9.
Figure 2: Estimated 3G (HSPA and EV-DO) and 4G (WiMax and LTE) network coverage in the US,
2006-2012 (Percent of population covered)
20%
43%
54%
76%80%
89%
95%
63%
82%
92%
98% 98% 99% 99%
3%
18%
35% 34%
41%
86%
0%
10%
20%
30%
40%
50%
60%
70%
80%
90%
100%
2006 2007 2008 2009 2010 2011 2012
Estimated 3G and 4G network coverage in the US, 2006-2012 (Percent of population covered)
HSPA EV-DO WiMax LTE
Source: FCC
As in the fixed broadband markets, mobile operators need to find the right pricing strategies
to convince mobile users of the benefits of adopting more expensive 4G services thereby
increasing mobile ARPU10
.
7 ABI Research, March 2012
8 LTE subscriptions in South Korea top 20 million, TeleGeography, April 2013
9 16th wireless service competition report, FCC, March 2013
10 4G - going faster, but where? Arthur D. Little - Exane BNP Paribas report 2013, April 2013. Chapter four provides additional data on the
perceived barriers to the use of the mobile internet by consumers

EN 28 EN
Figure 3: Global mobile traffic: voice and data 2007-2012
0
100
200
300
400
500
600
700
800
900
1000
Q107 Q207 Q307 Q407 Q108 Q208 Q308 Q408 Q109 Q209 Q309 Q409 Q110 Q210 Q310 Q410 Q111 Q211 Q311 Q411 Q112 Q212 Q312
Tota
l (u
plin
k+d
ow
nlin
k) m
on
thly
tra
ffic
(Pe
taB
ytes
)
Global mobile traffic: voice and data 2007-2012
Voice Data
Source: Ericsson
Figure 4: Price of mobile broadband
1715.6
14.1
12.311.3
10.18.8
R² = 0.9463
0
2
4
6
8
10
12
14
16
18
20
Latin America North America Africa Middle East Global Average Europe Asia Pacifc
Mobile Broadband tariffs (€/GB)
Source: Quantum Web
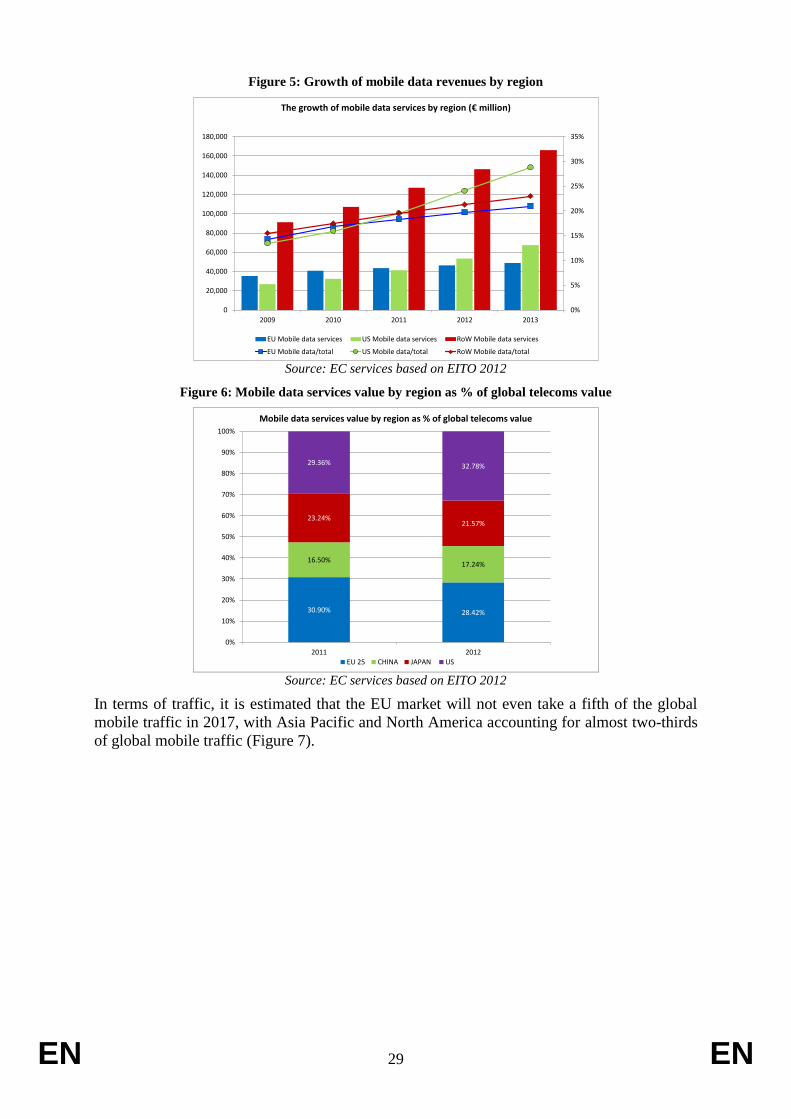
Compared to other regions, the EU market is lagging behind both in terms of mobile
broadband revenue growth as well as with regards to the overall size of the market (Figure 5).
According to some estimates11
, the average U.S. mobile subscriber used 450 MB per month in
the first quarter of 2012, and this figure could have increased up to 750 MB per month at the
end of the year. This compares for instance with an average 250 MB12
per month in the UK. It
is true though that mobile data consumption in the EU is very much determined by the
dominance of limited data plans, and susbscribers to operators with unlimited or generous
data plans tend to show comsumption patterns similar to the US. The relative size of the EU
mobile market shrank in 2012 compared to the US or China (Figure 6).
11
Nielsen, July 2012 12
Ofcom's Infrastructure Report - 2012 Update. http://stakeholders.ofcom.org.uk/market-data-research/other/telecoms-research/broadband-
speeds/infrastructure-report-2012/
EN 29 EN
Figure 5: Growth of mobile data revenues by region
0%
5%
10%
15%
20%
25%
30%
35%
0
20,000
40,000
60,000
80,000
100,000
120,000
140,000
160,000
180,000
2009 2010 2011 2012 2013
The growth of mobile data services by region (€ million)
EU Mobile data services US Mobile data services RoW Mobile data services
EU Mobile data/total US Mobile data/total RoW Mobile data/total Source: EC services based on EITO 2012
Figure 6: Mobile data services value by region as % of global telecoms value
30.90% 28.42%
16.50%17.24%
23.24%21.57%
29.36% 32.78%
0%
10%
20%
30%
40%
50%
60%
70%
80%
90%
100%
2011 2012
Mobile data services value by region as % of global telecoms value
EU 25 CHINA JAPAN US
Source: EC services based on EITO 2012
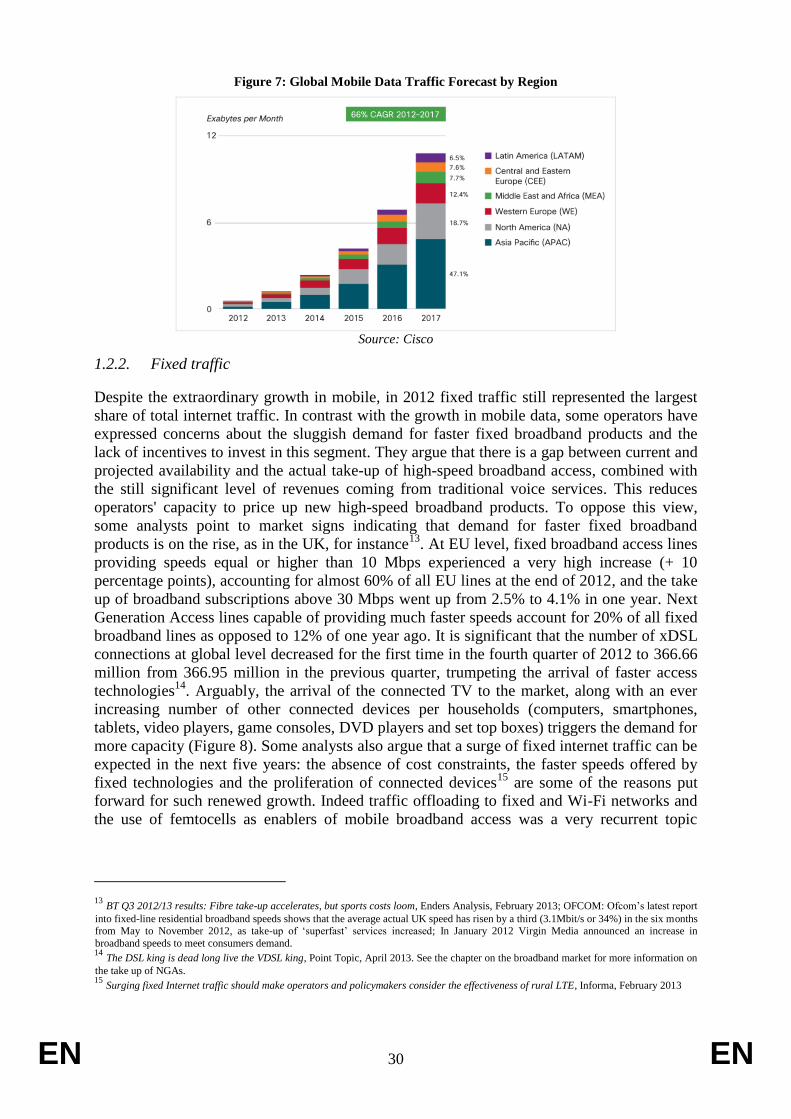
In terms of traffic, it is estimated that the EU market will not even take a fifth of the global
mobile traffic in 2017, with Asia Pacific and North America accounting for almost two-thirds
of global mobile traffic (Figure 7).
EN 30 EN
Figure 7: Global Mobile Data Traffic Forecast by Region
Source: Cisco
1.2.2. Fixed traffic
Despite the extraordinary growth in mobile, in 2012 fixed traffic still represented the largest
share of total internet traffic. In contrast with the growth in mobile data, some operators have
expressed concerns about the sluggish demand for faster fixed broadband products and the
lack of incentives to invest in this segment. They argue that there is a gap between current and
projected availability and the actual take-up of high-speed broadband access, combined with
the still significant level of revenues coming from traditional voice services. This reduces
operators' capacity to price up new high-speed broadband products. To oppose this view,
some analysts point to market signs indicating that demand for faster fixed broadband
products is on the rise, as in the UK, for instance13
. At EU level, fixed broadband access lines
providing speeds equal or higher than 10 Mbps experienced a very high increase (+ 10
percentage points), accounting for almost 60% of all EU lines at the end of 2012, and the take
up of broadband subscriptions above 30 Mbps went up from 2.5% to 4.1% in one year. Next
Generation Access lines capable of providing much faster speeds account for 20% of all fixed
broadband lines as opposed to 12% of one year ago. It is significant that the number of xDSL
connections at global level decreased for the first time in the fourth quarter of 2012 to 366.66
million from 366.95 million in the previous quarter, trumpeting the arrival of faster access
technologies14
. Arguably, the arrival of the connected TV to the market, along with an ever
increasing number of other connected devices per households (computers, smartphones,
tablets, video players, game consoles, DVD players and set top boxes) triggers the demand for
more capacity (Figure 8). Some analysts also argue that a surge of fixed internet traffic can be
expected in the next five years: the absence of cost constraints, the faster speeds offered by
fixed technologies and the proliferation of connected devices15
are some of the reasons put
forward for such renewed growth. Indeed traffic offloading to fixed and Wi-Fi networks and
the use of femtocells as enablers of mobile broadband access was a very recurrent topic
13
BT Q3 2012/13 results: Fibre take-up accelerates, but sports costs loom, Enders Analysis, February 2013; OFCOM: Ofcom’s latest report
into fixed-line residential broadband speeds shows that the average actual UK speed has risen by a third (3.1Mbit/s or 34%) in the six months from May to November 2012, as take-up of ‘superfast’ services increased; In January 2012 Virgin Media announced an increase in
broadband speeds to meet consumers demand. 14
The DSL king is dead long live the VDSL king, Point Topic, April 2013. See the chapter on the broadband market for more information on
the take up of NGAs. 15
Surging fixed Internet traffic should make operators and policymakers consider the effectiveness of rural LTE, Informa, February 2013

EN 31 EN
throughout 201216
; 33% of total mobile data traffic was offloaded in 2012 and this figure is
projected to increase to 46% in 201717
. The deployment of femtocell units at global level is
expected to multiply by 20 times between 2011 and 201618
.
Figure 8: Connected devices by type in Western Europe
Source: ScreenDigest
1.2.3. The platform battle
The blurring of the boundaries between three market segments that were once very well
delimitated (internet service providers; broadcasters and providers of online content
and/services; manufacturers of consumer electronics and IT components19) has seriously
affected telecom operators. Revenues in the global IT industry (manufacturers of servers, PCs,
handsets and tablets, software, IT services) were estimated to have increased by 1.2% in 2012,
although the actual figure could change depending on the performance of some economies.
New market actors are providing communications, content and value added services on top of
the communications channels provided by network operators. While the provision of such
services benefits telecom operators as it stimulates network effects, thereby increasing the
value of being connected and driving demand by consumers for further and better
connectivity, it also erodes the main source of revenues of network operators. The traditional
voice service, which still contributes a quarter of overall telecommunications revenues, is
fading away very quickly, replaced by voice applications provided by the OTTs (Skype,
GTalk or even Facebook voicemails). Substitution of SMS text messaging by IP-based
messaging services was another reason for margin erosion in several telecom operators20
, and
this prompted many operators to develop new, more aggressive pricing structures as well as
16
Mobile Data Offload & Onload, Juniper Research, April 2013: The amount of mobile data generated by mobile devices (smartphones,
featurephones and tablets will exceed 90.000 petabytes in 2017, but only 40% of data generated by these devices will travel through mobile
neworks with the largest part of data sent through WIFI networks and small cells. 17
Cisco Visual Networking Index Forecast, February 2013. http://newsroom.cisco.com/release/1135354 18
Informa, Small-cell deployments to be dominated by consumer-driven femtocells, May 2012. 19
Intel, a semiconductor manufacturer, was rumoured to be preparing the launch of a virtual cable TV service and set top box and. Smart Tv
manufacturers also deploy their own Connected TV platforms. 20
Daily OTT messaging traffic has overtaken daily P2P SMS traffic in terms of volume, with an average of 19.1 billion OTT messages sent
per day in 2012, compared with an average of 17.6 billion P2P SMS messages, Informa, OTT messaging traffic will be twice the volume of
P2P SMS traffic by end-2013, April 2013. According to recent estimates, the use of texting applications would have taken away $23 billion
in revenue from carriers as of the end of 2012. (Ovum, http://ovum.com/press_releases/ovum-forecasts-social-messaging-will-cost-telcos-
over-23-billion-in-sms-revenue-in-2012/). Whatsapp has more users than Twitter and the platform handles about 8 billion incoming and 12
billion outgoing messages per day.
EN 32 EN
their own IP messaging products21
. Finally, voice revenues were also affected by reductions in
mobile termination rates in 2012 (in nine EU countries average MTR were slashed by more
than 50%), mobile number portability and, in some countries, by the competitive pressure of
network challengers22
and MVNOs.
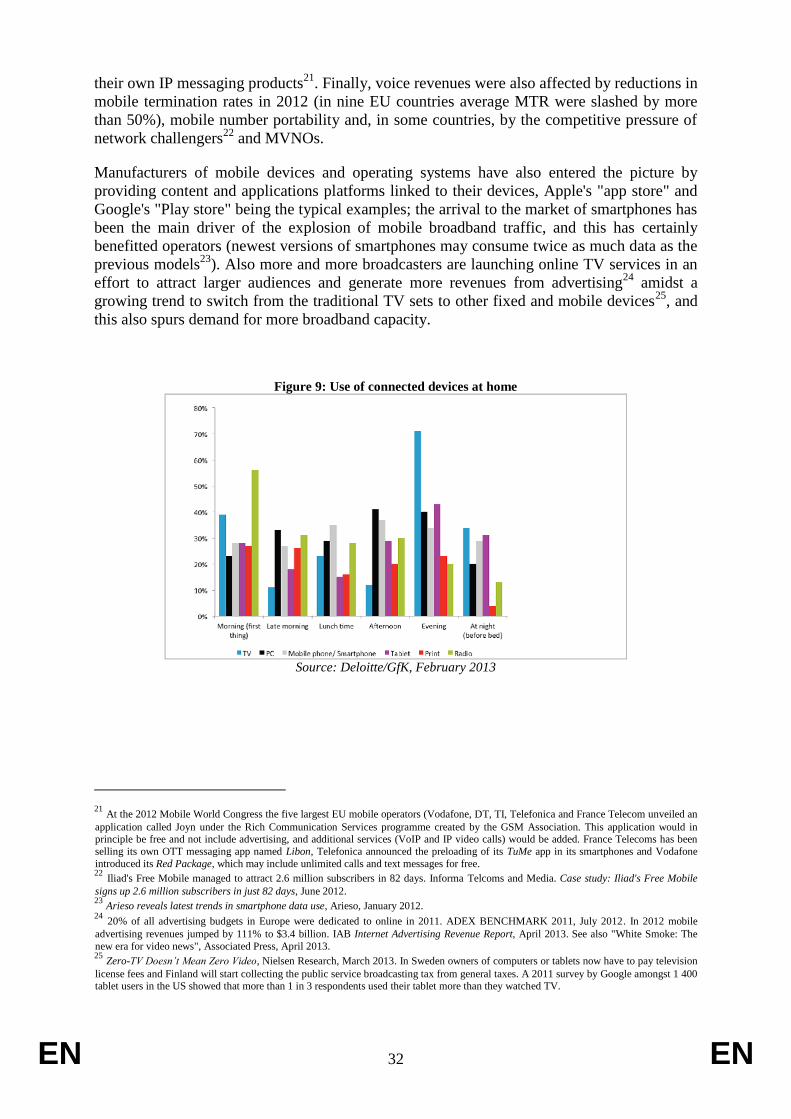
Manufacturers of mobile devices and operating systems have also entered the picture by
providing content and applications platforms linked to their devices, Apple's "app store" and
Google's "Play store" being the typical examples; the arrival to the market of smartphones has
been the main driver of the explosion of mobile broadband traffic, and this has certainly
benefitted operators (newest versions of smartphones may consume twice as much data as the
previous models23
). Also more and more broadcasters are launching online TV services in an
effort to attract larger audiences and generate more revenues from advertising24
amidst a
growing trend to switch from the traditional TV sets to other fixed and mobile devices25
, and
this also spurs demand for more broadband capacity.
Figure 9: Use of connected devices at home
Source: Deloitte/GfK, February 2013
21
At the 2012 Mobile World Congress the five largest EU mobile operators (Vodafone, DT, TI, Telefonica and France Telecom unveiled an
application called Joyn under the Rich Communication Services programme created by the GSM Association. This application would in principle be free and not include advertising, and additional services (VoIP and IP video calls) would be added. France Telecoms has been
selling its own OTT messaging app named Libon, Telefonica announced the preloading of its TuMe app in its smartphones and Vodafone
introduced its Red Package, which may include unlimited calls and text messages for free. 22
Iliad's Free Mobile managed to attract 2.6 million subscribers in 82 days. Informa Telcoms and Media. Case study: Iliad's Free Mobile
signs up 2.6 million subscribers in just 82 days, June 2012. 23
Arieso reveals latest trends in smartphone data use, Arieso, January 2012. 24
20% of all advertising budgets in Europe were dedicated to online in 2011. ADEX BENCHMARK 2011, July 2012. In 2012 mobile
advertising revenues jumped by 111% to $3.4 billion. IAB Internet Advertising Revenue Report, April 2013. See also "White Smoke: The
new era for video news", Associated Press, April 2013. 25
Zero-TV Doesn’t Mean Zero Video, Nielsen Research, March 2013. In Sweden owners of computers or tablets now have to pay television
license fees and Finland will start collecting the public service broadcasting tax from general taxes. A 2011 survey by Google amongst 1 400 tablet users in the US showed that more than 1 in 3 respondents used their tablet more than they watched TV.
EN 33 EN
Here again there is a similar network effect: consumers that have several mobile devices value
online content more than those with just one device26
. But, the rapid adoption of smartphones
and tablets, with their associated content and applications platforms, has had an impact in the
commercial strategies of operators, which did not succeed in making their own content and
services platforms profitable27
. By subsidizing smartphones in an effort to gain new mobile
data subscribers, network operators have indirectly supported the competing online platforms
of the largest manufacturers, driving consumers away from their own content platforms.
There are many different figures on the mobile applications market, the value of which could
have reached 11 billion euros in 2012, with more than 50 billion downloads and 41
applications per user on average, which represents a 32% increase over 2011, when the
average was 32 applications28
. Other sources estimate a smaller market size with around 44
billion downloads for an estimated value of 4.15 billion euros29
. While Android is the
dominant operating system in the world, equipping up to 70 per cent of the smartphone
market, App Store is estimated to be earning on average about 2.6x the app revenue of Google
Play30
. Consumption patterns are also very different from one country to another. In the US,
Apple devices are very popular (35% of the smartphone market) and they generate twice as
much mobile data traffic as Android based devices, which dominate the market with more
than 50% of it31
. The situation in Finland is the reverse: here Android owners consumed 2.07
GB of mobile data – nearly twice the 1.05 GB of iPhone owners. Telecom operators also need
to be aware of these trends in their commercial and pricing strategies.
This battle to gain control of the platform is confirmed by the fact that some device
manufacturers are willing to sell their devices at cost, with the objective of having more and
more consumers buying content (music, films, application and books) from their online
platforms32
,or by the new way to access Microsoft Office 2013, which would be based on a
subscription model that would include some free minutes of VoIP per month. Operators are
therefore understandably willing to support the emergence of alternative ecosystems that
would put pressure on the dominant ones33 and enter into alliances with providers of online
content and services, bundling access to this content in their data plans34
. Mobile payments is
also another market segment where operators are exploring several strategies. In September
26
"There is a 41 percent increase in perceived media value when consumers add a second mobile device to their collection, another 40
percent increase when they add a third, and a 30 percent increase when they add a fourth". Through the Mobile Looking Glass, The Boston
Consulting Group, April, 2013 27
Operator platforms would account for just 6% of content downloads worldwide, with Google Play and Apple’s App Store concentrating
70% of this market. Juniper Research, March 2013. Samsung, the number one manufacturer of Android-based smartphones, has announced
partnerships with several publishers of games, travel tips, books and music and will be providing access to these applications through its hub.
IDC estimates that games on smartphones are expected to outpace hand-held devices by the end of 2013. Worldwide Gaming-Optimized Handheld, Smartphone, and Tablet Gaming 2013–2017 Forecast, IDC, April 2013. 28
Survey Report: Mobile Apps - What Consumers Really Need and Want, Compuware, March 2013, quoting data from Nielsen.
http://www.compuware.com/about/release/747433/mobile-apps-vs-mobile-websites--and-the-winner-is 29
HIS Screen Digest. Downloads for all smartphone and feature phone application stores excluding tablets. 30
App Annie Index, Market Report Q1 2013 – iOS App Store revenue 2.6x that of Google Play, http://blog.appannie.com/app-annie-index-
market-q1-2013/ 31
16th wireless service competition report, FCC, March 2013; Investing Analytics for Piper Jaffray,
http://www.jailbreakauthority.com/apple-ios-devices-generate-double-the-web-traffic-than-android/; Big differences between Finnish Android smartphone and iPhone owners, Alekstra, 32
AmazonMP3, had 22 percent of the market for music downloads in the United States in l2012 up from 7 percent in 2008. Amazon gains
against Apple's iTunes in music downloads, Reuters, April 2013. 33
At the last World Mobile Congress 18 large mobile operators announced their support to Mozilla as a third mobile operating
system/platform. These were América Móvil, China Unicom, Deutsche Telekom, Etisalat, Hutchison Three Group, KDDI, Korea Telecom,
MegaFon, Portugal Telecom, Qtel, SingTel, Smart, Sprint, Telecom Italia Group, Telefónica, Telenor, Telstra, and VimpelCom 34
The latest example of such trend is the agreement between Deutsche Telekom and Evernote under which DT subscribers will get free
access to the $45-a-year premium version of Evernote for one year. Other examples include Deutsche Telekom's deal with Spotify and Orange's deal with Deezer.
EN 34 EN
2012 the European Commission cleared the creation of a mobile commerce joint venture in
the UK between Telefonica, Vodafone and Everything Everywhere.
1.3. Operators' strategies
Telecom operators are trying to find their way through this transition period from legacy
PSTN to IP broadband networks where pricing for core and strategic telecom services proved
to be either flat or in decline. Consequently, European telecom operators are adopting
strategies, both short and long-term, in order to improve their ARPU and secure their
revenues. More specifically, telecom operators are considering some of the following
strategies:
Geographic diversification of their businesses in emerging markets: Domestic revenue
growth for some European carriers was negative in 2012 and some operators were able
to experience some growth in overall revenue thanks only to international operations.
Increasing line rental fees and developing more aggressive bundled products including
services provided by OTTs. Replacing mobile handset subsidies policies with leasing
and financing plans and the introduction of multi-device plans and shared-data
schemes, which enables operators to retain customers while reducing the significantly
high investments in acquiring new handsets. In a few cases, mobile and fixed data
plans could be subject to price increases or the end of unlimited data plans, as in the
UK or more recently in Germany35
.
Creating ad-hoc tailor-made service at wholesale and business segments. Several
studies developed by NRAs analysed business communications market and proved
that incumbent operators, which are the largest telecom operators in Europe in their
domestic markets, had a higher market share in this segment that one would expect
when comparing to the retail market. On top of IT corporate services, there is an
increasing trend for operators to bundle personal cloud storage and data management
in their higher-end service packages. Examples include Vodafone Cloud, Orange's My
Content Online and Deutsche Telekom's Telekom Cloud.
Developing policies to retain existing consumers and attract new ones, which include
diversified portfolios, better understanding of the changing consumer behaviour and
strengthening customer care services, customer profiling and customization of
products using big data. Price differentiation enables users to choose the option which
best fits their needs; both in terms of usage and monthly expenditure. In these ways,
European telecom operators look to diversify their product portfolio and to be able to
build loyalty within their customers; by meeting their specific needs and offering
value-added services - for instance operators may leverage on their billing relationship
with customers36
. Going beyond the telecom market, Magyar Telekom can be
mentioned as an operator that has widely diversified its portfolio selling electricity and
gas to its fixed line subscribers; by end-3Q12, 45% of its triple-play users had also
bought its energy offerings37
.
35
Neue Spielregeln für DSL?, Deutsche Telekom, April 2013 36
Mobile Content Business Models, Juniper Research, March 2013 37
Informa Telecoms and Media. Case study: Magyar Telekom resells energy to diversify revenue portfolio, April 2013
EN 35 EN
A longer term approach refers to the Internet of Things. The number of machine-to-
machine (M2M) device connections worldwide is expected to increase from 124
million in 2012 to 2.1 billion in 202138 and mobile operators are positioning
themselves to compete in this emerging market. According to the mobile industry,
mobile operator data revenues will overtake voice revenues globally by 2018 and
much of the demand in data traffic will be spurred by connected devices and M2M
traffic39
. In 2012 there was a 42% rise in shipments of SIMs designed for M2M
applications, according to the SIM alliance members40
.
1.3.1. Geographic diversification
Several European telecom operators were able to experience growth at group consolidated
basis due to business diversification in emerging markets; the non-EU operations of several
operators gave them some breath in terms of revenues growth and increased their contribution
to the overall group revenues41
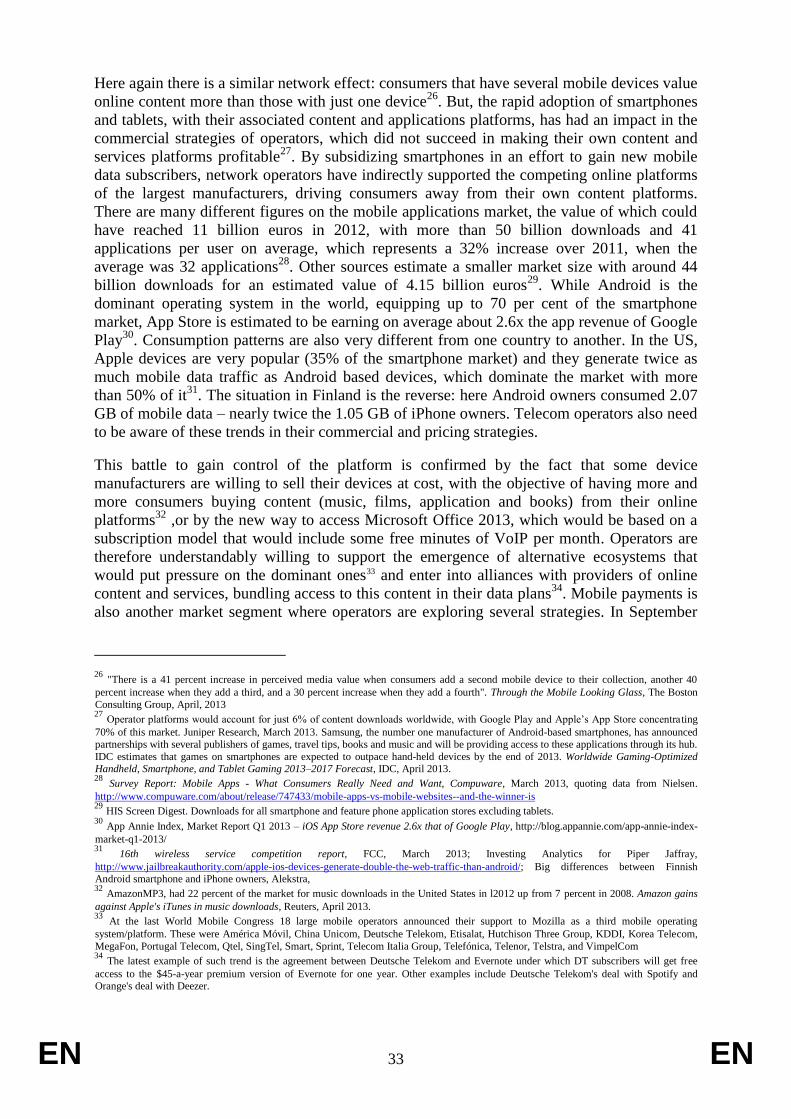
. On average42
, domestic operations accounted for around 41%
of overall revenues, 25% originated in other EU countries and 34% in non-EU operations
(Figure 10). Portugal Telecom, Telenor and Telefonica already source more than half of their
revenues from non-EU countries and Vodafone, DT, Telecom Italia, Tele2 and BT also obtain
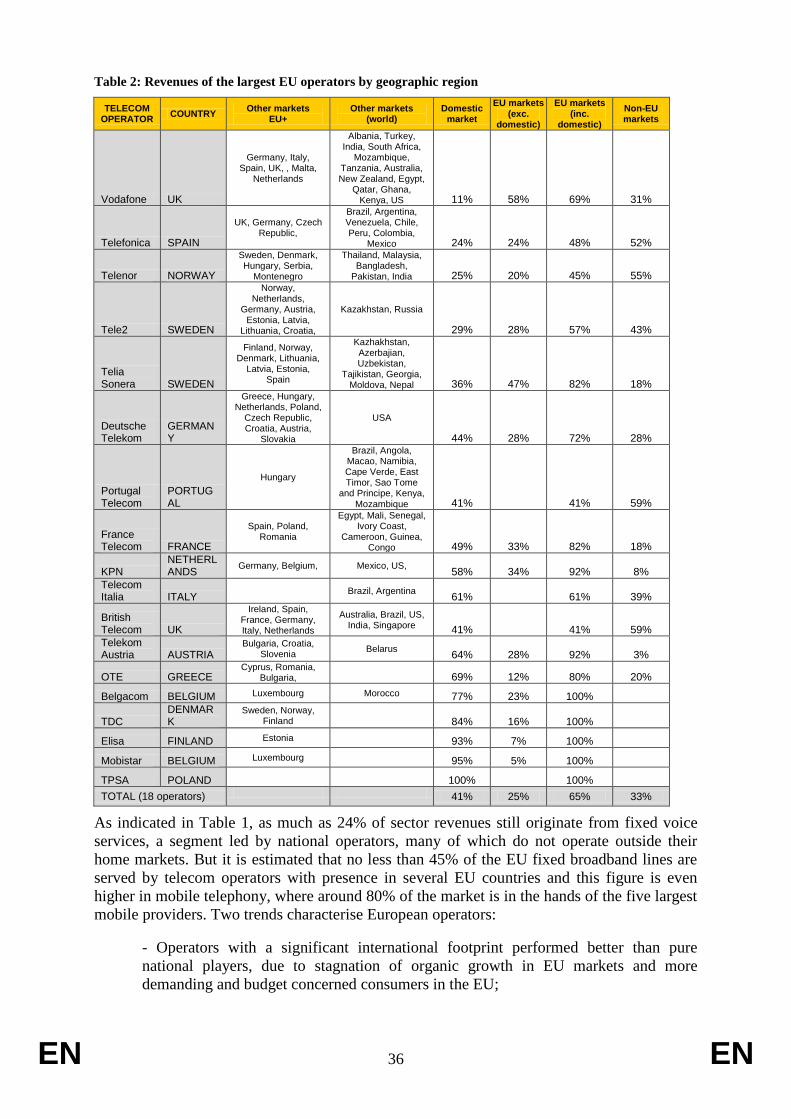
between 30 and 40% of their revenues from non EU markets (Table 2).
Figure 10: Revenues of the largest EU operators by geographic region
41%
25%
34%
Revenues of the largest EU operators by geographic region
Domestic market EU markets (exc. Domestic) Non-EU markets
Source: EC services based on a sample of eighteen European operators
38
Analysys Mason. 39
GSMA-Connected Living, http://www.gsma.com/connectedliving/. In March 2013 ComReg, the Irish regulator, launched a public
consultation to investigate the possibility of a more targeted long term numbering resource for the exclusive use of M2M applications and
services to satisfy the demand for numbers arising from the emerging M2M services. http://www.comreg.ie/_fileupload/publications/ComReg1333.pdf 40
Global SIM shipments rise 6% due to increased NFC, LTE and M2M demand, Mobile Europe, April 2012 41
"Emerging markets were not that popular after the previous financial crisis in 2008, but under the current crisis, which has its origin in
Europe, the case is different - Asia being beautiful. Telenor sees Asian growth as antidote to Europe's woes, http://uk.reuters.com/article/2012/01/05/telenor-idUKL6E8C53PU20120105 42 Based on a sample of eighteen European operators: Telefonica, Deutsche Telekom, Telecom Italia, Vodafone, France Telecom, KPN,
Mobistar, TPSA, Tele2,Telia Sonera, Telekom Austria, Belgacom, TDC, Portugal Telecom, Elisa, BT, OTE and Telenor. Third quarter 2012- Third quarter 2011 data analysis.
EN 36 EN
Table 2: Revenues of the largest EU operators by geographic region
TELECOM OPERATOR
COUNTRY Other markets
EU+ Other markets
(world) Domestic
market
EU markets (exc.
domestic)
EU markets (inc.
domestic)
Non-EU markets
Vodafone UK
Germany, Italy, Spain, UK, , Malta,
Netherlands
Albania, Turkey, India, South Africa,
Mozambique, Tanzania, Australia, New Zealand, Egypt,
Qatar, Ghana, Kenya, US 11% 58% 69% 31%
Telefonica SPAIN
UK, Germany, Czech Republic,
Brazil, Argentina, Venezuela, Chile, Peru, Colombia,
Mexico 24% 24% 48% 52%
Telenor NORWAY
Sweden, Denmark, Hungary, Serbia,
Montenegro
Thailand, Malaysia, Bangladesh,
Pakistan, India 25% 20% 45% 55%
Tele2 SWEDEN
Norway, Netherlands,
Germany, Austria, Estonia, Latvia,
Lithuania, Croatia,
Kazakhstan, Russia
29% 28% 57% 43%
Telia Sonera SWEDEN
Finland, Norway, Denmark, Lithuania,
Latvia, Estonia, Spain
Kazhakhstan, Azerbajian, Uzbekistan,
Tajikistan, Georgia, Moldova, Nepal 36% 47% 82% 18%
Deutsche Telekom
GERMANY
Greece, Hungary, Netherlands, Poland,
Czech Republic, Croatia, Austria,
Slovakia
USA
44% 28% 72% 28%
Portugal Telecom
PORTUGAL
Hungary
Brazil, Angola, Macao, Namibia, Cape Verde, East Timor, Sao Tome
and Principe, Kenya, Mozambique 41% 41% 59%
France Telecom FRANCE
Spain, Poland, Romania
Egypt, Mali, Senegal, Ivory Coast,
Cameroon, Guinea, Congo 49% 33% 82% 18%
KPN NETHERLANDS
Germany, Belgium, Mexico, US, 58% 34% 92% 8%
Telecom Italia ITALY
Brazil, Argentina 61% 61% 39%
British Telecom UK
Ireland, Spain, France, Germany, Italy, Netherlands
Australia, Brazil, US, India, Singapore 41% 41% 59%
Telekom Austria AUSTRIA
Bulgaria, Croatia, Slovenia
Belarus 64% 28% 92% 3%
OTE GREECE Cyprus, Romania,
Bulgaria, 69% 12% 80% 20%
Belgacom BELGIUM Luxembourg Morocco 77% 23% 100%
TDC DENMARK
Sweden, Norway, Finland
84% 16% 100%
Elisa FINLAND Estonia 93% 7% 100%
Mobistar BELGIUM Luxembourg 95% 5% 100%
TPSA POLAND 100% 100%
TOTAL (18 operators) 41% 25% 65% 33%
As indicated in Table 1, as much as 24% of sector revenues still originate from fixed voice
services, a segment led by national operators, many of which do not operate outside their
home markets. But it is estimated that no less than 45% of the EU fixed broadband lines are
served by telecom operators with presence in several EU countries and this figure is even
higher in mobile telephony, where around 80% of the market is in the hands of the five largest
mobile providers. Two trends characterise European operators:
- Operators with a significant international footprint performed better than pure
national players, due to stagnation of organic growth in EU markets and more
demanding and budget concerned consumers in the EU;

EN 37 EN
- This also had an impact on investment trends, with operators active in Eurasia or
Latin America having a slightly higher CAPEX percentage than EU only operators.
1.3.2. More aggressive bundled products
Major operators now value retaining current customers as much as gaining new ones. Thus,
they have created strategies based on different types of bundled offers in order to include data
services, SMS and voice minutes43
. The popularity of these products is increasing. By
contrast, broadband standalone services are fading away, representing around 34 percent of all
offerings in 2013, down from 64 percent six years ago.
There exist many different types of bundled services, which can include either a combination
of fixed-line telephony and broadband access or fixed broadband access and television
(double play), products combining fixed voice, broadband access and television (triple-play)
and more recently quadruple play products, which offer mobile voice and data on top of triple
play offerings. Some EU operators added quadruple play products to their portfolio with the
aim to provide customers all telecom needed package in a row and reduce churn ratio. The
number of quad play services doubled between 2011 and 201244
. There are still many
differences in the retail offerings across EU Member States, and the market in France, for
instance, is very different in this respect compared to Germany45.
Bundles may reduce churn but have to be carefully designed so as to minimise loses in
revenues. The configuration of the bundled products and their price depend very much on the
kind of technologies most used by consumers and operators need to adapt their offer profile to
better meet the requirements of consumers. A recent Commission market study46
revealed that
consumer survey respondents who had switched their internet provider in the last three years
were more likely to have had standalone access with their previous connection than with their
current connection (22% compared with 12%). This was mainly the result of an increase in
packages including both fixed telephony and TV (with or without other services such as
mobile telephony or mobile Internet).
1.4. European telecom operators investment overview
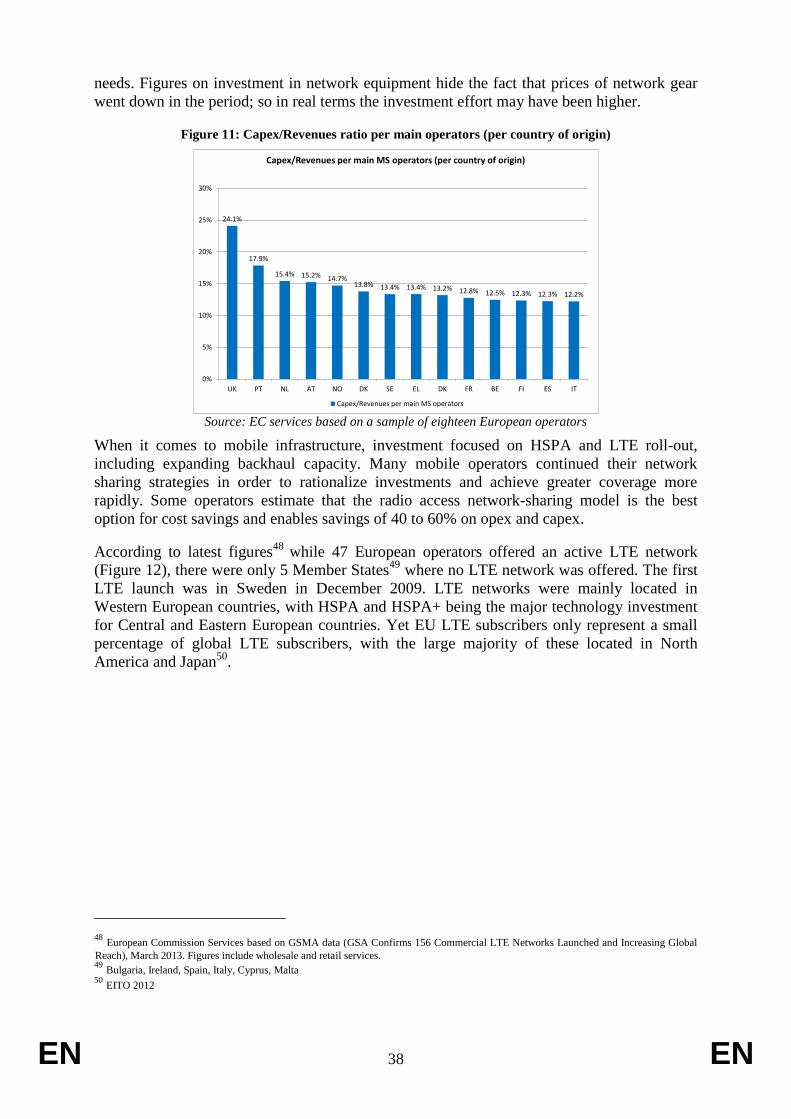
Capital expenditure (CAPEX) in 2012 was estimated at around 45 billion in 2012,
representing on average 15% of group consolidated figures for the major European telecom
operators, up from the 14% of total revenues in 201147
(Figure 11). This ratio was slightly
lower for operators with a smaller size, which could be due to the fact that some of these
operators have already supported and developed before and are now in a mature phase of their
business development. Larger European operators with overseas activities had higher
investment needs driven by the demand from these markets, including spectrum investment
43
Spanish fixed line telecoms providers are gaining a bigger share of the country's shrinking mobile market as cash-strapped consumers
switch to bundled packages offering mobile, internet and other services (...) In the UK cable-based Virgin Media, which has focused on
selling mobile as part of bundled packages, has a contract customer base of 1.7 million compared with under 500,000 clients five years ago
and is Britain's no.5 player with 3 million mobile clients overall. Reuters, Spain's Jazztel, ONO make headway in shifting mobile market, April 2013 44
Study on Broadband Internet Access Cost, Van Dijk, September 2012 45
Vodafone, KDG and quad play in Europe, Enders Analysis, March 2013. 46
Consumer market study on the functioning of the market for internet access and provision from a consumer perspective (or else the 2012
ISP study, to be published in July 2013) 47
Source: Commission services based on a sample of eighteen European operators – ETNO - ECTA
EN 38 EN
needs. Figures on investment in network equipment hide the fact that prices of network gear
went down in the period; so in real terms the investment effort may have been higher.
Figure 11: Capex/Revenues ratio per main operators (per country of origin)
24.1%
17.9%
15.4% 15.2% 14.7%13.8% 13.4% 13.4% 13.2% 12.8% 12.5% 12.3% 12.3% 12.2%
0%
5%
10%
15%
20%
25%
30%
UK PT NL AT NO DK SE EL DK FR BE FI ES IT
Capex/Revenues per main MS operators (per country of origin)
Capex/Revenues per main MS operators
Source: EC services based on a sample of eighteen European operators
When it comes to mobile infrastructure, investment focused on HSPA and LTE roll-out,
including expanding backhaul capacity. Many mobile operators continued their network
sharing strategies in order to rationalize investments and achieve greater coverage more
rapidly. Some operators estimate that the radio access network-sharing model is the best
option for cost savings and enables savings of 40 to 60% on opex and capex.
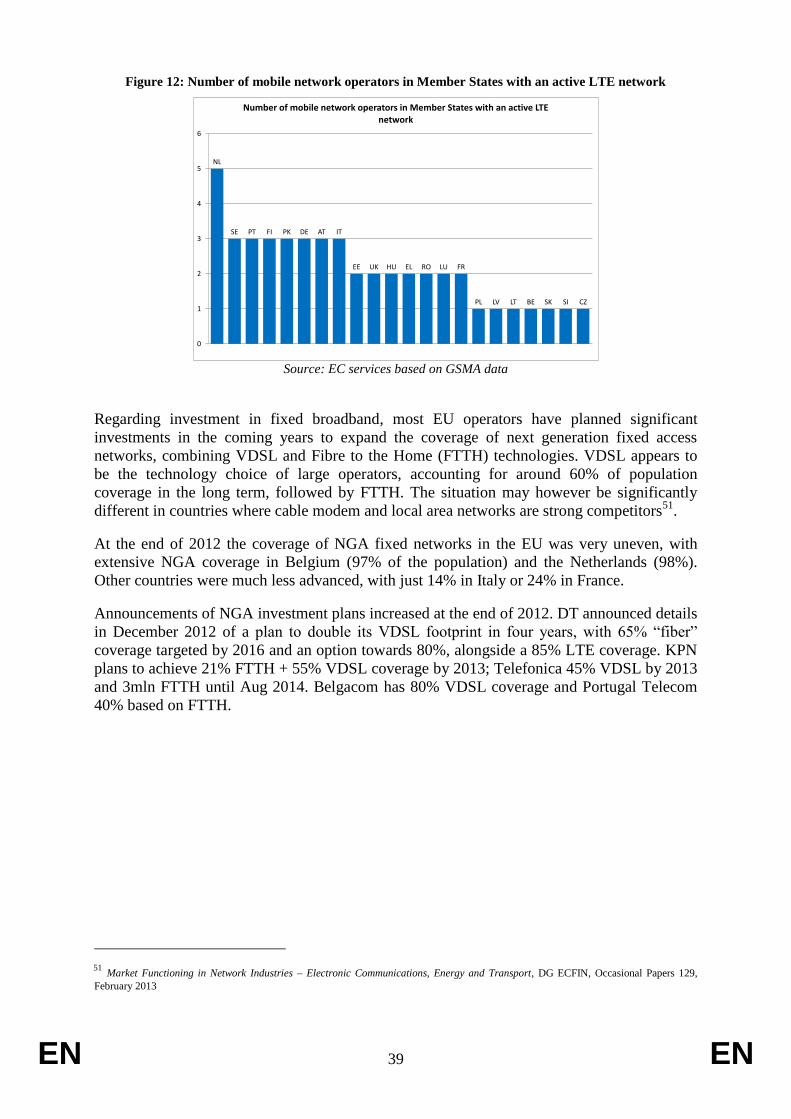
According to latest figures48
while 47 European operators offered an active LTE network
(Figure 12), there were only 5 Member States49
where no LTE network was offered. The first
LTE launch was in Sweden in December 2009. LTE networks were mainly located in
Western European countries, with HSPA and HSPA+ being the major technology investment
for Central and Eastern European countries. Yet EU LTE subscribers only represent a small
percentage of global LTE subscribers, with the large majority of these located in North
America and Japan50
.
48
European Commission Services based on GSMA data (GSA Confirms 156 Commercial LTE Networks Launched and Increasing Global
Reach), March 2013. Figures include wholesale and retail services. 49
Bulgaria, Ireland, Spain, Italy, Cyprus, Malta 50
EITO 2012
EN 39 EN
Figure 12: Number of mobile network operators in Member States with an active LTE network
NL
SE PT FI PK DE AT IT
EE UK HU EL RO LU FR
PL LV LT BE SK SI CZ
0
1
2
3
4
5
6
Number of mobile network operators in Member States with an active LTE network
Source: EC services based on GSMA data
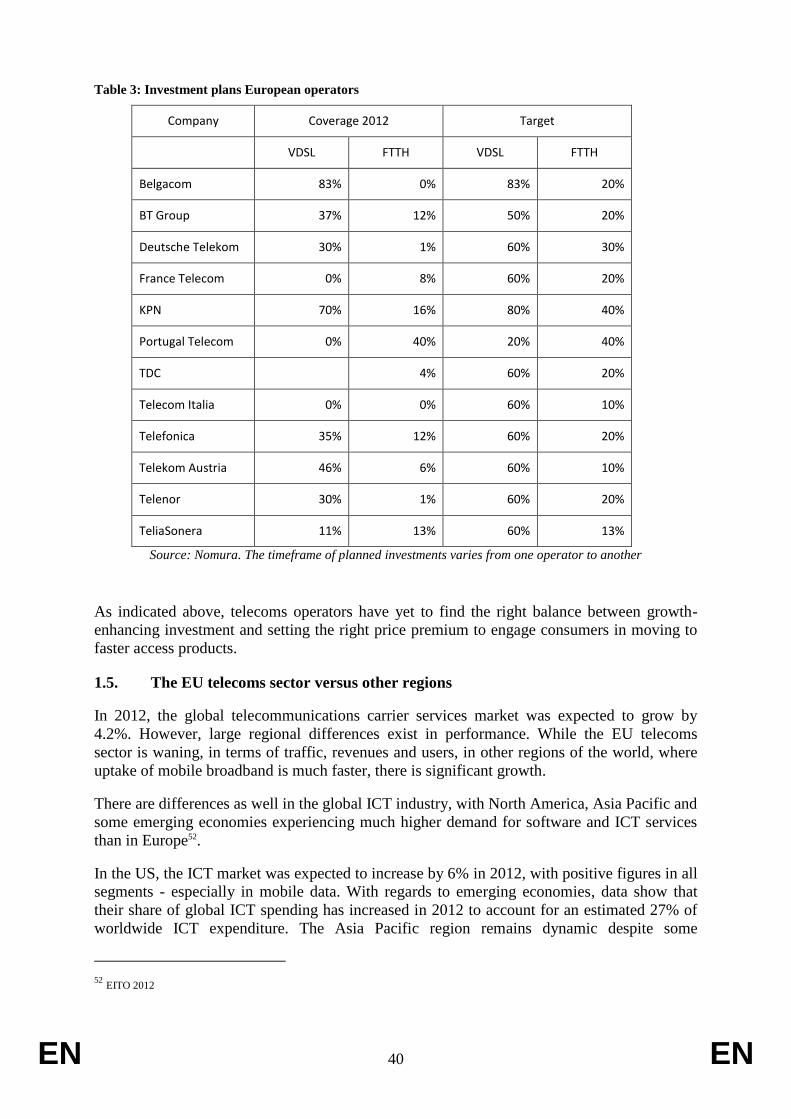
Regarding investment in fixed broadband, most EU operators have planned significant
investments in the coming years to expand the coverage of next generation fixed access
networks, combining VDSL and Fibre to the Home (FTTH) technologies. VDSL appears to
be the technology choice of large operators, accounting for around 60% of population
coverage in the long term, followed by FTTH. The situation may however be significantly
different in countries where cable modem and local area networks are strong competitors51
.
At the end of 2012 the coverage of NGA fixed networks in the EU was very uneven, with
extensive NGA coverage in Belgium (97% of the population) and the Netherlands (98%).
Other countries were much less advanced, with just 14% in Italy or 24% in France.
Announcements of NGA investment plans increased at the end of 2012. DT announced details
in December 2012 of a plan to double its VDSL footprint in four years, with 65% “fiber”
coverage targeted by 2016 and an option towards 80%, alongside a 85% LTE coverage. KPN
plans to achieve 21% FTTH + 55% VDSL coverage by 2013; Telefonica 45% VDSL by 2013
and 3mln FTTH until Aug 2014. Belgacom has 80% VDSL coverage and Portugal Telecom
40% based on FTTH.
51
Market Functioning in Network Industries – Electronic Communications, Energy and Transport, DG ECFIN, Occasional Papers 129,
February 2013
EN 40 EN
Table 3: Investment plans European operators
Company Coverage 2012 Target
VDSL FTTH VDSL FTTH
Belgacom 83% 0% 83% 20%
BT Group 37% 12% 50% 20%
Deutsche Telekom 30% 1% 60% 30%
France Telecom 0% 8% 60% 20%
KPN 70% 16% 80% 40%
Portugal Telecom 0% 40% 20% 40%
TDC 4% 60% 20%
Telecom Italia 0% 0% 60% 10%
Telefonica 35% 12% 60% 20%
Telekom Austria 46% 6% 60% 10%
Telenor 30% 1% 60% 20%
TeliaSonera 11% 13% 60% 13%
Source: Nomura. The timeframe of planned investments varies from one operator to another
As indicated above, telecoms operators have yet to find the right balance between growth-
enhancing investment and setting the right price premium to engage consumers in moving to
faster access products.
1.5. The EU telecoms sector versus other regions
In 2012, the global telecommunications carrier services market was expected to grow by
4.2%. However, large regional differences exist in performance. While the EU telecoms
sector is waning, in terms of traffic, revenues and users, in other regions of the world, where
uptake of mobile broadband is much faster, there is significant growth.
There are differences as well in the global ICT industry, with North America, Asia Pacific and
some emerging economies experiencing much higher demand for software and ICT services
than in Europe52.
In the US, the ICT market was expected to increase by 6% in 2012, with positive figures in all
segments - especially in mobile data. With regards to emerging economies, data show that
their share of global ICT spending has increased in 2012 to account for an estimated 27% of
worldwide ICT expenditure. The Asia Pacific region remains dynamic despite some
52
EITO 2012
EN 41 EN
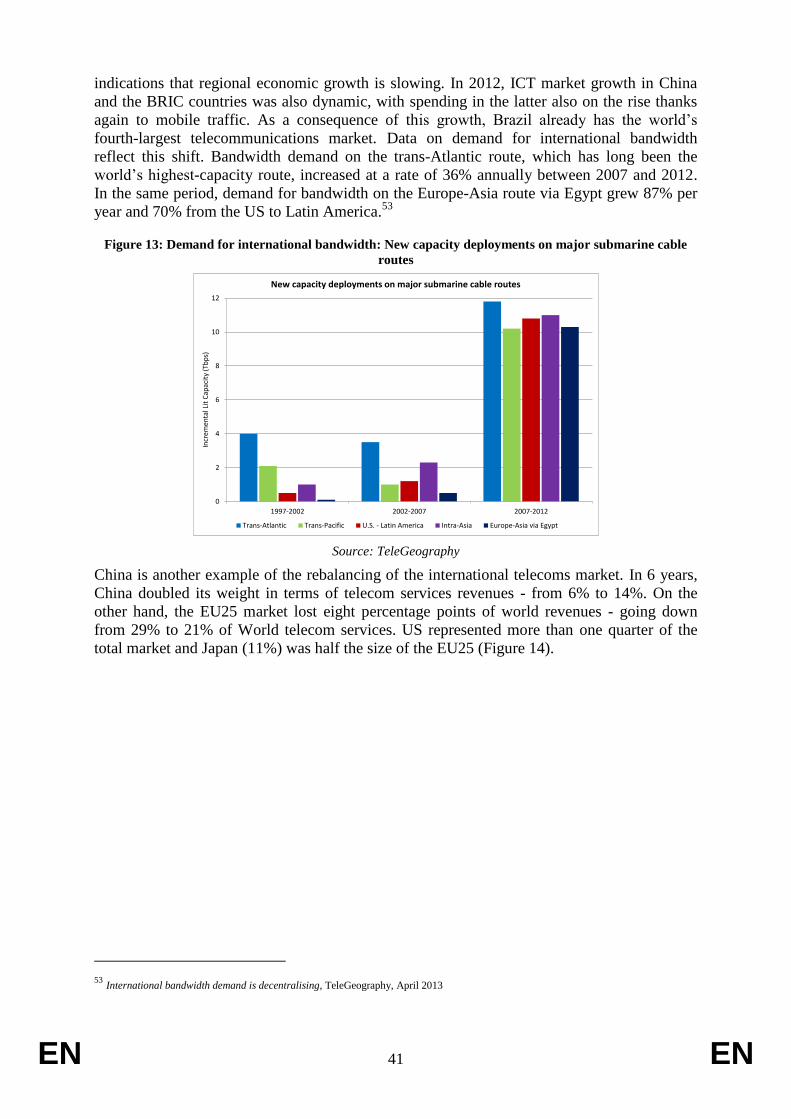
indications that regional economic growth is slowing. In 2012, ICT market growth in China
and the BRIC countries was also dynamic, with spending in the latter also on the rise thanks
again to mobile traffic. As a consequence of this growth, Brazil already has the world’s
fourth-largest telecommunications market. Data on demand for international bandwidth
reflect this shift. Bandwidth demand on the trans-Atlantic route, which has long been the
world’s highest-capacity route, increased at a rate of 36% annually between 2007 and 2012.
In the same period, demand for bandwidth on the Europe-Asia route via Egypt grew 87% per
year and 70% from the US to Latin America.53
Figure 13: Demand for international bandwidth: New capacity deployments on major submarine cable
routes
0
2
4
6
8
10
12
1997-2002 2002-2007 2007-2012
Incr
emen
tal L
it C
apac
ity
(Tb
ps)
New capacity deployments on major submarine cable routes
Trans-Atlantic Trans-Pacific U.S. - Latin America Intra-Asia Europe-Asia via Egypt
Source: TeleGeography
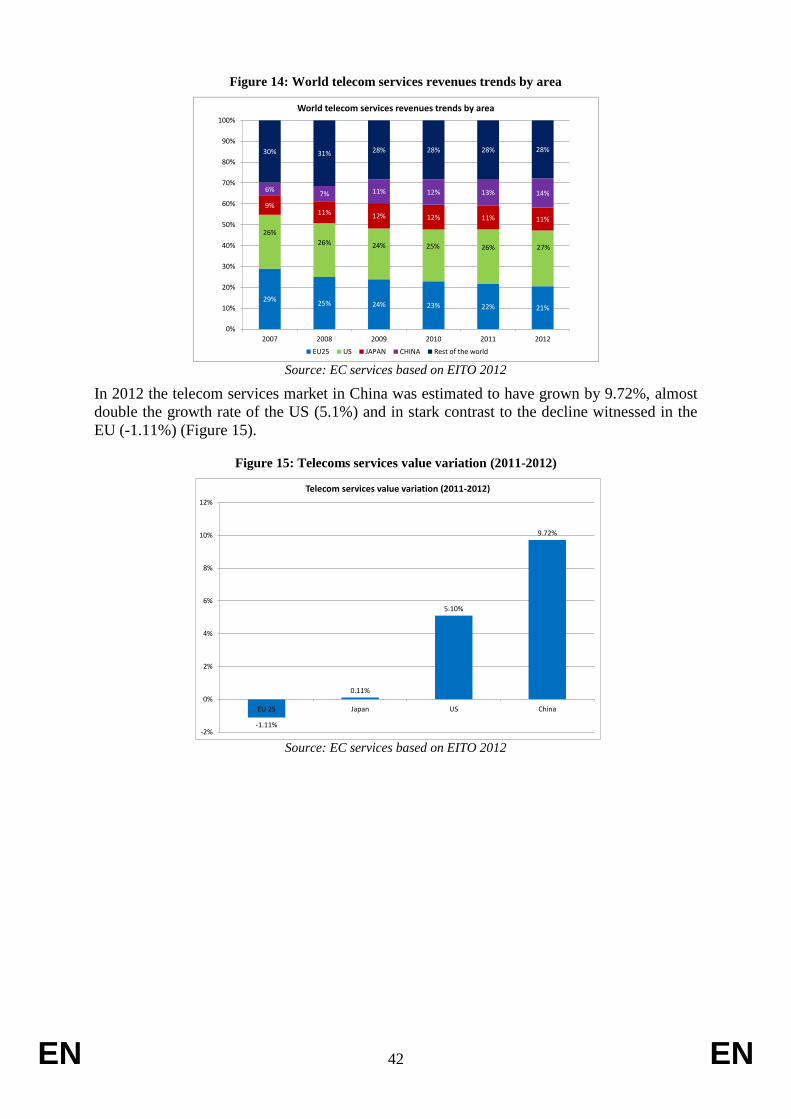
China is another example of the rebalancing of the international telecoms market. In 6 years,
China doubled its weight in terms of telecom services revenues - from 6% to 14%. On the
other hand, the EU25 market lost eight percentage points of world revenues - going down
from 29% to 21% of World telecom services. US represented more than one quarter of the
total market and Japan (11%) was half the size of the EU25 (Figure 14).
53
International bandwidth demand is decentralising, TeleGeography, April 2013
EN 42 EN
Figure 14: World telecom services revenues trends by area
29%25% 24% 23% 22% 21%
26%
26% 24% 25% 26% 27%
9%11% 12% 12% 11% 11%
6%7% 11% 12% 13% 14%
30% 31% 28% 28% 28% 28%
0%
10%
20%
30%
40%
50%
60%
70%
80%
90%
100%
2007 2008 2009 2010 2011 2012
World telecom services revenues trends by area
EU25 US JAPAN CHINA Rest of the world
Source: EC services based on EITO 2012
In 2012 the telecom services market in China was estimated to have grown by 9.72%, almost
double the growth rate of the US (5.1%) and in stark contrast to the decline witnessed in the
EU (-1.11%) (Figure 15).
Figure 15: Telecoms services value variation (2011-2012)
-1.11%
0.11%
5.10%
9.72%
-2%
0%
2%
4%
6%
8%
10%
12%
EU 25 Japan US China
Telecom services value variation (2011-2012)
Source: EC services based on EITO 2012