Embed Size (px)
Citation preview
Global income inequality: the past two centuries and implications for 21st century
Branko MilanovicBranko Milanovic
Autumn 2011
Email: [email protected]
Based on the books Worlds Apart, 2005 and The Haves and the
Have-Nots, 2010 and other updates
Main points
• Global inequality (between world citizens) is some 70
Gini point today
• This is the result obtained using new (2005) PPPs
• About 9 percent of world population receives one-
half of global income (or consumes ½ of goods and
services); bottom ½ gets 7%.services); bottom ½ gets 7%.
• Global inequality shows no clear trend in the last 20
years although China’s and India’s growth are
globally equalizing
• This is almost certainly the highest level of relative,
and certainly absolute, global inequality at any point
in human history
Main points II
• The composition of global inequality has changed
from being driven by income differences within
countries (“class” differences) to income differences
between countries (“locational”)
• More than ¾ of global inequality due to between
country differencescountry differences
• About 60% of income dispersion “explained” by
country of citizenship
• Is citizenship a rent?
• Migration is the product of globalization and large
between country differences
Global policy in this century
• Reduction in global inequality or citizenship premium
(penalty) can be achieved in three ways:
• Faster growth of poor countries
• Global redistribution (aid)
• Freer migration
• Large global inequality driven primarily by
“circumstances” (citizenship) is ethically
questionable and makes globalization less
sustainable
• Managing migration emerges as a key challenge
1. Global inequalities today:
definitions and overviewdefinitions and overview
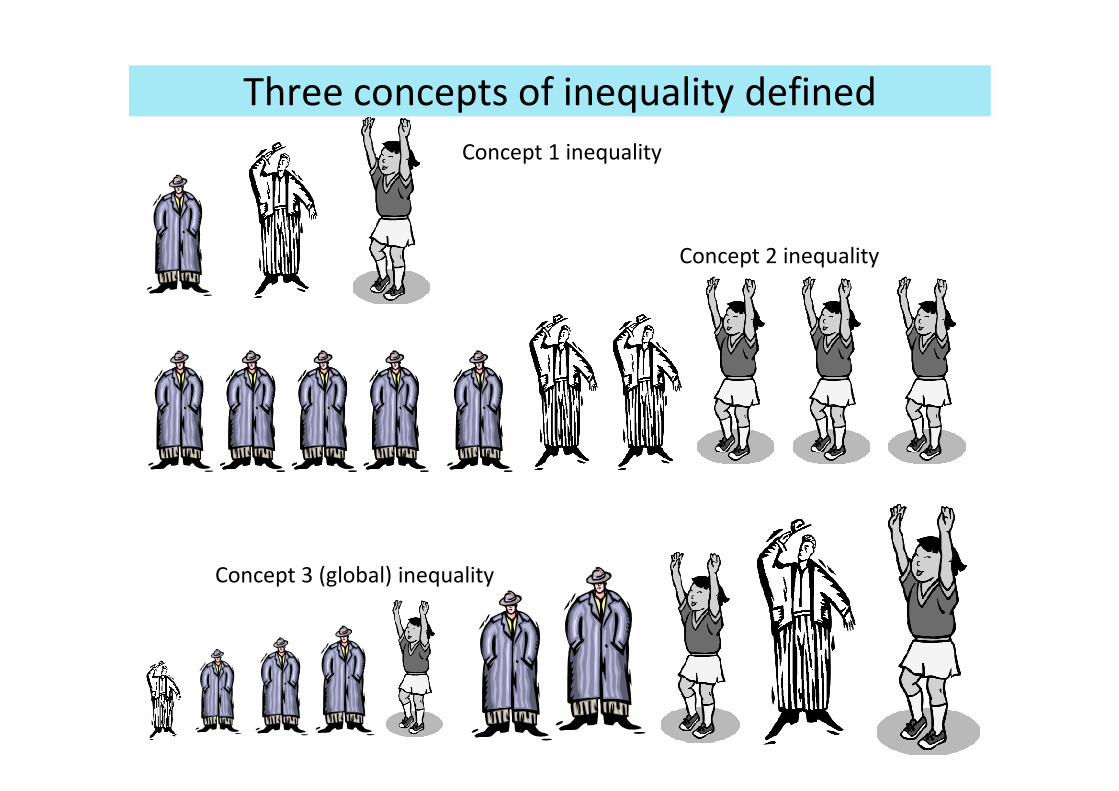
Three concepts of inequality defined
Concept 1 inequality
Concept 2 inequality
Concept 3 (global) inequality
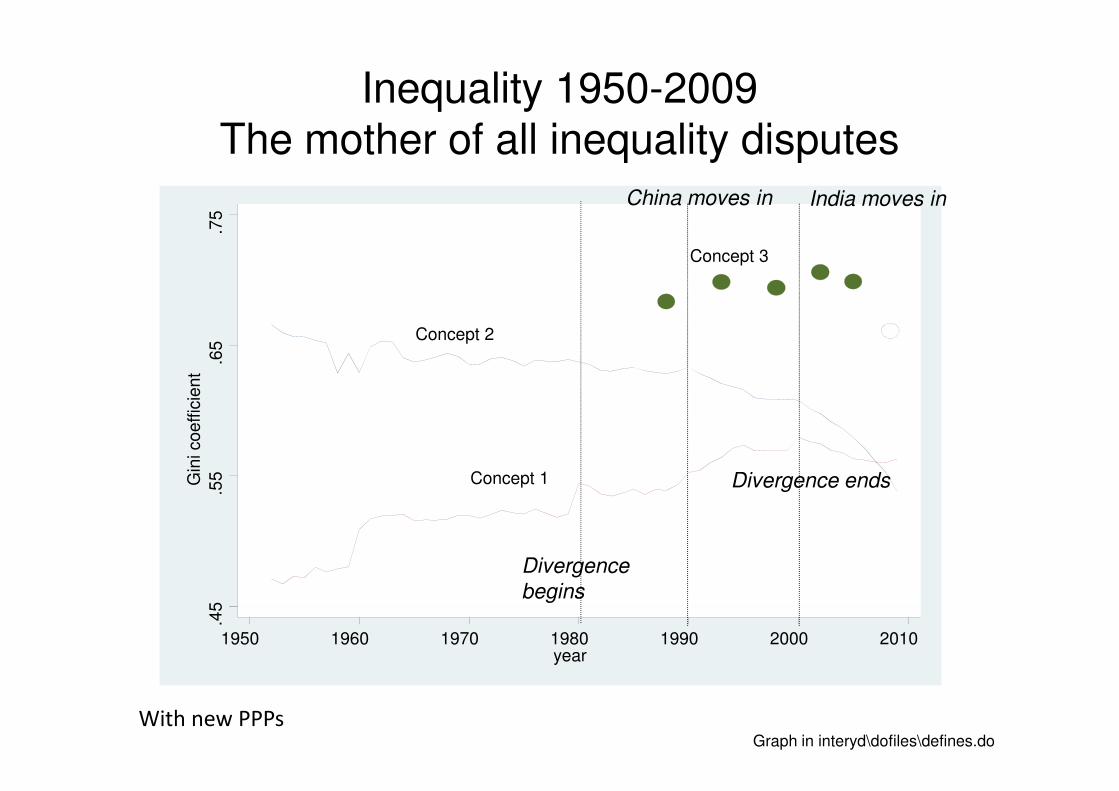
Inequality 1950-2009The mother of all inequality disputes
Concept 2
Concept 3
.65
.75
Gin
i coeffic
ient
China moves in India moves in
With new PPPsGraph in interyd\dofiles\defines.do
Concept 1
.45
.55Gin
i coeffic
ient
1950 1960 1970 1980 1990 2000 2010year
Divergence
begins
Divergence ends
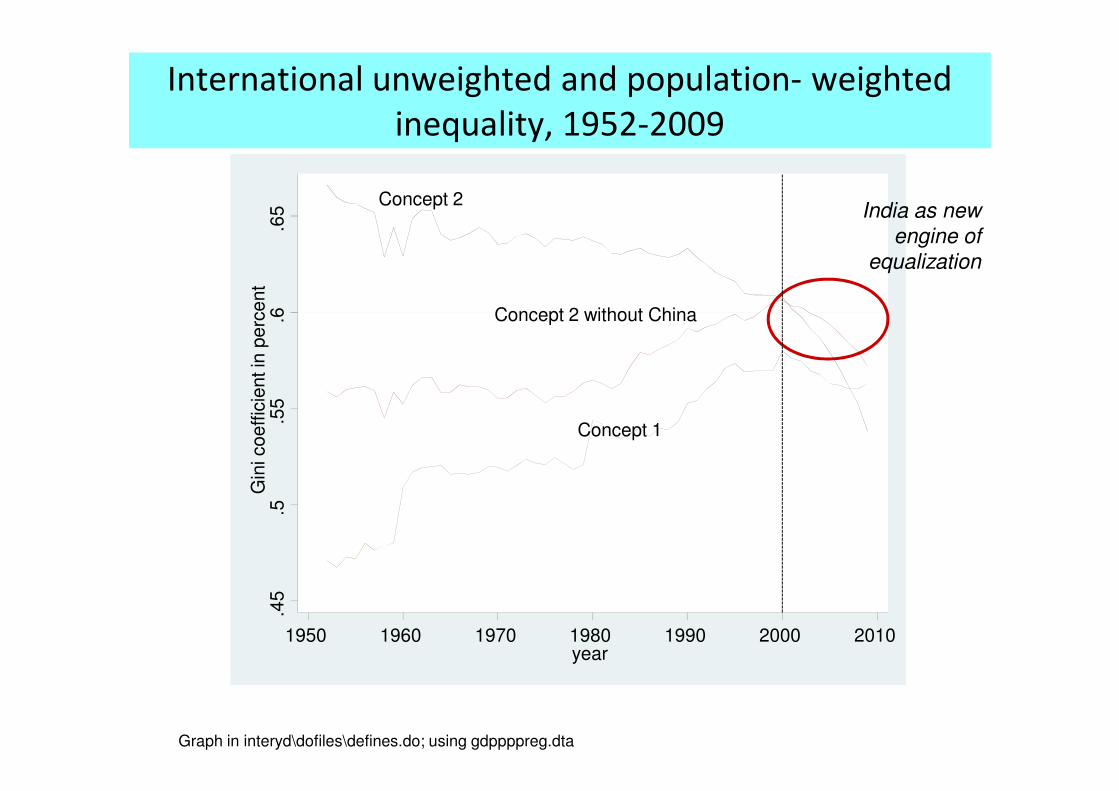
International unweighted and population- weighted
inequality, 1952-2009
Concept 2
Concept 2 without China.6.6
5G
ini c
oe
ffic
ient in
pe
rce
nt
India as new
engine of
equalization
Graph in interyd\dofiles\defines.do; using gdppppreg.dta
Concept 1
.45
.5.5
5G
ini c
oe
ffic
ient in
pe
rce
nt
1950 1960 1970 1980 1990 2000 2010year
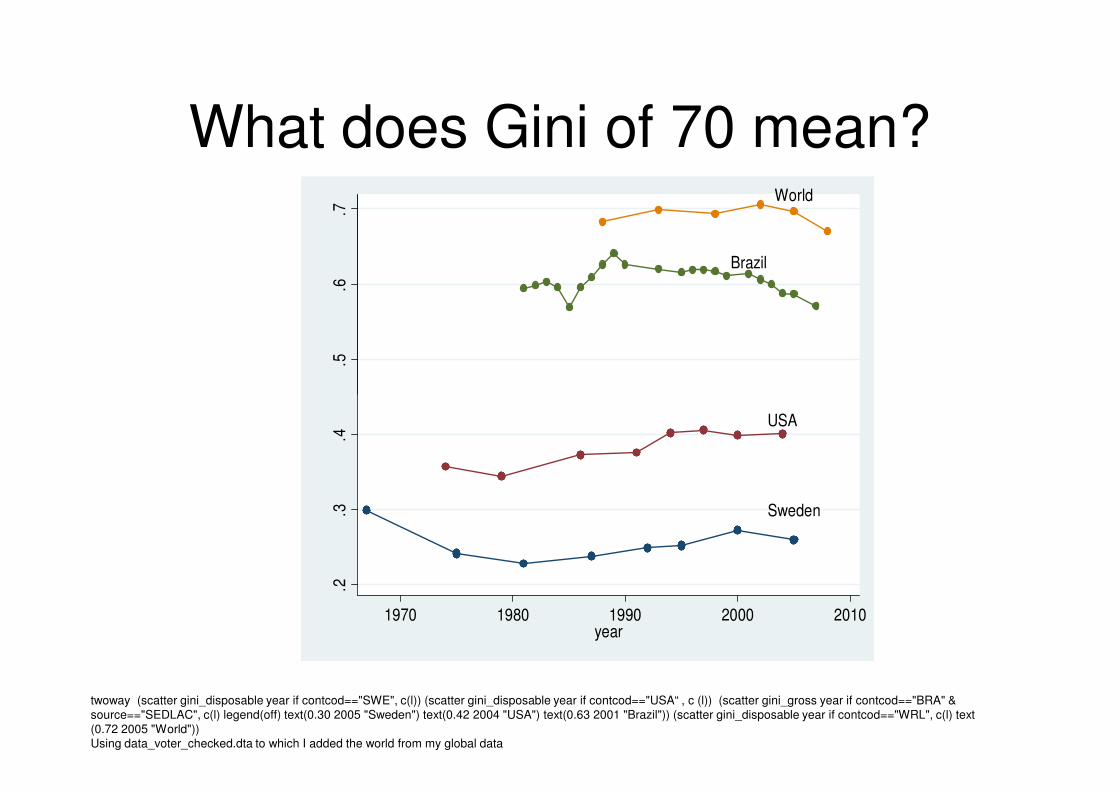
What does Gini of 70 mean?
Brazil
World
.5.6
.7
twoway (scatter gini_disposable year if contcod=="SWE", c(l)) (scatter gini_disposable year if contcod=="USA“ , c (l)) (scatter gini_gross year if contcod=="BRA" & source=="SEDLAC", c(l) legend(off) text(0.30 2005 "Sweden") text(0.42 2004 "USA") text(0.63 2001 "Brazil")) (scatter gini_disposable year if contcod=="WRL", c(l) text(0.72 2005 "World"))Using data_voter_checked.dta to which I added the world from my global data
Sweden
USA
.2.3
.4
1970 1980 1990 2000 2010year
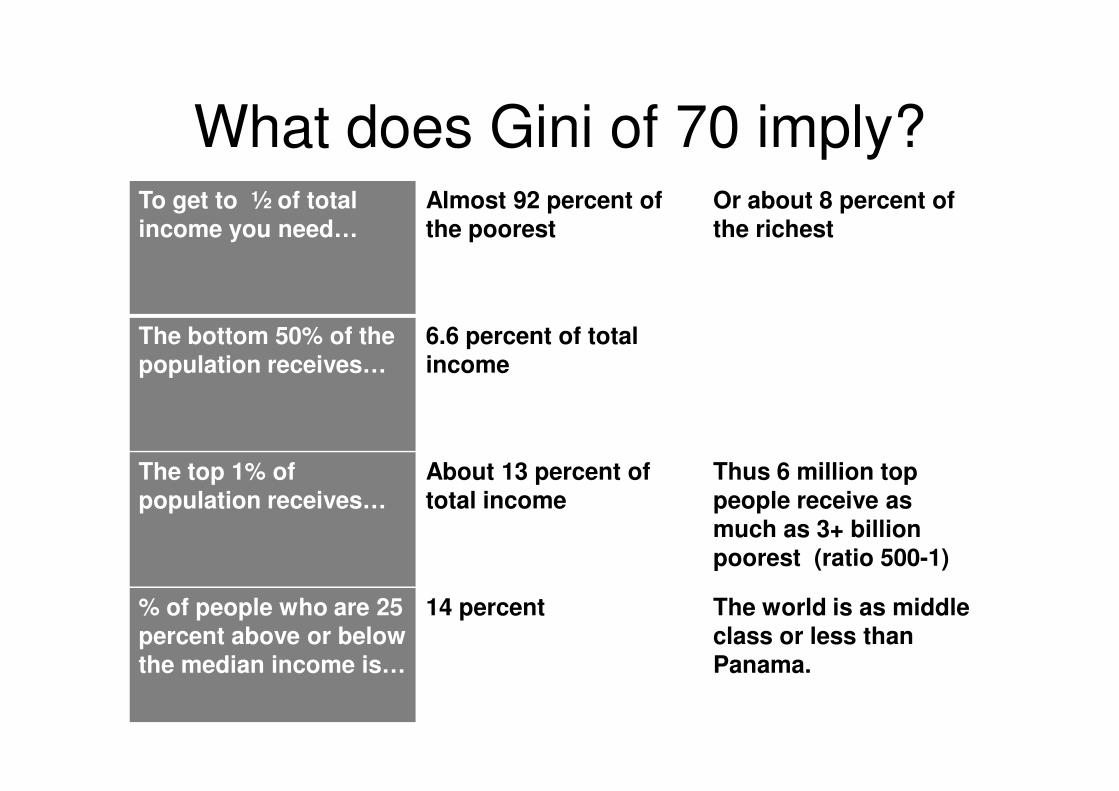
What does Gini of 70 imply?To get to ½ of total income you need…
Almost 92 percent of the poorest
Or about 8 percent of the richest
The bottom 50% of the
population receives…
6.6 percent of total
income
The top 1% of
population receives…
About 13 percent of
total income
Thus 6 million top
people receive as
much as 3+ billion
poorest (ratio 500-1)
% of people who are 25
percent above or below
the median income is…
14 percent The world is as middle
class or less than
Panama.
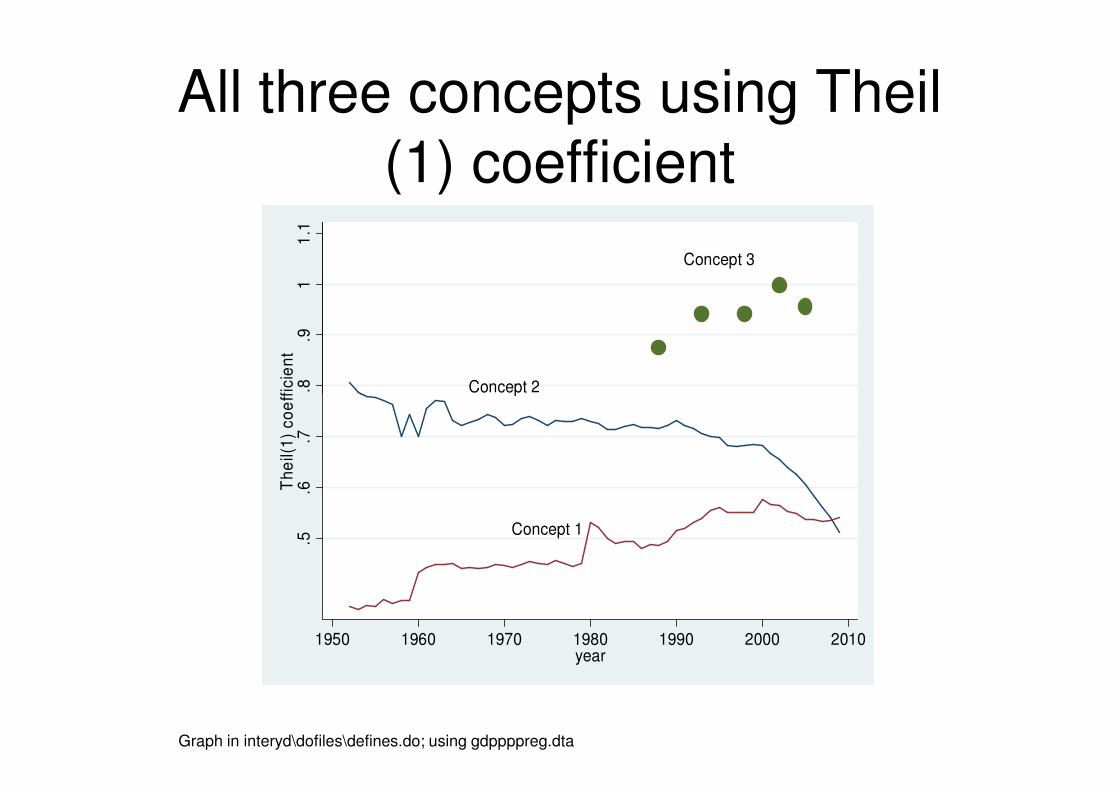
All three concepts using Theil (1) coefficient
Concept 2
Concept 3
.8.9
11
.1T
he
il(1
) co
eff
icie
nt
Graph in interyd\dofiles\defines.do; using gdppppreg.dta
Concept 2
Concept 1
.5.6
.7T
he
il(1
) co
eff
icie
nt
1950 1960 1970 1980 1990 2000 2010year
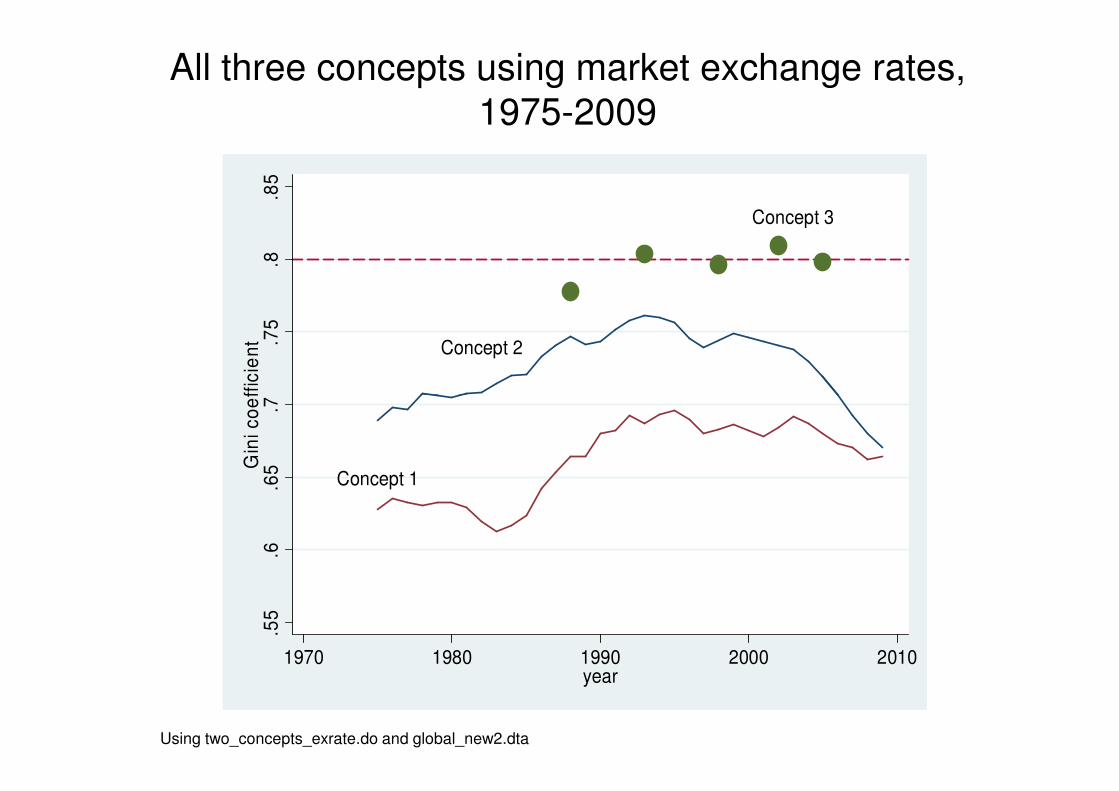
All three concepts using market exchange rates, 1975-2009
Concept 2
Concept 3
.75
.8.8
5G
ini co
eff
icie
nt
Using two_concepts_exrate.do and global_new2.dta
Concept 1
.55
.6.6
5.7
Gin
i co
eff
icie
nt
1970 1980 1990 2000 2010year
2. Methodological issues: PPPs,
National accounts vs. Household
surveys surveys
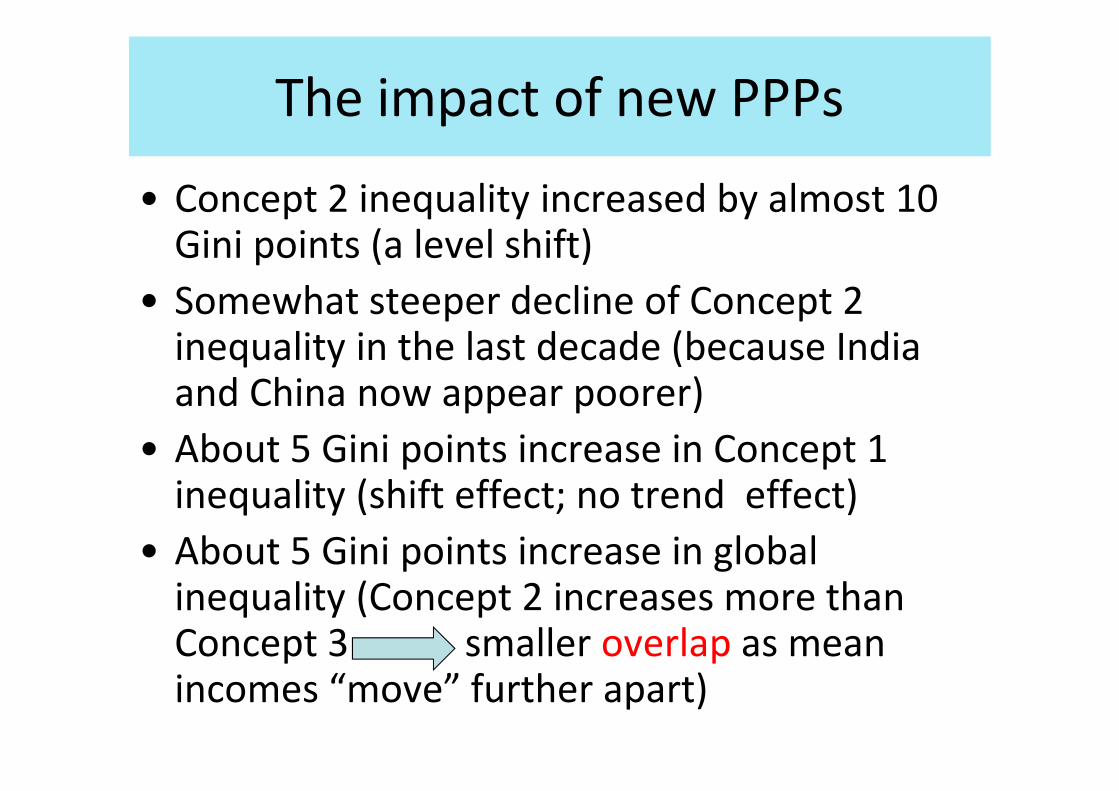
The impact of new PPPs
• Concept 2 inequality increased by almost 10 Gini points (a level shift)
• Somewhat steeper decline of Concept 2 inequality in the last decade (because India and China now appear poorer)and China now appear poorer)
• About 5 Gini points increase in Concept 1 inequality (shift effect; no trend effect)
• About 5 Gini points increase in global inequality (Concept 2 increases more than Concept 3 smaller overlap as mean incomes “move” further apart)
(cont.)
• World poorer than we thought, Asia in
particular
• Inequality (in all formulations) greater
• Growth rates not affected in WDI but will be • Growth rates not affected in WDI but will be
affected in PWT; so “the past will now
change” (like in Orwell)
• Two engines of “global equalization”: China
and India
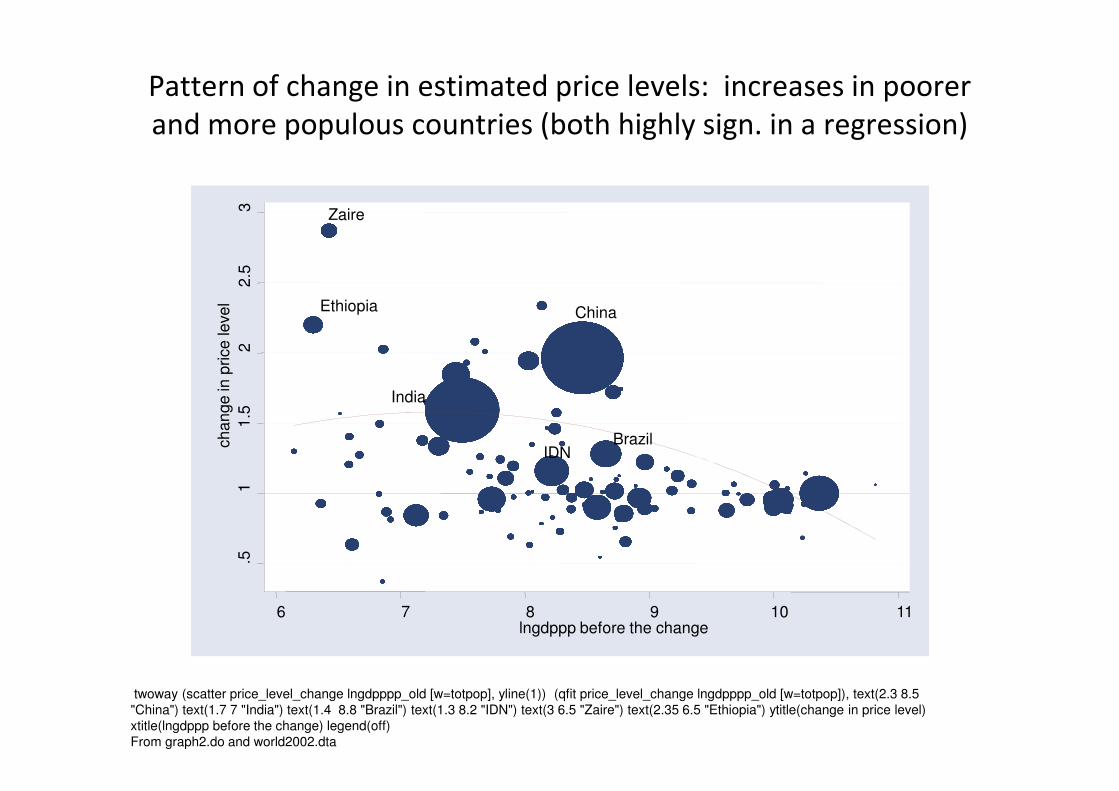
Pattern of change in estimated price levels: increases in poorer
and more populous countries (both highly sign. in a regression)
China
India
Zaire
Ethiopia
22
.53
ch
an
ge
in p
rice
leve
l
twoway (scatter price_level_change lngdpppp_old [w=totpop], yline(1)) (qfit price_level_change lngdpppp_old [w=totpop]), text(2.3 8.5 "China") text(1.7 7 "India") text(1.4 8.8 "Brazil") text(1.3 8.2 "IDN") text(3 6.5 "Zaire") text(2.35 6.5 "Ethiopia") ytitle(change in price level) xtitle(lngdppp before the change) legend(off)From graph2.do and world2002.dta
India
BrazilIDN
.51
1.5
ch
an
ge
in p
rice
leve
l
6 7 8 9 10 11lngdppp before the change
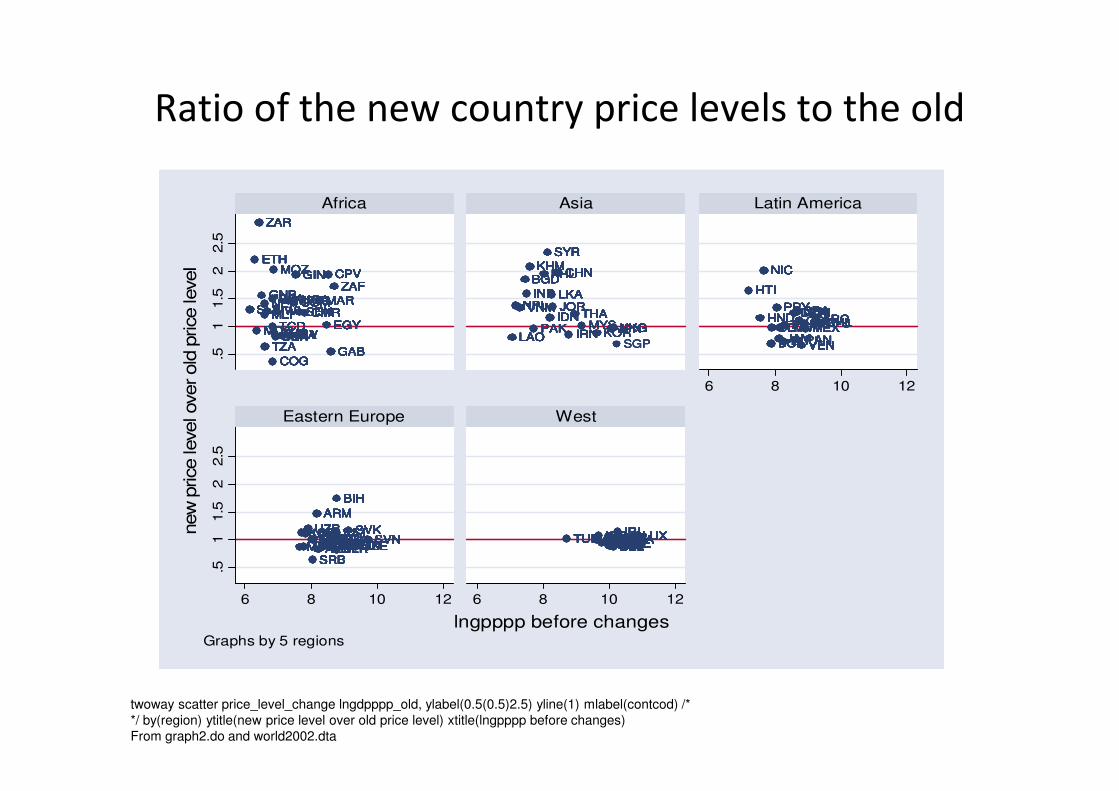
Ratio of the new country price levels to the old
BENBENBENBENBENBENBENBENBENBENBENBENBENBENBENBENBENBENBENBEN
BFABFABFABFABFABFABFABFABFABFABFABFABFABFABFABFABFABFABFABFA
CIVCIVCIVCIVCIVCIVCIVCIVCIVCIVCIVCIVCIVCIVCIVCIVCIVCIVCIVCIV
CMRCMRCMRCMRCMRCMRCMRCMRCMRCMRCMRCMRCMRCMRCMRCMRCMRCMRCMRCMR
COGCOGCOGCOGCOGCOGCOGCOGCOGCOGCOGCOGCOGCOGCOGCOGCOGCOGCOGCOG
COMCOMCOMCOMCOMCOMCOMCOMCOMCOMCOMCOMCOMCOMCOMCOMCOMCOMCOMCOM
CPVCPVCPVCPVCPVCPVCPVCPVCPVCPVCPVCPVCPVCPVCPVCPVCPVCPVCPVCPV
EGYEGYEGYEGYEGYEGYEGYEGYEGYEGYEGYEGYEGYEGYEGYEGYEGYEGYEGYEGY
ETHETHETHETHETHETHETHETHETHETHETHETHETHETHETHETHETHETHETHETH
GABGABGABGABGABGABGABGABGABGABGABGABGABGABGABGABGABGABGABGAB
GINGINGINGINGINGINGINGINGINGINGINGINGINGINGINGINGINGINGINGIN
GNBGNBGNBGNBGNBGNBGNBGNBGNBGNBGNBGNBGNBGNBGNBGNBGNBGNBGNBGNBMARMARMARMARMARMARMARMARMARMARMARMARMARMARMARMARMARMARMARMAR
MDGMDGMDGMDGMDGMDGMDGMDGMDGMDGMDGMDGMDGMDGMDGMDGMDGMDGMDGMDG
MLIMLIMLIMLIMLIMLIMLIMLIMLIMLIMLIMLIMLIMLIMLIMLIMLIMLIMLIMLI
MOZMOZMOZMOZMOZMOZMOZMOZMOZMOZMOZMOZMOZMOZMOZMOZMOZMOZMOZMOZ
MRTMRTMRTMRTMRTMRTMRTMRTMRTMRTMRTMRTMRTMRTMRTMRTMRTMRTMRTMRTMWIMWIMWIMWIMWIMWIMWIMWIMWIMWIMWIMWIMWIMWIMWIMWIMWIMWIMWIMWINERNERNERNERNERNERNERNERNERNERNERNERNERNERNERNERNERNERNERNER
NGANGANGANGANGANGANGANGANGANGANGANGANGANGANGANGANGANGANGANGA
SENSENSENSENSENSENSENSENSENSENSENSENSENSENSENSENSENSENSENSENSLESLESLESLESLESLESLESLESLESLESLESLESLESLESLESLESLESLESLESLE
TCDTCDTCDTCDTCDTCDTCDTCDTCDTCDTCDTCDTCDTCDTCDTCDTCDTCDTCDTCD
TZATZATZATZATZATZATZATZATZATZATZATZATZATZATZATZATZATZATZATZA
UGAUGAUGAUGAUGAUGAUGAUGAUGAUGAUGAUGAUGAUGAUGAUGAUGAUGAUGAUGAZAFZAFZAFZAFZAFZAFZAFZAFZAFZAFZAFZAFZAFZAFZAFZAFZAFZAFZAFZAF
ZARZARZARZARZARZARZARZARZARZARZARZARZARZARZARZARZARZARZARZAR
ZMBZMBZMBZMBZMBZMBZMBZMBZMBZMBZMBZMBZMBZMBZMBZMBZMBZMBZMBZMB
BGDBGDBGDBGDBGDBGDBGDBGDBGDBGDBGDBGDBGDBGDBGDBGDBGDBGDBGDBGDCHNCHNCHNCHNCHNCHNCHNCHNCHNCHNCHNCHNCHNCHNCHNCHNCHNCHNCHNCHN
HKGHKGHKGHKGHKGHKGHKGHKGHKGHKGHKGHKGHKGHKGHKGHKGHKGHKGHKGHKGIDNIDNIDNIDNIDNIDNIDNIDNIDNIDNIDNIDNIDNIDNIDNIDNIDNIDNIDNIDN
INDINDINDINDINDINDINDINDINDINDINDINDINDINDINDINDINDINDINDIND
IRNIRNIRNIRNIRNIRNIRNIRNIRNIRNIRNIRNIRNIRNIRNIRNIRNIRNIRNIRN
JORJORJORJORJORJORJORJORJORJORJORJORJORJORJORJORJORJORJORJOR
JPNJPNJPNJPNJPNJPNJPNJPNJPNJPNJPNJPNJPNJPNJPNJPNJPNJPN
KHMKHMKHMKHMKHMKHMKHMKHMKHMKHMKHMKHMKHMKHMKHMKHMKHMKHMKHMKHM
KORKORKORKORKORKORKORKORKORKORLAOLAOLAOLAOLAOLAOLAOLAOLAOLAOLAOLAOLAOLAOLAOLAOLAOLAOLAOLAO
LKALKALKALKALKALKALKALKALKALKALKALKALKALKALKALKALKALKALKALKA
MYSMYSMYSMYSMYSMYSMYSMYSMYSMYS
NPLNPLNPLNPLNPLNPLNPLNPLNPLNPLNPLNPLNPLNPLNPLNPLNPLNPLNPLNPL
PAKPAKPAKPAKPAKPAKPAKPAKPAKPAKPAKPAKPAKPAKPAKPAKPAKPAKPAKPAK
PHLPHLPHLPHLPHLPHLPHLPHLPHLPHLPHLPHLPHLPHLPHLPHLPHLPHLPHLPHL
SGPSGPSGPSGPSGP
SYRSYRSYRSYRSYRSYRSYRSYRSYRSYRSYRSYRSYRSYRSYRSYRSYRSYRSYRSYR
THATHATHATHATHATHATHATHATHATHATHATHATHATHATHATHATHATHATHATHAVNMVNMVNMVNMVNMVNMVNMVNMVNMVNMVNMVNMVNMVNMVNMVNMVNMVNMVNMVNM
ARGARGARGARGARGARGARGARGARGARGARGARGARGARGARGARGARGARGARGARG
BOLBOLBOLBOLBOLBOLBOLBOLBOLBOLBOLBOLBOLBOLBOLBOLBOLBOLBOLBOL
BRABRABRABRABRABRABRABRABRABRABRABRABRABRABRABRABRABRABRABRACHLCHLCHLCHLCHLCHLCHLCHLCHLCHLCHLCHLCHLCHLCHLCHLCHLCHLCHLCHL
COLCOLCOLCOLCOLCOLCOLCOLCOLCOLCOLCOLCOLCOLCOLCOLCOLCOLCOLCOLCRICRICRICRICRICRICRICRICRICRICRICRICRICRICRICRICRICRICRICRI
DOMDOMDOMDOMDOMDOMDOMDOMDOMDOMDOMDOMDOMDOMDOMDOMDOMDOMDOMDOM
ECUECUECUECUECUECUECUECUECUECUECUECUECUECUECUECUECUECUECUECUGTMGTMGTMGTMGTMGTMGTMGTMGTMGTMGTMGTMGTMGTMGTMGTMGTMGTMGTMGTM
HNDHNDHNDHNDHNDHNDHNDHNDHNDHNDHNDHNDHNDHNDHNDHNDHNDHNDHNDHND
HTIHTIHTIHTIHTIHTIHTIHTIHTIHTIHTIHTIHTIHTIHTIHTIHTIHTIHTIHTI
JAMJAMJAMJAMJAMJAMJAMJAMJAMJAMJAMJAMJAMJAMJAMJAMJAMJAMJAMJAMMEXMEXMEXMEXMEXMEXMEXMEXMEXMEXMEXMEXMEXMEXMEXMEXMEXMEXMEXMEX
NICNICNICNICNICNICNICNICNICNICNICNICNICNICNICNICNICNICNICNIC
PANPANPANPANPANPANPANPANPANPANPANPANPANPANPANPANPANPANPANPAN
PERPERPERPERPERPERPERPERPERPERPERPERPERPERPERPERPERPERPERPER
PRYPRYPRYPRYPRYPRYPRYPRYPRYPRYPRYPRYPRYPRYPRYPRYPRYPRYPRYPRY
SLVSLVSLVSLVSLVSLVSLVSLVSLVSLVSLVSLVSLVSLVSLVSLVSLVSLVSLVSLV URY-UURY-UURY-UURY-UURY-UURY-UURY-UURY-UURY-UURY-UURY-UURY-UURY-UURY-UURY-UURY-UURY-UURY-UURY-UURY-U
VENVENVENVENVENVENVENVENVENVENVENVENVENVENVENVENVENVENVENVEN
.51
1.5
22.5
6 8 10 12
Africa Asia Latin Americanew
price level over old
price level
ALBALBALBALBALBALBALBALBALBALBALBALBALBALBALBALBALBALBALBALB
ARMARMARMARMARMARMARMARMARMARMARMARMARMARMARMARMARMARMARMARM
BGRBGRBGRBGRBGRBGRBGRBGRBGRBGRBGRBGRBGRBGRBGRBGRBGRBGRBGRBGR
BIHBIHBIHBIHBIHBIHBIHBIHBIHBIHBIHBIHBIHBIHBIHBIHBIHBIHBIHBIH
BLRBLRBLRBLRBLRBLRBLRBLRBLRBLRBLRBLRBLRBLRBLRBLRBLRBLRBLRBLRCZECZECZECZECZECZECZECZECZECZECZECZECZECZECZECZECZECZECZECZEESTESTESTESTESTESTESTESTESTESTESTESTESTESTESTESTESTESTESTEST
GEOGEOGEOGEOGEOGEOGEOGEOGEOGEOGEOGEOGEOGEOGEOGEOGEOGEOGEOGEO HRVHRVHRVHRVHRVHRVHRVHRVHRVHRVHRVHRVHRVHRVHRVHRVHRVHRVHRVHRVHUNHUNHUNHUNHUNHUNHUNHUNHUNHUNHUNHUNHUNHUNHUNHUNHUNHUNHUNHUNKAZKAZKAZKAZKAZKAZKAZKAZKAZKAZKAZKAZKAZKAZKAZKAZKAZKAZKAZKAZKGZKGZKGZKGZKGZKGZKGZKGZKGZKGZKGZKGZKGZKGZKGZKGZKGZKGZKGZKGZ
LTULTULTULTULTULTULTULTULTULTULTULTULTULTULTULTULTULTULTULTULVALVALVALVALVALVALVALVALVALVALVALVALVALVALVALVALVALVALVALVAMDAMDAMDAMDAMDAMDAMDAMDAMDAMDAMDAMDAMDAMDAMDAMDAMDAMDAMDAMDA
MKDMKDMKDMKDMKDMKDMKDMKDMKDMKDMKDMKDMKDMKDMKDMKDMKDMKDMKDMKDPOLPOLPOLPOLPOLPOLPOLPOLPOLPOLPOLPOLPOLPOLPOLPOLPOLPOLPOLPOLROMROMROMROMROMROMROMROMROMROMROMROMROMROMROMROMROMROMROMROMRUSRUSRUSRUSRUSRUSRUSRUSRUSRUSRUSRUSRUSRUSRUSRUSRUSRUSRUSRUS
SRBSRBSRBSRBSRBSRBSRBSRBSRBSRBSRBSRBSRBSRBSRBSRBSRBSRBSRBSRB
SVKSVKSVKSVKSVKSVKSVKSVKSVKSVKSVKSVKSVKSVKSVKSVKSVKSVKSVKSVKSVNSVNSVNSVNSVNSVNSVNSVNSVNSVNSVNSVNSVNSVNSVNSVNSVNSVNSVNSVN
TJKTJKTJKTJKTJKTJKTJKTJKTJKTJKTJKTJKTJKTJKTJKTJKTJKTJKTJKTJKUKRUKRUKRUKRUKRUKRUKRUKRUKRUKRUKRUKRUKRUKRUKRUKRUKRUKRUKRUKRUZBUZBUZBUZBUZBUZBUZBUZBUZBUZBUZBUZBUZBUZBUZBUZBUZBUZBUZBUZB
AUSAUSAUSAUSAUSAUSAUSAUSAUSAUSAUSAUSAUSAUSAUSAUSAUSAUSAUSAUSAUTAUTAUTAUTAUTAUTAUTAUTAUTAUTAUTAUTAUTAUTAUTAUTAUTAUTAUTAUTBELBELBELBELBELBELBELBELBELBELBELBELBELBELBELBELBELBELBELBELCANCANCANCANCANCANCANCANCANCANCANCANCANCANCANCANCANCANCANCANCHECHECHECHECHECHECHECHECHECHECHECHECHECHECHECHECHECHECHECHEDEUDEUDEUDEUDEUDEUDEUDEUDEUDEUDEUDEUDEUDEUDEUDEUDEUDEUDEUDEUDNKDNKDNKDNKDNKDNKDNKDNKDNKDNKDNKDNKDNKDNKDNKDNKDNKDNKDNKDNKESPESPESPESPESPESPESPESPESPESPESPESPESPESPESPESPESPESPESPESPFINFINFINFINFINFINFINFINFINFINFINFINFINFINFINFINFINFINFINFINFRAFRAFRAFRAFRAFRAFRAFRAFRAFRAGBRGBRGBRGBRGBRGBRGBRGBRGBRGBRGBRGBRGBRGBRGBRGBRGBRGBRGBRGBRGRCGRCGRCGRCGRCGRCGRCGRCGRCGRCGRCGRCGRCGRCGRCGRCGRCGRCGRCGRCIRLIRLIRLIRLIRLIRLIRLIRLIRLIRLIRLIRLIRLIRLIRLIRLIRLIRLIRLIRLISRISRISRISRISRISRISRISRISRISRISRISRISRISRISRISRISRISRISRISR
ITAITAITAITAITAITAITAITAITAITAITAITAITAITAITAITAITAITAITAITALUXLUXLUXLUXLUXLUXLUXLUXLUXLUXLUXLUXLUXLUXLUXLUXLUXLUXLUXLUX
NLDNLDNLDNLDNLDNLDNLDNLDNLDNLDNLDNLDNLDNLDNLDNLDNLDNLDNLDNLDNORNORNORNORNORNORNORNORNORNORNORNORNORNORNORNORNORNORNORNORSWESWESWESWESWESWESWESWESWESWESWESWESWESWESWESWESWESWESWESWETURTURTURTURTURTURTURTURTURTURTURTURTURTURTURTURTURTURTURTUR USAUSAUSAUSAUSAUSAUSAUSAUSAUSAUSAUSAUSAUSAUSAUSAUSAUSAUSAUSA
.51
1.5
22.5
6 8 10 12 6 8 10 12
Eastern Europe West
new
price level over old
price level
lngpppp before changesGraphs by 5 regions
twoway scatter price_level_change lngdpppp_old, ylabel(0.5(0.5)2.5) yline(1) mlabel(contcod) /**/ by(region) ytitle(new price level over old price level) xtitle(lngpppp before changes)From graph2.do and world2002.dta
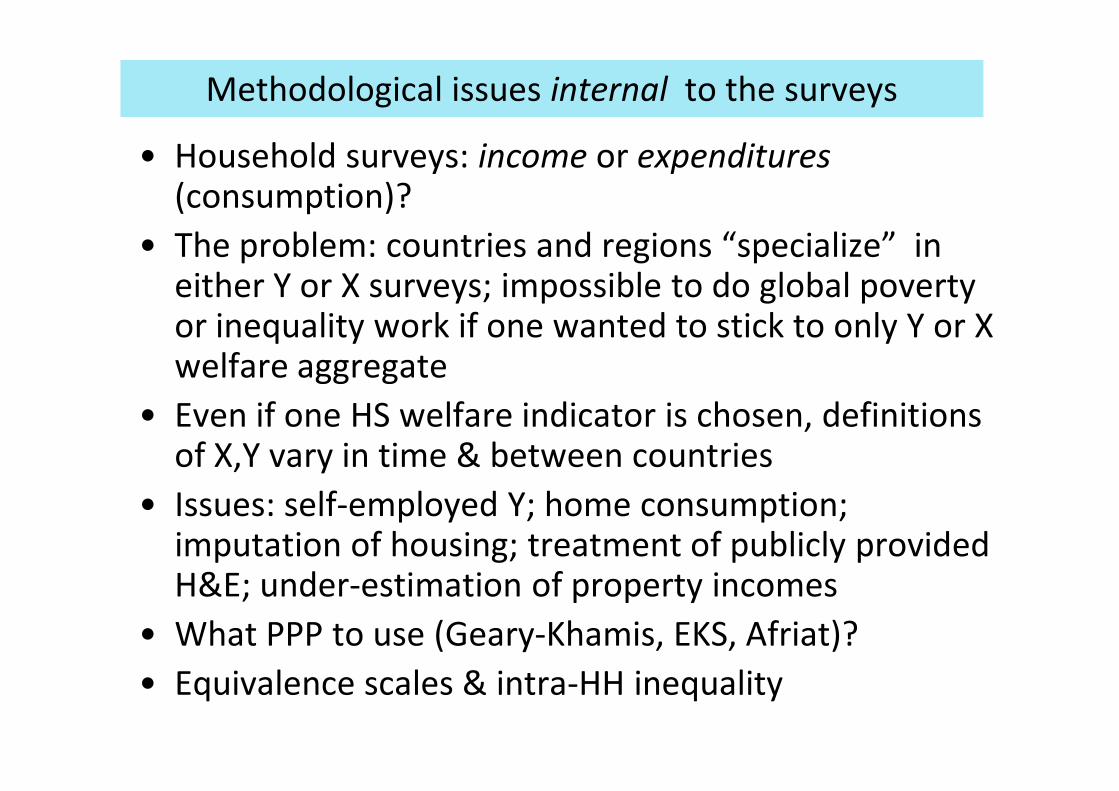
Methodological issues internal to the surveys
• Household surveys: income or expenditures
(consumption)?
• The problem: countries and regions “specialize” in either Y or X surveys; impossible to do global poverty or inequality work if one wanted to stick to only Y or X welfare aggregate
• Even if one HS welfare indicator is chosen, definitions • Even if one HS welfare indicator is chosen, definitions of X,Y vary in time & between countries
• Issues: self-employed Y; home consumption; imputation of housing; treatment of publicly provided H&E; under-estimation of property incomes
• What PPP to use (Geary-Khamis, EKS, Afriat)?
• Equivalence scales & intra-HH inequality
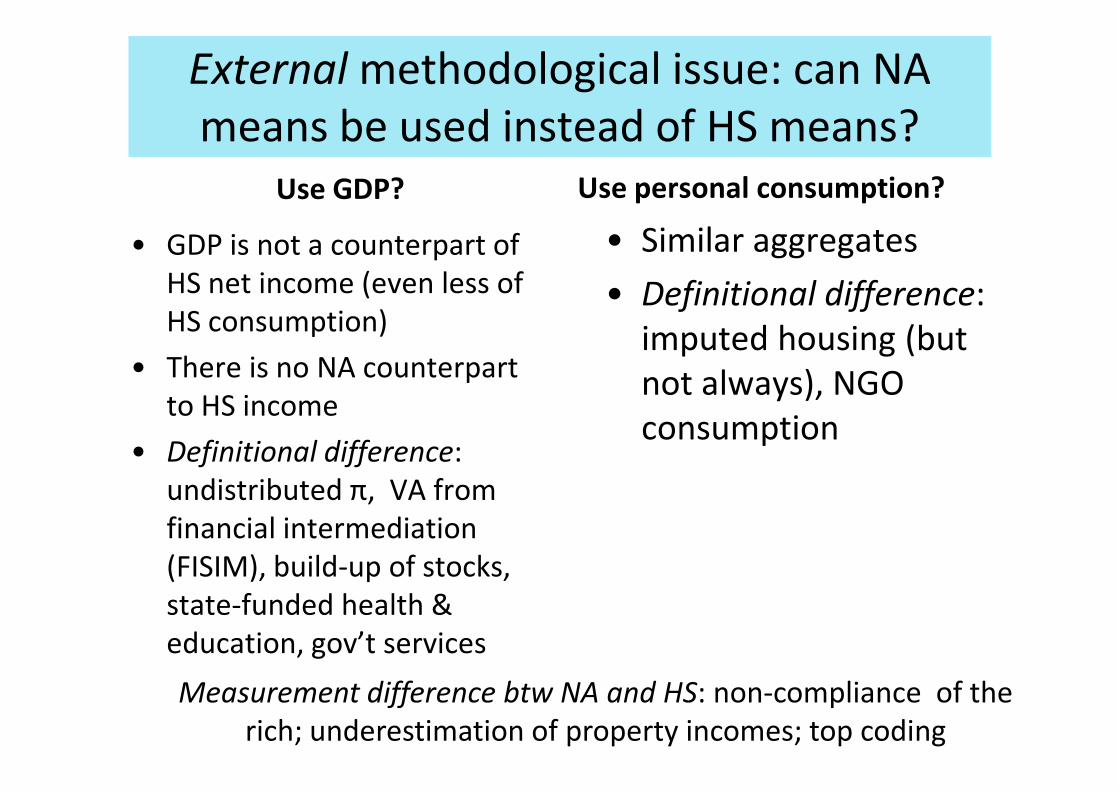
Use GDP?
• GDP is not a counterpart of
HS net income (even less of
HS consumption)
• There is no NA counterpart
to HS income
Use personal consumption?
• Similar aggregates
• Definitional difference:
imputed housing (but
not always), NGO
External methodological issue: can NA
means be used instead of HS means?
to HS income
• Definitional difference:
undistributed π, VA from
financial intermediation
(FISIM), build-up of stocks,
state-funded health &
education, gov’t services
not always), NGO
consumption
Measurement difference btw NA and HS: non-compliance of the
rich; underestimation of property incomes; top coding
The gap between GDP and measured HS mean is thus
composed of ..
• The definitional gap between GDP per capita and “true” HS mean: (*) undistributed π; (*) FISIM; health and education
• Measurement gap: (*) under-surveying of the rich; (*) under-reporting of property income; (*) top (*) under-reporting of property income; (*) top coding
• The gap is not distribution-neutral
• All (*) are pro-rich (i.e., reduce measured ineq.)
• So simple allocation of the gap to everybody according to their HS income share cannot be right
• Deaton: "Using survey shares to allocate NAS [National account consumption or GDP] to the poor and non-poor assumes that these items are distributed between the poor and non-poor in the same way as are the goods measured in the survey, an assumption that cannot possibly be true" ("Measuring poverty in a growing world...")
• US inequality may be underestimated by as much as 4 Gini points or 10% on account of lower
• US inequality may be underestimated by as much as 4 Gini points or 10% on account of lower participation of the rich (Korinek, Mistiaen, Ravallion, 2006)
• Property incomes (compared to NA) generally underestimated by ½ and these incomes are received by the rich
• Top coding reduces the share of the top ventile between 2 and 6%, or up to 1 Gini point (EU data)
Thus…
• Scaling up with GDP per capita biases both poverty and inequality down
• It is a paper redistribution—”there will not be any poor if we assume all the poor to be rich”
• Meanwhile, the gap between GDP and HS means has been rising
• India: cause célѐbre; growth rate from NSS several • India: cause célѐbre; growth rate from NSS several percentage points lower than GDP per capita growth rate (Banerji and Piketty find that 40% of the gap is due to unrecorded income of the top percentile)
• The cause of the increasing gap not well understood; both definitional and measurement issues are probably driving it
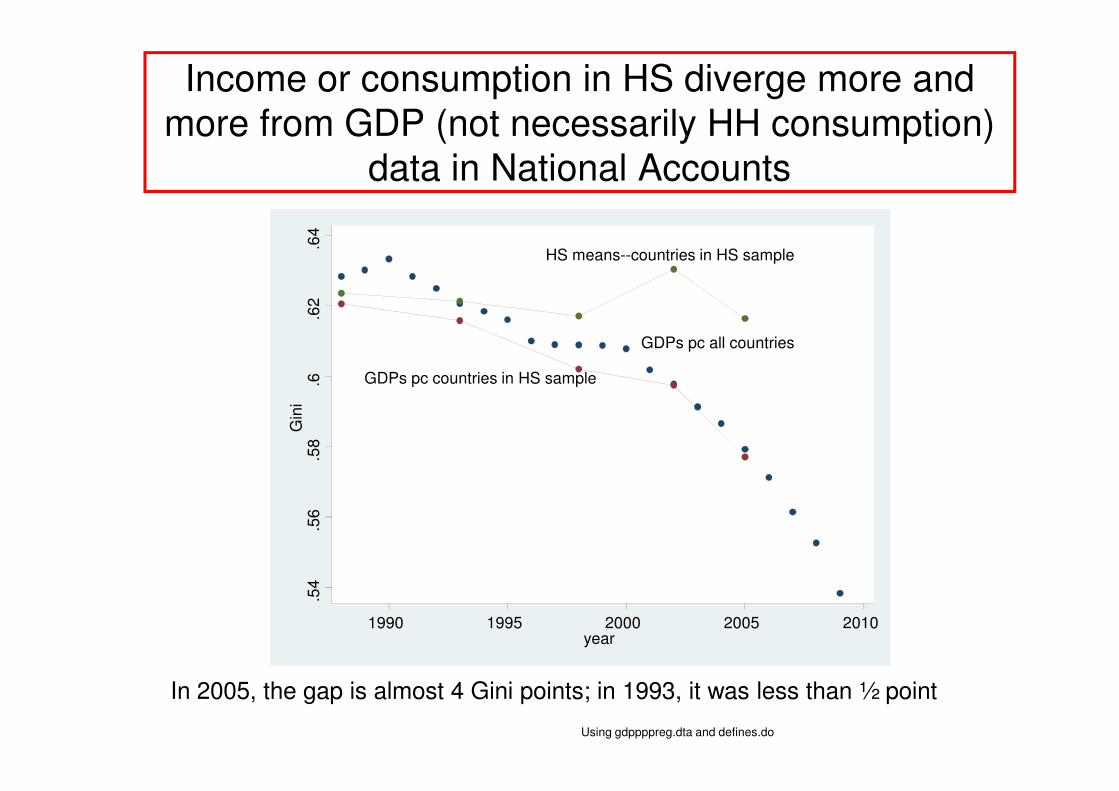
Income or consumption in HS diverge more and more from GDP (not necessarily HH consumption)
data in National Accounts
GDPs pc all countries
GDPs pc countries in HS sample
HS means--countries in HS sample
.6.6
2.6
4
In 2005, the gap is almost 4 Gini points; in 1993, it was less than ½ point
Using gdppppreg.dta and defines.do
.54
.56
.58
Gin
i
1990 1995 2000 2005 2010year
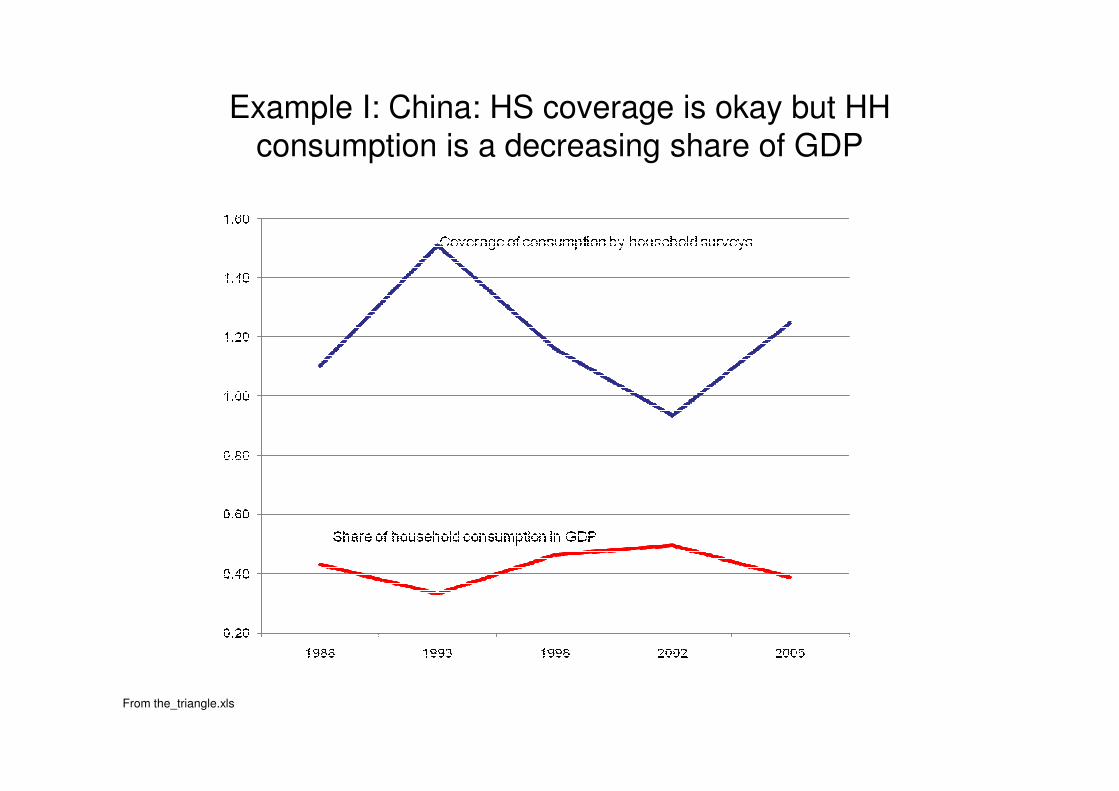
Example I: China: HS coverage is okay but HH consumption is a decreasing share of GDP
From the_triangle.xls
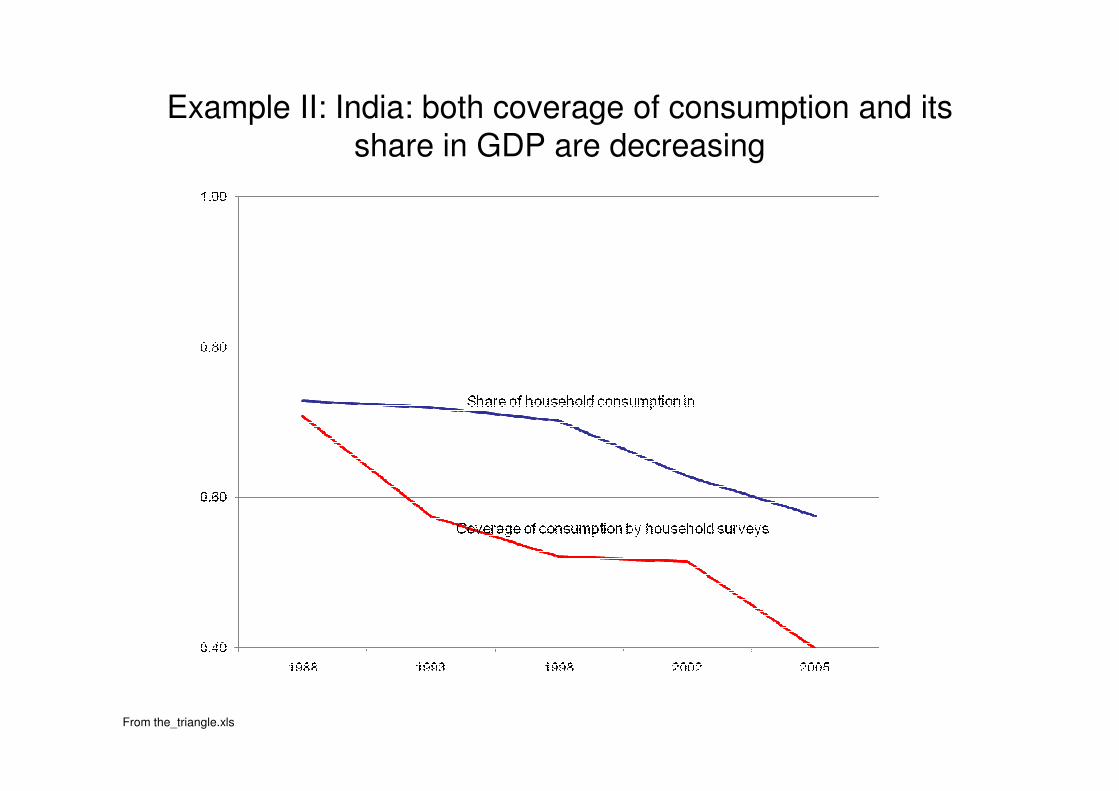
Example II: India: both coverage of consumption and its share in GDP are decreasing
From the_triangle.xls
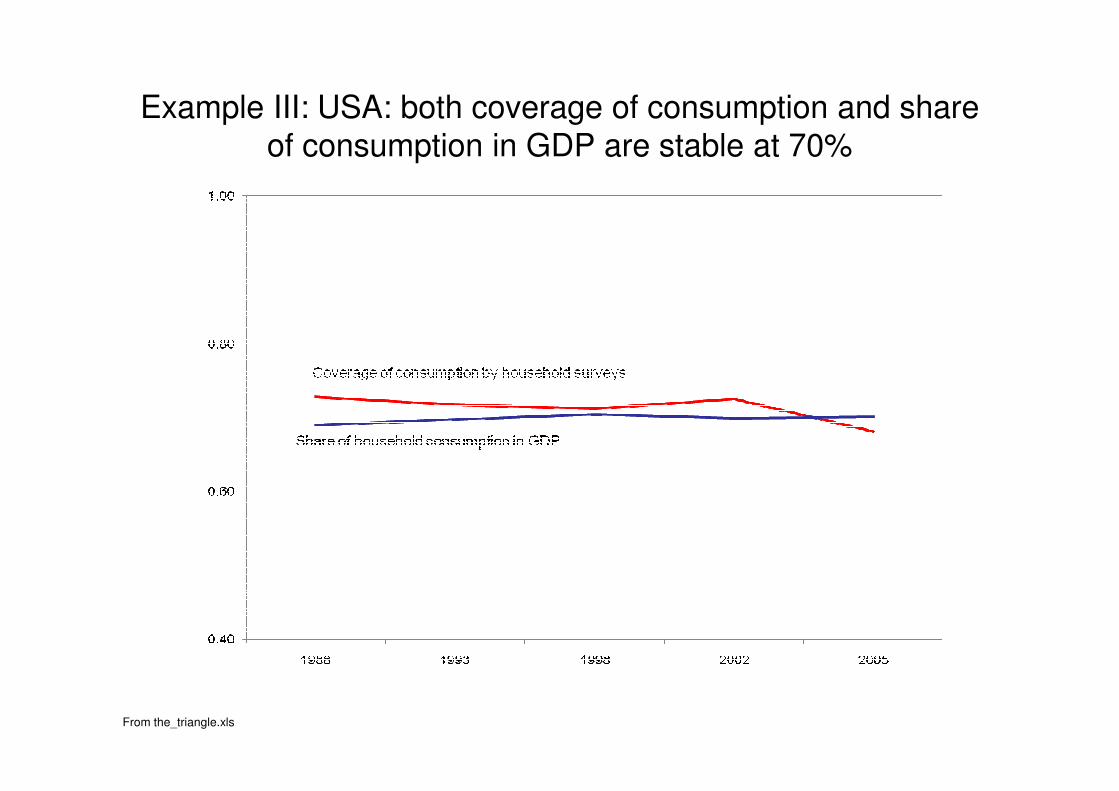
Example III: USA: both coverage of consumption and share of consumption in GDP are stable at 70%
From the_triangle.xls
3. International and global
inequality todayinequality today
Why is increased Concept 1 inequality
important?• During globalization, convergence was supposed to
happen particularly since there was also convergence
in policies and institutions
• Income divergence (σ divergence) led to the
reassessment of neoclassical growth theory and
formulation of endogenous growthformulation of endogenous growth
• Putting “endogenously-created”, non-rival but
excludable technology and increasing returns to
scale at the center-stage, “explains” divergence but
sends a bleak picture about the ultimate likelihood
of poor countries’ catch-up
Two origins of endogenous growth theory
according to Romer (1994)
• (a) No unconditional convergence in income
across countries
• (b) Inability of the neoclassical model to
generate growth within itselfgenerate growth within itself
(a) led to the introduction of increasing returns
to scale
(b) led to endogenous technology
The difficulty of intuition re. evolution of
Concept 3 inequality stems from
contradictory movements
(1) Greater inequality within nations
(2) Greater differences between countries’
mean incomes (unconditional divergence
between 1980 and 2000)between 1980 and 2000)
(3) But catching up of large and poor countries
(China and India)
All of these forces determine what happens to
GLOBAL INEQUALITY (but they affect it
differently)
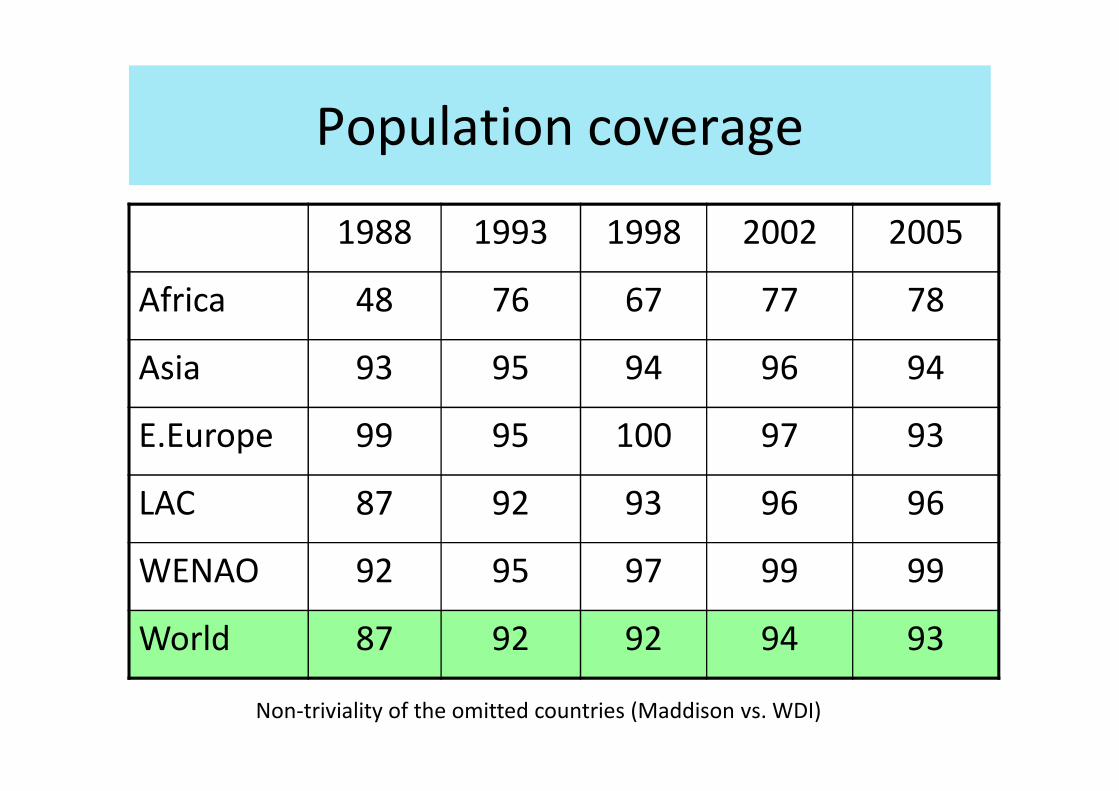
Population coverage
1988 1993 1998 2002 2005
Africa 48 76 67 77 78
Asia 93 95 94 96 94
E.Europe 99 95 100 97 93
LAC 87 92 93 96 96
WENAO 92 95 97 99 99
World 87 92 92 94 93
Non-triviality of the omitted countries (Maddison vs. WDI)
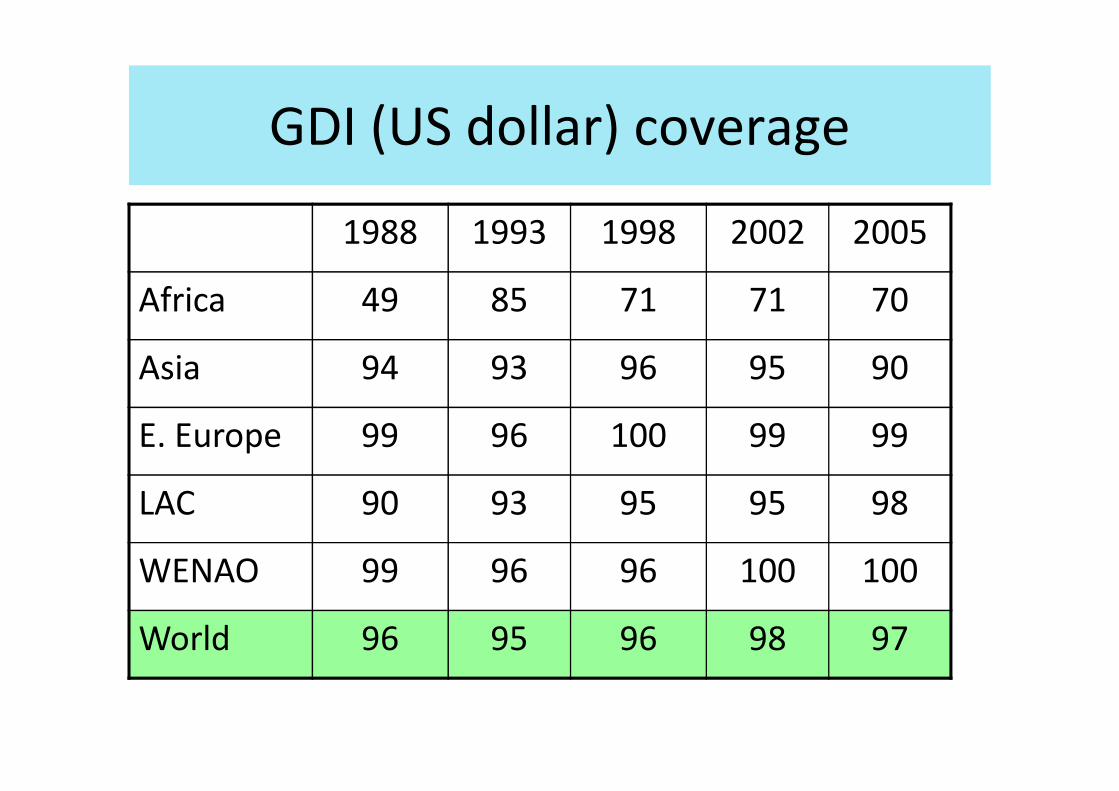
GDI (US dollar) coverage
1988 1993 1998 2002 2005
Africa 49 85 71 71 70
Asia 94 93 96 95 90
E. Europe 99 96 100 99 99
LAC 90 93 95 95 98
WENAO 99 96 96 100 100
World 96 95 96 98 97
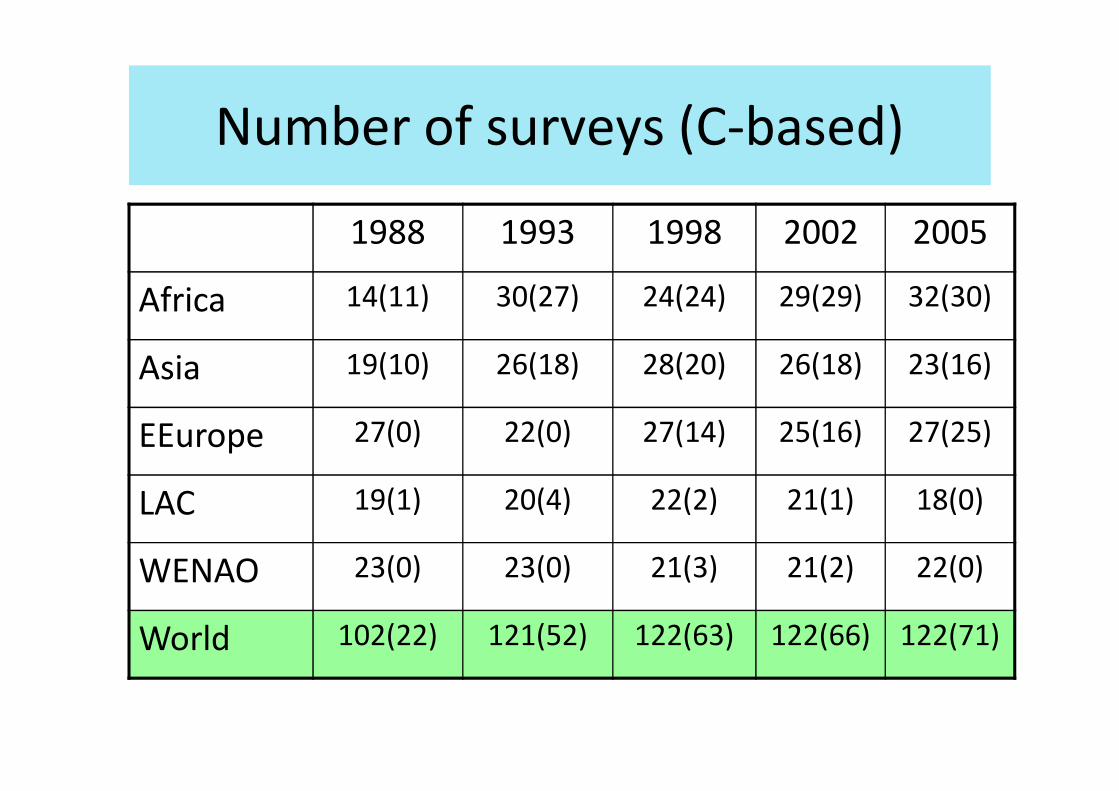
Number of surveys (C-based)
1988 1993 1998 2002 2005
Africa 14(11) 30(27) 24(24) 29(29) 32(30)
Asia 19(10) 26(18) 28(20) 26(18) 23(16)
EEurope 27(0) 22(0) 27(14) 25(16) 27(25)
LAC 19(1) 20(4) 22(2) 21(1) 18(0)
WENAO 23(0) 23(0) 21(3) 21(2) 22(0)
World 102(22) 121(52) 122(63) 122(66) 122(71)
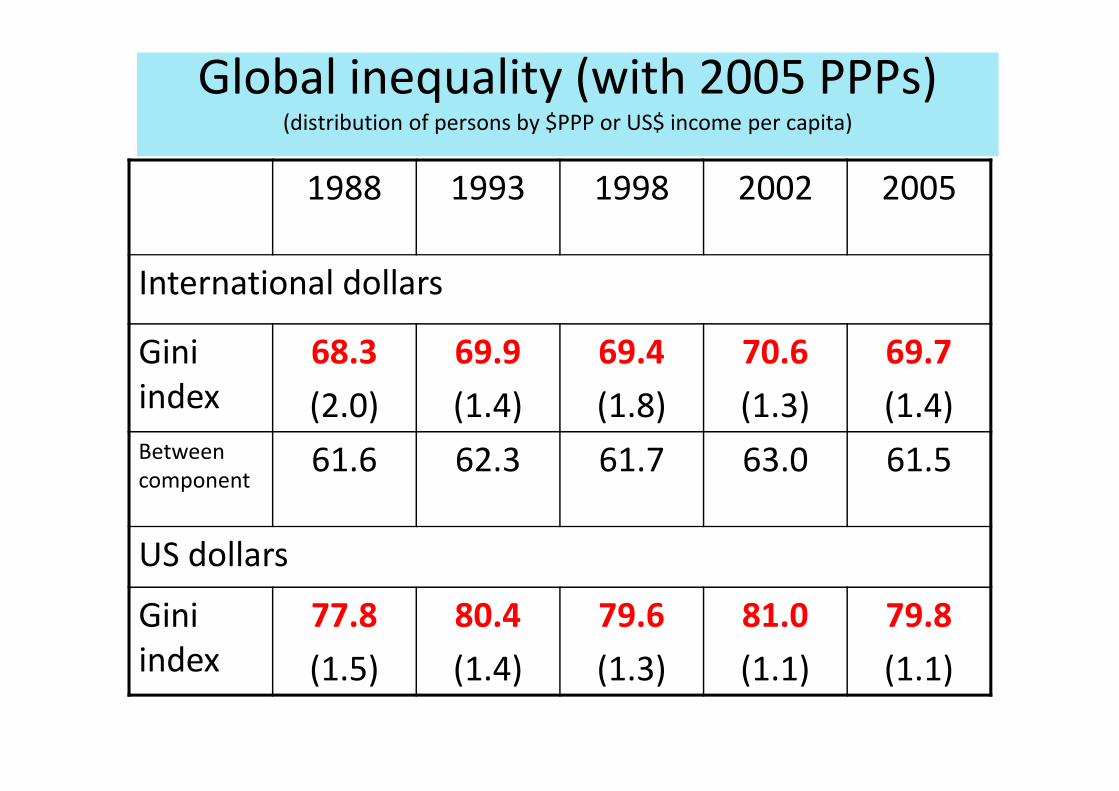
1988 1993 1998 2002 2005
International dollars
Gini
index
68.3
(2.0)
69.9
(1.4)
69.4
(1.8)
70.6
(1.3)
69.7
(1.4)
Global inequality (with 2005 PPPs)(distribution of persons by $PPP or US$ income per capita)
index (2.0) (1.4) (1.8) (1.3) (1.4)Between
component61.6 62.3 61.7 63.0 61.5
US dollars
Gini
index
77.8
(1.5)
80.4
(1.4)
79.6
(1.3)
81.0
(1.1)
79.8
(1.1)
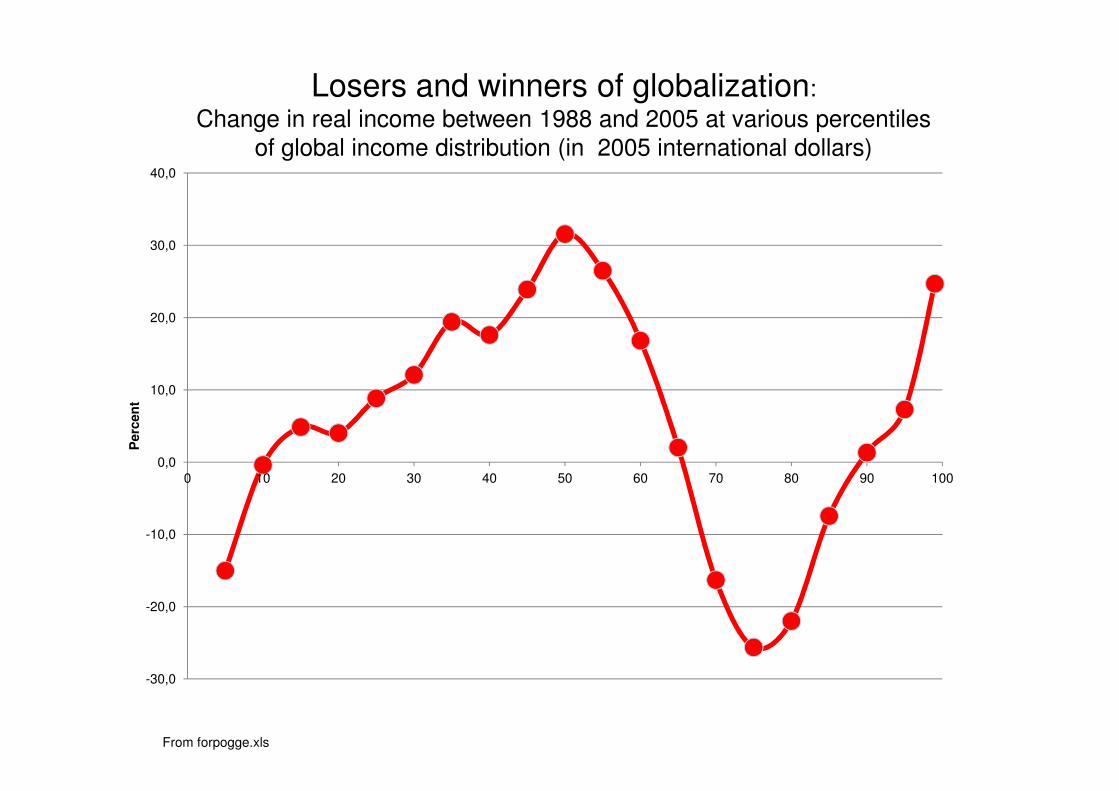
10,0
20,0
30,0
40,0
Losers and winners of globalization:
Change in real income between 1988 and 2005 at various percentiles of global income distribution (in 2005 international dollars)
-30,0
-20,0
-10,0
0,0
10,0
0 10 20 30 40 50 60 70 80 90 100
Perc
en
t
From forpogge.xls
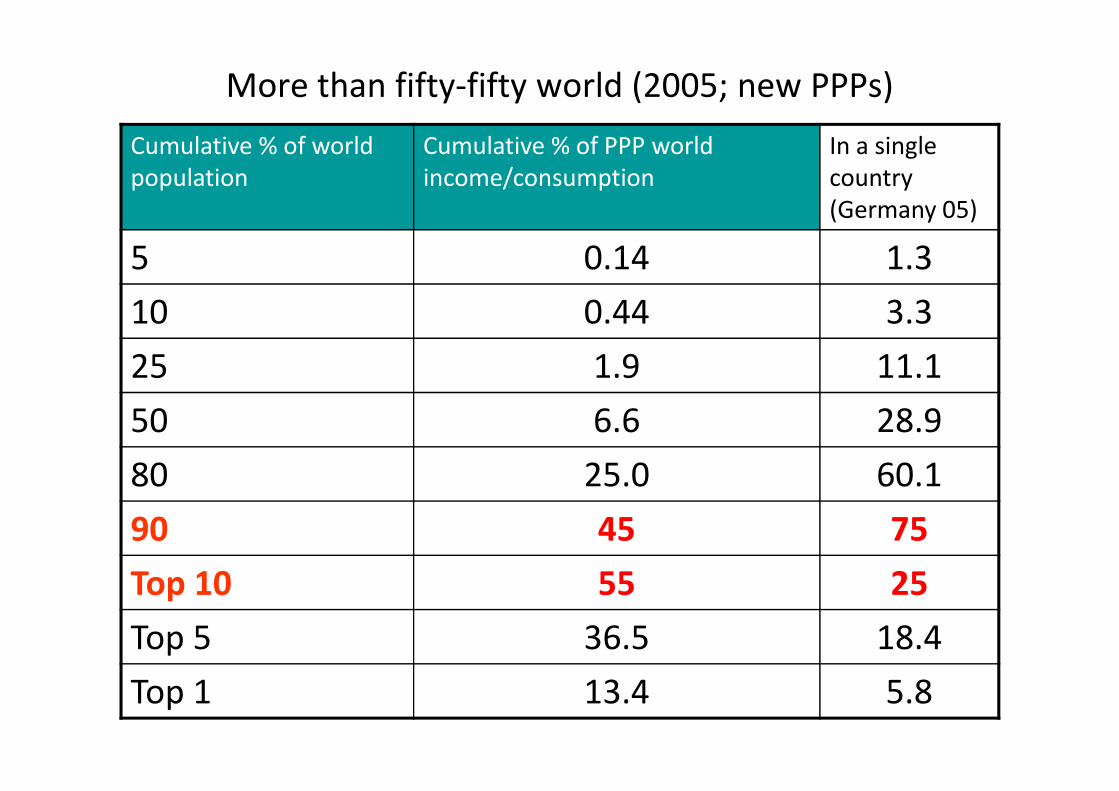
More than fifty-fifty world (2005; new PPPs)
Cumulative % of world
population
Cumulative % of PPP world
income/consumption
In a single
country
(Germany 05)
5 0.14 1.3
10 0.44 3.3
25 1.9 11.1
50 6.6 28.9
80 25.0 60.1
90 45 75
Top 10 55 25
Top 5 36.5 18.4
Top 1 13.4 5.8
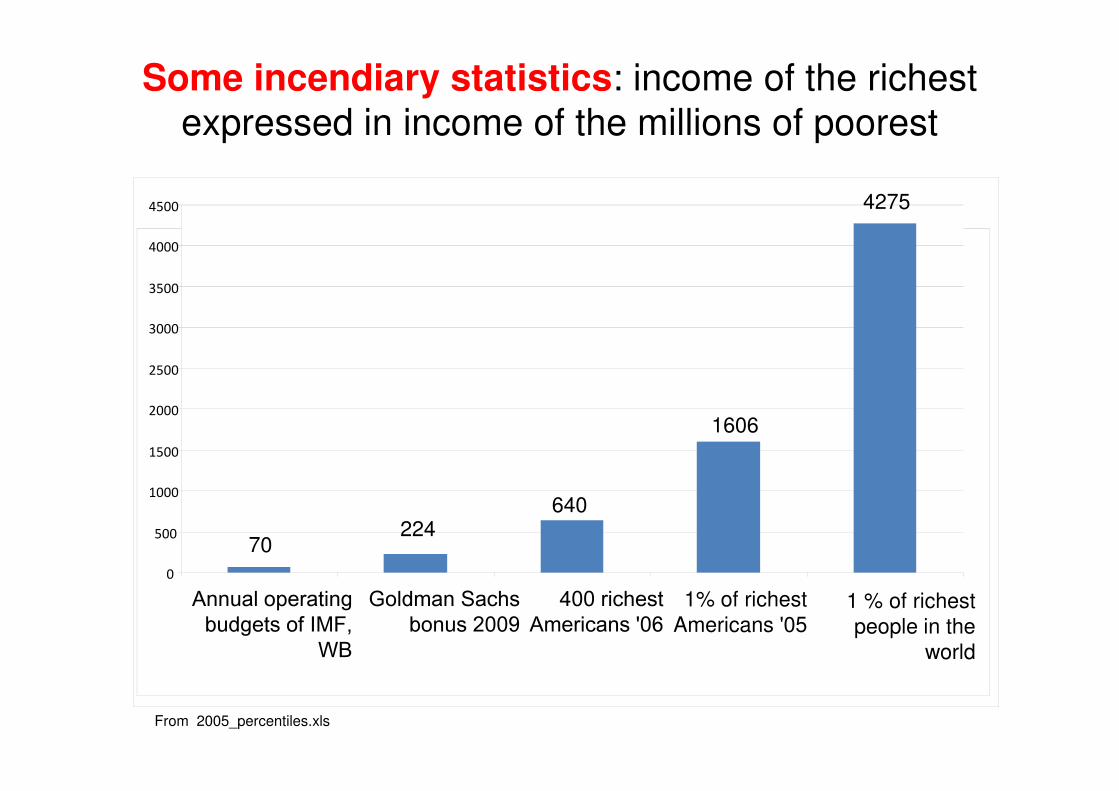
Some incendiary statistics: income of the richest expressed in income of the millions of poorest
4275
2500
3000
3500
4000
4500
70224
640
1606
0
500
1000
1500
2000
Annual operating budgets of IMF,
WB
Goldman Sachs bonus 2009
400 richest Americans '06
1% of richest Americans '05
1 % of richest people in the
world
From 2005_percentiles.xls
4. International and global
inequality in the long-run: inequality in the long-run:
1850-2010
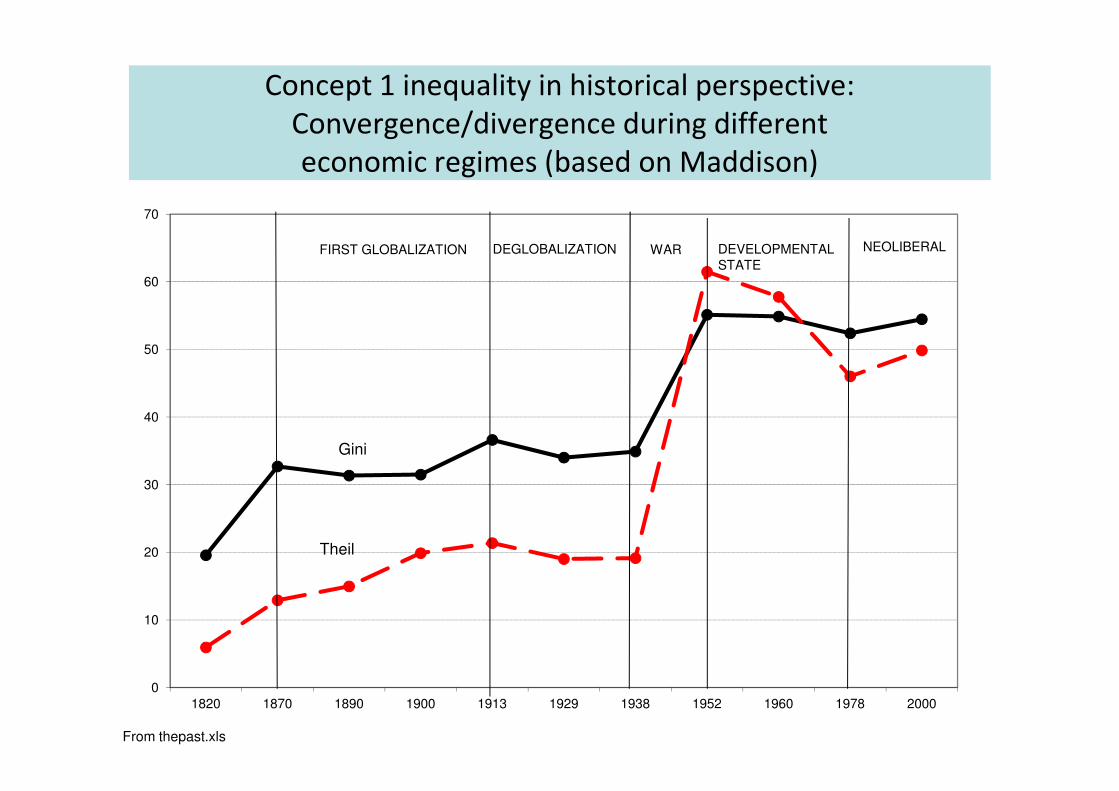
Concept 1 inequality in historical perspective:
Convergence/divergence during different
economic regimes (based on Maddison)
50
60
70
FIRST GLOBALIZATION DEGLOBALIZATION WAR DEVELOPMENTAL STATE
NEOLIBERAL
0
10
20
30
40
1820 1870 1890 1900 1913 1929 1938 1952 1960 1978 2000
Gini
Theil
From thepast.xls
A non-Marxist world
• Over the long run, decreasing importance of within-country inequalities despite some reversal in the last quarter century
• Increasing importance of between-country • Increasing importance of between-country inequalities (but with some hopeful signs in the last five years, before the current crisis),
• Global division between countries more than between classes
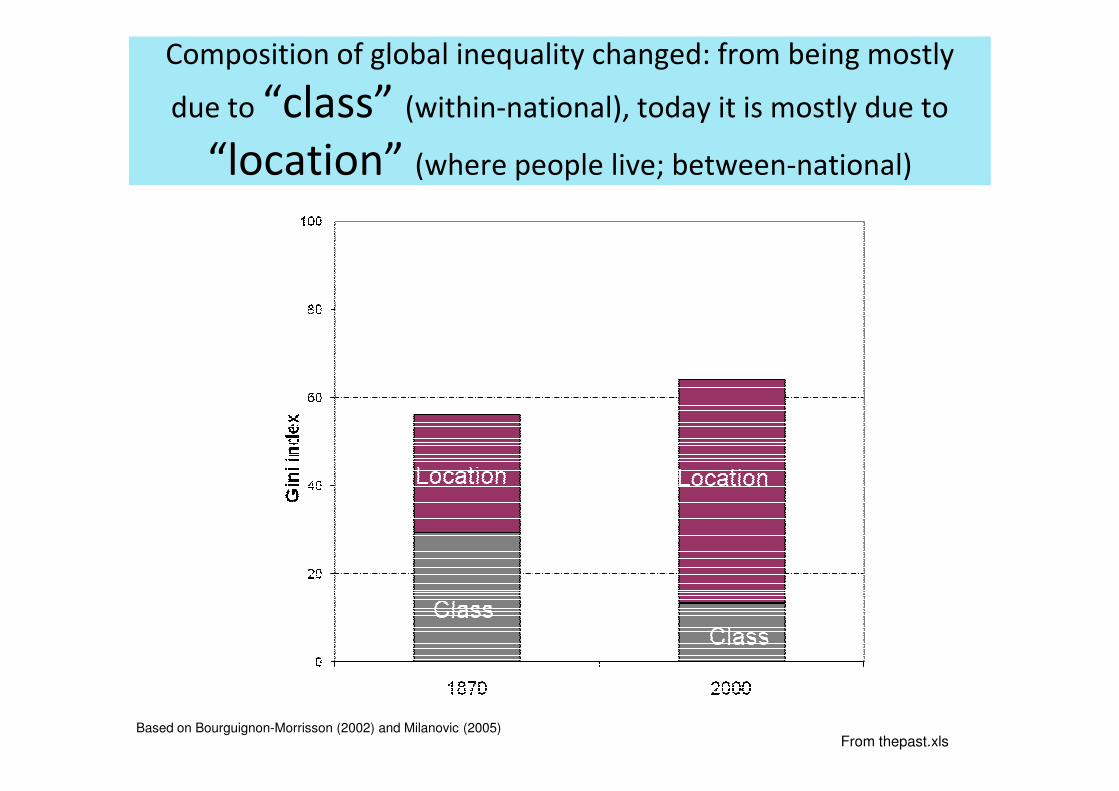
Composition of global inequality changed: from being mostly
due to “class” (within-national), today it is mostly due to
“location” (where people live; between-national)
Based on Bourguignon-Morrisson (2002) and Milanovic (2005)From thepast.xls
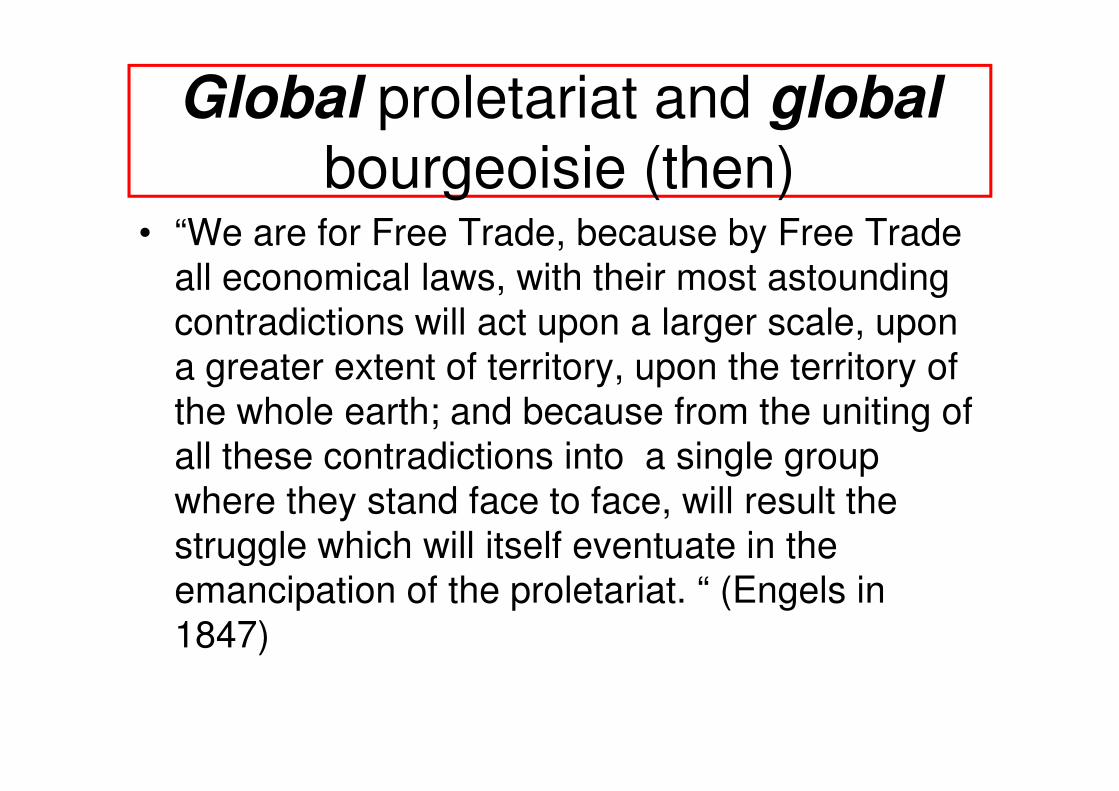
Global proletariat and global
bourgeoisie (then)• “We are for Free Trade, because by Free Trade
all economical laws, with their most astounding contradictions will act upon a larger scale, upon a greater extent of territory, upon the territory of the whole earth; and because from the uniting of the whole earth; and because from the uniting of all these contradictions into a single group where they stand face to face, will result the struggle which will itself eventuate in the emancipation of the proletariat. “ (Engels in 1847)

But the situation has changed today!
It is location much more than class that matters
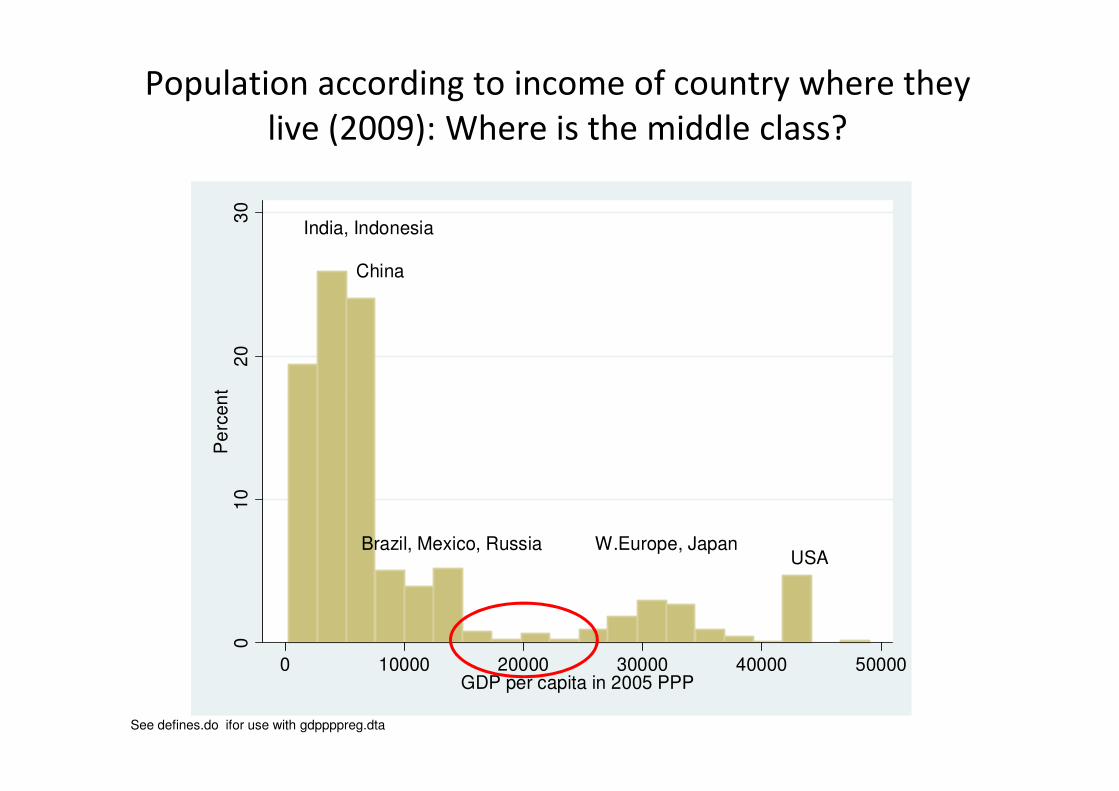
Population according to income of country where they
live (2009): Where is the middle class?
India, Indonesia
China
20
30
Pe
rce
nt
See defines.do ifor use with gdppppreg.dta
Brazil, Mexico, Russia W.Europe, JapanUSA
01
0P
erc
en
t
0 10000 20000 30000 40000 50000GDP per capita in 2005 PPP
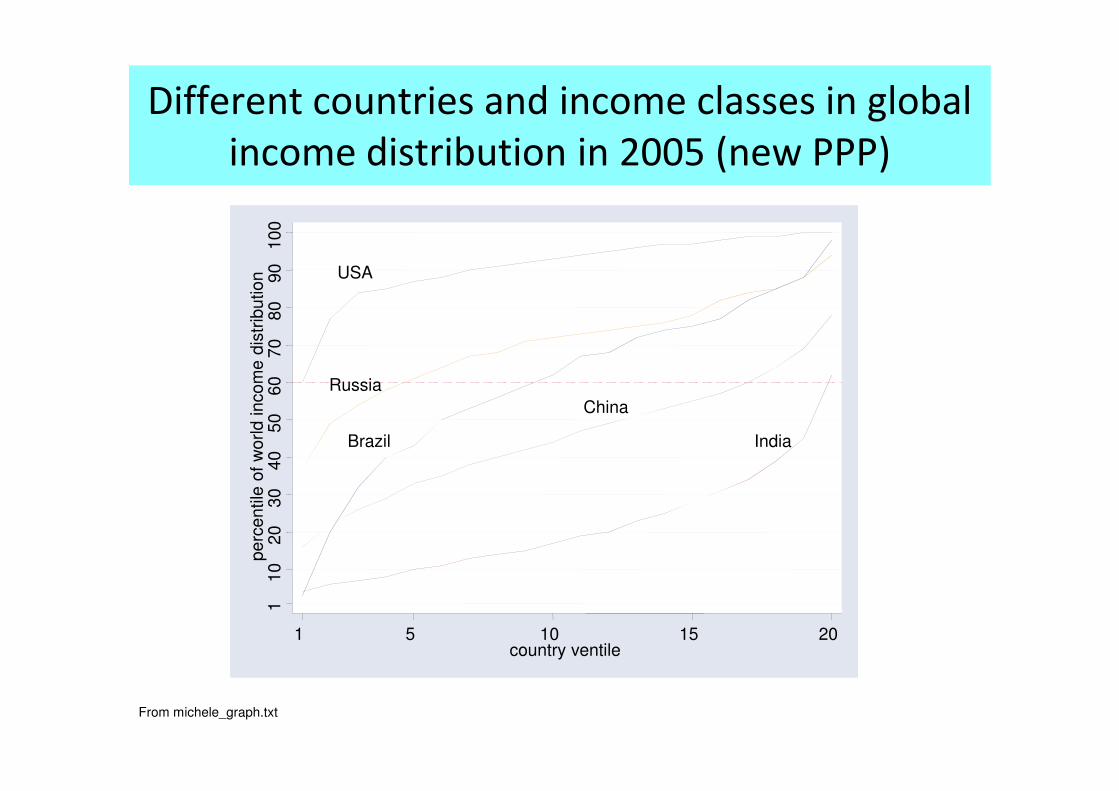
Different countries and income classes in global
income distribution in 2005 (new PPP)
USA
Russia60
70
80
90
100
perc
entile
of
world incom
e d
istr
ibution
From michele_graph.txt
China
Brazil India
110
20
30
40
50
60
perc
entile
of
world incom
e d
istr
ibution
1 5 10 15 20country ventile
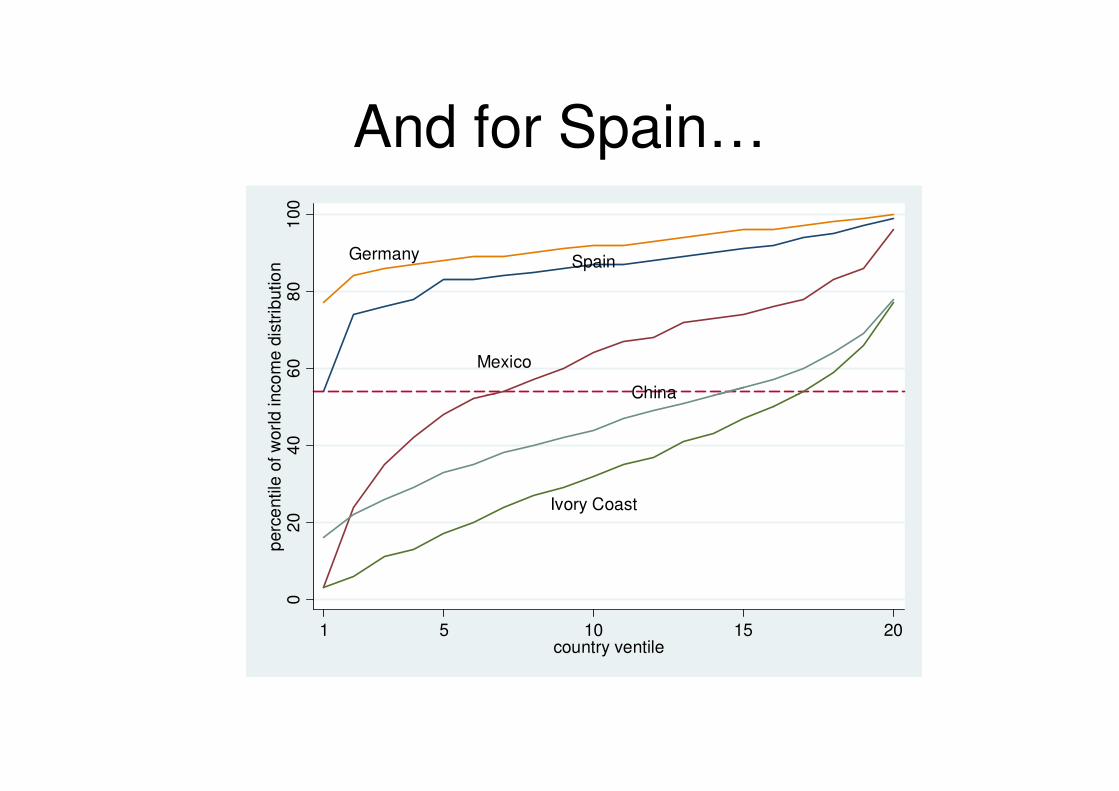
And for Spain…
Germany
China
Mexico
Spain
60
80
100
perc
entile
of w
orl
d inco
me d
istr
ibutio
n
China
Ivory Coast
02
04
0p
erc
entile
of w
orl
d inco
me d
istr
ibutio
n
1 5 10 15 20country ventile
• Almost non-overlapping distributions of India and the US: less than 5% of people in India richer than the poorest ventile in the US
• But this is not true for Brazil, China and Russia: about half of the population of Brazil better off than the very poorest ventile in the US; for Russia, it is ¾, for China 1/5.
• Brazil within itself spans the entire global distribution• Brazil within itself spans the entire global distribution
• China dominates India at any point of income distribution
• Russians better-off than Brazilians except at the top (note convexity at the top in Brazil)
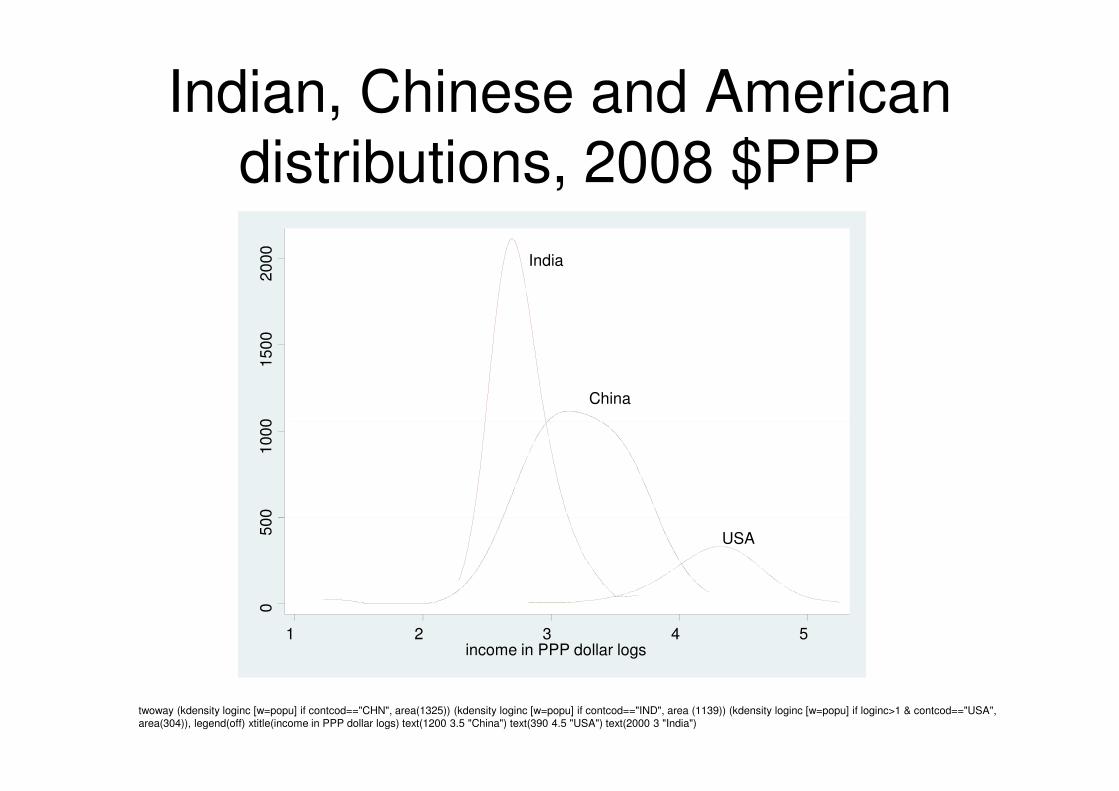
Indian, Chinese and American distributions, 2008 $PPP
China
India1
50
02
00
0
twoway (kdensity loginc [w=popu] if contcod=="CHN", area(1325)) (kdensity loginc [w=popu] if contcod=="IND", area (1139)) (kdensity loginc [w=popu] if loginc>1 & contcod=="USA", area(304)), legend(off) xtitle(income in PPP dollar logs) text(1200 3.5 "China") text(390 4.5 "USA") text(2000 3 "India")
China
USA
05
00
10
00
1 2 3 4 5income in PPP dollar logs
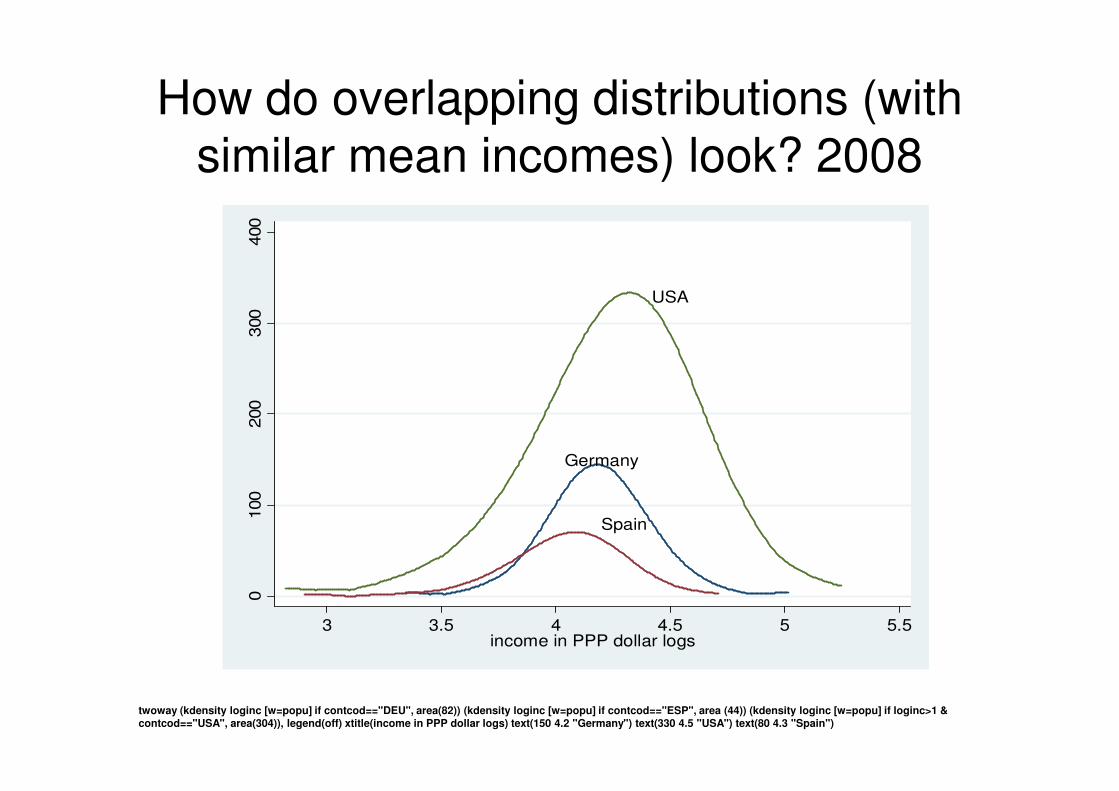
How do overlapping distributions (with similar mean incomes) look? 2008
USA
300
400
twoway (kdensity loginc [w=popu] if contcod=="DEU", area(82)) (kdensity loginc [w=popu] if contcod=="ESP", area (44)) (kdensity loginc [w=popu] if loginc>1 & contcod=="USA", area(304)), legend(off) xtitle(income in PPP dollar logs) text(150 4.2 "Germany") text(330 4.5 "USA") text(80 4.3 "Spain")
Germany
Spain
0100
200
3 3.5 4 4.5 5 5.5income in PPP dollar logs
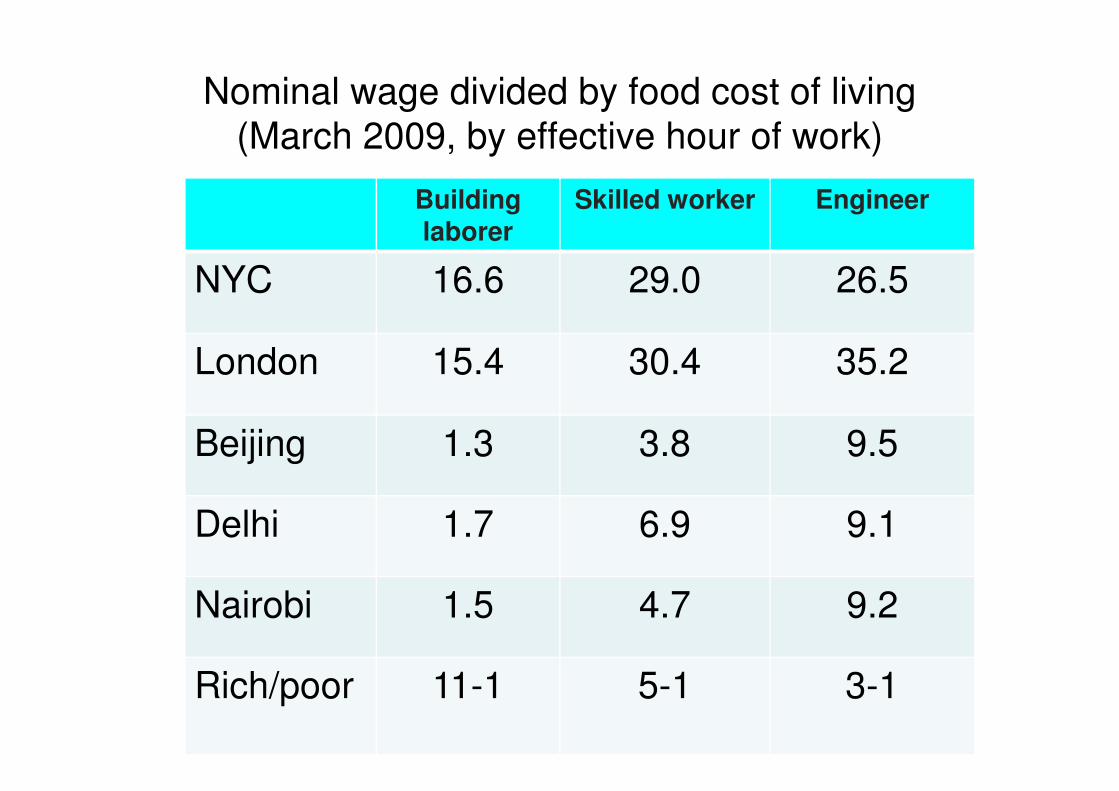
Nominal wage divided by food cost of living(March 2009, by effective hour of work)
Building laborer
Skilled worker Engineer
NYC 16.6 29.0 26.5
London 15.4 30.4 35.2
Beijing 1.3 3.8 9.5
Delhi 1.7 6.9 9.1
Nairobi 1.5 4.7 9.2
Rich/poor 11-1 5-1 3-1
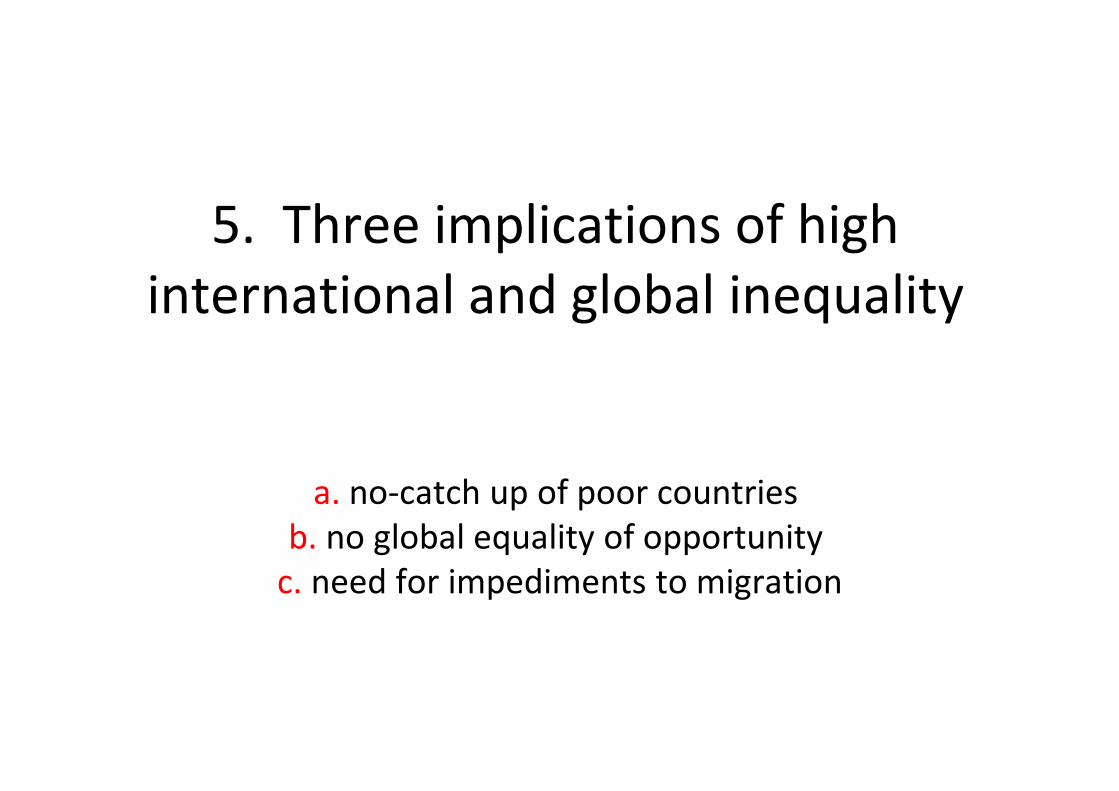
5. Three implications of high
international and global inequality
a. no-catch up of poor countries
b. no global equality of opportunity
c. need for impediments to migration
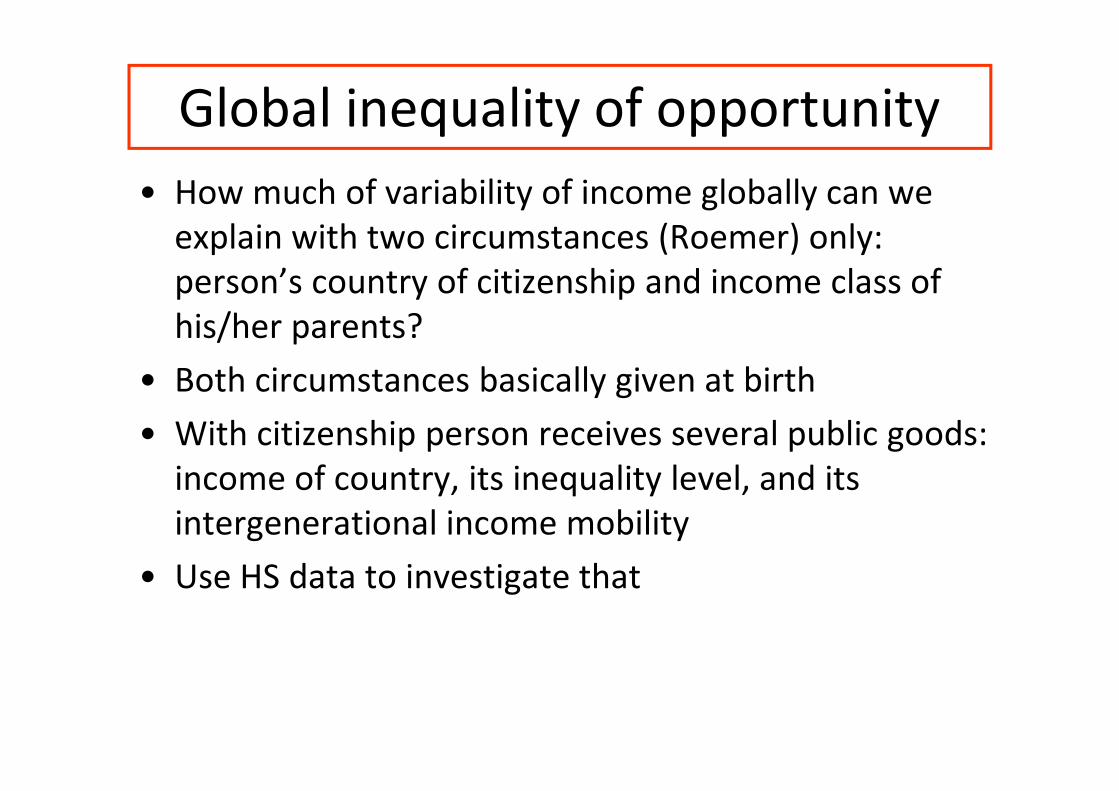
Global inequality of opportunity
• How much of variability of income globally can we
explain with two circumstances (Roemer) only:
person’s country of citizenship and income class of
his/her parents?
• Both circumstances basically given at birth• Both circumstances basically given at birth
• With citizenship person receives several public goods:
income of country, its inequality level, and its
intergenerational income mobility
• Use HS data to investigate that
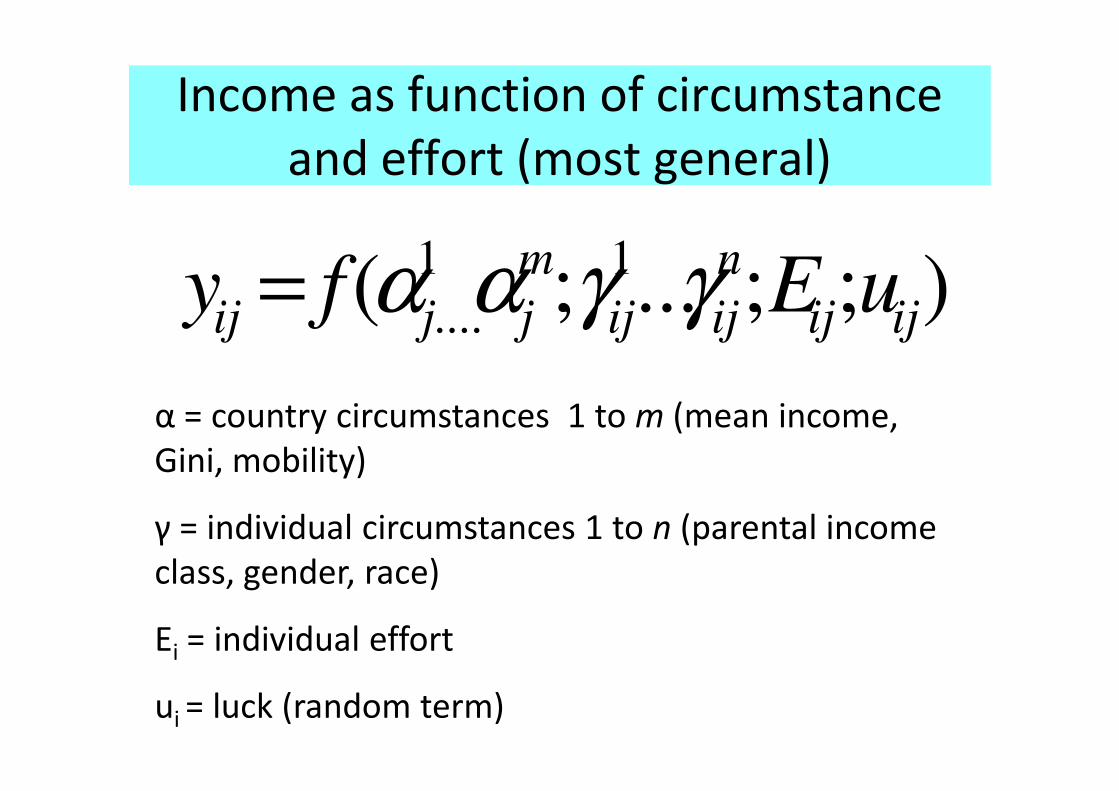
Income as function of circumstance
and effort (most general)
);;...;( 11
.... ijij
n
ijij
m
jjij uEfy γγαα=
α = country circumstances 1 to m (mean income, α = country circumstances 1 to m (mean income,
Gini, mobility)
γ = individual circumstances 1 to n (parental income
class, gender, race)
Ei = individual effort
ui = luck (random term)
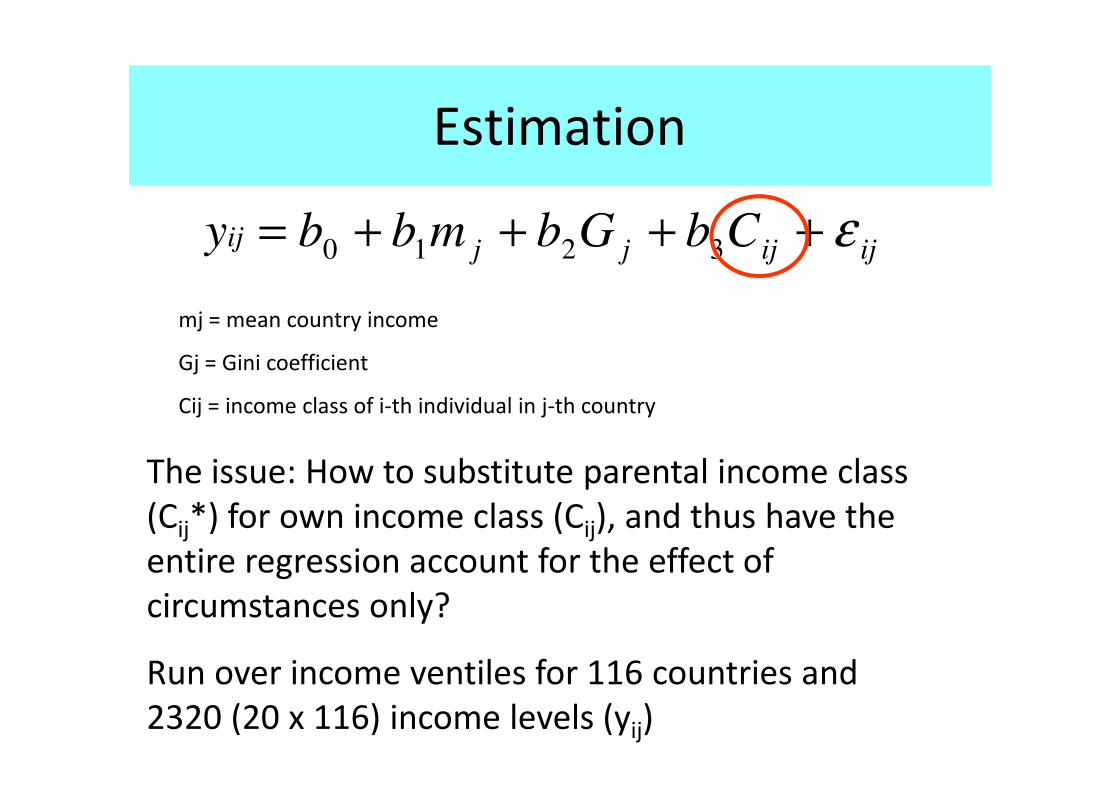
Estimation
ijijjjij CbGbmbby ε++++= 3210
mj = mean country income
Gj = Gini coefficient
Cij = income class of i-th individual in j-th countryCij = income class of i-th individual in j-th country
The issue: How to substitute parental income class
(Cij*) for own income class (Cij), and thus have the
entire regression account for the effect of
circumstances only?
Run over income ventiles for 116 countries and
2320 (20 x 116) income levels (yij)
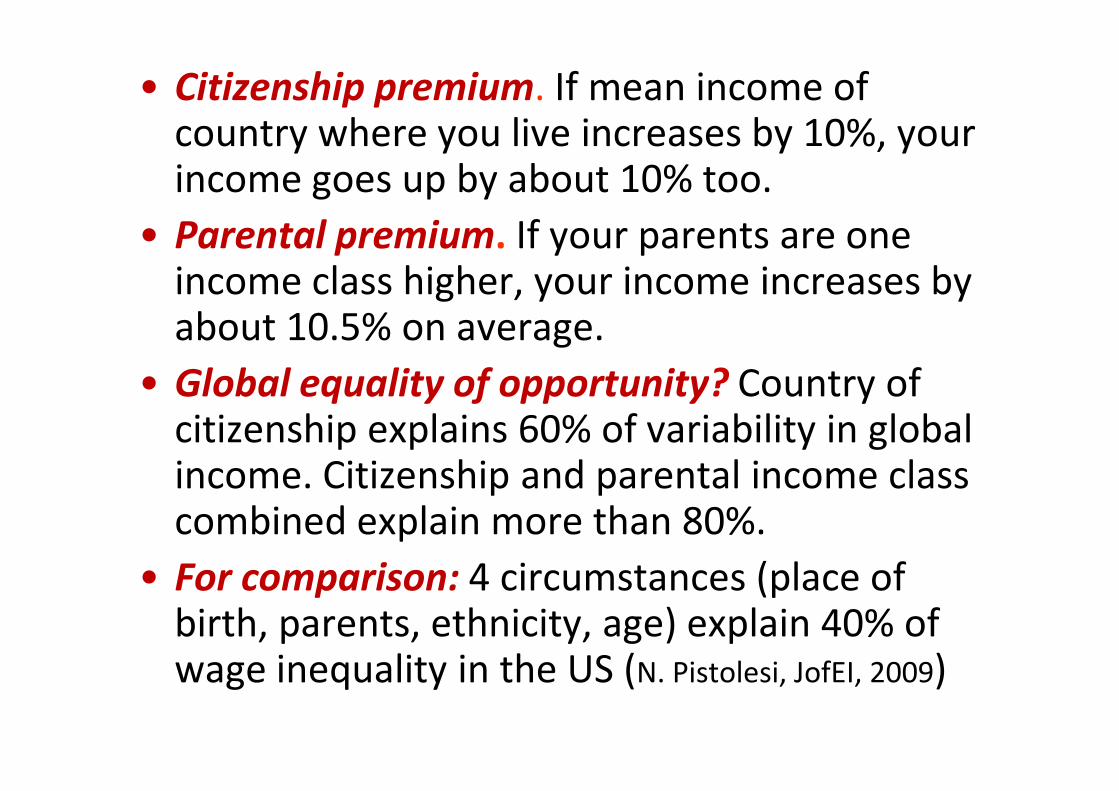
• Citizenship premium. If mean income of country where you live increases by 10%, your income goes up by about 10% too.
• Parental premium. If your parents are one income class higher, your income increases by about 10.5% on average.
• Global equality of opportunity? Country of • Global equality of opportunity? Country of citizenship explains 60% of variability in global income. Citizenship and parental income class combined explain more than 80%.
• For comparison: 4 circumstances (place of birth, parents, ethnicity, age) explain 40% of wage inequality in the US (N. Pistolesi, JofEI, 2009)
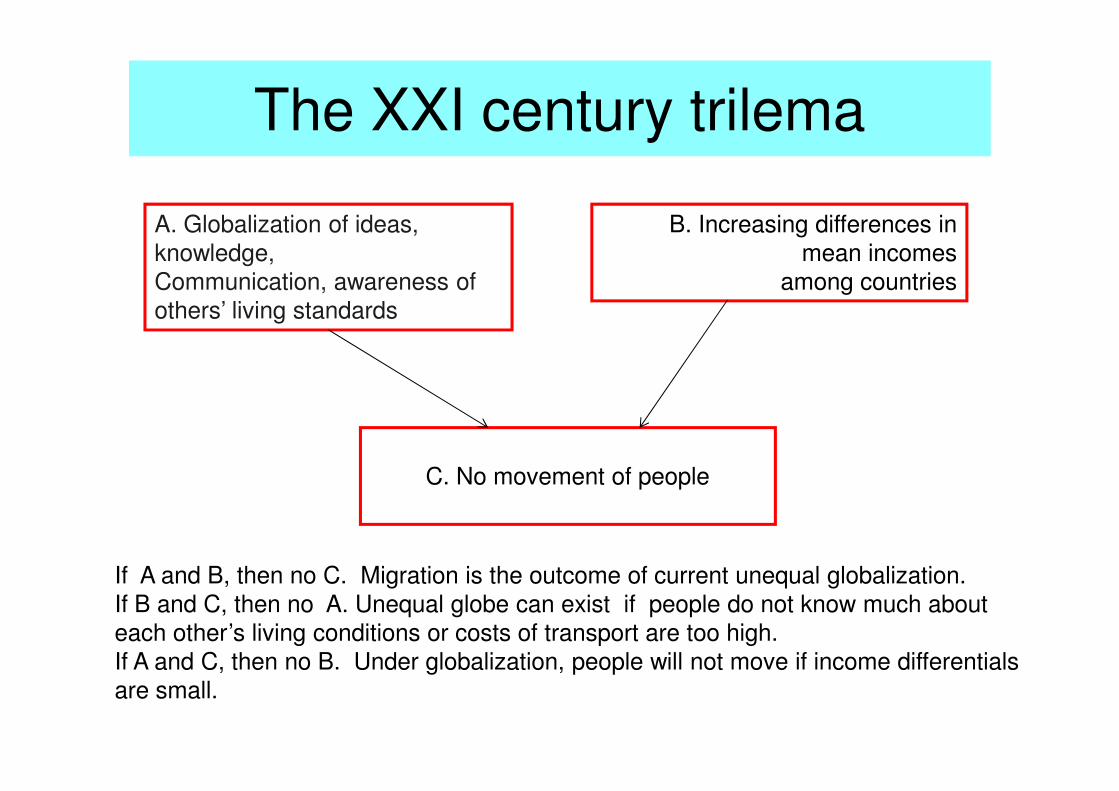
The XXI century trilema
A. Globalization of ideas,knowledge,Communication, awareness of others’ living standards
B. Increasing differences in mean incomes
among countries
C. No movement of people
If A and B, then no C. Migration is the outcome of current unequal globalization. If B and C, then no A. Unequal globe can exist if people do not know much about each other’s living conditions or costs of transport are too high.If A and C, then no B. Under globalization, people will not move if income differentials are small.
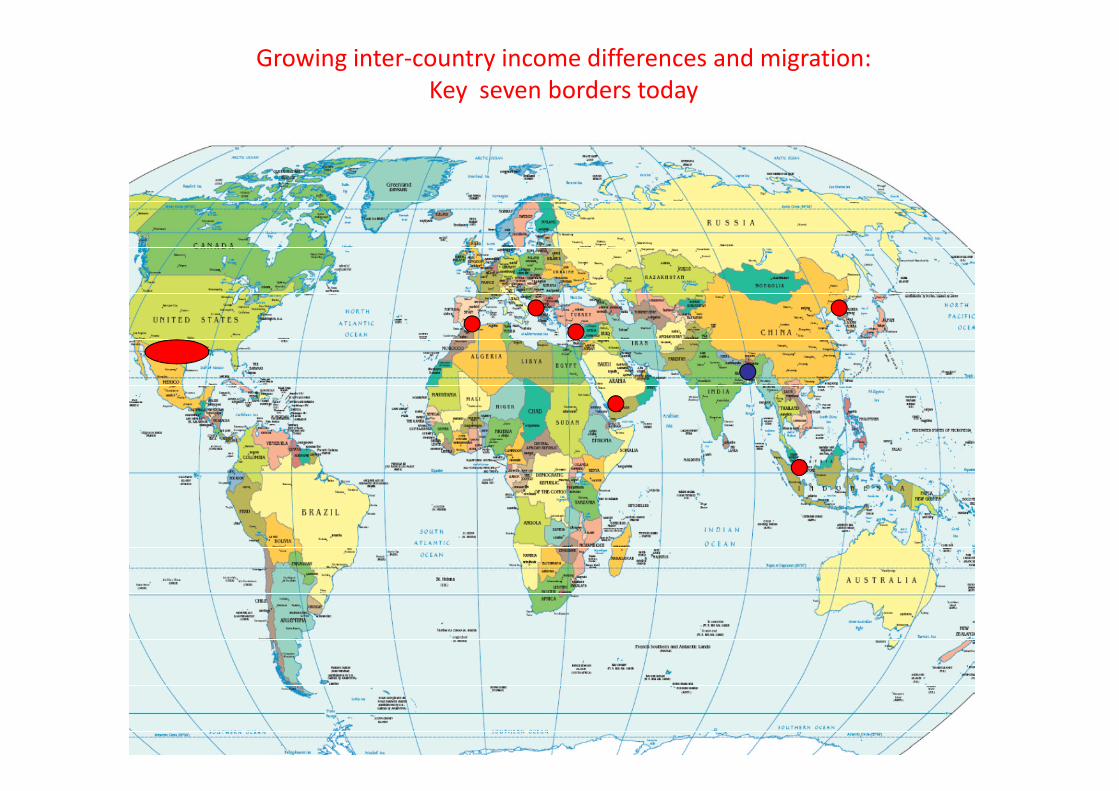
Growing inter-country income differences and migration:
Key seven borders today
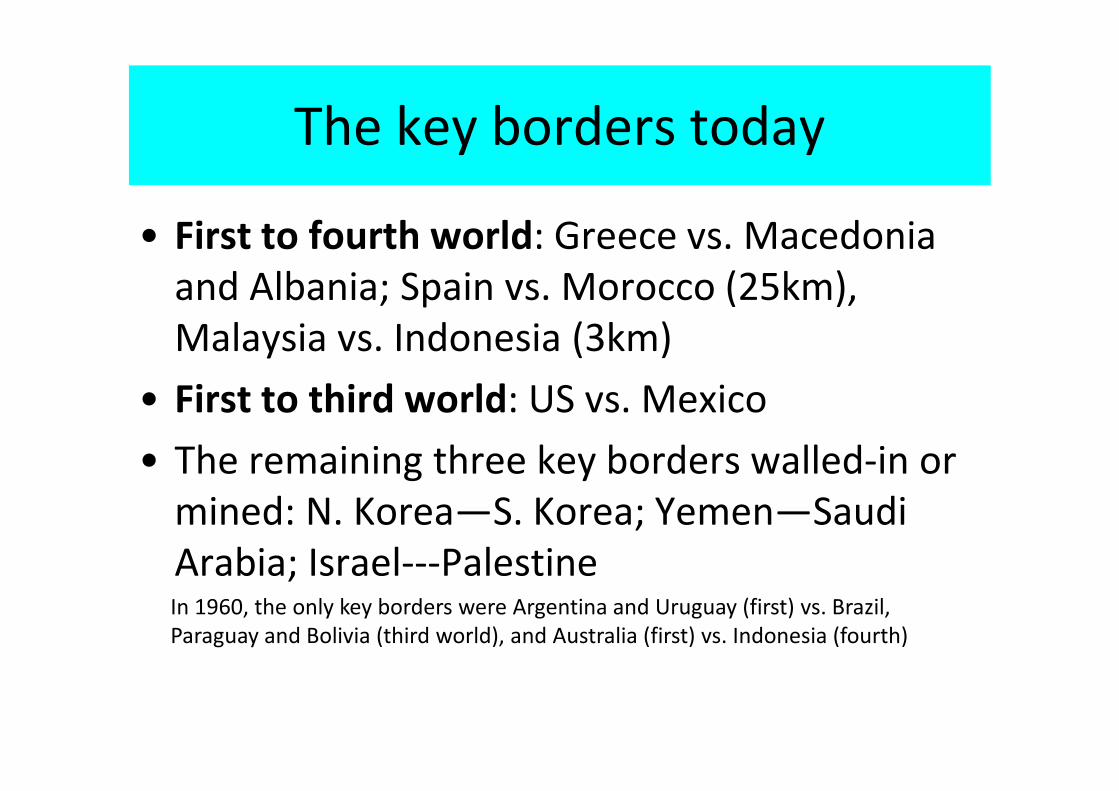
The key borders today
• First to fourth world: Greece vs. Macedonia
and Albania; Spain vs. Morocco (25km),
Malaysia vs. Indonesia (3km)
• First to third world: US vs. Mexico• First to third world: US vs. Mexico
• The remaining three key borders walled-in or
mined: N. Korea—S. Korea; Yemen—Saudi
Arabia; Israel---PalestineIn 1960, the only key borders were Argentina and Uruguay (first) vs. Brazil,
Paraguay and Bolivia (third world), and Australia (first) vs. Indonesia (fourth)
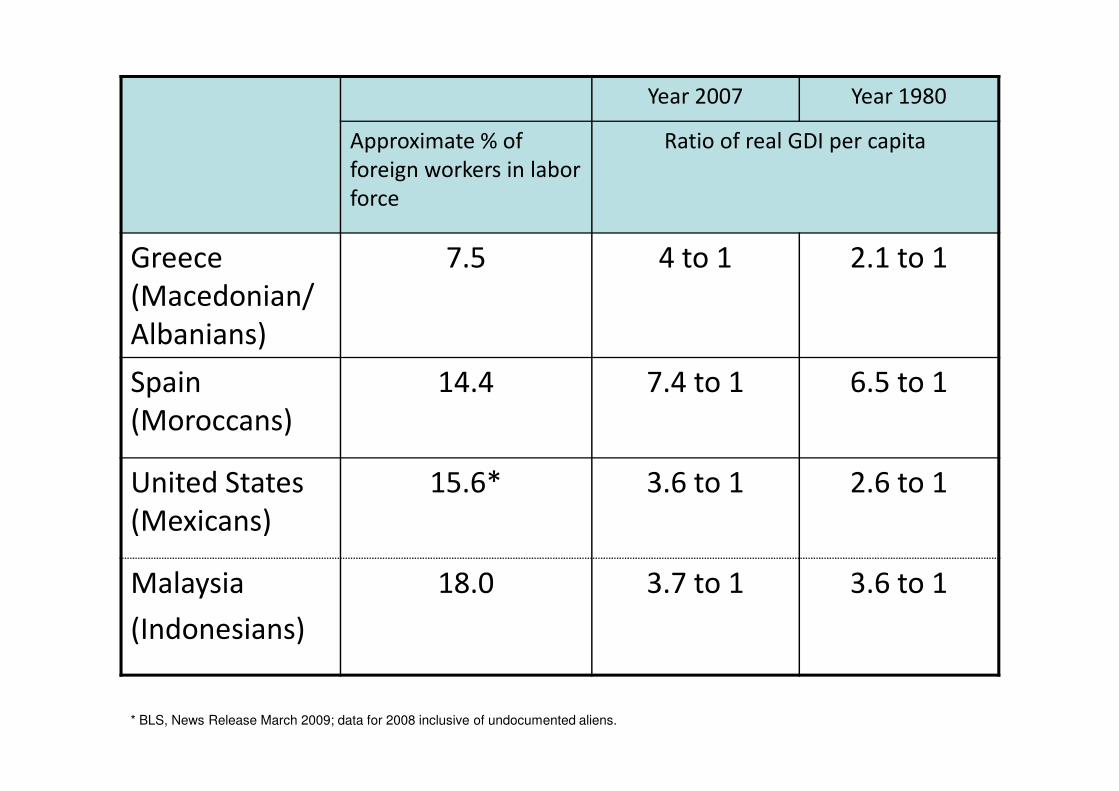
Year 2007 Year 1980
Approximate % of
foreign workers in labor
force
Ratio of real GDI per capita
Greece
(Macedonian/
Albanians)
7.5 4 to 1 2.1 to 1
Spain 14.4 7.4 to 1 6.5 to 1Spain
(Moroccans)
14.4 7.4 to 1 6.5 to 1
United States
(Mexicans)
15.6* 3.6 to 1 2.6 to 1
Malaysia
(Indonesians)
18.0 3.7 to 1 3.6 to 1
* BLS, News Release March 2009; data for 2008 inclusive of undocumented aliens.
6. Les jeux sont faits
when you are born?when you are born?
Is citizenship a rent?
• If most of our income is determined by
citizenship, then there is little equality of
opportunity globally and citizenship is a rent
(unrelated to individual desert, effort)
• How much is citizenship worth? Black-market
UK passports sold for about £5,000; legally
purchase citizenship for about $1m in
investment.
• See also A. Shachar, The Birthright Lottery
The logic of the argument
• Global inequality between individuals in the world is very high (Gini=70)
• Most of that inequality is “explained” by differences in countries’ per capita incomes
• Citizenship “explains” some 60% of variability in personal incomes globally (assessed across personal incomes globally (assessed across national ventiles)
• This was not the case in the past (around 1850-70) when within-national inequalities “explained” most of global inequality
• Citizenship as a significant factor explaining one’s income
The logic of the argument (cont.)
• Citizenship is a morally-arbitrary circumstance, independent of individual effort
• It can be regarded as a rent (shared by all members of a community)members of a community)
• Are citizenship rents globally acceptable or not?
• Political philosophy arguments pro (social contract; statist theory) and contra
7. Global inequality and the Rawlsian world Rawlsian world
Rawls from A Theory of Justice
• “Injustice is…simply inequalities that are not to the benefit of all…and in particular to the poor” (p. 54)
• But this is the rule enounced for a single • But this is the rule enounced for a single nation-state? Will it be valid for the world as a whole?
• As we shall see: No, it won’t be!
Rawls on (a) inequality between countries and (b) global inequality
• Neither of them matters
• Concept 1 (divergence) is irrelevant if countries have liberal institutions; it may be relevant for liberal vs. burdened societies
• Irrelevance rooted in two key assumptions: (i) political institutions of liberalism are what matters;
• Irrelevance rooted in two key assumptions: (i) political institutions of liberalism are what matters; (ii) acquisition of wealth immaterial for both individuals and countries
• Global inequality between individuals similarly irrelevant once the background conditions of justice exist in all societies
• But within-national inequalities matter because the difference principle applies within each people (note however that the DP may allow for high inequality)
Rawls on irrelevance of material wealth for a “good society” and global optimum
• It is a mistake to believe that a just and good society must wait upon a high material standard of life. What men want is meaningful work in free associations with others, these associations regulating their relations to one another within a framework of just basic institutions. To achieve this state of things great wealth is not necessary. In fact, beyond some point it is more necessary. In fact, beyond some point it is more likely to be a positive hindrance, a meaningless distraction at best if not a temptation to indulgence and emptiness. ( A Theory of Justice, Chapter V, §44, pp. 257-8).
• For Rawls, global optimum distribution of income is simply a sum of national optimal income distributions (my interpretation)
• In Gini terms:
LppyypG j
n
ij
iij
n
i
n
i
iii +−(+ ∑∑∑>=
)1
1 µπ
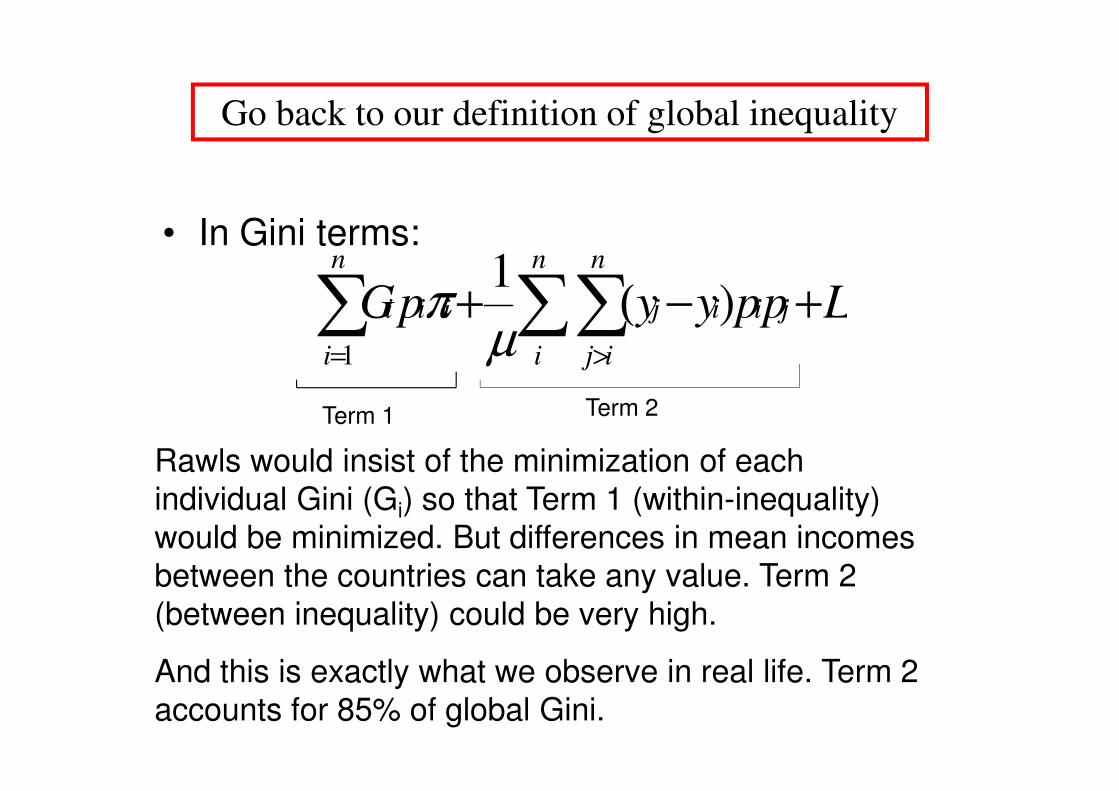
Go back to our definition of global inequality
Term 2
Rawls would insist of the minimization of each individual Gini (Gi) so that Term 1 (within-inequality) would be minimized. But differences in mean incomes between the countries can take any value. Term 2 (between inequality) could be very high.
And this is exactly what we observe in real life. Term 2 accounts for 85% of global Gini.
Term 1 Term 2
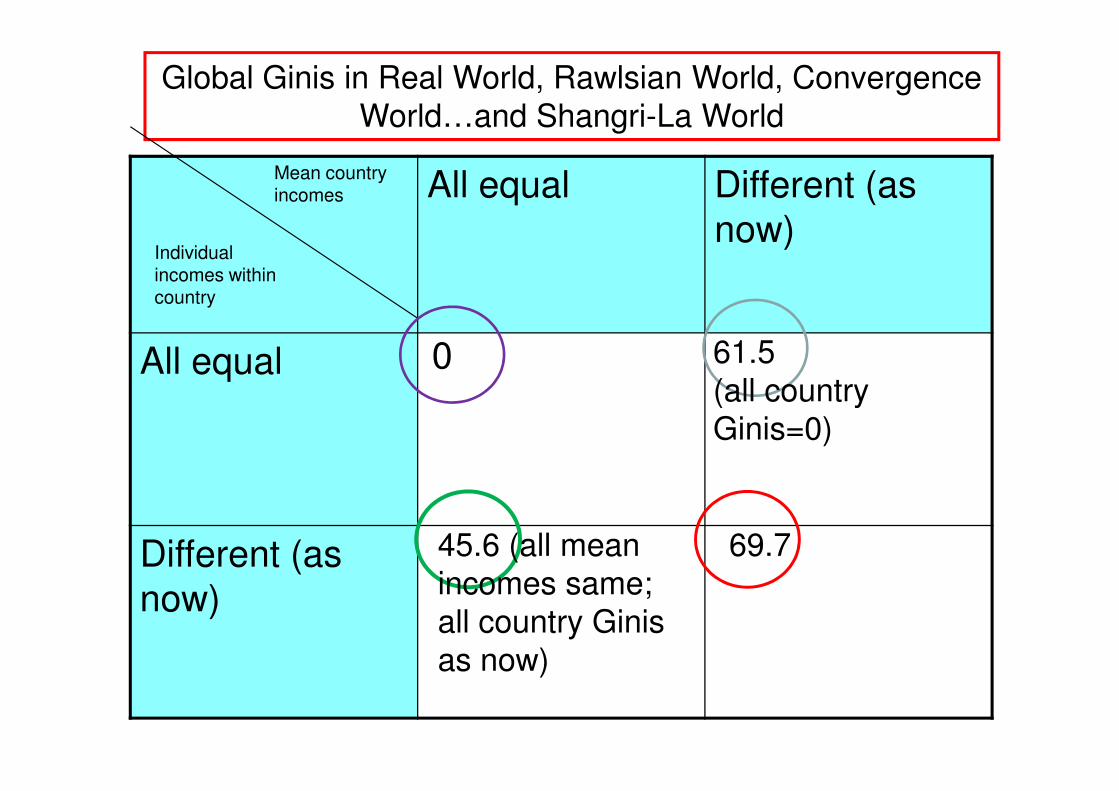
All equal Different (as now)
All equal
Mean country incomes
Individual incomes within country
Global Ginis in Real World, Rawlsian World, Convergence World…and Shangri-La World
61.5 (all country
0
Different (as now)
69.7
(all country Ginis=0)
45.6 (all mean incomes same; all country Ginis as now)
Why pace Rawls global inequality matters?
• Because the world is becoming globalized and global inequality will come to matter more and more despite the absence of global government (analogy with national global government (analogy with national vs. village inequality)
• Because it is associated with migration which is fast becoming a prime political issue
• Because it raises the issue of global equality of opportunities
Conclusion and 21st century policy issues
• To reduce significantly global inequality (and poverty) and citizenship rent there are two ways:
• A slow and sustainable way: higher growth rate of poorer countries
• A fast and possibly politically tumultous way: increase migrationincrease migration
• Either poor countries will have to become richer or poor people will move to rich countries.
• Should migrants be taxed additionally to pay native population’s losers and those remaining in their countries of origin?
8. Does Global Inequality Matter:
Statists, Consequntialists and
CosmopolitansCosmopolitans
EXTRA
Rawls’ The Law of Peoples
• Types of peoples (nations)
– Liberal }
– Decent (consultative hierarchy) }
– “Burdened”
Well-
ordered– “Burdened”
– Outlaw states
– Benevolent absolutism
Transfers only from well-ordered to “burdened” peoples
• Transfers (1) limited to type of society (‘burdened’) and (2) limited in time (until ‘burdened’ becomes a ‘decent society’)
• “Peoples have a duty to assist other peoples living under unfavorable conditions that prevent their having a just or decent political and social regime” (LoP, p. 37)
• Explicit rejection of a global difference principle • Explicit rejection of a global difference principle (among other reasons because it is unlimited in time)
• No discussion of responsibility toward outlaw or hierarchical societies
• Limits to immigration (duty of hospitality only)
Why no global difference principle
• It would lead to open-ended transfers
• Real income per capita (wealth) is not important once societies become ‘decent’ (general proposition re. unimportance of pursuit of wealth)
• Once a people is ‘decent’ there is no point in • Once a people is ‘decent’ there is no point in comparing wealth/income of the two peoples: the differences are the outcome of voluntary societal decisions on savings vs. consumption and leisure vs. work
Cosmopolitan position (Pogge, Singer)
• No major difference between Rawlsian original position within a single nation-state (people) and the world
• The same principles should apply globally: an increase in inequality is acceptable only if it leads to increase in inequality is acceptable only if it leads to a higher absolute income of the poorest
• “Monism”: all ethically meaningful relationships are between individuals not mediated by the state (people)
• Pogge: we are required not to harm others (and some decisions by IO may have harmful consequences)
Rejection of cosmopolitanism: political
theory of justice (Nagel)• Strong statism: Redistribution (and responsibility for
poverty) possible only if there is shared government
• For concerns of justice to kick in, you need “associative relation” (shared sovereignty, common endeavor)endeavor)
• We redistribute because we have a contractarian relationship with people with whom we share the same institutions
• Could be also based on our expectation to be in need of similar transfers in the future; or affinity that we feel for co-citizens; shared culture or historical memories (J.S. Mill)
Statism (cont.)
• Only under world government can we have a global
difference principle
• Accepts humanitarian duties only (matter of morality,
not of justice)
• Existence of IO does not introduce new obligations
because these are govt-to-govt relationsbecause these are govt-to-govt relations
• Pluralism (rather than monism) in our relations with
others: different normative principles depending on
the position in which we stand with respect to them;
but pluralism may introduce a sliding scale & an
intermediate position =>
Intermediate position
• We are required to give more than implied by humanitarian considerations alone but less than implied by the global difference principle
• Sliding scale of responsibility
• Critique of statism: why are newer forms of • Critique of statism: why are newer forms of international governance not norm-generative and only state is?
• There are forms of connection that do not involve the state & trigger norms beyond mere humanitarianism
• Direct rule-making relationship (WTO, IMF) between the global bodies and citizens of different states
Intermediate position (cont.)
• Aristotle: within each community there is philia
(affection; goodwill) but the philia spreads (diminishes) as in concentric circles as we move further from a very narrow community
• To each philia corresponds adequate reciprocity (that is, redistribution)(that is, redistribution)
• Thus the sliding scale of philia and reciprocity
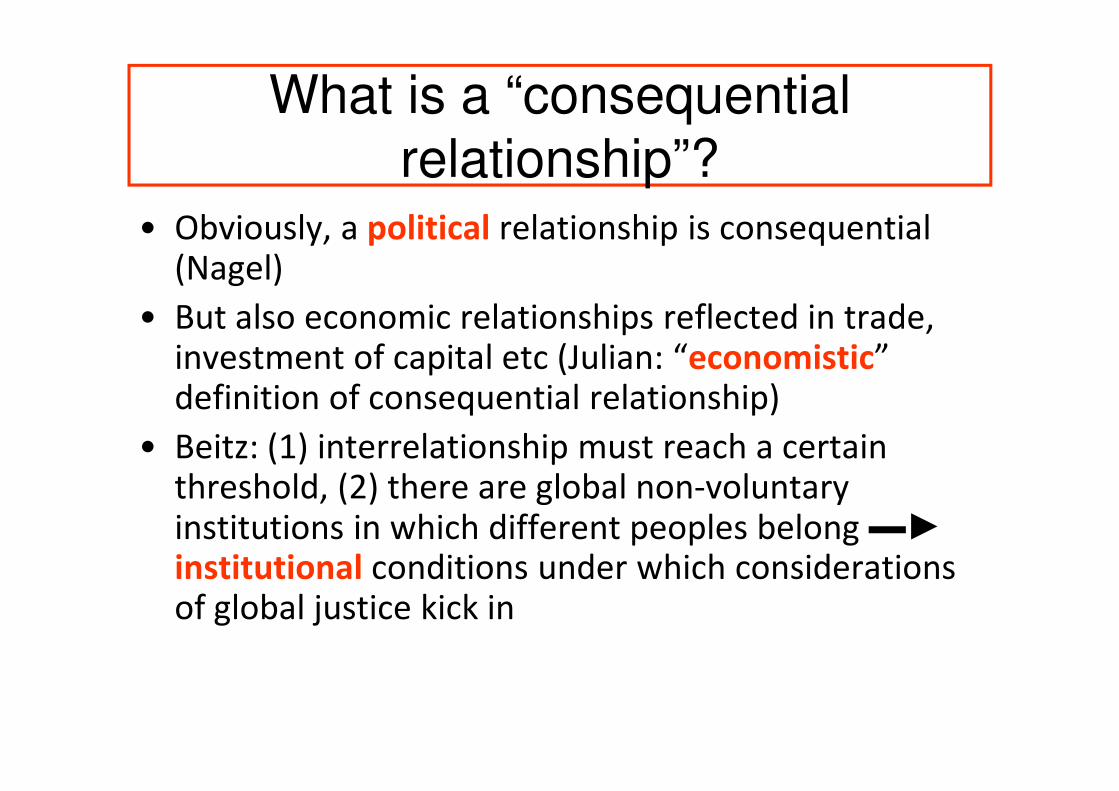
What is a “consequential relationship”?
• Obviously, a political relationship is consequential (Nagel)
• But also economic relationships reflected in trade, investment of capital etc (Julian: “economistic” definition of consequential relationship)definition of consequential relationship)
• Beitz: (1) interrelationship must reach a certain threshold, (2) there are global non-voluntary institutions in which different peoples belong ▬►institutional conditions under which considerations of global justice kick in
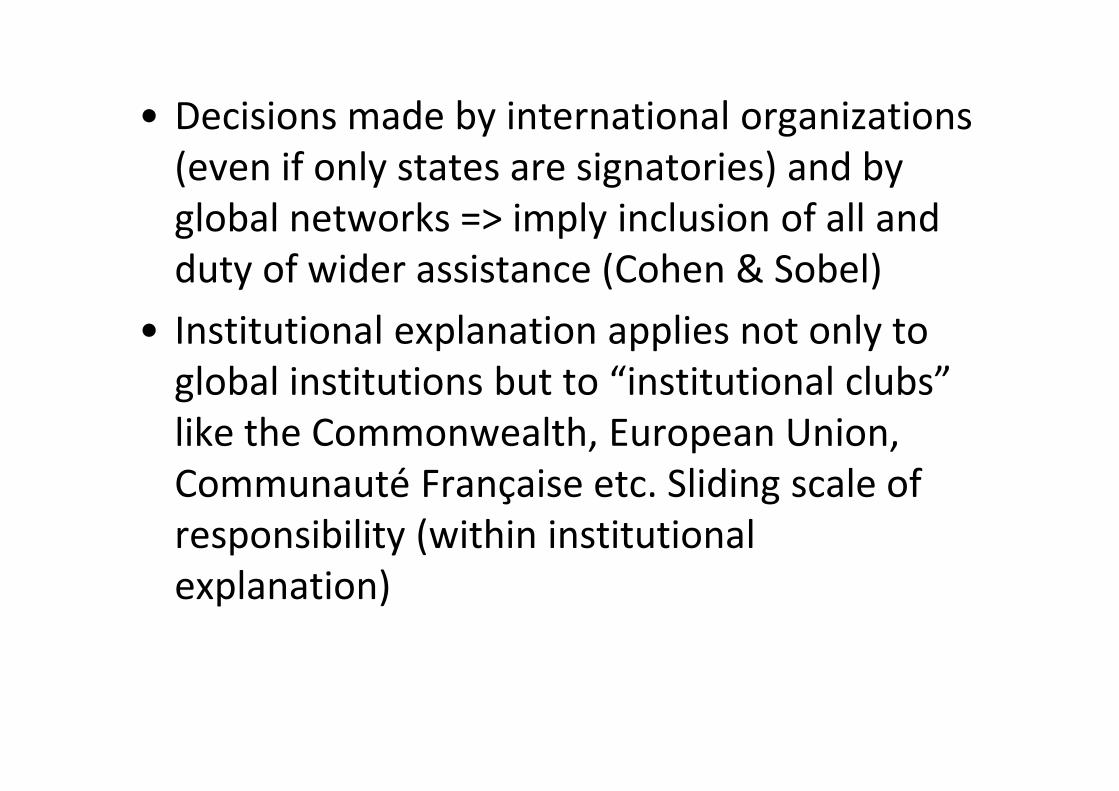
• Decisions made by international organizations
(even if only states are signatories) and by
global networks => imply inclusion of all and
duty of wider assistance (Cohen & Sobel)
• Institutional explanation applies not only to
global institutions but to “institutional clubs” global institutions but to “institutional clubs”
like the Commonwealth, European Union,
Communauté Française etc. Sliding scale of
responsibility (within institutional
explanation)
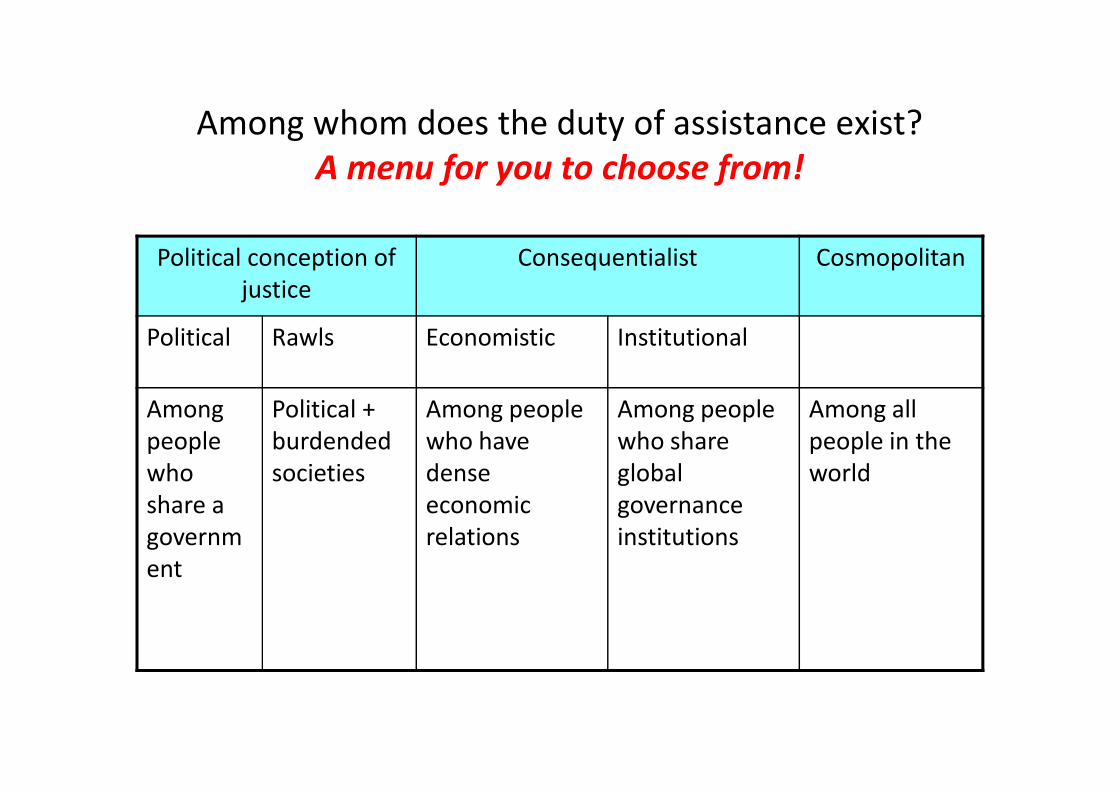
Among whom does the duty of assistance exist?
A menu for you to choose from!
Political conception of
justice
Consequentialist Cosmopolitan
Political Rawls Economistic Institutional
Among Political + Among people Among people Among all Among
people
who
share a
governm
ent
Political +
burdended
societies
Among people
who have
dense
economic
relations
Among people
who share
global
governance
institutions
Among all
people in the
world
• “Worlds Apart: Measuring International and
Global Inequality”, Princeton UP, 2005.
• “The haves and the have-nots: A short and
idiosyncratic history of inequality”, Basic idiosyncratic history of inequality”, Basic
books, 2010
• Email: [email protected]
• Website: http://econ.worldbank.org/projects/inequality
Extras
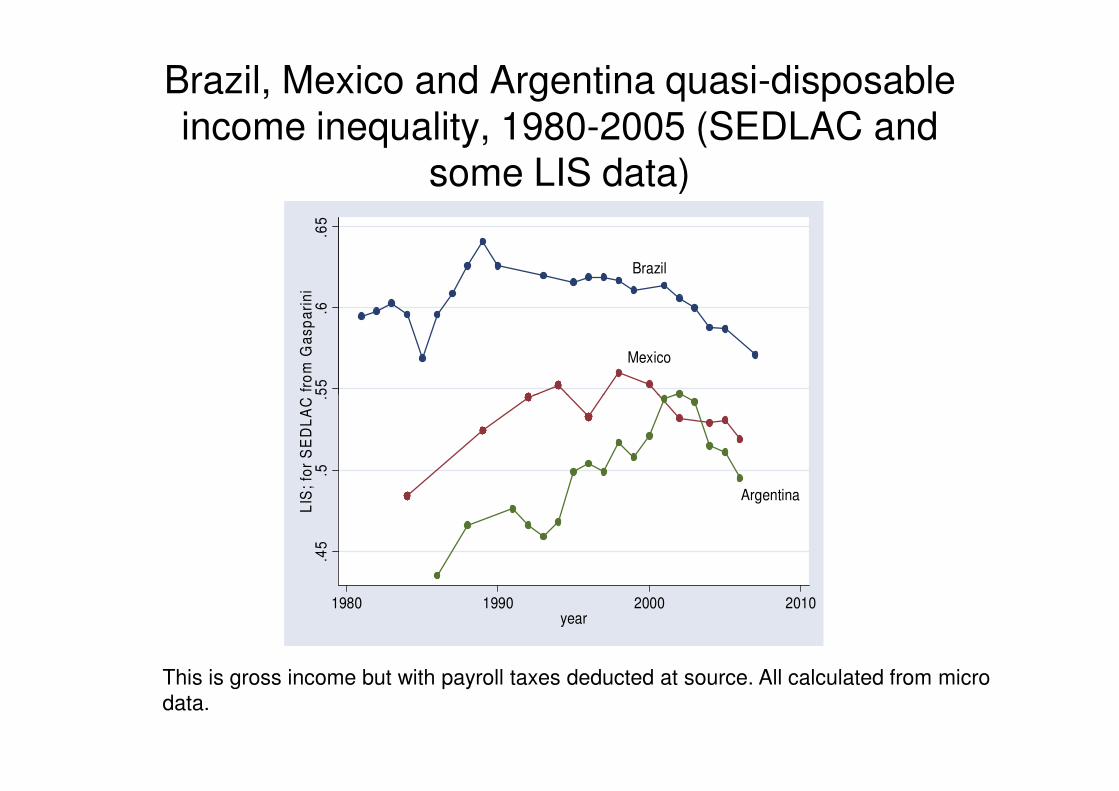
Brazil, Mexico and Argentina quasi-disposable income inequality, 1980-2005 (SEDLAC and
some LIS data)
Brazil
Mexico
.55
.6.6
5L
IS;
for
SE
DL
AC
fro
m G
as
pa
rin
i
This is gross income but with payroll taxes deducted at source. All calculated from micro data.
Argentina
.45
.5.5
5L
IS;
for
SE
DL
AC
fro
m G
as
pa
rin
i
1980 1990 2000 2010year
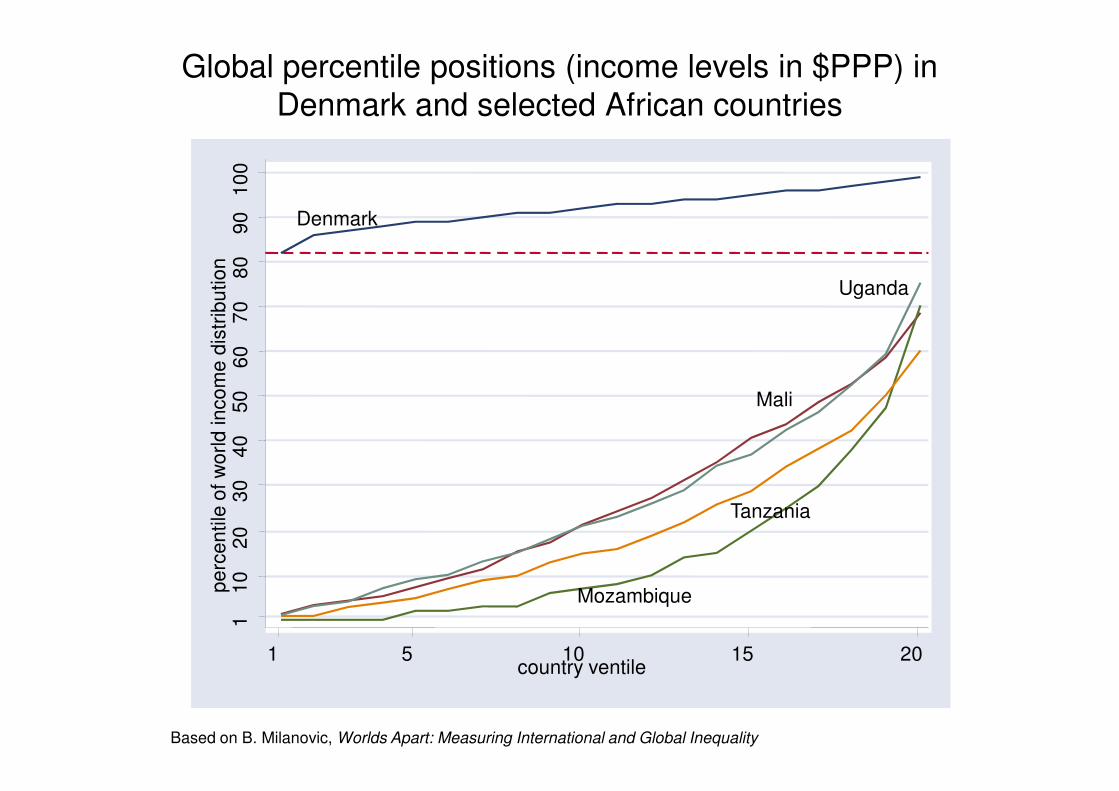
Global percentile positions (income levels in $PPP) in Denmark and selected African countries
Denmark
Mali
Uganda
50
60
70
80
90
10
0p
erc
en
tile
of w
orl
d in
co
me
dis
trib
utio
n
Based on B. Milanovic, Worlds Apart: Measuring International and Global Inequality
Mozambique
Mali
Tanzania
11
02
03
04
05
0p
erc
en
tile
of w
orl
d in
co
me
dis
trib
utio
n
1 5 10 15 20country ventile
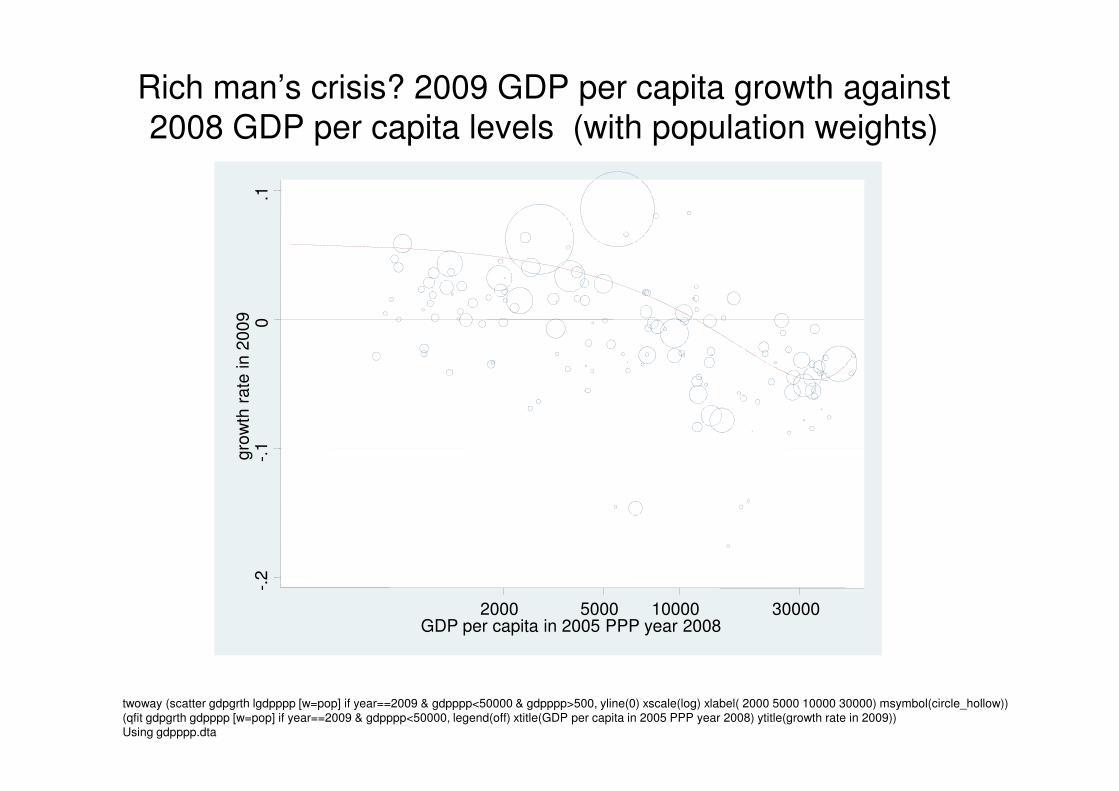
Rich man’s crisis? 2009 GDP per capita growth against 2008 GDP per capita levels (with population weights)
0.1
gro
wth
rate
in 2
009
twoway (scatter gdpgrth lgdpppp [w=pop] if year==2009 & gdpppp<50000 & gdpppp>500, yline(0) xscale(log) xlabel( 2000 5000 10000 30000) msymbol(circle_hollow)) (qfit gdpgrth gdpppp [w=pop] if year==2009 & gdpppp<50000, legend(off) xtitle(GDP per capita in 2005 PPP year 2008) ytitle(growth rate in 2009))Using gdpppp.dta
-.2
-.1
gro
wth
rate
in 2
009
2000 5000 10000 30000GDP per capita in 2005 PPP year 2008
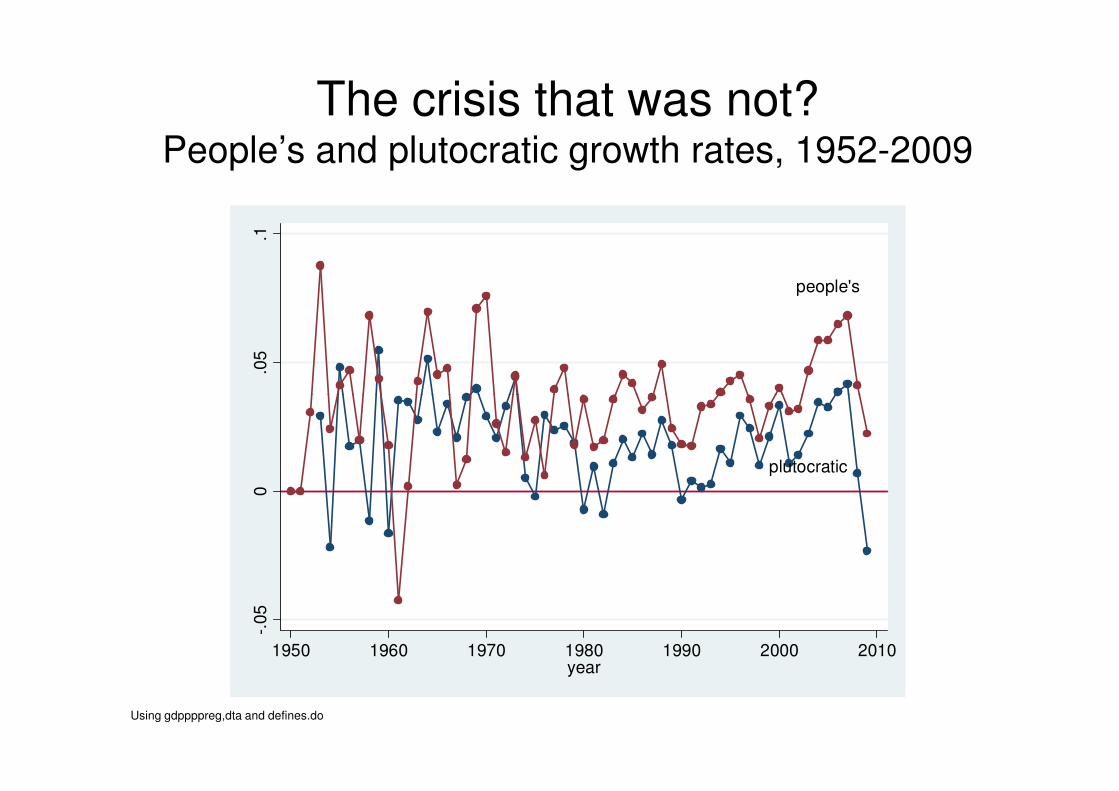
The crisis that was not?People’s and plutocratic growth rates, 1952-2009
people's
.05
.1
Using gdppppreg,dta and defines.do
plutocratic
-.05
0
1950 1960 1970 1980 1990 2000 2010year